Ziebach County, SD Map & Demographics
Ziebach County Map
Ziebach County Overview
$23,657
PER CAPITA INCOME
$47,500
AVG FAMILY INCOME
$46,023
AVG HOUSEHOLD INCOME
16.0%
WAGE / INCOME GAP [ % ]
84.0¢/ $1
WAGE / INCOME GAP [ $ ]
$13,688
FAMILY INCOME DEFICIT
0.55
INEQUALITY / GINI INDEX
2,455
TOTAL POPULATION
1,227
MALE POPULATION
1,228
FEMALE POPULATION
99.92
MALES / 100 FEMALES
100.08
FEMALES / 100 MALES
34.3
MEDIAN AGE
4.0
AVG FAMILY SIZE
3.6
AVG HOUSEHOLD SIZE
1,219
LABOR FORCE [ PEOPLE ]
65.2%
PERCENT IN LABOR FORCE
32.0%
UNEMPLOYMENT RATE
Ziebach County Area Codes
Income in Ziebach County
Income Overview in Ziebach County
Per Capita Income in Ziebach County is $23,657, while median incomes of families and households are $47,500 and $46,023 respectively.
| Characteristic | Number | Measure |
| Per Capita Income | 2,455 | $23,657 |
| Median Family Income | 534 | $47,500 |
| Mean Family Income | 534 | $87,525 |
| Median Household Income | 683 | $46,023 |
| Mean Household Income | 683 | $78,898 |
| Income Deficit | 534 | $13,688 |
| Wage / Income Gap (%) | 2,455 | 16.02% |
| Wage / Income Gap ($) | 2,455 | 83.98¢ per $1 |
| Gini / Inequality Index | 2,455 | 0.55 |
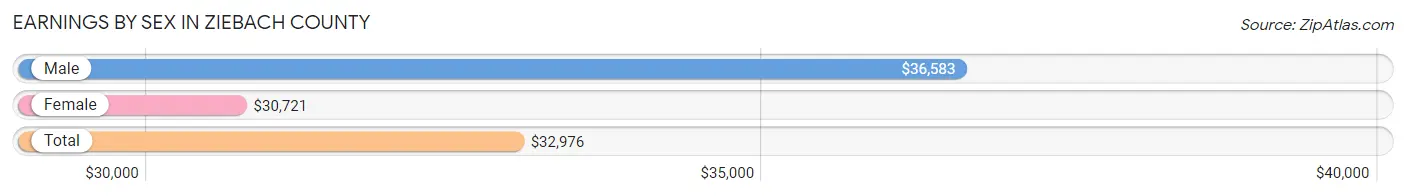
Earnings by Sex in Ziebach County
Average Earnings in Ziebach County are $32,976, $36,583 for men and $30,721 for women, a difference of 16.0%.
| Sex | Number | Average Earnings |
| Male | 495 (48.9%) | $36,583 |
| Female | 517 (51.1%) | $30,721 |
| Total | 1,012 (100.0%) | $32,976 |
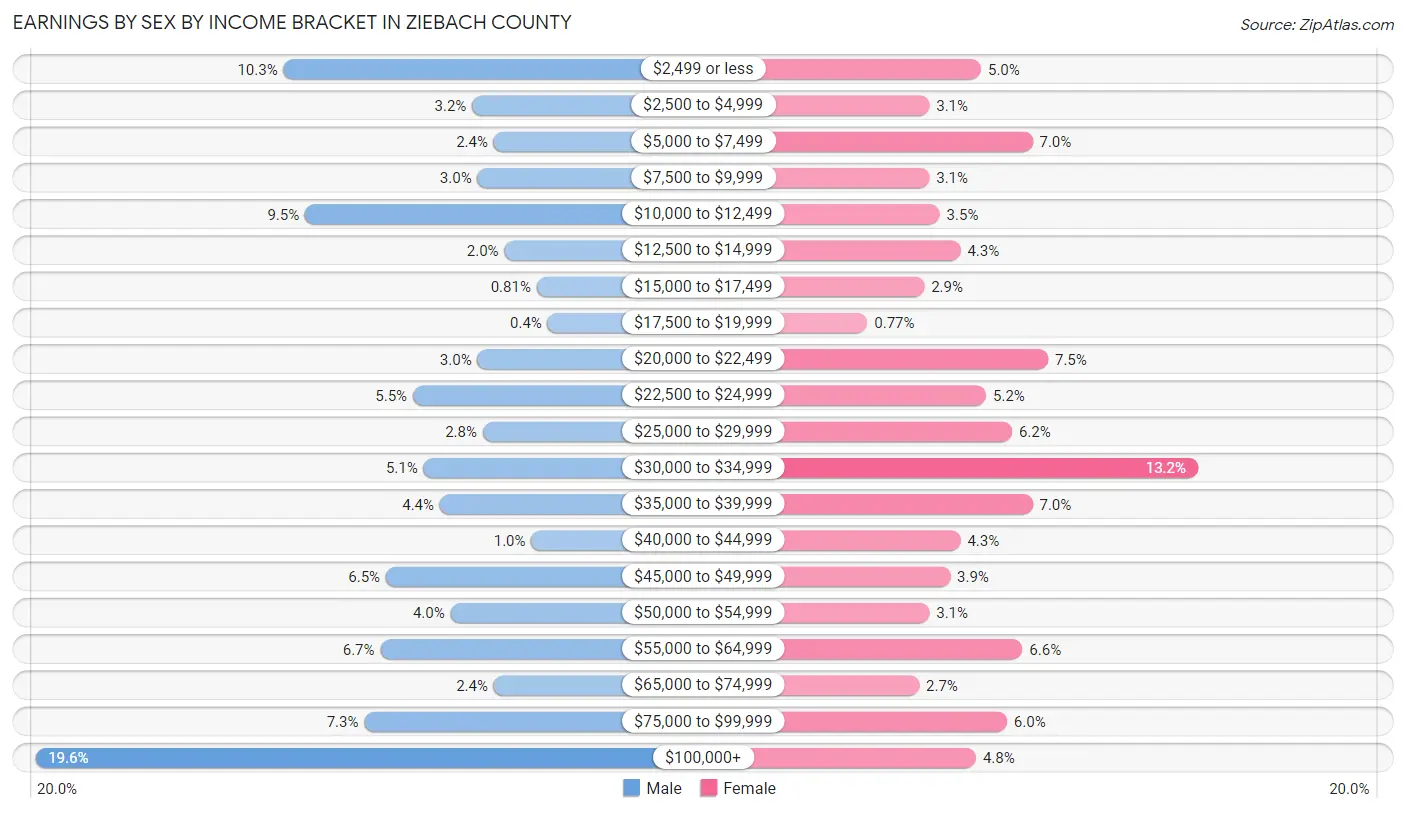
Earnings by Sex by Income Bracket in Ziebach County
The most common earnings brackets in Ziebach County are $100,000+ for men (97 | 19.6%) and $30,000 to $34,999 for women (68 | 13.2%).
| Income | Male | Female |
| $2,499 or less | 51 (10.3%) | 26 (5.0%) |
| $2,500 to $4,999 | 16 (3.2%) | 16 (3.1%) |
| $5,000 to $7,499 | 12 (2.4%) | 36 (7.0%) |
| $7,500 to $9,999 | 15 (3.0%) | 16 (3.1%) |
| $10,000 to $12,499 | 47 (9.5%) | 18 (3.5%) |
| $12,500 to $14,999 | 10 (2.0%) | 22 (4.3%) |
| $15,000 to $17,499 | 4 (0.8%) | 15 (2.9%) |
| $17,500 to $19,999 | 2 (0.4%) | 4 (0.8%) |
| $20,000 to $22,499 | 15 (3.0%) | 39 (7.5%) |
| $22,500 to $24,999 | 27 (5.4%) | 27 (5.2%) |
| $25,000 to $29,999 | 14 (2.8%) | 32 (6.2%) |
| $30,000 to $34,999 | 25 (5.1%) | 68 (13.2%) |
| $35,000 to $39,999 | 22 (4.4%) | 36 (7.0%) |
| $40,000 to $44,999 | 5 (1.0%) | 22 (4.3%) |
| $45,000 to $49,999 | 32 (6.5%) | 20 (3.9%) |
| $50,000 to $54,999 | 20 (4.0%) | 16 (3.1%) |
| $55,000 to $64,999 | 33 (6.7%) | 34 (6.6%) |
| $65,000 to $74,999 | 12 (2.4%) | 14 (2.7%) |
| $75,000 to $99,999 | 36 (7.3%) | 31 (6.0%) |
| $100,000+ | 97 (19.6%) | 25 (4.8%) |
| Total | 495 (100.0%) | 517 (100.0%) |
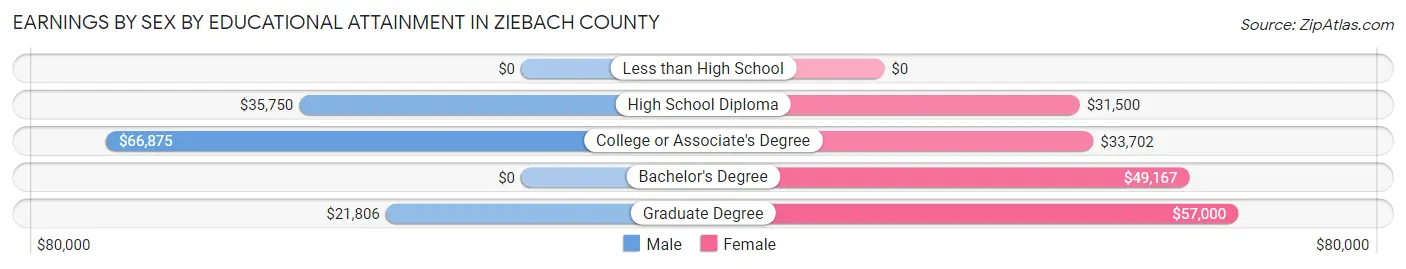
Earnings by Sex by Educational Attainment in Ziebach County
Average earnings in Ziebach County are $46,369 for men and $33,958 for women, a difference of 26.8%. Men with an educational attainment of college or associate's degree enjoy the highest average annual earnings of $66,875, while those with graduate degree education earn the least with $21,806. Women with an educational attainment of graduate degree earn the most with the average annual earnings of $57,000, while those with high school diploma education have the smallest earnings of $31,500.
| Educational Attainment | Male Income | Female Income |
| Less than High School | - | - |
| High School Diploma | $35,750 | $31,500 |
| College or Associate's Degree | $66,875 | $33,702 |
| Bachelor's Degree | - | - |
| Graduate Degree | $21,806 | $57,000 |
| Total | $46,369 | $33,958 |
Family Income in Ziebach County
Family Income Brackets in Ziebach County
According to the Ziebach County family income data, there are 83 families falling into the $200,000+ income range, which is the most common income bracket and makes up 15.5% of all families. Conversely, the $150,000 to $199,999 income bracket is the least frequent group with only 19 families (3.6%) belonging to this category.

| Income Bracket | # Families | % Families |
| Less than $10,000 | 68 | 12.7% |
| $10,000 to $14,999 | 27 | 5.1% |
| $15,000 to $24,999 | 67 | 12.5% |
| $25,000 to $34,999 | 43 | 8.1% |
| $35,000 to $49,999 | 81 | 15.2% |
| $50,000 to $74,999 | 41 | 7.7% |
| $75,000 to $99,999 | 46 | 8.6% |
| $100,000 to $149,999 | 59 | 11.0% |
| $150,000 to $199,999 | 19 | 3.6% |
| $200,000+ | 83 | 15.5% |
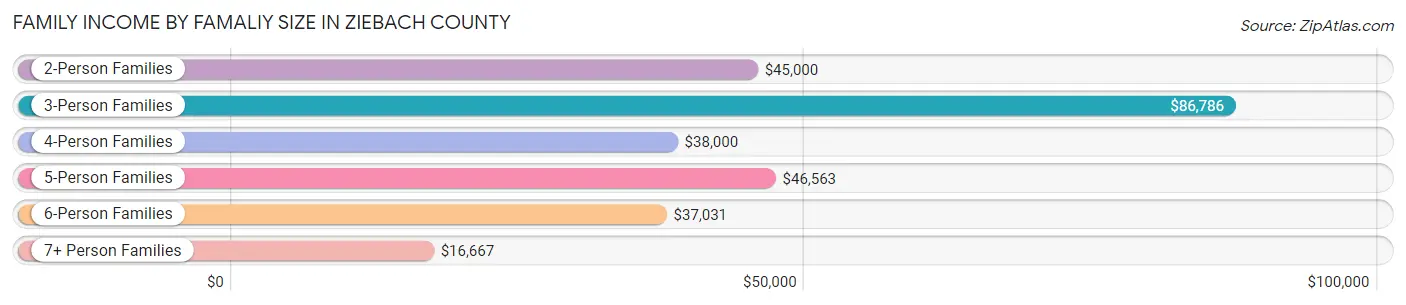
Family Income by Famaliy Size in Ziebach County
3-person families (128 | 24.0%) account for the highest median family income in Ziebach County with $86,786 per family, while 3-person families (128 | 24.0%) have the highest median income of $28,929 per family member.
| Income Bracket | # Families | Median Income |
| 2-Person Families | 202 (37.8%) | $45,000 |
| 3-Person Families | 128 (24.0%) | $86,786 |
| 4-Person Families | 90 (16.9%) | $38,000 |
| 5-Person Families | 75 (14.0%) | $46,563 |
| 6-Person Families | 21 (3.9%) | $37,031 |
| 7+ Person Families | 18 (3.4%) | $16,667 |
| Total | 534 (100.0%) | $47,500 |
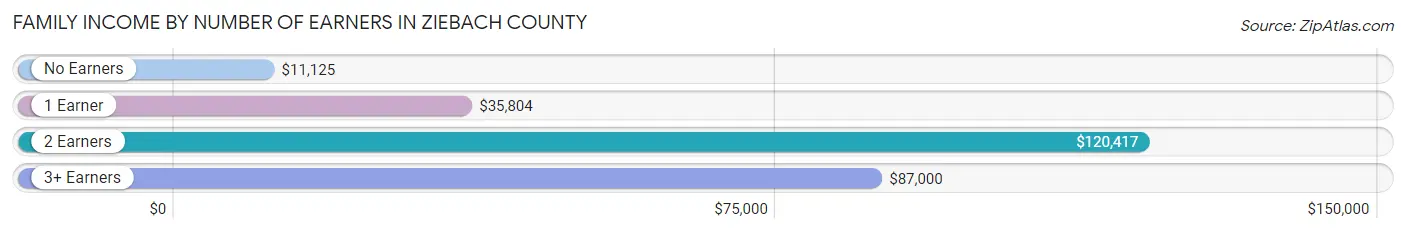
Family Income by Number of Earners in Ziebach County
The median family income in Ziebach County is $47,500, with families comprising 2 earners (192) having the highest median family income of $120,417, while families with no earners (121) have the lowest median family income of $11,125, accounting for 36.0% and 22.7% of families, respectively.
| Number of Earners | # Families | Median Income |
| No Earners | 121 (22.7%) | $11,125 |
| 1 Earner | 177 (33.2%) | $35,804 |
| 2 Earners | 192 (36.0%) | $120,417 |
| 3+ Earners | 44 (8.2%) | $87,000 |
| Total | 534 (100.0%) | $47,500 |
Household Income in Ziebach County
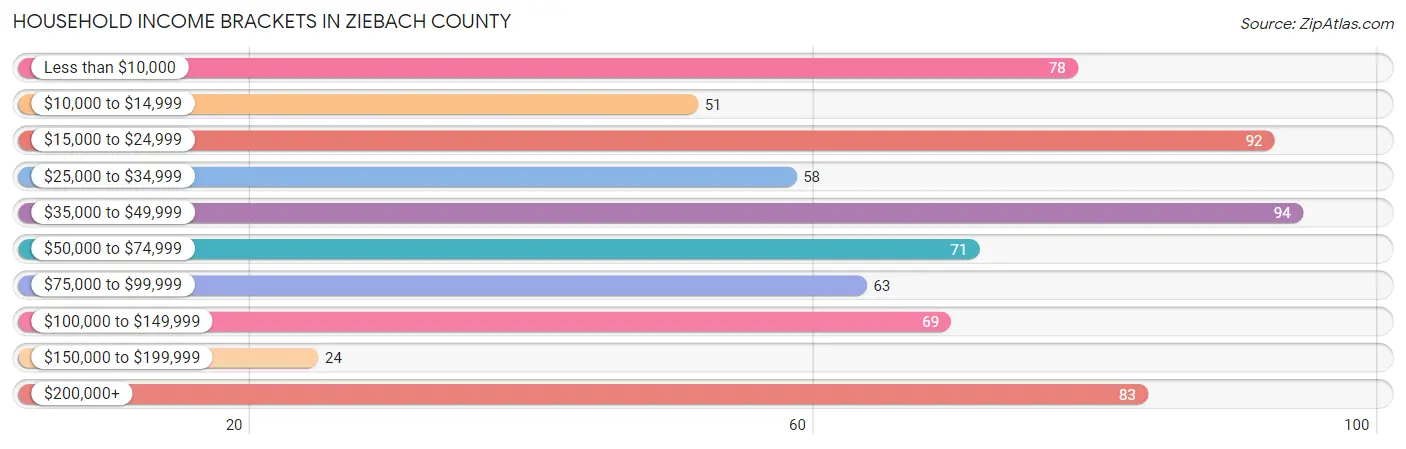
Household Income Brackets in Ziebach County
With 94 households falling in the category, the $35,000 to $49,999 income range is the most frequent in Ziebach County, accounting for 13.8% of all households. In contrast, only 24 households (3.5%) fall into the $150,000 to $199,999 income bracket, making it the least populous group.
| Income Bracket | # Households | % Households |
| Less than $10,000 | 78 | 11.4% |
| $10,000 to $14,999 | 51 | 7.5% |
| $15,000 to $24,999 | 92 | 13.5% |
| $25,000 to $34,999 | 58 | 8.5% |
| $35,000 to $49,999 | 94 | 13.8% |
| $50,000 to $74,999 | 71 | 10.4% |
| $75,000 to $99,999 | 63 | 9.2% |
| $100,000 to $149,999 | 69 | 10.1% |
| $150,000 to $199,999 | 24 | 3.5% |
| $200,000+ | 83 | 12.2% |
Household Income by Householder Age in Ziebach County
The median household income in Ziebach County is $46,023, with the highest median household income of $52,708 found in the 45 to 64 years age bracket for the primary householder. A total of 341 households (49.9%) fall into this category. Meanwhile, the 15 to 24 years age bracket for the primary householder has the lowest median household income of $0, with 17 households (2.5%) in this group.

| Income Bracket | # Households | Median Income |
| 15 to 24 Years | 17 (2.5%) | $0 |
| 25 to 44 Years | 173 (25.3%) | $35,625 |
| 45 to 64 Years | 341 (49.9%) | $52,708 |
| 65+ Years | 152 (22.3%) | $45,000 |
| Total | 683 (100.0%) | $46,023 |
Poverty in Ziebach County
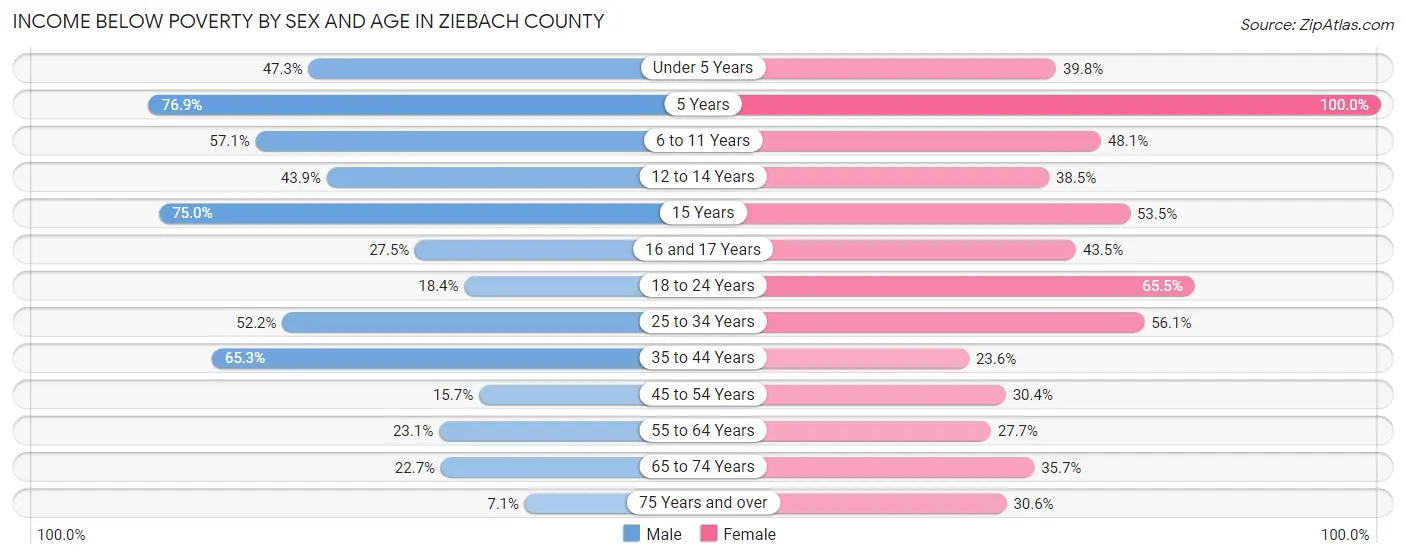
Income Below Poverty by Sex and Age in Ziebach County
With 41.0% poverty level for males and 41.7% for females among the residents of Ziebach County, 5 year old males and 5 year old females are the most vulnerable to poverty, with 20 males (76.9%) and 18 females (100.0%) in their respective age groups living below the poverty level.
| Age Bracket | Male | Female |
| Under 5 Years | 52 (47.3%) | 33 (39.8%) |
| 5 Years | 20 (76.9%) | 18 (100.0%) |
| 6 to 11 Years | 52 (57.1%) | 51 (48.1%) |
| 12 to 14 Years | 18 (43.9%) | 20 (38.5%) |
| 15 Years | 12 (75.0%) | 23 (53.5%) |
| 16 and 17 Years | 11 (27.5%) | 20 (43.5%) |
| 18 to 24 Years | 25 (18.4%) | 110 (65.5%) |
| 25 to 34 Years | 85 (52.1%) | 64 (56.1%) |
| 35 to 44 Years | 154 (65.2%) | 34 (23.6%) |
| 45 to 54 Years | 13 (15.7%) | 49 (30.4%) |
| 55 to 64 Years | 39 (23.1%) | 44 (27.7%) |
| 65 to 74 Years | 20 (22.7%) | 35 (35.7%) |
| 75 Years and over | 2 (7.1%) | 11 (30.6%) |
| Total | 503 (41.0%) | 512 (41.7%) |
Income Above Poverty by Sex and Age in Ziebach County
According to the poverty statistics in Ziebach County, males aged 75 years and over and females aged 35 to 44 years are the age groups that are most secure financially, with 92.9% of males and 76.4% of females in these age groups living above the poverty line.
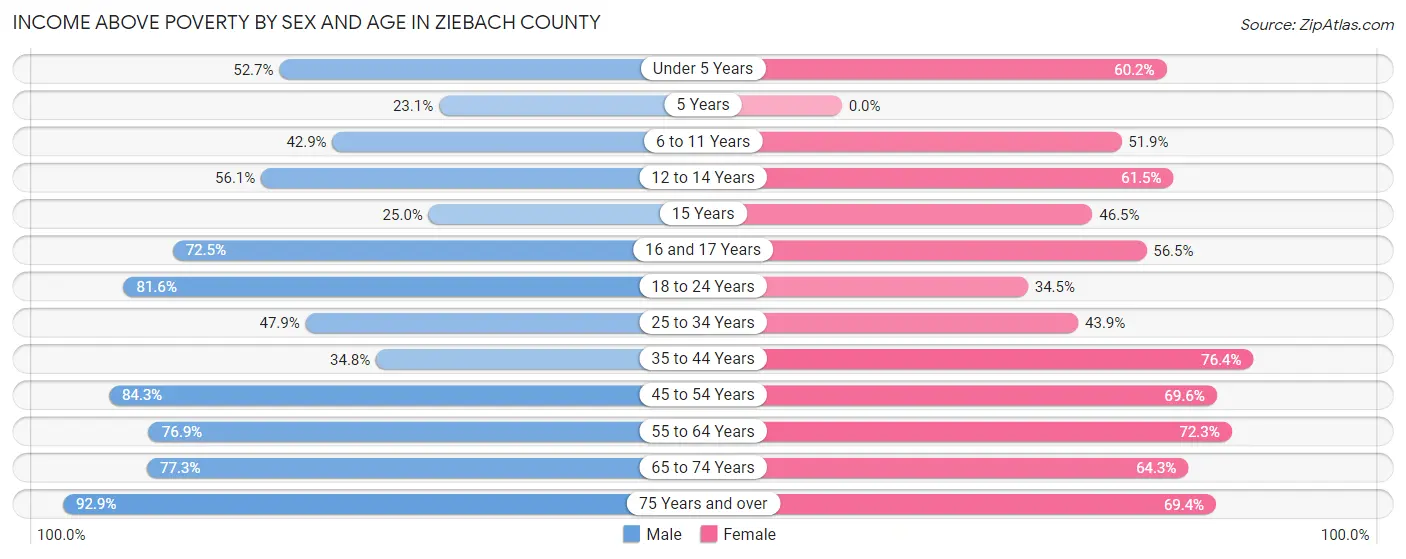
| Age Bracket | Male | Female |
| Under 5 Years | 58 (52.7%) | 50 (60.2%) |
| 5 Years | 6 (23.1%) | 0 (0.0%) |
| 6 to 11 Years | 39 (42.9%) | 55 (51.9%) |
| 12 to 14 Years | 23 (56.1%) | 32 (61.5%) |
| 15 Years | 4 (25.0%) | 20 (46.5%) |
| 16 and 17 Years | 29 (72.5%) | 26 (56.5%) |
| 18 to 24 Years | 111 (81.6%) | 58 (34.5%) |
| 25 to 34 Years | 78 (47.8%) | 50 (43.9%) |
| 35 to 44 Years | 82 (34.7%) | 110 (76.4%) |
| 45 to 54 Years | 70 (84.3%) | 112 (69.6%) |
| 55 to 64 Years | 130 (76.9%) | 115 (72.3%) |
| 65 to 74 Years | 68 (77.3%) | 63 (64.3%) |
| 75 Years and over | 26 (92.9%) | 25 (69.4%) |
| Total | 724 (59.0%) | 716 (58.3%) |
Income Below Poverty Among Married-Couple Families in Ziebach County
The poverty statistics for married-couple families in Ziebach County show that 8.9% or 22 of the total 248 families live below the poverty line. Families with 3 or 4 children have the highest poverty rate of 27.3%, comprising of 6 families. On the other hand, families with no children have the lowest poverty rate of 5.7%, which includes 7 families.

| Children | Above Poverty | Below Poverty |
| No Children | 117 (94.4%) | 7 (5.7%) |
| 1 or 2 Children | 93 (91.2%) | 9 (8.8%) |
| 3 or 4 Children | 16 (72.7%) | 6 (27.3%) |
| 5 or more Children | 0 (0.0%) | 0 (0.0%) |
| Total | 226 (91.1%) | 22 (8.9%) |
Income Below Poverty Among Single-Parent Households in Ziebach County
According to the poverty data in Ziebach County, 49.0% or 47 single-father households and 56.8% or 108 single-mother households are living below the poverty line. Among single-father households, those with 5 or more children have the highest poverty rate, with 2 households (66.7%) experiencing poverty. Likewise, among single-mother households, those with 5 or more children have the highest poverty rate, with 13 households (92.9%) falling below the poverty line.
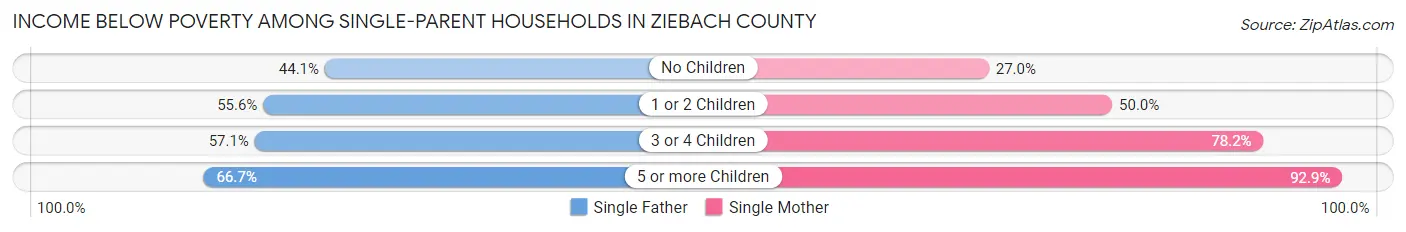
| Children | Single Father | Single Mother |
| No Children | 26 (44.1%) | 10 (27.0%) |
| 1 or 2 Children | 15 (55.6%) | 42 (50.0%) |
| 3 or 4 Children | 4 (57.1%) | 43 (78.2%) |
| 5 or more Children | 2 (66.7%) | 13 (92.9%) |
| Total | 47 (49.0%) | 108 (56.8%) |
Income Below Poverty Among Married-Couple vs Single-Parent Households in Ziebach County
The poverty data for Ziebach County shows that 22 of the married-couple family households (8.9%) and 155 of the single-parent households (54.2%) are living below the poverty level. Within the married-couple family households, those with 3 or 4 children have the highest poverty rate, with 6 households (27.3%) falling below the poverty line. Among the single-parent households, those with 5 or more children have the highest poverty rate, with 15 household (88.2%) living below poverty.

| Children | Married-Couple Families | Single-Parent Households |
| No Children | 7 (5.7%) | 36 (37.5%) |
| 1 or 2 Children | 9 (8.8%) | 57 (51.3%) |
| 3 or 4 Children | 6 (27.3%) | 47 (75.8%) |
| 5 or more Children | 0 (0.0%) | 15 (88.2%) |
| Total | 22 (8.9%) | 155 (54.2%) |
Race in Ziebach County
The most populous races in Ziebach County are Native / Alaskan (1,669 | 68.0%), White / Caucasian (615 | 25.1%), and Hispanic or Latino (166 | 6.8%).

| Race | # Population | % Population |
| Asian | 0 | 0.0% |
| Black / African American | 0 | 0.0% |
| Hawaiian / Pacific | 6 | 0.2% |
| Hispanic or Latino | 166 | 6.8% |
| Native / Alaskan | 1,669 | 68.0% |
| White / Caucasian | 615 | 25.1% |
| Two or more Races | 145 | 5.9% |
| Some other Race | 20 | 0.8% |
| Total | 2,455 | 100.0% |
Ancestry in Ziebach County
The most populous ancestries reported in Ziebach County are Sioux (1,699 | 69.2%), German (283 | 11.5%), American (223 | 9.1%), Mexican (146 | 5.9%), and Irish (142 | 5.8%), together accounting for 101.6% of all Ziebach County residents.

| Ancestry | # Population | % Population |
| American | 223 | 9.1% |
| Apache | 3 | 0.1% |
| Central American | 16 | 0.6% |
| Czech | 5 | 0.2% |
| Danish | 5 | 0.2% |
| Dutch | 3 | 0.1% |
| English | 54 | 2.2% |
| French Canadian | 6 | 0.2% |
| German | 283 | 11.5% |
| Honduran | 16 | 0.6% |
| Irish | 142 | 5.8% |
| Mexican | 146 | 5.9% |
| Native Hawaiian | 2 | 0.1% |
| Navajo | 4 | 0.2% |
| Norwegian | 54 | 2.2% |
| Russian | 4 | 0.2% |
| Samoan | 4 | 0.2% |
| Scandinavian | 2 | 0.1% |
| Scotch-Irish | 3 | 0.1% |
| Scottish | 3 | 0.1% |
| Sioux | 1,699 | 69.2% |
| Swedish | 9 | 0.4% |
| Welsh | 2 | 0.1% | View All 23 Rows |
Immigrants in Ziebach County
The most numerous immigrant groups reported in Ziebach County came from Central America (16 | 0.6%), Honduras (16 | 0.6%), Latin America (16 | 0.6%), Canada (5 | 0.2%), and Oceania (3 | 0.1%), together accounting for 2.3% of all Ziebach County residents.

| Immigration Origin | # Population | % Population |
| Canada | 5 | 0.2% |
| Central America | 16 | 0.6% |
| Honduras | 16 | 0.6% |
| Latin America | 16 | 0.6% |
| Oceania | 3 | 0.1% | View All 5 Rows |
Sex and Age in Ziebach County
Sex and Age in Ziebach County
The most populous age groups in Ziebach County are 35 to 39 Years (205 | 16.7%) for men and 15 to 19 Years (139 | 11.3%) for women.
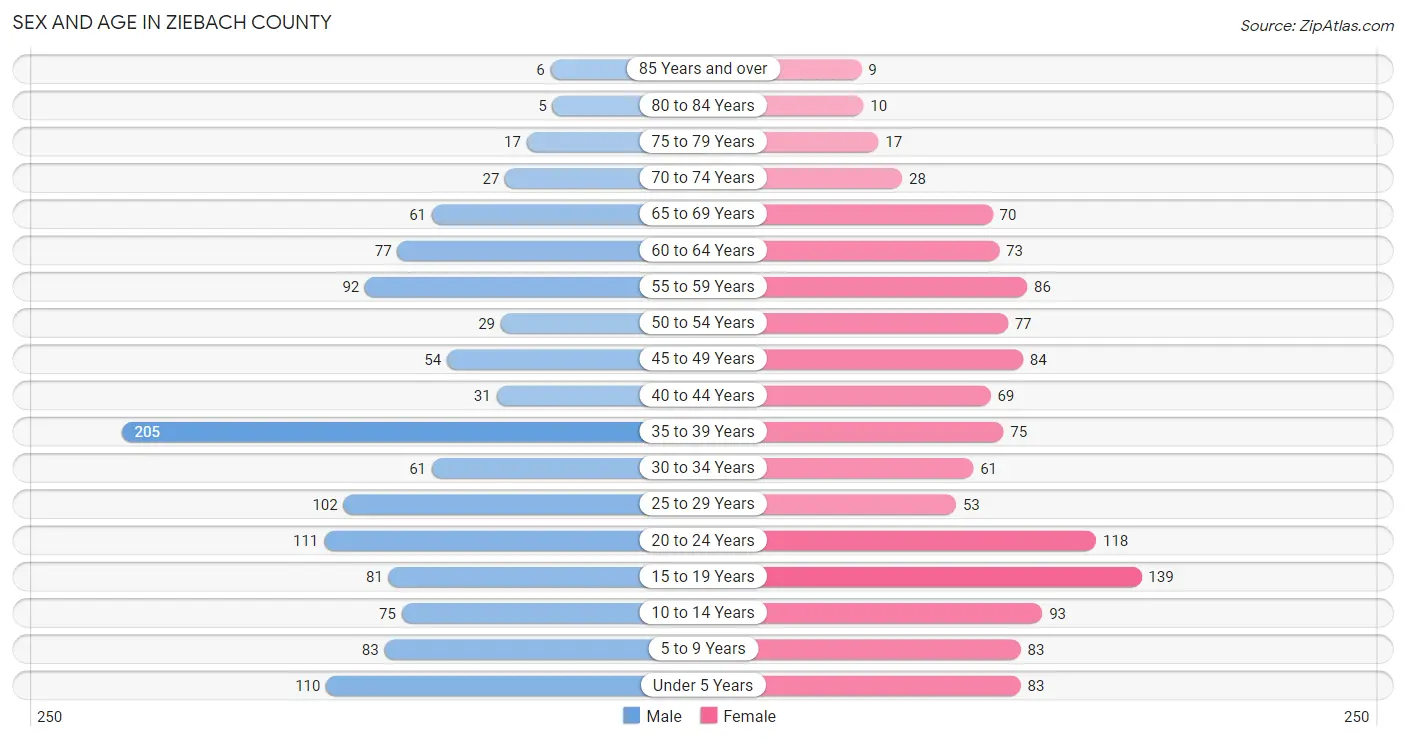
| Age Bracket | Male | Female |
| Under 5 Years | 110 (9.0%) | 83 (6.8%) |
| 5 to 9 Years | 83 (6.8%) | 83 (6.8%) |
| 10 to 14 Years | 75 (6.1%) | 93 (7.6%) |
| 15 to 19 Years | 81 (6.6%) | 139 (11.3%) |
| 20 to 24 Years | 111 (9.0%) | 118 (9.6%) |
| 25 to 29 Years | 102 (8.3%) | 53 (4.3%) |
| 30 to 34 Years | 61 (5.0%) | 61 (5.0%) |
| 35 to 39 Years | 205 (16.7%) | 75 (6.1%) |
| 40 to 44 Years | 31 (2.5%) | 69 (5.6%) |
| 45 to 49 Years | 54 (4.4%) | 84 (6.8%) |
| 50 to 54 Years | 29 (2.4%) | 77 (6.3%) |
| 55 to 59 Years | 92 (7.5%) | 86 (7.0%) |
| 60 to 64 Years | 77 (6.3%) | 73 (5.9%) |
| 65 to 69 Years | 61 (5.0%) | 70 (5.7%) |
| 70 to 74 Years | 27 (2.2%) | 28 (2.3%) |
| 75 to 79 Years | 17 (1.4%) | 17 (1.4%) |
| 80 to 84 Years | 5 (0.4%) | 10 (0.8%) |
| 85 Years and over | 6 (0.5%) | 9 (0.7%) |
| Total | 1,227 (100.0%) | 1,228 (100.0%) |
Families and Households in Ziebach County
Median Family Size in Ziebach County
The median family size in Ziebach County is 3.99 persons per family, with single male/father families (96 | 18.0%) accounting for the largest median family size of 5.01 persons per family. On the other hand, married-couple families (248 | 46.4%) represent the smallest median family size with 3.31 persons per family.
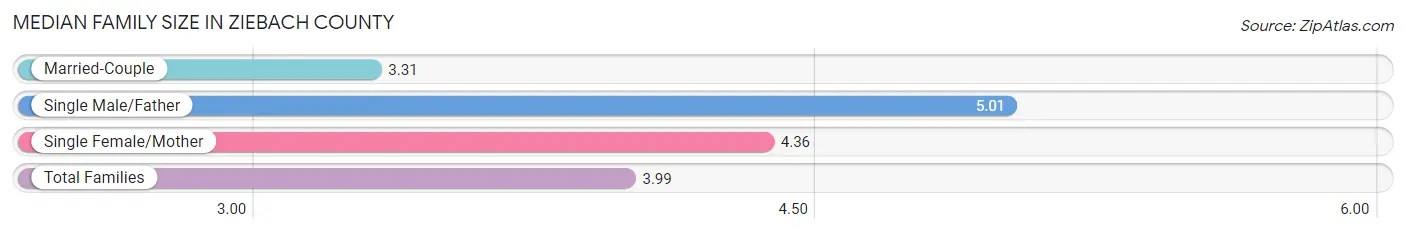
| Family Type | # Families | Family Size |
| Married-Couple | 248 (46.4%) | 3.31 |
| Single Male/Father | 96 (18.0%) | 5.01 |
| Single Female/Mother | 190 (35.6%) | 4.36 |
| Total Families | 534 (100.0%) | 3.99 |
Median Household Size in Ziebach County
The median household size in Ziebach County is 3.59 persons per household, with single male/father households (96 | 14.1%) accounting for the largest median household size of 5.49 persons per household. non-family households (149 | 21.8%) represent the smallest median household size with 1.21 persons per household.
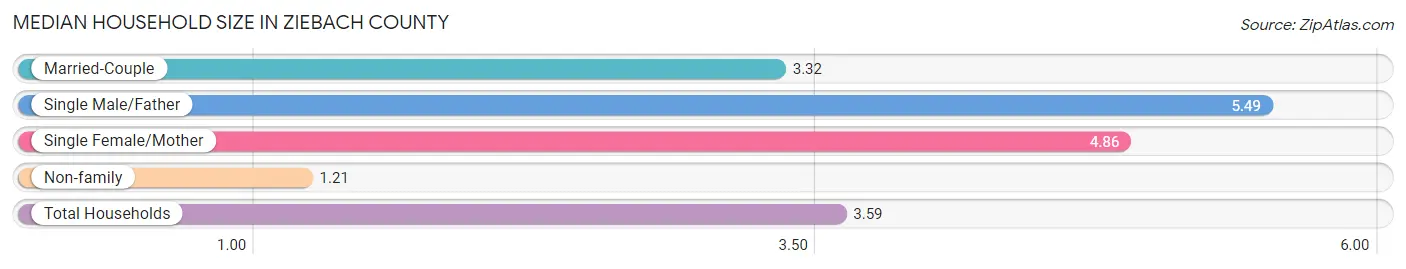
| Household Type | # Households | Household Size |
| Married-Couple | 248 (36.3%) | 3.32 |
| Single Male/Father | 96 (14.1%) | 5.49 |
| Single Female/Mother | 190 (27.8%) | 4.86 |
| Non-family | 149 (21.8%) | 1.21 |
| Total Households | 683 (100.0%) | 3.59 |
Household Size by Marriage Status in Ziebach County
Out of a total of 683 households in Ziebach County, 534 (78.2%) are family households, while 149 (21.8%) are nonfamily households. The most numerous type of family households are 2-person households, comprising 196, and the most common type of nonfamily households are 1-person households, comprising 132.

| Household Size | Family Households | Nonfamily Households |
| 1-Person Households | - | 132 (19.3%) |
| 2-Person Households | 196 (28.7%) | 17 (2.5%) |
| 3-Person Households | 125 (18.3%) | 0 (0.0%) |
| 4-Person Households | 72 (10.5%) | 0 (0.0%) |
| 5-Person Households | 80 (11.7%) | 0 (0.0%) |
| 6-Person Households | 35 (5.1%) | 0 (0.0%) |
| 7+ Person Households | 26 (3.8%) | 0 (0.0%) |
| Total | 534 (78.2%) | 149 (21.8%) |
Female Fertility in Ziebach County
Fertility by Age in Ziebach County
Average fertility rate in Ziebach County is 86.0 births per 1,000 women. Women in the age bracket of 20 to 34 years have the highest fertility rate with 211.0 births per 1,000 women. Women in the age bracket of 20 to 34 years acount for 92.4% of all women with births.
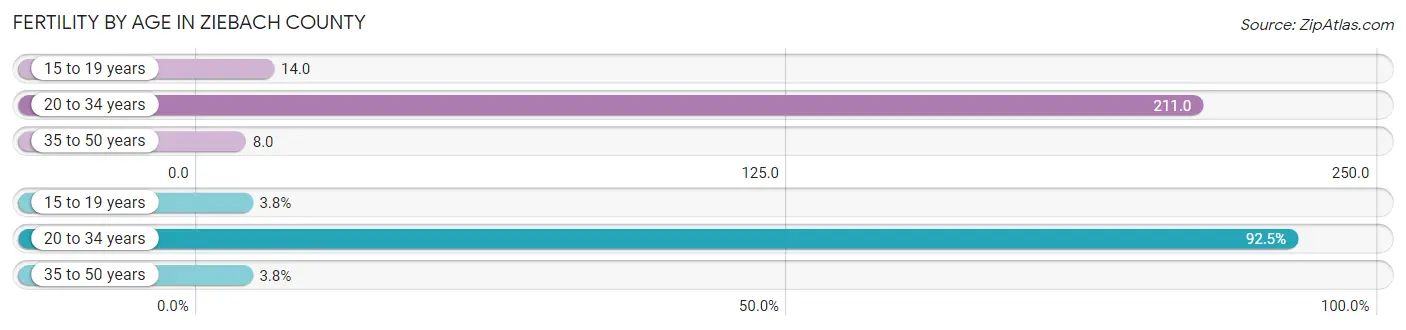
| Age Bracket | Women with Births | Births / 1,000 Women |
| 15 to 19 years | 2 (3.8%) | 14.0 |
| 20 to 34 years | 49 (92.4%) | 211.0 |
| 35 to 50 years | 2 (3.8%) | 8.0 |
| Total | 53 (100.0%) | 86.0 |
Fertility by Age by Marriage Status in Ziebach County
22.6% of women with births (53) in Ziebach County are married. The highest percentage of unmarried women with births falls into 15 to 19 years age bracket with 100.0% of them unmarried at the time of birth, while the lowest percentage of unmarried women with births belong to 20 to 34 years age bracket with 75.5% of them unmarried.

| Age Bracket | Married | Unmarried |
| 15 to 19 years | 0 (0.0%) | 2 (100.0%) |
| 20 to 34 years | 12 (24.5%) | 37 (75.5%) |
| 35 to 50 years | 0 (0.0%) | 2 (100.0%) |
| Total | 12 (22.6%) | 41 (77.4%) |
Fertility by Education in Ziebach County

| Educational Attainment | Women with Births | Births / 1,000 Women |
| Less than High School | 5 (9.4%) | 27.0 |
| High School Diploma | 20 (37.7%) | 99.0 |
| College or Associate's Degree | 22 (41.5%) | 124.0 |
| Bachelor's Degree | 6 (11.3%) | 162.0 |
| Graduate Degree | 0 (0.0%) | 0.0 |
| Total | 53 (100.0%) | 86.0 |
Fertility by Education by Marriage Status in Ziebach County
77.4% of women with births in Ziebach County are unmarried. Women with the educational attainment of bachelor's degree are most likely to be married with 100.0% of them married at childbirth, while women with the educational attainment of high school diploma are least likely to be married with 90.0% of them unmarried at childbirth.
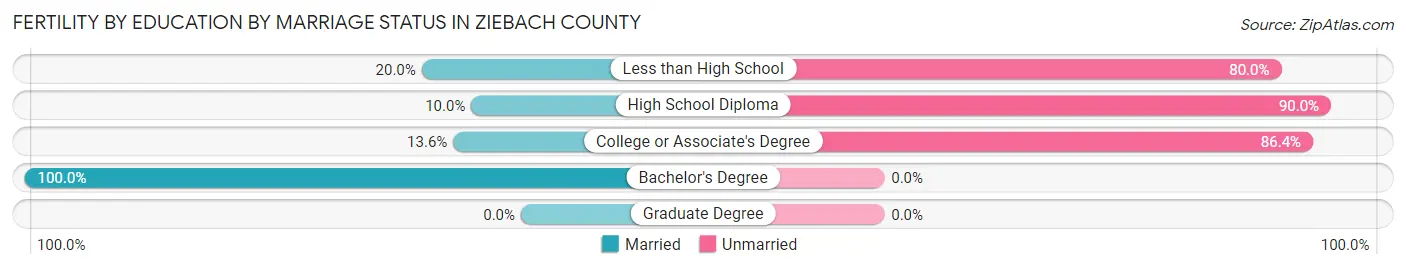
| Educational Attainment | Married | Unmarried |
| Less than High School | 1 (20.0%) | 4 (80.0%) |
| High School Diploma | 2 (10.0%) | 18 (90.0%) |
| College or Associate's Degree | 3 (13.6%) | 19 (86.4%) |
| Bachelor's Degree | 6 (100.0%) | 0 (0.0%) |
| Graduate Degree | 0 (0.0%) | 0 (0.0%) |
| Total | 12 (22.6%) | 41 (77.4%) |
Employment Characteristics in Ziebach County
Employment by Class of Employer in Ziebach County
Among the 822 employed individuals in Ziebach County, local government employees (312 | 38.0%), self-employed (not incorporated) (204 | 24.8%), and private company employees (122 | 14.8%) make up the most common classes of employment.
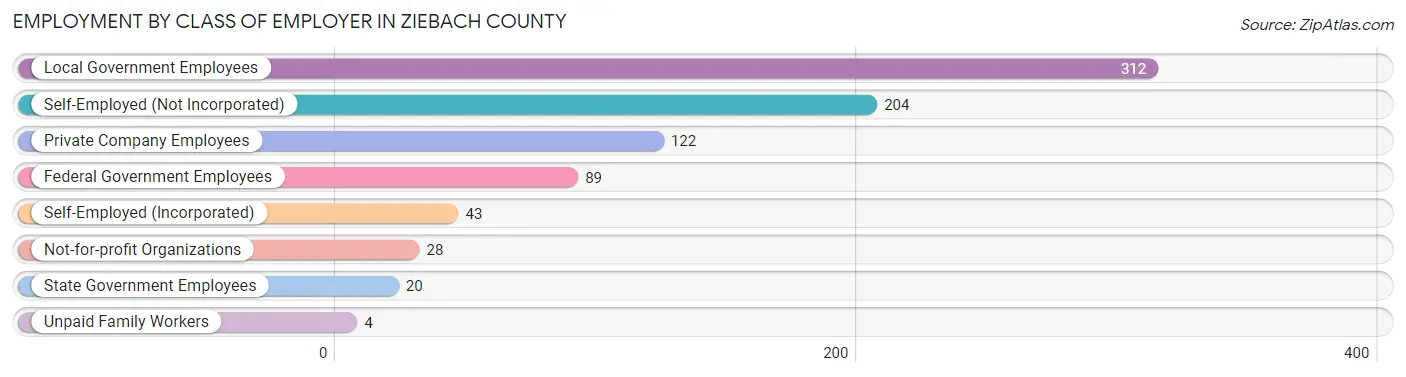
| Employer Class | # Employees | % Employees |
| Private Company Employees | 122 | 14.8% |
| Self-Employed (Incorporated) | 43 | 5.2% |
| Self-Employed (Not Incorporated) | 204 | 24.8% |
| Not-for-profit Organizations | 28 | 3.4% |
| Local Government Employees | 312 | 38.0% |
| State Government Employees | 20 | 2.4% |
| Federal Government Employees | 89 | 10.8% |
| Unpaid Family Workers | 4 | 0.5% |
| Total | 822 | 100.0% |
Employment Status by Age in Ziebach County
According to the labor force statistics for Ziebach County, out of the total population over 16 years of age (1,869), 65.2% or 1,219 individuals are in the labor force, with 32.0% or 390 of them unemployed. The age group with the highest labor force participation rate is 35 to 44 years, with 83.9% or 319 individuals in the labor force. Within the labor force, the 16 to 19 years age range has the highest percentage of unemployed individuals, with 94.6% or 35 of them being unemployed.

| Age Bracket | In Labor Force | Unemployed |
| 16 to 19 Years | 37 (23.0%) | 35 (94.6%) |
| 20 to 24 Years | 176 (76.9%) | 86 (48.9%) |
| 25 to 29 Years | 102 (65.8%) | 37 (36.3%) |
| 30 to 34 Years | 95 (77.9%) | 48 (50.5%) |
| 35 to 44 Years | 319 (83.9%) | 155 (48.6%) |
| 45 to 54 Years | 182 (74.6%) | 11 (6.0%) |
| 55 to 59 Years | 123 (69.1%) | 12 (9.8%) |
| 60 to 64 Years | 105 (70.0%) | 6 (5.7%) |
| 65 to 74 Years | 55 (29.6%) | 0 (0.0%) |
| 75 Years and over | 25 (39.1%) | 0 (0.0%) |
| Total | 1,219 (65.2%) | 390 (32.0%) |
Employment Status by Educational Attainment in Ziebach County
According to labor force statistics for Ziebach County, 75.3% of individuals (925) out of the total population between 25 and 64 years of age (1,229) are in the labor force, with 29.0% or 268 of them being unemployed. The group with the highest labor force participation rate are those with the educational attainment of bachelor's degree or higher, with 90.4% or 160 individuals in the labor force. Within the labor force, individuals with less than high school education have the highest percentage of unemployment, with 64.1% or 50 of them being unemployed.

| Educational Attainment | In Labor Force | Unemployed |
| Less than High School | 78 (60.0%) | 83 (64.1%) |
| High School Diploma | 348 (67.1%) | 135 (26.1%) |
| College / Associate Degree | 340 (84.4%) | 131 (32.6%) |
| Bachelor's Degree or higher | 160 (90.4%) | 19 (10.6%) |
| Total | 925 (75.3%) | 356 (29.0%) |
Employment Occupations by Sex in Ziebach County
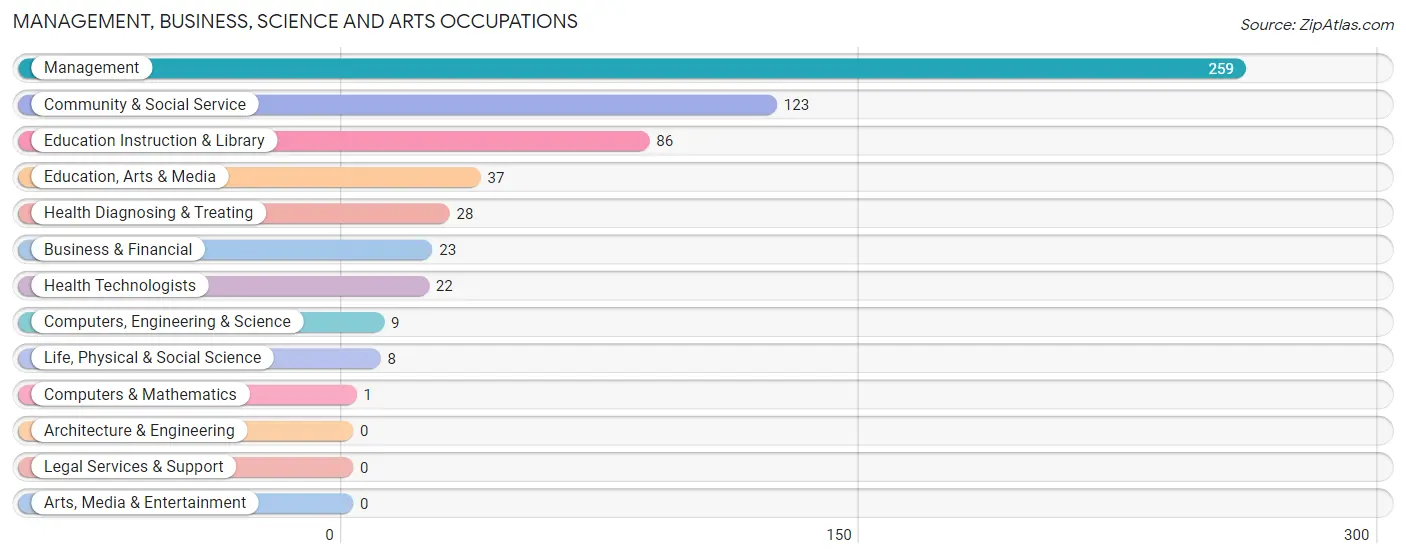
Management, Business, Science and Arts Occupations
The most common Management, Business, Science and Arts occupations in Ziebach County are Management (259 | 31.2%), Community & Social Service (123 | 14.8%), Education Instruction & Library (86 | 10.4%), Education, Arts & Media (37 | 4.5%), and Health Diagnosing & Treating (28 | 3.4%).
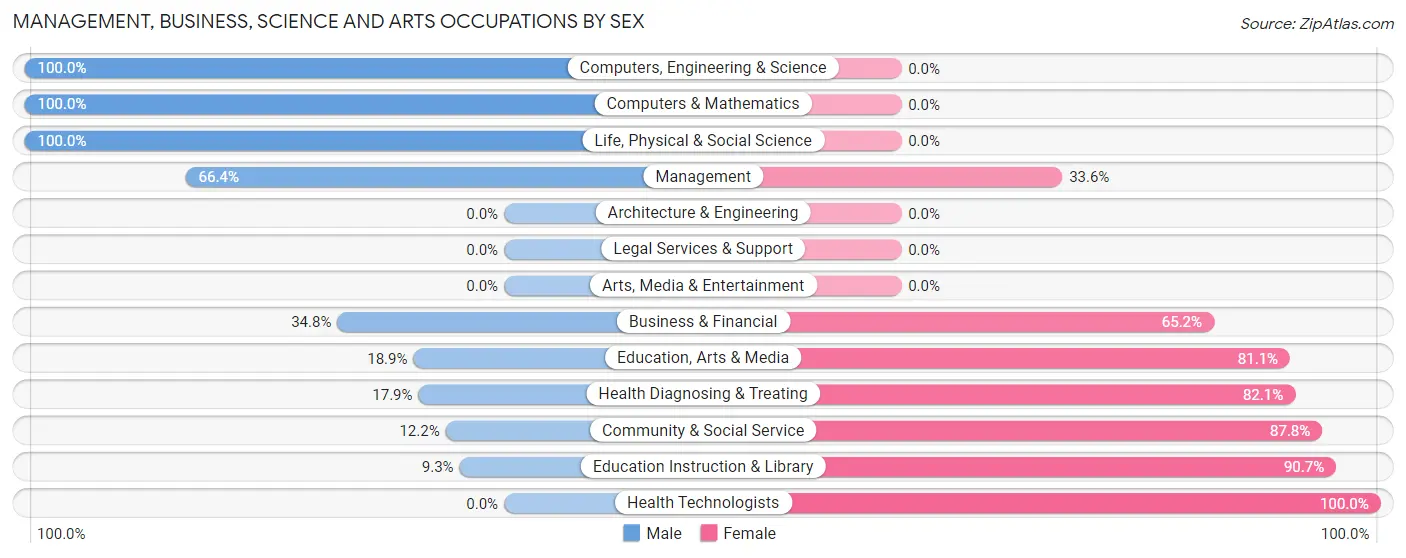
Management, Business, Science and Arts Occupations by Sex
Within the Management, Business, Science and Arts occupations in Ziebach County, the most male-oriented occupations are Computers, Engineering & Science (100.0%), Computers & Mathematics (100.0%), and Life, Physical & Social Science (100.0%), while the most female-oriented occupations are Health Technologists (100.0%), Education Instruction & Library (90.7%), and Community & Social Service (87.8%).
| Occupation | Male | Female |
| Management | 172 (66.4%) | 87 (33.6%) |
| Business & Financial | 8 (34.8%) | 15 (65.2%) |
| Computers, Engineering & Science | 9 (100.0%) | 0 (0.0%) |
| Computers & Mathematics | 1 (100.0%) | 0 (0.0%) |
| Architecture & Engineering | 0 (0.0%) | 0 (0.0%) |
| Life, Physical & Social Science | 8 (100.0%) | 0 (0.0%) |
| Community & Social Service | 15 (12.2%) | 108 (87.8%) |
| Education, Arts & Media | 7 (18.9%) | 30 (81.1%) |
| Legal Services & Support | 0 (0.0%) | 0 (0.0%) |
| Education Instruction & Library | 8 (9.3%) | 78 (90.7%) |
| Arts, Media & Entertainment | 0 (0.0%) | 0 (0.0%) |
| Health Diagnosing & Treating | 5 (17.9%) | 23 (82.1%) |
| Health Technologists | 0 (0.0%) | 22 (100.0%) |
| Total (Category) | 209 (47.3%) | 233 (52.7%) |
| Total (Overall) | 389 (46.9%) | 440 (53.1%) |
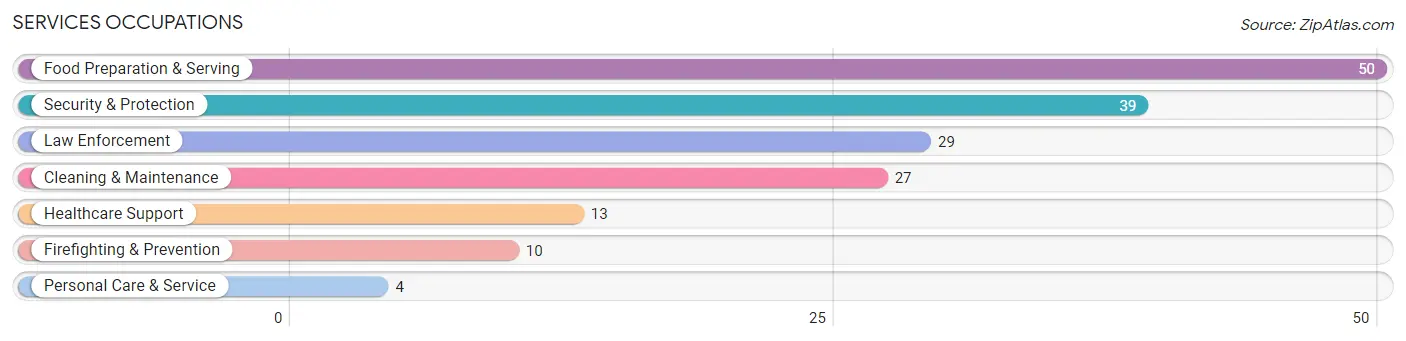
Services Occupations
The most common Services occupations in Ziebach County are Food Preparation & Serving (50 | 6.0%), Security & Protection (39 | 4.7%), Law Enforcement (29 | 3.5%), Cleaning & Maintenance (27 | 3.3%), and Healthcare Support (13 | 1.6%).
Services Occupations by Sex
Within the Services occupations in Ziebach County, the most male-oriented occupations are Cleaning & Maintenance (74.1%), Law Enforcement (62.1%), and Security & Protection (56.4%), while the most female-oriented occupations are Healthcare Support (100.0%), Personal Care & Service (100.0%), and Food Preparation & Serving (70.0%).

| Occupation | Male | Female |
| Healthcare Support | 0 (0.0%) | 13 (100.0%) |
| Security & Protection | 22 (56.4%) | 17 (43.6%) |
| Firefighting & Prevention | 4 (40.0%) | 6 (60.0%) |
| Law Enforcement | 18 (62.1%) | 11 (37.9%) |
| Food Preparation & Serving | 15 (30.0%) | 35 (70.0%) |
| Cleaning & Maintenance | 20 (74.1%) | 7 (25.9%) |
| Personal Care & Service | 0 (0.0%) | 4 (100.0%) |
| Total (Category) | 57 (42.9%) | 76 (57.1%) |
| Total (Overall) | 389 (46.9%) | 440 (53.1%) |
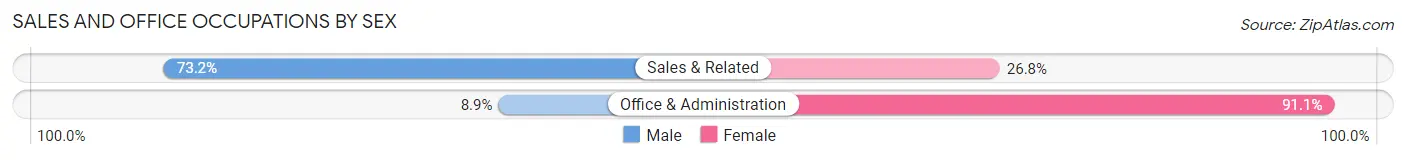
Sales and Office Occupations
The most common Sales and Office occupations in Ziebach County are Office & Administration (101 | 12.2%), and Sales & Related (56 | 6.8%).

Sales and Office Occupations by Sex
| Occupation | Male | Female |
| Sales & Related | 41 (73.2%) | 15 (26.8%) |
| Office & Administration | 9 (8.9%) | 92 (91.1%) |
| Total (Category) | 50 (31.9%) | 107 (68.1%) |
| Total (Overall) | 389 (46.9%) | 440 (53.1%) |
Natural Resources, Construction and Maintenance Occupations
The most common Natural Resources, Construction and Maintenance occupations in Ziebach County are Installation, Maintenance & Repair (19 | 2.3%), Farming, Fishing & Forestry (12 | 1.5%), and Construction & Extraction (6 | 0.7%).

Natural Resources, Construction and Maintenance Occupations by Sex

| Occupation | Male | Female |
| Farming, Fishing & Forestry | 8 (66.7%) | 4 (33.3%) |
| Construction & Extraction | 6 (100.0%) | 0 (0.0%) |
| Installation, Maintenance & Repair | 19 (100.0%) | 0 (0.0%) |
| Total (Category) | 33 (89.2%) | 4 (10.8%) |
| Total (Overall) | 389 (46.9%) | 440 (53.1%) |
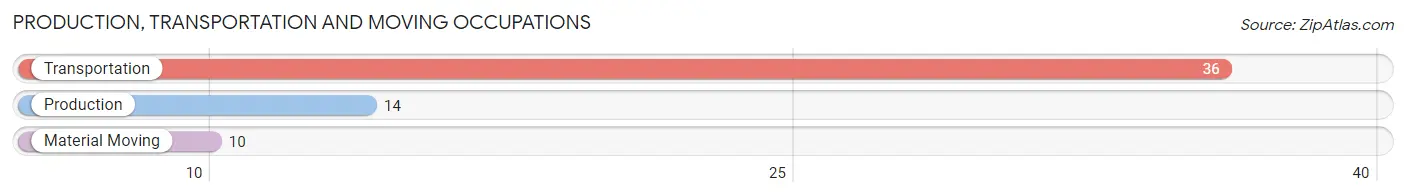
Production, Transportation and Moving Occupations
The most common Production, Transportation and Moving occupations in Ziebach County are Transportation (36 | 4.3%), Production (14 | 1.7%), and Material Moving (10 | 1.2%).
Production, Transportation and Moving Occupations by Sex
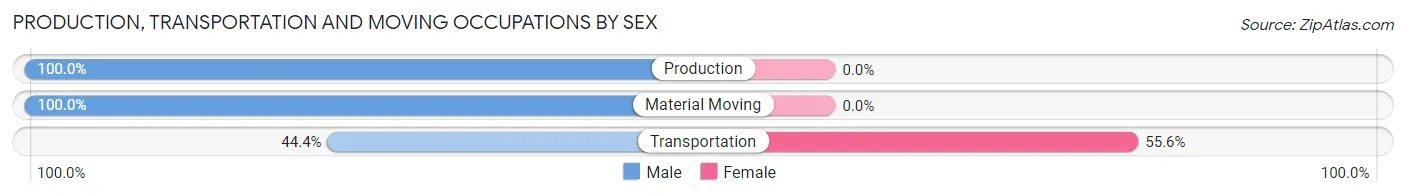
| Occupation | Male | Female |
| Production | 14 (100.0%) | 0 (0.0%) |
| Transportation | 16 (44.4%) | 20 (55.6%) |
| Material Moving | 10 (100.0%) | 0 (0.0%) |
| Total (Category) | 40 (66.7%) | 20 (33.3%) |
| Total (Overall) | 389 (46.9%) | 440 (53.1%) |
Employment Industries by Sex in Ziebach County
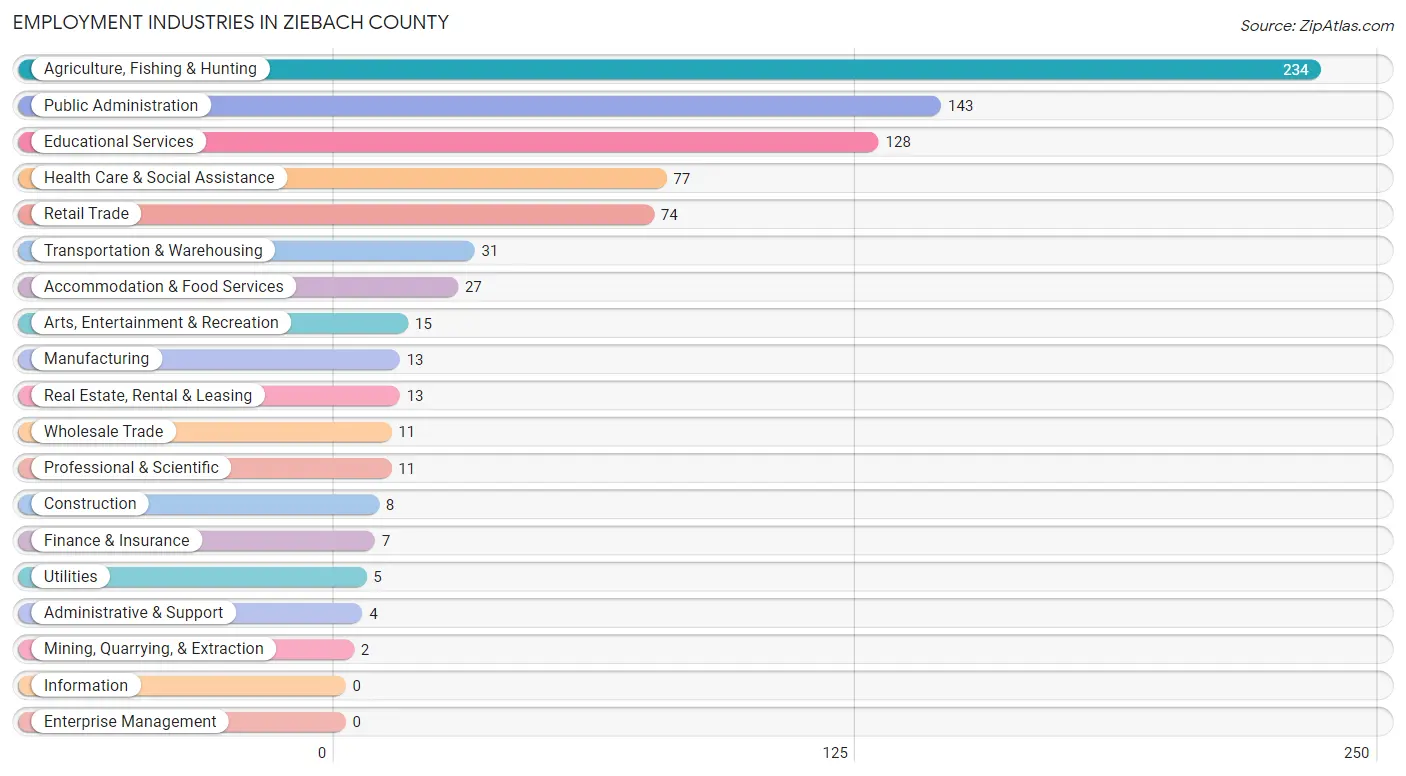
Employment Industries in Ziebach County
The major employment industries in Ziebach County include Agriculture, Fishing & Hunting (234 | 28.2%), Public Administration (143 | 17.2%), Educational Services (128 | 15.4%), Health Care & Social Assistance (77 | 9.3%), and Retail Trade (74 | 8.9%).
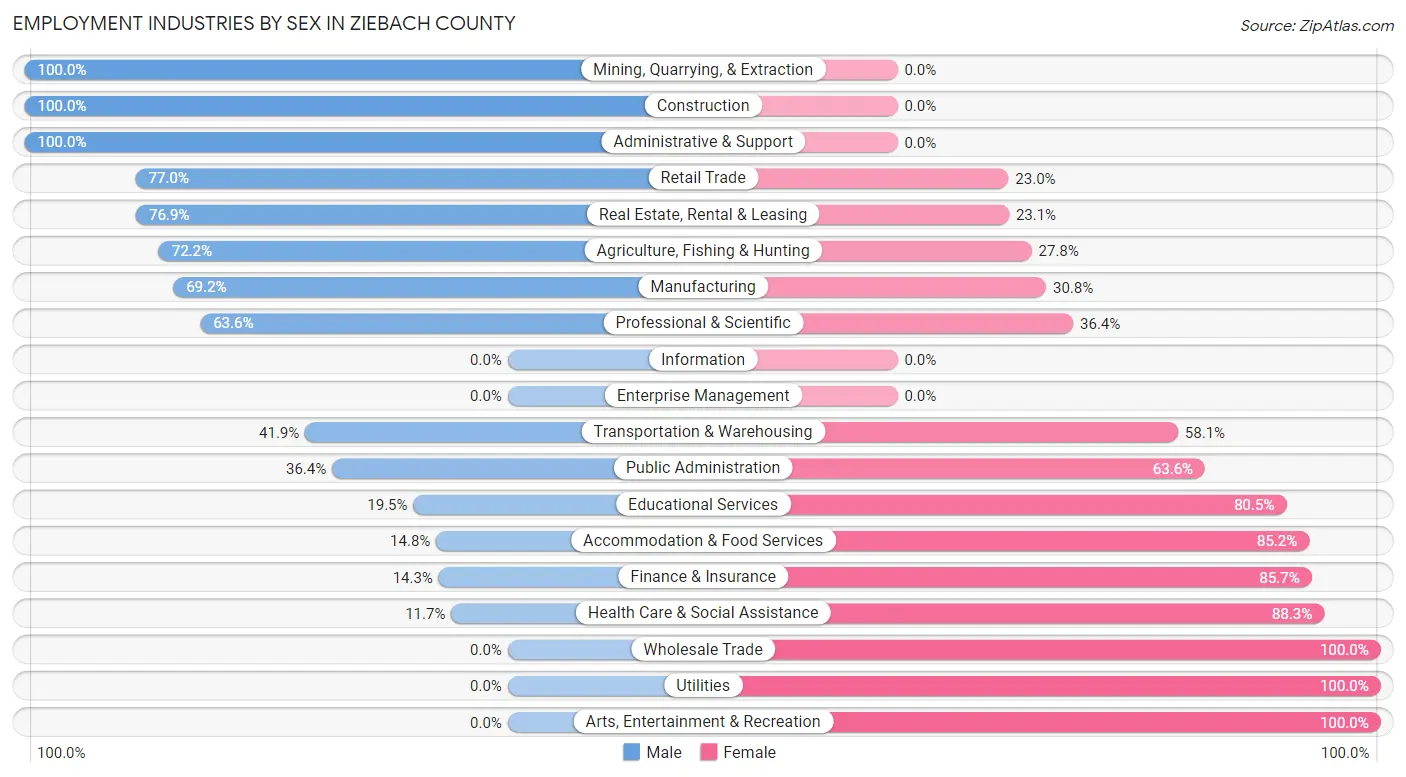
Employment Industries by Sex in Ziebach County
The Ziebach County industries that see more men than women are Mining, Quarrying, & Extraction (100.0%), Construction (100.0%), and Administrative & Support (100.0%), whereas the industries that tend to have a higher number of women are Wholesale Trade (100.0%), Utilities (100.0%), and Arts, Entertainment & Recreation (100.0%).
| Industry | Male | Female |
| Agriculture, Fishing & Hunting | 169 (72.2%) | 65 (27.8%) |
| Mining, Quarrying, & Extraction | 2 (100.0%) | 0 (0.0%) |
| Construction | 8 (100.0%) | 0 (0.0%) |
| Manufacturing | 9 (69.2%) | 4 (30.8%) |
| Wholesale Trade | 0 (0.0%) | 11 (100.0%) |
| Retail Trade | 57 (77.0%) | 17 (23.0%) |
| Transportation & Warehousing | 13 (41.9%) | 18 (58.1%) |
| Utilities | 0 (0.0%) | 5 (100.0%) |
| Information | 0 (0.0%) | 0 (0.0%) |
| Finance & Insurance | 1 (14.3%) | 6 (85.7%) |
| Real Estate, Rental & Leasing | 10 (76.9%) | 3 (23.1%) |
| Professional & Scientific | 7 (63.6%) | 4 (36.4%) |
| Enterprise Management | 0 (0.0%) | 0 (0.0%) |
| Administrative & Support | 4 (100.0%) | 0 (0.0%) |
| Educational Services | 25 (19.5%) | 103 (80.5%) |
| Health Care & Social Assistance | 9 (11.7%) | 68 (88.3%) |
| Arts, Entertainment & Recreation | 0 (0.0%) | 15 (100.0%) |
| Accommodation & Food Services | 4 (14.8%) | 23 (85.2%) |
| Public Administration | 52 (36.4%) | 91 (63.6%) |
| Total | 389 (46.9%) | 440 (53.1%) |
Education in Ziebach County
School Enrollment in Ziebach County
The most common levels of schooling among the 568 students in Ziebach County are high school (189 | 33.3%), middle school (151 | 26.6%), and elementary school (118 | 20.8%).

| School Level | # Students | % Students |
| Nursery / Preschool | 56 | 9.9% |
| Kindergarten | 35 | 6.2% |
| Elementary School | 118 | 20.8% |
| Middle School | 151 | 26.6% |
| High School | 189 | 33.3% |
| College / Undergraduate | 19 | 3.4% |
| Graduate / Professional | 0 | 0.0% |
| Total | 568 | 100.0% |
School Enrollment by Age by Funding Source in Ziebach County
Out of a total of 568 students who are enrolled in schools in Ziebach County, 48 (8.5%) attend a private institution, while the remaining 520 (91.5%) are enrolled in public schools. The age group of 18 to 19 year olds has the highest likelihood of being enrolled in private schools, with 22 (52.4% in the age bracket) enrolled. Conversely, the age group of 15 to 17 year olds has the lowest likelihood of being enrolled in a private school, with 140 (100.0% in the age bracket) attending a public institution.

| Age Bracket | Public School | Private School |
| 3 to 4 Year Olds | 32 (94.1%) | 2 (5.9%) |
| 5 to 9 Year Old | 143 (90.5%) | 15 (9.5%) |
| 10 to 14 Year Olds | 165 (98.2%) | 3 (1.8%) |
| 15 to 17 Year Olds | 140 (100.0%) | 0 (0.0%) |
| 18 to 19 Year Olds | 20 (47.6%) | 22 (52.4%) |
| 20 to 24 Year Olds | 11 (64.7%) | 6 (35.3%) |
| 25 to 34 Year Olds | 7 (100.0%) | 0 (0.0%) |
| 35 Years and over | 2 (100.0%) | 0 (0.0%) |
| Total | 520 (91.5%) | 48 (8.5%) |
Educational Attainment by Field of Study in Ziebach County
Education (61 | 26.4%), science & technology (44 | 19.1%), business (43 | 18.6%), engineering (19 | 8.2%), and bio, nature & agricultural (18 | 7.8%) are the most common fields of study among 231 individuals in Ziebach County who have obtained a bachelor's degree or higher.

| Field of Study | # Graduates | % Graduates |
| Computers & Mathematics | 1 | 0.4% |
| Bio, Nature & Agricultural | 18 | 7.8% |
| Physical & Health Sciences | 4 | 1.7% |
| Psychology | 5 | 2.2% |
| Social Sciences | 11 | 4.8% |
| Engineering | 19 | 8.2% |
| Multidisciplinary Studies | 0 | 0.0% |
| Science & Technology | 44 | 19.1% |
| Business | 43 | 18.6% |
| Education | 61 | 26.4% |
| Literature & Languages | 4 | 1.7% |
| Liberal Arts & History | 4 | 1.7% |
| Visual & Performing Arts | 4 | 1.7% |
| Communications | 0 | 0.0% |
| Arts & Humanities | 13 | 5.6% |
| Total | 231 | 100.0% |
Transportation & Commute in Ziebach County
Vehicle Availability by Sex in Ziebach County
The most prevalent vehicle ownership categories in Ziebach County are males with 2 vehicles (126, accounting for 32.4%) and females with 2 vehicles (154, making up 29.1%).
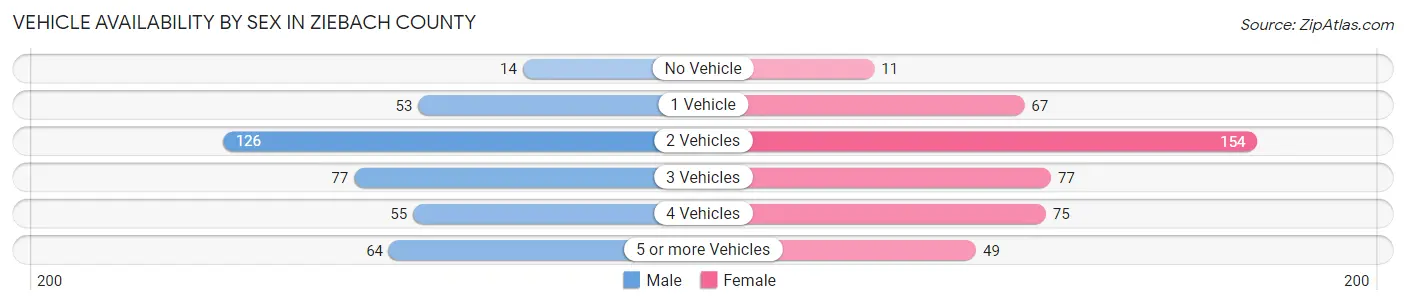
| Vehicles Available | Male | Female |
| No Vehicle | 14 (3.6%) | 11 (2.5%) |
| 1 Vehicle | 53 (13.6%) | 67 (15.5%) |
| 2 Vehicles | 126 (32.4%) | 154 (35.6%) |
| 3 Vehicles | 77 (19.8%) | 77 (17.8%) |
| 4 Vehicles | 55 (14.1%) | 75 (17.3%) |
| 5 or more Vehicles | 64 (16.5%) | 49 (11.3%) |
| Total | 389 (100.0%) | 433 (100.0%) |
Commute Time in Ziebach County
The most frequently occuring commute durations in Ziebach County are 30 to 34 minutes (122 commuters, 21.9%), 10 to 14 minutes (110 commuters, 19.8%), and 25 to 29 minutes (98 commuters, 17.6%).

| Commute Time | # Commuters | % Commuters |
| Less than 5 Minutes | 9 | 1.6% |
| 5 to 9 Minutes | 40 | 7.2% |
| 10 to 14 Minutes | 110 | 19.8% |
| 15 to 19 Minutes | 57 | 10.2% |
| 20 to 24 Minutes | 49 | 8.8% |
| 25 to 29 Minutes | 98 | 17.6% |
| 30 to 34 Minutes | 122 | 21.9% |
| 35 to 39 Minutes | 2 | 0.4% |
| 40 to 44 Minutes | 22 | 4.0% |
| 45 to 59 Minutes | 23 | 4.1% |
| 60 to 89 Minutes | 14 | 2.5% |
| 90 or more Minutes | 10 | 1.8% |
Commute Time by Sex in Ziebach County
The most common commute times in Ziebach County are 10 to 14 minutes (42 commuters, 21.5%) for males and 30 to 34 minutes (103 commuters, 28.5%) for females.
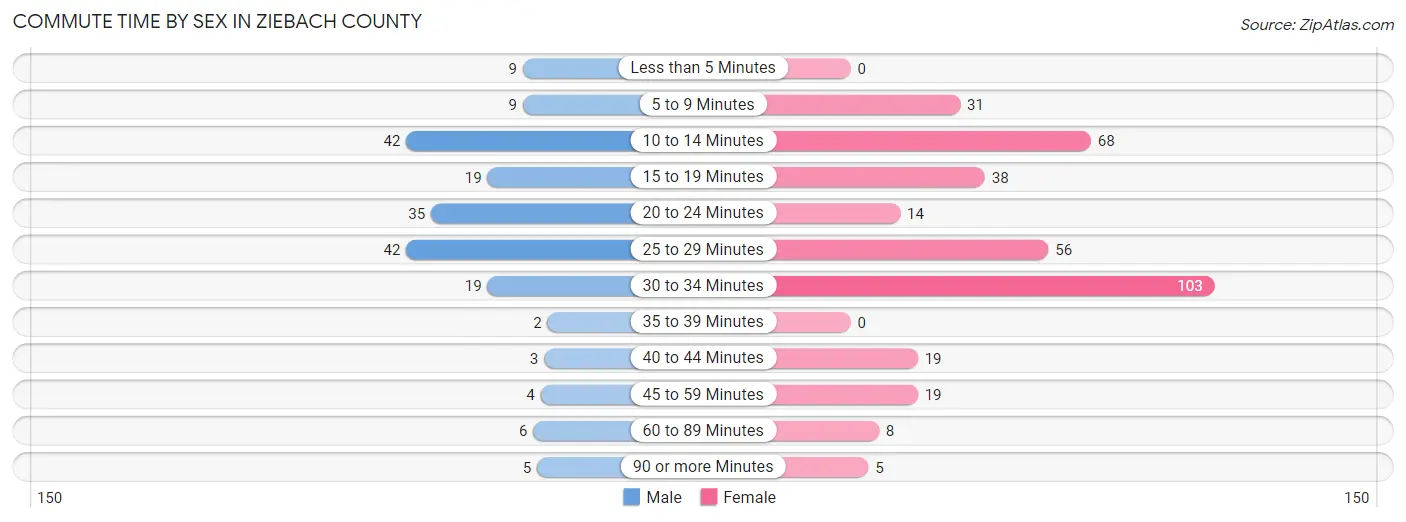
| Commute Time | Male | Female |
| Less than 5 Minutes | 9 (4.6%) | 0 (0.0%) |
| 5 to 9 Minutes | 9 (4.6%) | 31 (8.6%) |
| 10 to 14 Minutes | 42 (21.5%) | 68 (18.8%) |
| 15 to 19 Minutes | 19 (9.7%) | 38 (10.5%) |
| 20 to 24 Minutes | 35 (17.9%) | 14 (3.9%) |
| 25 to 29 Minutes | 42 (21.5%) | 56 (15.5%) |
| 30 to 34 Minutes | 19 (9.7%) | 103 (28.5%) |
| 35 to 39 Minutes | 2 (1.0%) | 0 (0.0%) |
| 40 to 44 Minutes | 3 (1.5%) | 19 (5.3%) |
| 45 to 59 Minutes | 4 (2.1%) | 19 (5.3%) |
| 60 to 89 Minutes | 6 (3.1%) | 8 (2.2%) |
| 90 or more Minutes | 5 (2.6%) | 5 (1.4%) |
Time of Departure to Work by Sex in Ziebach County
The most frequent times of departure to work in Ziebach County are 7:00 AM to 7:29 AM (93, 47.7%) for males and 7:30 AM to 7:59 AM (123, 34.1%) for females.
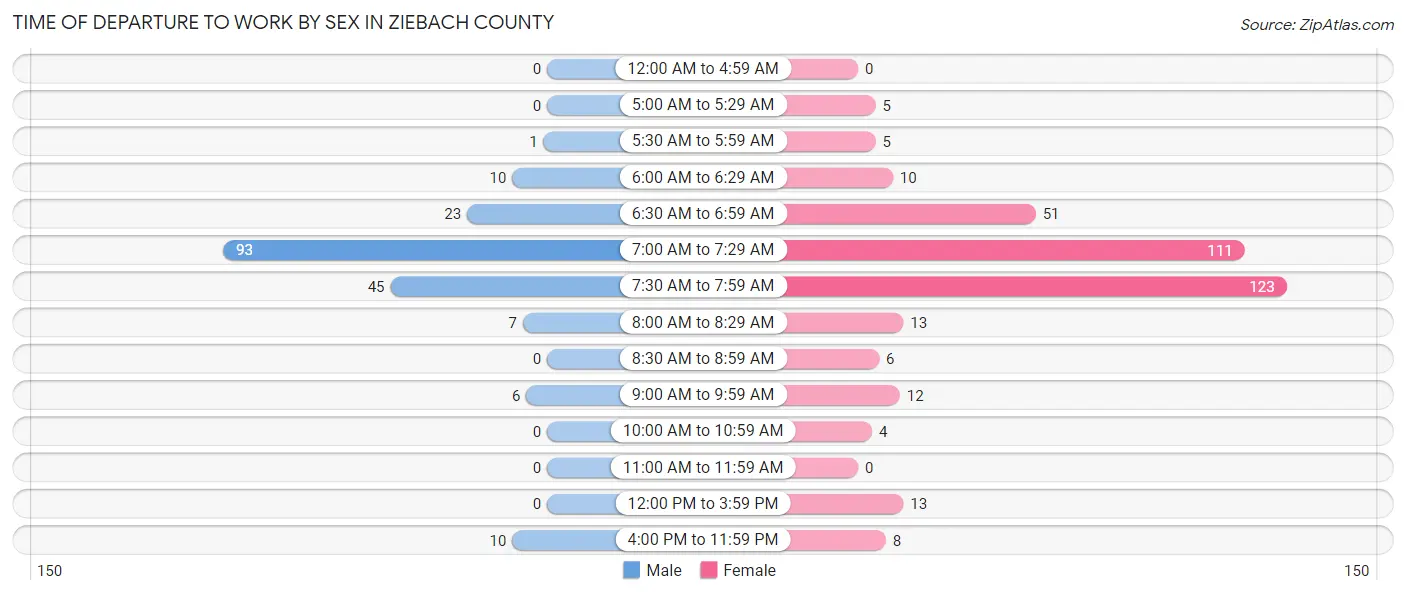
| Time of Departure | Male | Female |
| 12:00 AM to 4:59 AM | 0 (0.0%) | 0 (0.0%) |
| 5:00 AM to 5:29 AM | 0 (0.0%) | 5 (1.4%) |
| 5:30 AM to 5:59 AM | 1 (0.5%) | 5 (1.4%) |
| 6:00 AM to 6:29 AM | 10 (5.1%) | 10 (2.8%) |
| 6:30 AM to 6:59 AM | 23 (11.8%) | 51 (14.1%) |
| 7:00 AM to 7:29 AM | 93 (47.7%) | 111 (30.7%) |
| 7:30 AM to 7:59 AM | 45 (23.1%) | 123 (34.1%) |
| 8:00 AM to 8:29 AM | 7 (3.6%) | 13 (3.6%) |
| 8:30 AM to 8:59 AM | 0 (0.0%) | 6 (1.7%) |
| 9:00 AM to 9:59 AM | 6 (3.1%) | 12 (3.3%) |
| 10:00 AM to 10:59 AM | 0 (0.0%) | 4 (1.1%) |
| 11:00 AM to 11:59 AM | 0 (0.0%) | 0 (0.0%) |
| 12:00 PM to 3:59 PM | 0 (0.0%) | 13 (3.6%) |
| 4:00 PM to 11:59 PM | 10 (5.1%) | 8 (2.2%) |
| Total | 195 (100.0%) | 361 (100.0%) |
Housing Occupancy in Ziebach County
Occupancy by Ownership in Ziebach County
Of the total 683 dwellings in Ziebach County, owner-occupied units account for 384 (56.2%), while renter-occupied units make up 299 (43.8%).

| Occupancy | # Housing Units | % Housing Units |
| Owner Occupied Housing Units | 384 | 56.2% |
| Renter-Occupied Housing Units | 299 | 43.8% |
| Total Occupied Housing Units | 683 | 100.0% |
Occupancy by Household Size in Ziebach County

| Household Size | # Housing Units | % Housing Units |
| 1-Person Household | 132 | 19.3% |
| 2-Person Household | 213 | 31.2% |
| 3-Person Household | 125 | 18.3% |
| 4+ Person Household | 213 | 31.2% |
| Total Housing Units | 683 | 100.0% |
Occupancy by Ownership by Household Size in Ziebach County

| Household Size | Owner-occupied | Renter-occupied |
| 1-Person Household | 77 (58.3%) | 55 (41.7%) |
| 2-Person Household | 135 (63.4%) | 78 (36.6%) |
| 3-Person Household | 90 (72.0%) | 35 (28.0%) |
| 4+ Person Household | 82 (38.5%) | 131 (61.5%) |
| Total Housing Units | 384 (56.2%) | 299 (43.8%) |
Occupancy by Educational Attainment in Ziebach County
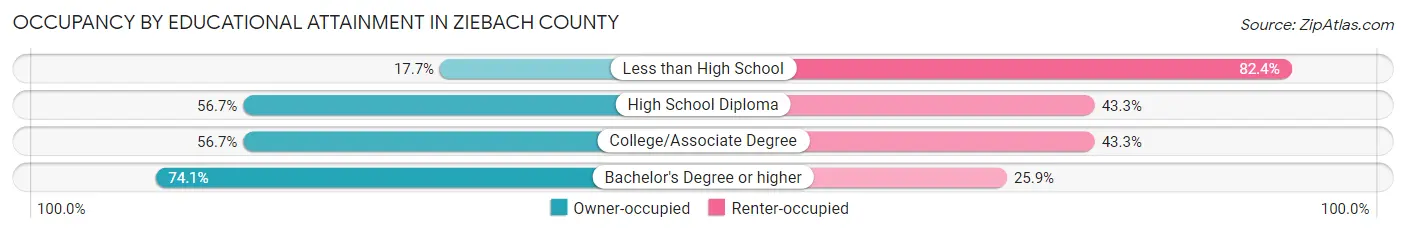
| Household Size | Owner-occupied | Renter-occupied |
| Less than High School | 12 (17.6%) | 56 (82.4%) |
| High School Diploma | 136 (56.7%) | 104 (43.3%) |
| College/Associate Degree | 136 (56.7%) | 104 (43.3%) |
| Bachelor's Degree or higher | 100 (74.1%) | 35 (25.9%) |
Occupancy by Age of Householder in Ziebach County

| Age Bracket | # Households | % Households |
| Under 35 Years | 79 | 11.6% |
| 35 to 44 Years | 111 | 16.3% |
| 45 to 54 Years | 141 | 20.6% |
| 55 to 64 Years | 200 | 29.3% |
| 65 to 74 Years | 100 | 14.6% |
| 75 to 84 Years | 45 | 6.6% |
| 85 Years and Over | 7 | 1.0% |
| Total | 683 | 100.0% |
Housing Finances in Ziebach County
Median Income by Occupancy in Ziebach County
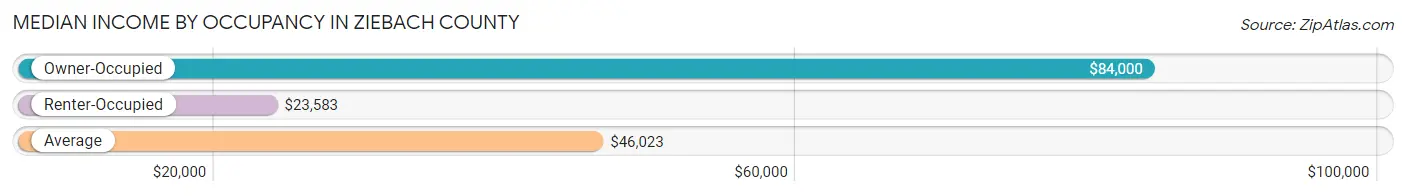
| Occupancy Type | # Households | Median Income |
| Owner-Occupied | 384 (56.2%) | $84,000 |
| Renter-Occupied | 299 (43.8%) | $23,583 |
| Average | 683 (100.0%) | $46,023 |
Occupancy by Householder Income Bracket in Ziebach County

| Income Bracket | Owner-occupied | Renter-occupied |
| Less than $5,000 | 27 (7.0%) | 34 (11.4%) |
| $5,000 to $9,999 | 0 (0.0%) | 17 (5.7%) |
| $10,000 to $14,999 | 9 (2.3%) | 42 (14.1%) |
| $15,000 to $19,999 | 21 (5.5%) | 27 (9.0%) |
| $20,000 to $24,999 | 6 (1.6%) | 38 (12.7%) |
| $25,000 to $34,999 | 40 (10.4%) | 18 (6.0%) |
| $35,000 to $49,999 | 30 (7.8%) | 64 (21.4%) |
| $50,000 to $74,999 | 51 (13.3%) | 20 (6.7%) |
| $75,000 to $99,999 | 39 (10.2%) | 24 (8.0%) |
| $100,000 to $149,999 | 59 (15.4%) | 10 (3.3%) |
| $150,000 or more | 102 (26.6%) | 5 (1.7%) |
| Total | 384 (100.0%) | 299 (100.0%) |
Monthly Housing Cost Tiers in Ziebach County

| Monthly Cost | Owner-occupied | Renter-occupied |
| Less than $300 | 45 (11.7%) | 30 (10.0%) |
| $300 to $499 | 74 (19.3%) | 33 (11.0%) |
| $500 to $799 | 132 (34.4%) | 115 (38.5%) |
| $800 to $999 | 51 (13.3%) | 47 (15.7%) |
| $1,000 to $1,499 | 76 (19.8%) | 13 (4.3%) |
| $1,500 to $1,999 | 0 (0.0%) | 0 (0.0%) |
| $2,000 to $2,499 | 6 (1.6%) | 0 (0.0%) |
| $2,500 to $2,999 | 0 (0.0%) | 0 (0.0%) |
| $3,000 or more | 0 (0.0%) | 0 (0.0%) |
| Total | 384 (100.0%) | 299 (100.0%) |
Physical Housing Characteristics in Ziebach County
Housing Structures in Ziebach County

| Structure Type | # Housing Units | % Housing Units |
| Single Unit, Detached | 388 | 56.8% |
| Single Unit, Attached | 7 | 1.0% |
| 2 Unit Apartments | 15 | 2.2% |
| 3 or 4 Unit Apartments | 7 | 1.0% |
| 5 to 9 Unit Apartments | 15 | 2.2% |
| 10 or more Apartments | 44 | 6.4% |
| Mobile Home / Other | 207 | 30.3% |
| Total | 683 | 100.0% |
Housing Structures by Occupancy in Ziebach County

| Structure Type | Owner-occupied | Renter-occupied |
| Single Unit, Detached | 196 (50.5%) | 192 (49.5%) |
| Single Unit, Attached | 0 (0.0%) | 7 (100.0%) |
| 2 Unit Apartments | 0 (0.0%) | 15 (100.0%) |
| 3 or 4 Unit Apartments | 0 (0.0%) | 7 (100.0%) |
| 5 to 9 Unit Apartments | 0 (0.0%) | 15 (100.0%) |
| 10 or more Apartments | 0 (0.0%) | 44 (100.0%) |
| Mobile Home / Other | 188 (90.8%) | 19 (9.2%) |
| Total | 384 (56.2%) | 299 (43.8%) |
Housing Structures by Number of Rooms in Ziebach County
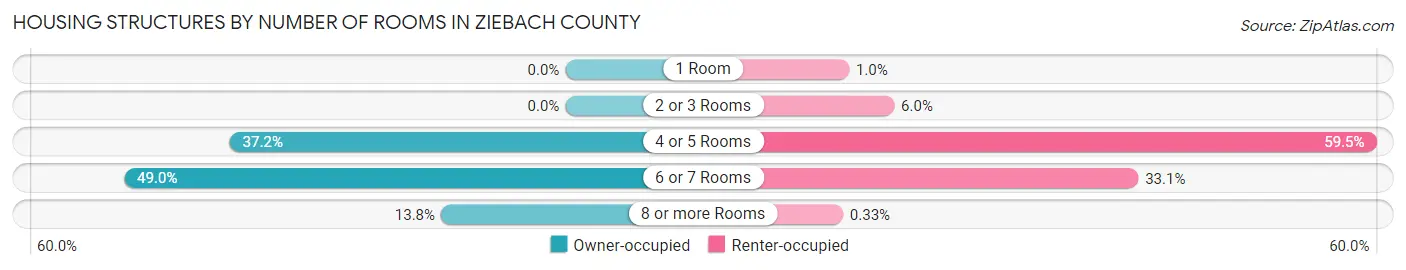
| Number of Rooms | Owner-occupied | Renter-occupied |
| 1 Room | 0 (0.0%) | 3 (1.0%) |
| 2 or 3 Rooms | 0 (0.0%) | 18 (6.0%) |
| 4 or 5 Rooms | 143 (37.2%) | 178 (59.5%) |
| 6 or 7 Rooms | 188 (49.0%) | 99 (33.1%) |
| 8 or more Rooms | 53 (13.8%) | 1 (0.3%) |
| Total | 384 (100.0%) | 299 (100.0%) |
Housing Structure by Heating Type in Ziebach County

| Heating Type | Owner-occupied | Renter-occupied |
| Utility Gas | 5 (1.3%) | 2 (0.7%) |
| Bottled, Tank, or LP Gas | 305 (79.4%) | 210 (70.2%) |
| Electricity | 52 (13.5%) | 81 (27.1%) |
| Fuel Oil or Kerosene | 4 (1.0%) | 3 (1.0%) |
| Coal or Coke | 0 (0.0%) | 0 (0.0%) |
| All other Fuels | 18 (4.7%) | 3 (1.0%) |
| No Fuel Used | 0 (0.0%) | 0 (0.0%) |
| Total | 384 (100.0%) | 299 (100.0%) |
Household Vehicle Usage in Ziebach County

| Vehicles per Household | Owner-occupied | Renter-occupied |
| No Vehicle | 13 (3.4%) | 65 (21.7%) |
| 1 Vehicle | 78 (20.3%) | 117 (39.1%) |
| 2 Vehicles | 122 (31.8%) | 100 (33.4%) |
| 3 or more Vehicles | 171 (44.5%) | 17 (5.7%) |
| Total | 384 (100.0%) | 299 (100.0%) |
Real Estate & Mortgages in Ziebach County
Real Estate and Mortgage Overview in Ziebach County
| Characteristic | Without Mortgage | With Mortgage |
| Housing Units | 285 | 99 |
| Median Property Value | $75,800 | $97,900 |
| Median Household Income | $65,893 | $32 |
| Monthly Housing Costs | $546 | $0 |
| Real Estate Taxes | $511 | $39 |
Property Value by Mortgage Status in Ziebach County

| Property Value | Without Mortgage | With Mortgage |
| Less than $50,000 | 97 (34.0%) | 11 (11.1%) |
| $50,000 to $99,999 | 60 (21.0%) | 43 (43.4%) |
| $100,000 to $299,999 | 99 (34.7%) | 40 (40.4%) |
| $300,000 to $499,999 | 25 (8.8%) | 0 (0.0%) |
| $500,000 to $749,999 | 4 (1.4%) | 5 (5.1%) |
| $750,000 to $999,999 | 0 (0.0%) | 0 (0.0%) |
| $1,000,000 or more | 0 (0.0%) | 0 (0.0%) |
| Total | 285 (100.0%) | 99 (100.0%) |
Household Income by Mortgage Status in Ziebach County
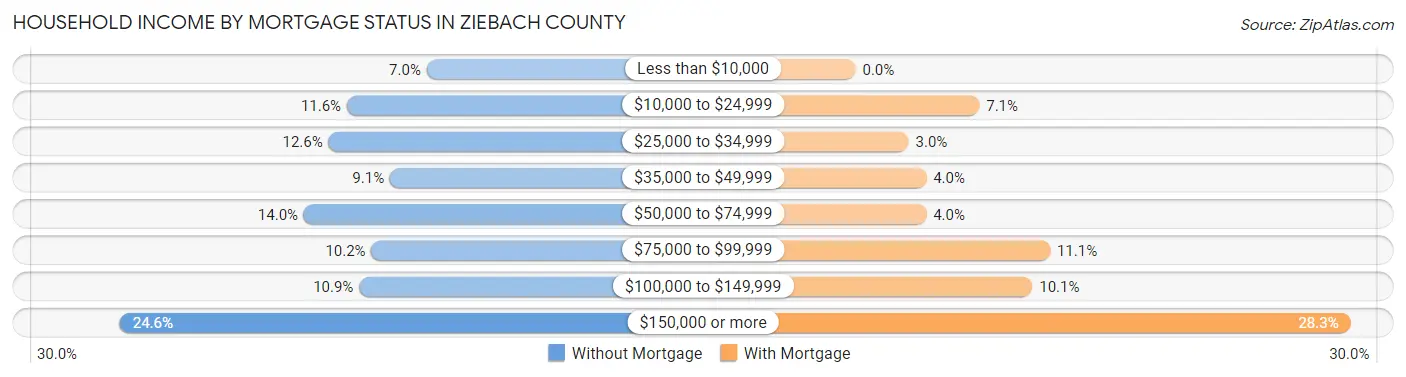
| Household Income | Without Mortgage | With Mortgage |
| Less than $10,000 | 20 (7.0%) | 0 (0.0%) |
| $10,000 to $24,999 | 33 (11.6%) | 7 (7.1%) |
| $25,000 to $34,999 | 36 (12.6%) | 3 (3.0%) |
| $35,000 to $49,999 | 26 (9.1%) | 4 (4.0%) |
| $50,000 to $74,999 | 40 (14.0%) | 4 (4.0%) |
| $75,000 to $99,999 | 29 (10.2%) | 11 (11.1%) |
| $100,000 to $149,999 | 31 (10.9%) | 10 (10.1%) |
| $150,000 or more | 70 (24.6%) | 28 (28.3%) |
| Total | 285 (100.0%) | 99 (100.0%) |
Property Value to Household Income Ratio in Ziebach County

| Value-to-Income Ratio | Without Mortgage | With Mortgage |
| Less than 2.0x | 196 (68.8%) | 118,942 (120,143.4%) |
| 2.0x to 2.9x | 14 (4.9%) | 82 (82.8%) |
| 3.0x to 3.9x | 11 (3.9%) | 0 (0.0%) |
| 4.0x or more | 48 (16.8%) | 3 (3.0%) |
| Total | 285 (100.0%) | 99 (100.0%) |
Real Estate Taxes by Mortgage Status in Ziebach County

| Property Taxes | Without Mortgage | With Mortgage |
| Less than $800 | 99 (34.7%) | 7 (7.1%) |
| $800 to $1,499 | 22 (7.7%) | 43 (43.4%) |
| $800 to $1,499 | 32 (11.2%) | 9 (9.1%) |
| Total | 285 (100.0%) | 99 (100.0%) |
Health & Disability in Ziebach County
Health Insurance Coverage by Age in Ziebach County

| Age Bracket | With Coverage | Without Coverage |
| Under 6 Years | 225 (94.9%) | 12 (5.1%) |
| 6 to 18 Years | 404 (83.8%) | 78 (16.2%) |
| 19 to 25 Years | 149 (50.7%) | 145 (49.3%) |
| 26 to 34 Years | 94 (39.2%) | 146 (60.8%) |
| 35 to 44 Years | 166 (43.7%) | 214 (56.3%) |
| 45 to 54 Years | 171 (70.1%) | 73 (29.9%) |
| 55 to 64 Years | 226 (68.9%) | 102 (31.1%) |
| 65 to 74 Years | 179 (96.2%) | 7 (3.8%) |
| 75 Years and older | 64 (100.0%) | 0 (0.0%) |
| Total | 1,678 (68.3%) | 777 (31.7%) |
Health Insurance Coverage by Citizenship Status in Ziebach County
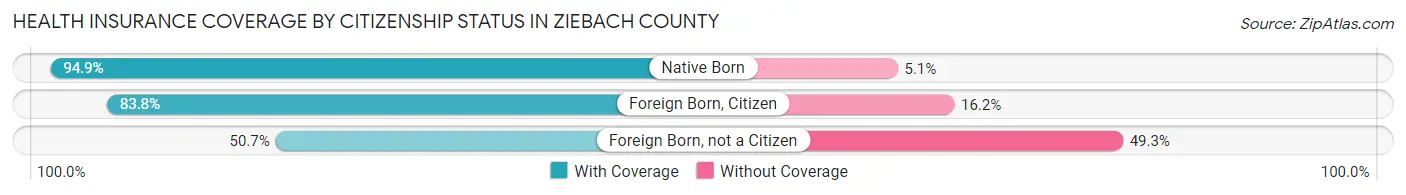
| Citizenship Status | With Coverage | Without Coverage |
| Native Born | 225 (94.9%) | 12 (5.1%) |
| Foreign Born, Citizen | 404 (83.8%) | 78 (16.2%) |
| Foreign Born, not a Citizen | 149 (50.7%) | 145 (49.3%) |
Health Insurance Coverage by Household Income in Ziebach County
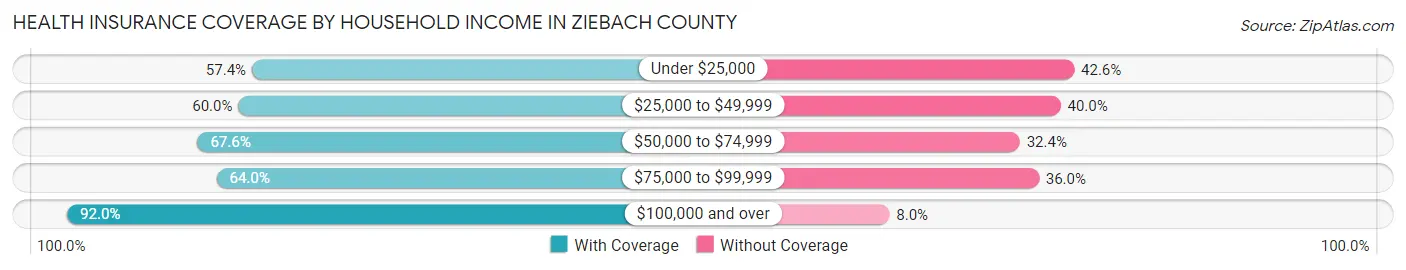
| Household Income | With Coverage | Without Coverage |
| Under $25,000 | 457 (57.4%) | 339 (42.6%) |
| $25,000 to $49,999 | 325 (60.0%) | 217 (40.0%) |
| $50,000 to $74,999 | 169 (67.6%) | 81 (32.4%) |
| $75,000 to $99,999 | 162 (64.0%) | 91 (36.0%) |
| $100,000 and over | 565 (92.0%) | 49 (8.0%) |
Public vs Private Health Insurance Coverage by Age in Ziebach County

| Age Bracket | Public Insurance | Private Insurance |
| Under 6 | 153 (64.6%) | 72 (30.4%) |
| 6 to 18 Years | 351 (72.8%) | 53 (11.0%) |
| 19 to 25 Years | 89 (30.3%) | 69 (23.5%) |
| 25 to 34 Years | 58 (24.2%) | 41 (17.1%) |
| 35 to 44 Years | 61 (16.1%) | 107 (28.2%) |
| 45 to 54 Years | 17 (7.0%) | 155 (63.5%) |
| 55 to 64 Years | 81 (24.7%) | 145 (44.2%) |
| 65 to 74 Years | 164 (88.2%) | 79 (42.5%) |
| 75 Years and over | 64 (100.0%) | 35 (54.7%) |
| Total | 1,038 (42.3%) | 756 (30.8%) |
Disability Status by Sex by Age in Ziebach County

| Age Bracket | Male | Female |
| Under 5 Years | 0 (0.0%) | 0 (0.0%) |
| 5 to 17 Years | 19 (8.9%) | 10 (3.8%) |
| 18 to 34 Years | 8 (2.7%) | 25 (8.9%) |
| 35 to 64 Years | 50 (10.2%) | 52 (11.2%) |
| 65 to 74 Years | 20 (22.7%) | 23 (23.5%) |
| 75 Years and over | 14 (50.0%) | 7 (19.4%) |
Disability Class by Sex by Age in Ziebach County
Disability Class: Hearing Difficulty
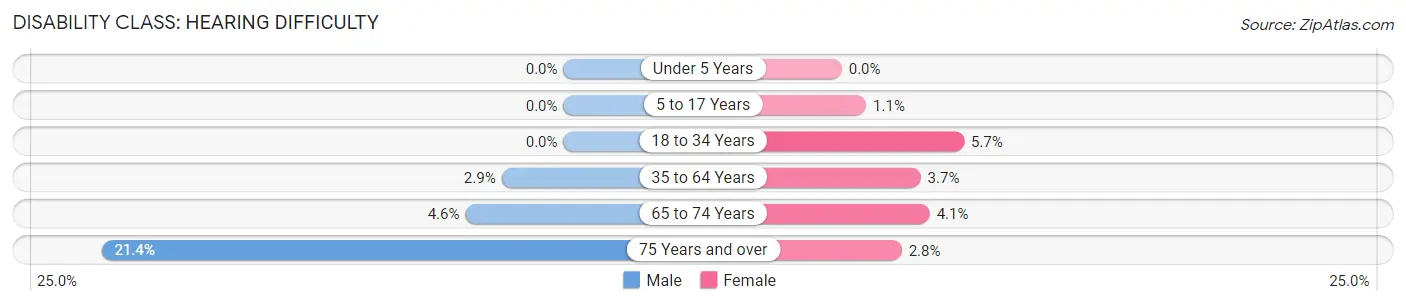
| Age Bracket | Male | Female |
| Under 5 Years | 0 (0.0%) | 0 (0.0%) |
| 5 to 17 Years | 0 (0.0%) | 3 (1.1%) |
| 18 to 34 Years | 0 (0.0%) | 16 (5.7%) |
| 35 to 64 Years | 14 (2.9%) | 17 (3.7%) |
| 65 to 74 Years | 4 (4.5%) | 4 (4.1%) |
| 75 Years and over | 6 (21.4%) | 1 (2.8%) |
Disability Class: Vision Difficulty

| Age Bracket | Male | Female |
| Under 5 Years | 0 (0.0%) | 0 (0.0%) |
| 5 to 17 Years | 3 (1.4%) | 0 (0.0%) |
| 18 to 34 Years | 0 (0.0%) | 16 (5.7%) |
| 35 to 64 Years | 6 (1.2%) | 6 (1.3%) |
| 65 to 74 Years | 0 (0.0%) | 7 (7.1%) |
| 75 Years and over | 0 (0.0%) | 0 (0.0%) |
Disability Class: Cognitive Difficulty
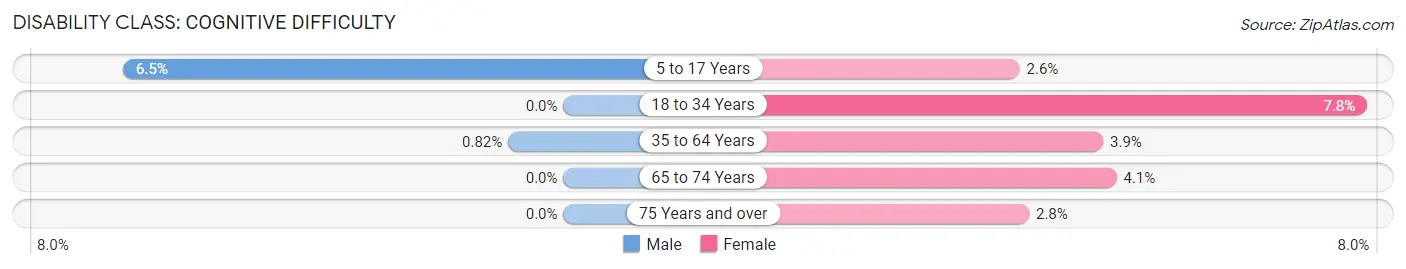
| Age Bracket | Male | Female |
| 5 to 17 Years | 14 (6.5%) | 7 (2.6%) |
| 18 to 34 Years | 0 (0.0%) | 22 (7.8%) |
| 35 to 64 Years | 4 (0.8%) | 18 (3.9%) |
| 65 to 74 Years | 0 (0.0%) | 4 (4.1%) |
| 75 Years and over | 0 (0.0%) | 1 (2.8%) |
Disability Class: Ambulatory Difficulty

| Age Bracket | Male | Female |
| 5 to 17 Years | 0 (0.0%) | 2 (0.7%) |
| 18 to 34 Years | 8 (2.7%) | 5 (1.8%) |
| 35 to 64 Years | 40 (8.2%) | 21 (4.5%) |
| 65 to 74 Years | 16 (18.2%) | 19 (19.4%) |
| 75 Years and over | 8 (28.6%) | 7 (19.4%) |
Disability Class: Self-Care Difficulty

| Age Bracket | Male | Female |
| 5 to 17 Years | 5 (2.3%) | 2 (0.7%) |
| 18 to 34 Years | 0 (0.0%) | 8 (2.8%) |
| 35 to 64 Years | 4 (0.8%) | 2 (0.4%) |
| 65 to 74 Years | 6 (6.8%) | 9 (9.2%) |
| 75 Years and over | 8 (28.6%) | 1 (2.8%) |
Technology Access in Ziebach County
Computing Device Access in Ziebach County

| Device Type | # Households | % Households |
| Desktop or Laptop | 433 | 63.4% |
| Smartphone | 445 | 65.1% |
| Tablet | 187 | 27.4% |
| No Computing Device | 146 | 21.4% |
| Total | 683 | 100.0% |
Internet Access in Ziebach County
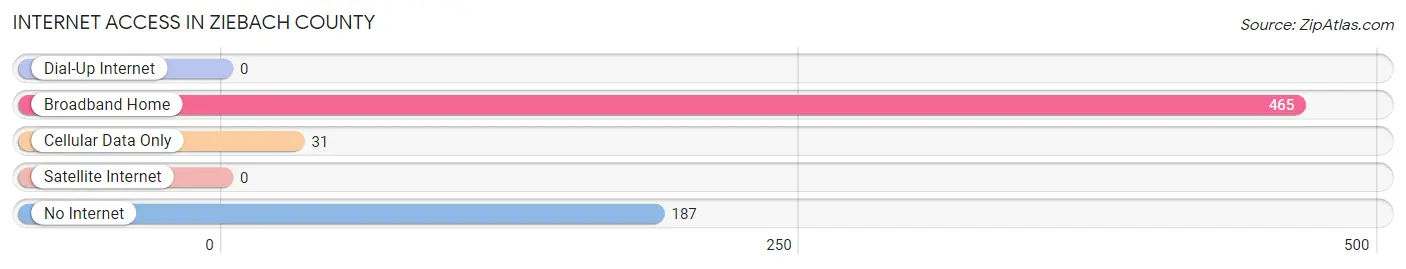
| Internet Type | # Households | % Households |
| Dial-Up Internet | 0 | 0.0% |
| Broadband Home | 465 | 68.1% |
| Cellular Data Only | 31 | 4.5% |
| Satellite Internet | 0 | 0.0% |
| No Internet | 187 | 27.4% |
| Total | 683 | 100.0% |
Ziebach County Summary
Ziebach County is located in the southwestern corner of South Dakota, and is the least populous county in the state. It is bordered by Corson County to the north, Dewey County to the east, and Haakon County to the south. The county seat is Dupree, and the county was named after Frank M. Ziebach, a newspaper editor and politician.
Geography
Ziebach County covers an area of 1,845 square miles, making it the largest county in South Dakota. The terrain is mostly rolling hills, with some flat areas in the east. The Cheyenne River runs through the county, and there are several small lakes and ponds scattered throughout. The county is mostly rural, with the majority of the population living in small towns and rural areas.
The climate of Ziebach County is semi-arid, with hot summers and cold winters. The average annual precipitation is around 16 inches, and the average annual temperature is around 50 degrees Fahrenheit.
Demographics
As of the 2010 census, the population of Ziebach County was 2,890. The population density was 1.6 people per square mile. The racial makeup of the county was 94.3% White, 0.2% African American, 2.7% Native American, 0.2% Asian, 0.1% Pacific Islander, 0.7% from other races, and 1.7% from two or more races. Hispanic or Latino of any race were 2.2% of the population.
The median income for a household in the county was $30,938, and the median income for a family was $35,625. The per capita income for the county was $14,945. About 18.2% of families and 22.2% of the population were below the poverty line, including 28.2% of those under age 18 and 16.2% of those age 65 or over.
Economy
The economy of Ziebach County is largely based on agriculture. The county is home to several large farms, and the main crops grown are wheat, corn, and soybeans. Cattle ranching is also an important part of the local economy.
The county also has a small manufacturing sector, with several small factories producing a variety of products. The largest employer in the county is the Dupree School District, which employs over 200 people.
The unemployment rate in Ziebach County is higher than the national average, and the poverty rate is also higher than the national average. The median household income is lower than the national average, and the per capita income is also lower than the national average.
Conclusion
Ziebach County is a rural county located in the southwestern corner of South Dakota. It is the least populous county in the state, and the economy is largely based on agriculture. The county has a semi-arid climate, and the population is mostly white. The median household income is lower than the national average, and the poverty rate is higher than the national average. Despite these challenges, Ziebach County is a beautiful and unique part of South Dakota.
Common Questions
What is Per Capita Income in Ziebach County?
Per Capita income in Ziebach County is $23,657.
What is the Median Family Income in Ziebach County?
Median Family Income in Ziebach County is $47,500.
What is the Median Household income in Ziebach County?
Median Household Income in Ziebach County is $46,023.
What is Income or Wage Gap in Ziebach County?
Income or Wage Gap in Ziebach County is 16.0%.
Women in Ziebach County earn 84.0 cents for every dollar earned by a man.
What is Family Income Deficit in Ziebach County?
Family Income Deficit in Ziebach County is $13,688.
Families that are below poverty line in Ziebach County earn $13,688 less on average than the poverty threshold level.
What is Inequality or Gini Index in Ziebach County?
Inequality or Gini Index in Ziebach County is 0.55.
What is the Total Population of Ziebach County?
Total Population of Ziebach County is 2,455.
What is the Total Male Population of Ziebach County?
Total Male Population of Ziebach County is 1,227.
What is the Total Female Population of Ziebach County?
Total Female Population of Ziebach County is 1,228.
What is the Ratio of Males per 100 Females in Ziebach County?
There are 99.92 Males per 100 Females in Ziebach County.
What is the Ratio of Females per 100 Males in Ziebach County?
There are 100.08 Females per 100 Males in Ziebach County.
What is the Median Population Age in Ziebach County?
Median Population Age in Ziebach County is 34.3 Years.
What is the Average Family Size in Ziebach County
Average Family Size in Ziebach County is 4.0 People.
What is the Average Household Size in Ziebach County
Average Household Size in Ziebach County is 3.6 People.
How Large is the Labor Force in Ziebach County?
There are 1,219 People in the Labor Forcein in Ziebach County.
What is the Percentage of People in the Labor Force in Ziebach County?
65.2% of People are in the Labor Force in Ziebach County.
What is the Unemployment Rate in Ziebach County?
Unemployment Rate in Ziebach County is 32.0%.