Gregory County, SD Map & Demographics
Gregory County Overview
$31,505
PER CAPITA INCOME
$73,068
AVG FAMILY INCOME
$48,272
AVG HOUSEHOLD INCOME
17.3%
WAGE / INCOME GAP [ % ]
82.7¢/ $1
WAGE / INCOME GAP [ $ ]
0.46
INEQUALITY / GINI INDEX
3,983
TOTAL POPULATION
2,063
MALE POPULATION
1,920
FEMALE POPULATION
107.45
MALES / 100 FEMALES
93.07
FEMALES / 100 MALES
45.7
MEDIAN AGE
3.4
AVG FAMILY SIZE
2.5
AVG HOUSEHOLD SIZE
1,984
LABOR FORCE [ PEOPLE ]
63.2%
PERCENT IN LABOR FORCE
2.6%
UNEMPLOYMENT RATE
Gregory County Area Codes
Income in Gregory County
Income Overview in Gregory County
Per Capita Income in Gregory County is $31,505, while median incomes of families and households are $73,068 and $48,272 respectively.
| Characteristic | Number | Measure |
| Per Capita Income | 3,983 | $31,505 |
| Median Family Income | 934 | $73,068 |
| Mean Family Income | 934 | $90,254 |
| Median Household Income | 1,593 | $48,272 |
| Mean Household Income | 1,593 | $70,645 |
| Income Deficit | 934 | $0 |
| Wage / Income Gap (%) | 3,983 | 17.28% |
| Wage / Income Gap ($) | 3,983 | 82.72¢ per $1 |
| Gini / Inequality Index | 3,983 | 0.46 |
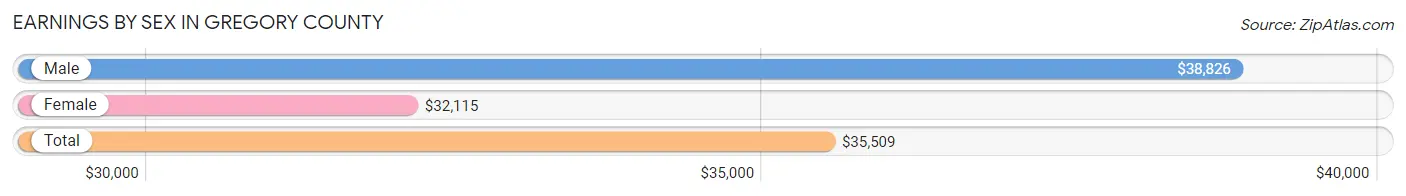
Earnings by Sex in Gregory County
Average Earnings in Gregory County are $35,509, $38,826 for men and $32,115 for women, a difference of 17.3%.
| Sex | Number | Average Earnings |
| Male | 1,113 (53.4%) | $38,826 |
| Female | 970 (46.6%) | $32,115 |
| Total | 2,083 (100.0%) | $35,509 |
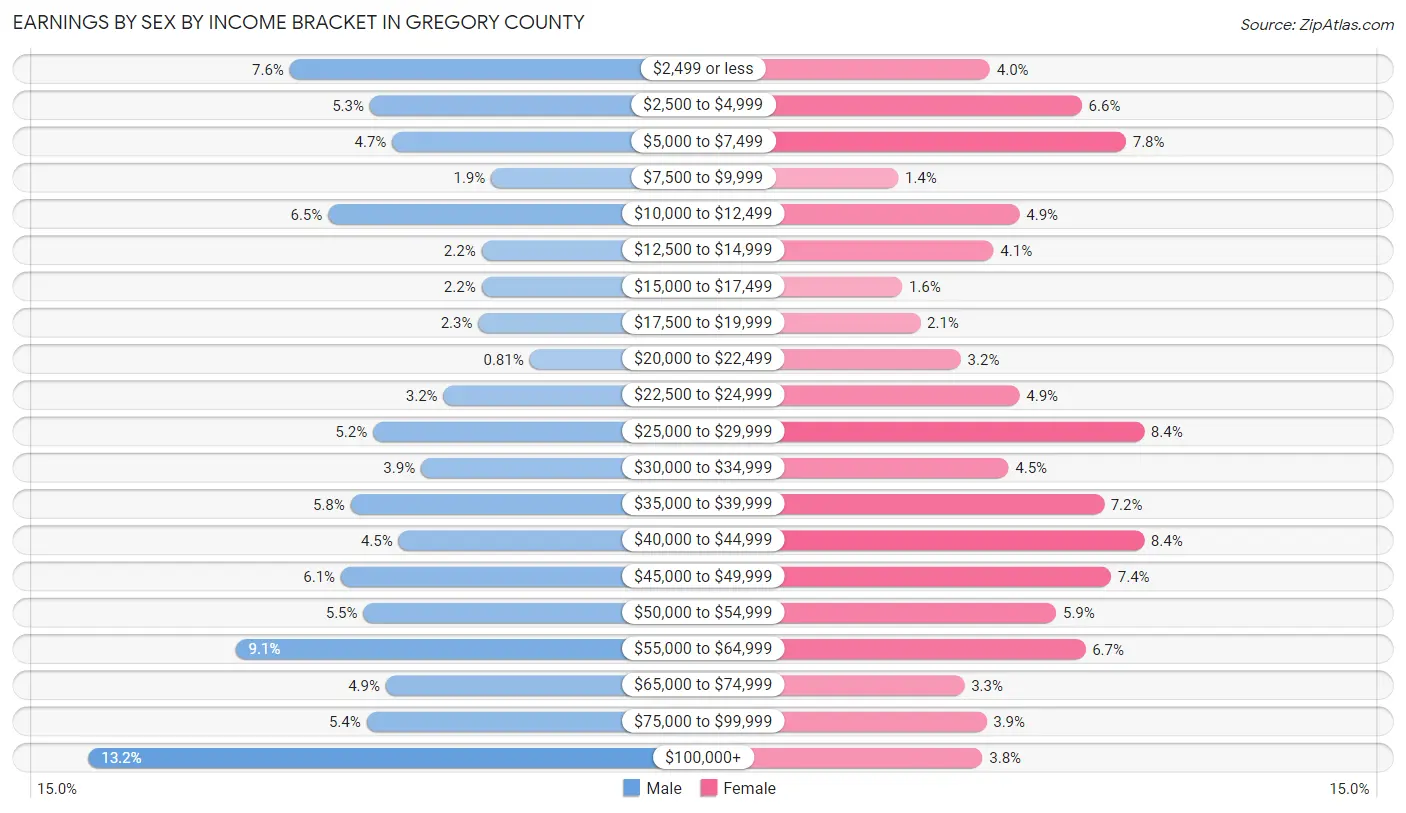
Earnings by Sex by Income Bracket in Gregory County
The most common earnings brackets in Gregory County are $100,000+ for men (147 | 13.2%) and $25,000 to $29,999 for women (81 | 8.4%).
| Income | Male | Female |
| $2,499 or less | 84 (7.5%) | 39 (4.0%) |
| $2,500 to $4,999 | 59 (5.3%) | 64 (6.6%) |
| $5,000 to $7,499 | 52 (4.7%) | 76 (7.8%) |
| $7,500 to $9,999 | 21 (1.9%) | 14 (1.4%) |
| $10,000 to $12,499 | 72 (6.5%) | 47 (4.9%) |
| $12,500 to $14,999 | 24 (2.2%) | 40 (4.1%) |
| $15,000 to $17,499 | 24 (2.2%) | 15 (1.5%) |
| $17,500 to $19,999 | 25 (2.2%) | 20 (2.1%) |
| $20,000 to $22,499 | 9 (0.8%) | 31 (3.2%) |
| $22,500 to $24,999 | 36 (3.2%) | 47 (4.9%) |
| $25,000 to $29,999 | 58 (5.2%) | 81 (8.4%) |
| $30,000 to $34,999 | 43 (3.9%) | 44 (4.5%) |
| $35,000 to $39,999 | 65 (5.8%) | 70 (7.2%) |
| $40,000 to $44,999 | 50 (4.5%) | 81 (8.4%) |
| $45,000 to $49,999 | 68 (6.1%) | 72 (7.4%) |
| $50,000 to $54,999 | 61 (5.5%) | 57 (5.9%) |
| $55,000 to $64,999 | 101 (9.1%) | 65 (6.7%) |
| $65,000 to $74,999 | 54 (4.9%) | 32 (3.3%) |
| $75,000 to $99,999 | 60 (5.4%) | 38 (3.9%) |
| $100,000+ | 147 (13.2%) | 37 (3.8%) |
| Total | 1,113 (100.0%) | 970 (100.0%) |
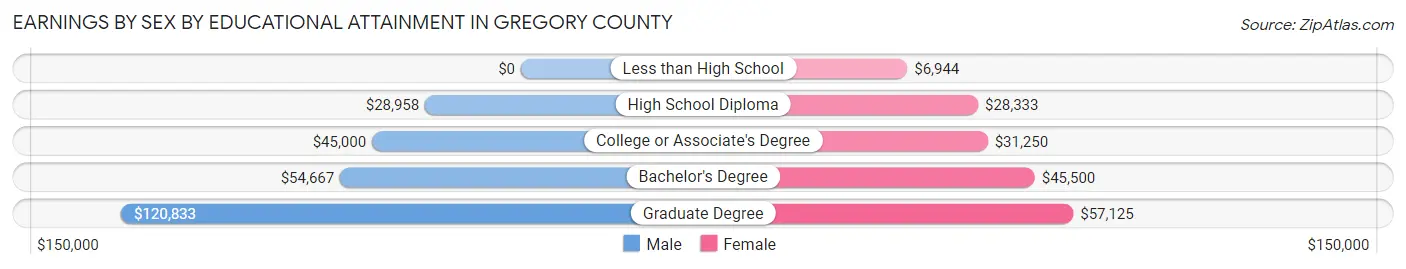
Earnings by Sex by Educational Attainment in Gregory County
Average earnings in Gregory County are $42,685 for men and $35,074 for women, a difference of 17.8%. Men with an educational attainment of graduate degree enjoy the highest average annual earnings of $120,833, while those with high school diploma education earn the least with $28,958. Women with an educational attainment of graduate degree earn the most with the average annual earnings of $57,125, while those with less than high school education have the smallest earnings of $6,944.
| Educational Attainment | Male Income | Female Income |
| Less than High School | - | - |
| High School Diploma | $28,958 | $28,333 |
| College or Associate's Degree | $45,000 | $31,250 |
| Bachelor's Degree | $54,667 | $45,500 |
| Graduate Degree | $120,833 | $57,125 |
| Total | $42,685 | $35,074 |
Family Income in Gregory County
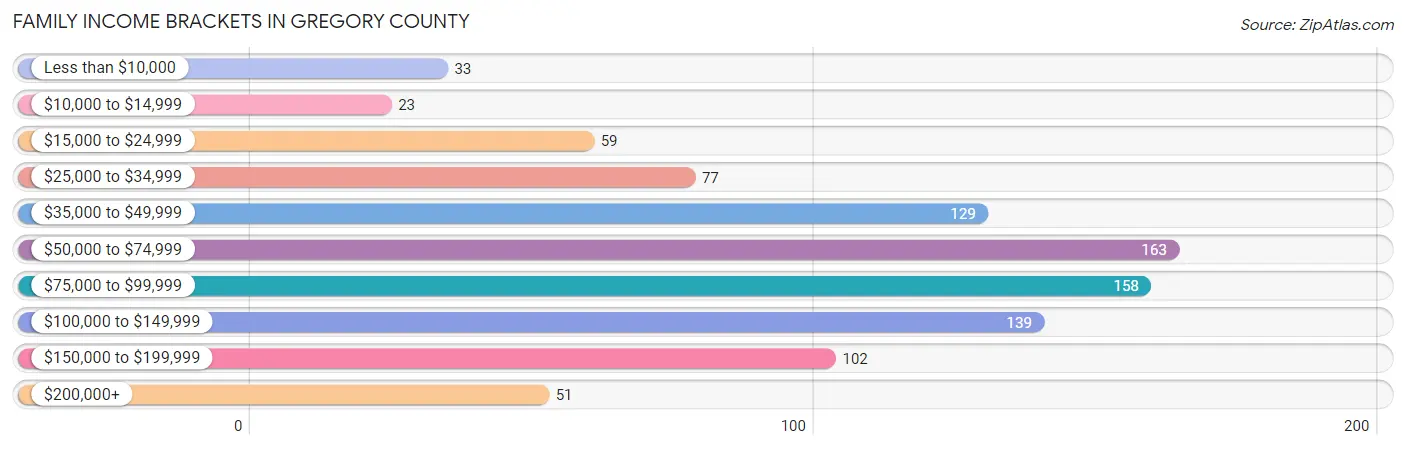
Family Income Brackets in Gregory County
According to the Gregory County family income data, there are 163 families falling into the $50,000 to $74,999 income range, which is the most common income bracket and makes up 17.4% of all families. Conversely, the $10,000 to $14,999 income bracket is the least frequent group with only 23 families (2.5%) belonging to this category.
| Income Bracket | # Families | % Families |
| Less than $10,000 | 33 | 3.5% |
| $10,000 to $14,999 | 23 | 2.5% |
| $15,000 to $24,999 | 59 | 6.3% |
| $25,000 to $34,999 | 77 | 8.2% |
| $35,000 to $49,999 | 129 | 13.8% |
| $50,000 to $74,999 | 163 | 17.5% |
| $75,000 to $99,999 | 158 | 16.9% |
| $100,000 to $149,999 | 139 | 14.9% |
| $150,000 to $199,999 | 102 | 10.9% |
| $200,000+ | 51 | 5.5% |
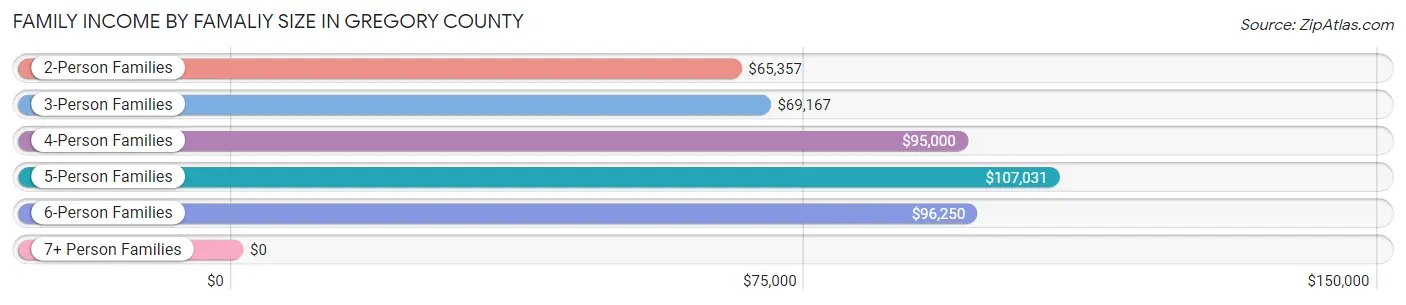
Family Income by Famaliy Size in Gregory County
5-person families (69 | 7.4%) account for the highest median family income in Gregory County with $107,031 per family, while 2-person families (550 | 58.9%) have the highest median income of $32,678 per family member.
| Income Bracket | # Families | Median Income |
| 2-Person Families | 550 (58.9%) | $65,357 |
| 3-Person Families | 156 (16.7%) | $69,167 |
| 4-Person Families | 134 (14.3%) | $95,000 |
| 5-Person Families | 69 (7.4%) | $107,031 |
| 6-Person Families | 25 (2.7%) | $96,250 |
| 7+ Person Families | 0 (0.0%) | $0 |
| Total | 934 (100.0%) | $73,068 |
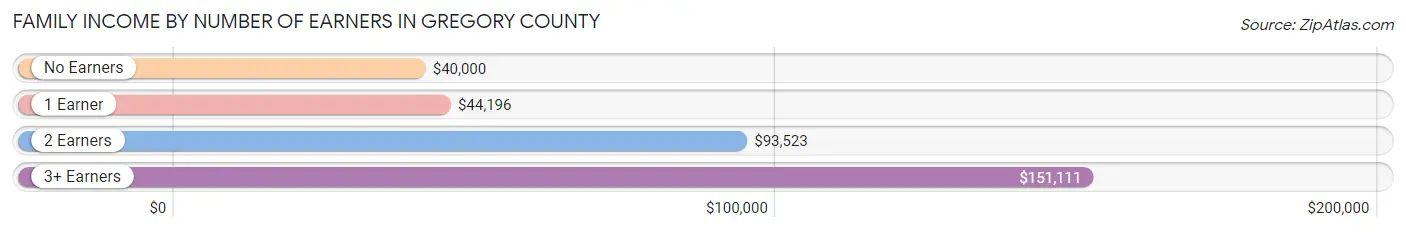
Family Income by Number of Earners in Gregory County
The median family income in Gregory County is $73,068, with families comprising 3+ earners (96) having the highest median family income of $151,111, while families with no earners (172) have the lowest median family income of $40,000, accounting for 10.3% and 18.4% of families, respectively.
| Number of Earners | # Families | Median Income |
| No Earners | 172 (18.4%) | $40,000 |
| 1 Earner | 201 (21.5%) | $44,196 |
| 2 Earners | 465 (49.8%) | $93,523 |
| 3+ Earners | 96 (10.3%) | $151,111 |
| Total | 934 (100.0%) | $73,068 |
Household Income in Gregory County
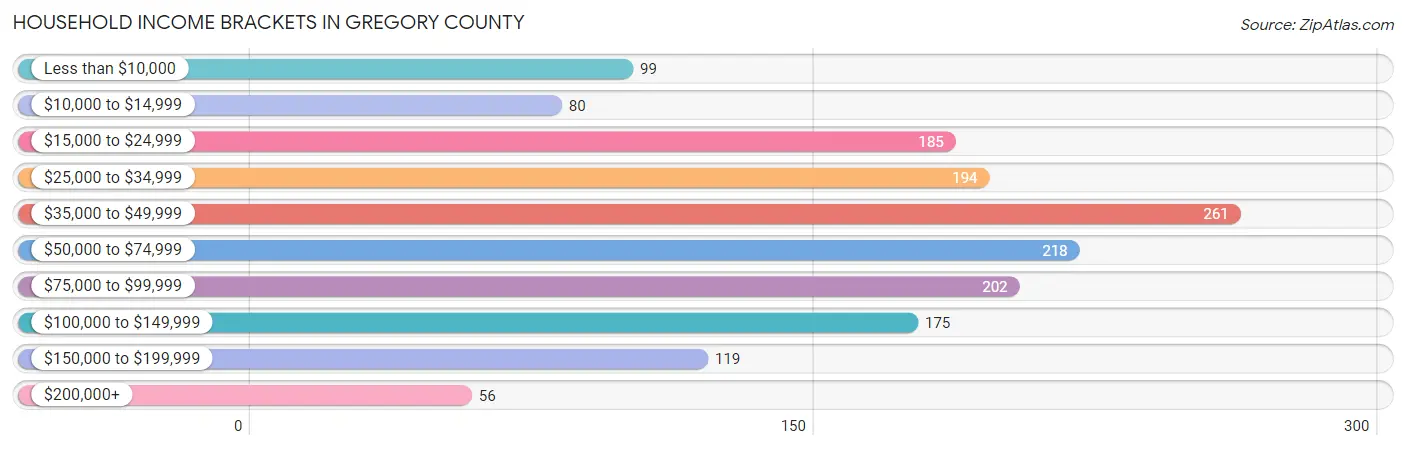
Household Income Brackets in Gregory County
With 261 households falling in the category, the $35,000 to $49,999 income range is the most frequent in Gregory County, accounting for 16.4% of all households. In contrast, only 56 households (3.5%) fall into the $200,000+ income bracket, making it the least populous group.
| Income Bracket | # Households | % Households |
| Less than $10,000 | 99 | 6.2% |
| $10,000 to $14,999 | 80 | 5.0% |
| $15,000 to $24,999 | 185 | 11.6% |
| $25,000 to $34,999 | 194 | 12.2% |
| $35,000 to $49,999 | 261 | 16.4% |
| $50,000 to $74,999 | 218 | 13.7% |
| $75,000 to $99,999 | 202 | 12.7% |
| $100,000 to $149,999 | 175 | 11.0% |
| $150,000 to $199,999 | 119 | 7.5% |
| $200,000+ | 56 | 3.5% |
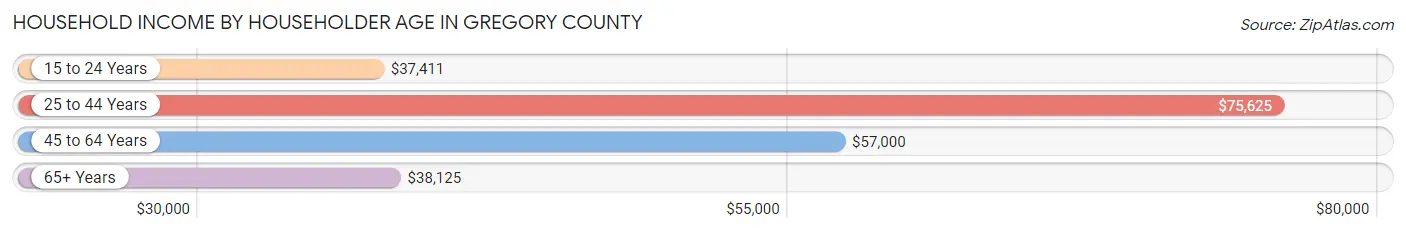
Household Income by Householder Age in Gregory County
The median household income in Gregory County is $48,272, with the highest median household income of $75,625 found in the 25 to 44 years age bracket for the primary householder. A total of 363 households (22.8%) fall into this category. Meanwhile, the 15 to 24 years age bracket for the primary householder has the lowest median household income of $37,411, with 43 households (2.7%) in this group.
| Income Bracket | # Households | Median Income |
| 15 to 24 Years | 43 (2.7%) | $37,411 |
| 25 to 44 Years | 363 (22.8%) | $75,625 |
| 45 to 64 Years | 558 (35.0%) | $57,000 |
| 65+ Years | 629 (39.5%) | $38,125 |
| Total | 1,593 (100.0%) | $48,272 |
Poverty in Gregory County
Income Below Poverty by Sex and Age in Gregory County
With 14.0% poverty level for males and 11.6% for females among the residents of Gregory County, under 5 year old males and 15 year old females are the most vulnerable to poverty, with 56 males (36.8%) and 11 females (22.0%) in their respective age groups living below the poverty level.
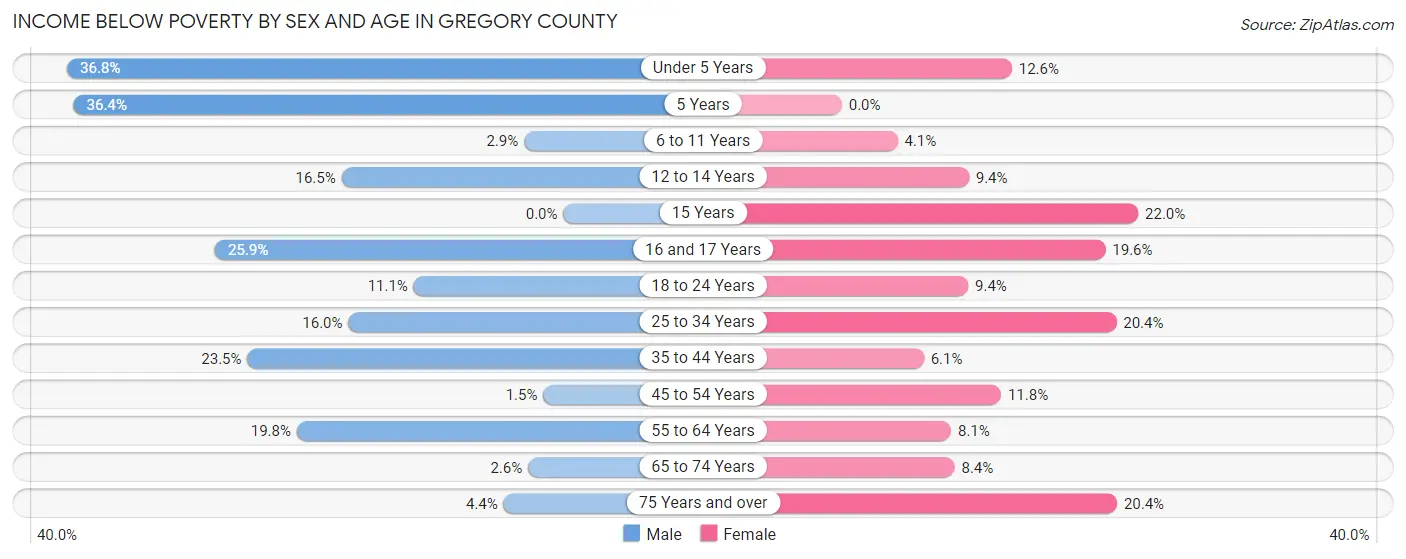
| Age Bracket | Male | Female |
| Under 5 Years | 56 (36.8%) | 13 (12.6%) |
| 5 Years | 20 (36.4%) | 0 (0.0%) |
| 6 to 11 Years | 4 (2.9%) | 5 (4.1%) |
| 12 to 14 Years | 14 (16.5%) | 5 (9.4%) |
| 15 Years | 0 (0.0%) | 11 (22.0%) |
| 16 and 17 Years | 15 (25.9%) | 9 (19.6%) |
| 18 to 24 Years | 15 (11.1%) | 12 (9.4%) |
| 25 to 34 Years | 30 (16.0%) | 32 (20.4%) |
| 35 to 44 Years | 57 (23.5%) | 11 (6.1%) |
| 45 to 54 Years | 3 (1.5%) | 26 (11.8%) |
| 55 to 64 Years | 56 (19.8%) | 24 (8.1%) |
| 65 to 74 Years | 7 (2.6%) | 22 (8.4%) |
| 75 Years and over | 8 (4.4%) | 48 (20.4%) |
| Total | 285 (14.0%) | 218 (11.6%) |
Income Above Poverty by Sex and Age in Gregory County
According to the poverty statistics in Gregory County, males aged 15 years and females aged 5 years are the age groups that are most secure financially, with 100.0% of males and 100.0% of females in these age groups living above the poverty line.
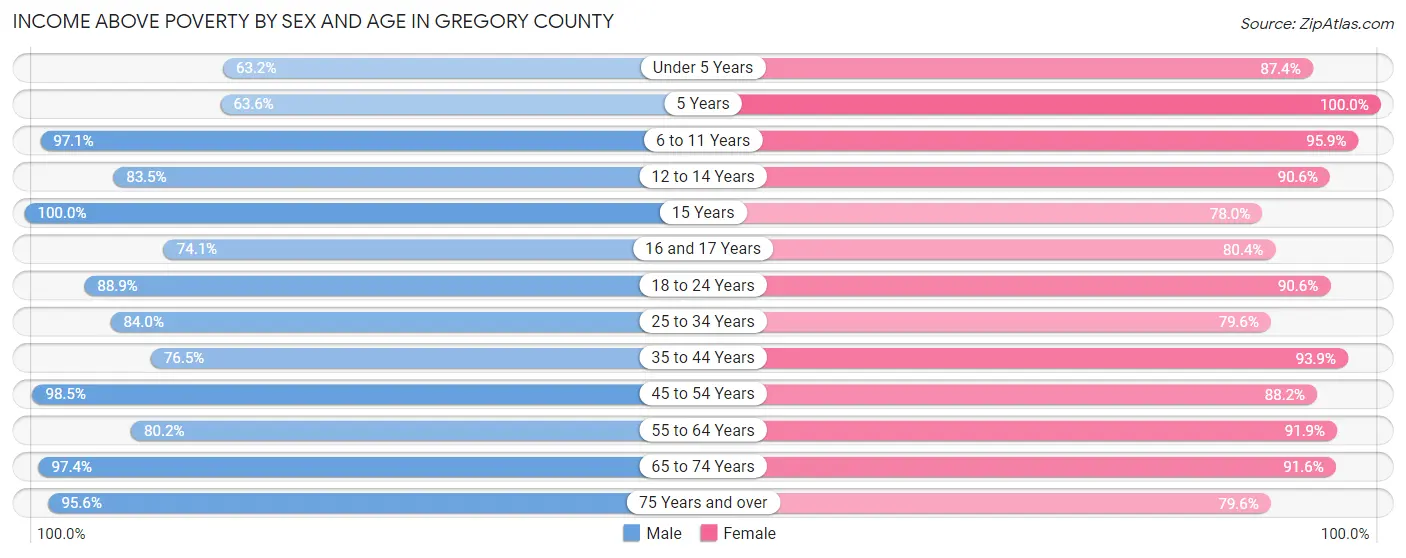
| Age Bracket | Male | Female |
| Under 5 Years | 96 (63.2%) | 90 (87.4%) |
| 5 Years | 35 (63.6%) | 25 (100.0%) |
| 6 to 11 Years | 133 (97.1%) | 116 (95.9%) |
| 12 to 14 Years | 71 (83.5%) | 48 (90.6%) |
| 15 Years | 59 (100.0%) | 39 (78.0%) |
| 16 and 17 Years | 43 (74.1%) | 37 (80.4%) |
| 18 to 24 Years | 120 (88.9%) | 116 (90.6%) |
| 25 to 34 Years | 158 (84.0%) | 125 (79.6%) |
| 35 to 44 Years | 186 (76.5%) | 170 (93.9%) |
| 45 to 54 Years | 198 (98.5%) | 194 (88.2%) |
| 55 to 64 Years | 227 (80.2%) | 272 (91.9%) |
| 65 to 74 Years | 260 (97.4%) | 241 (91.6%) |
| 75 Years and over | 172 (95.6%) | 187 (79.6%) |
| Total | 1,758 (86.1%) | 1,660 (88.4%) |
Income Below Poverty Among Married-Couple Families in Gregory County
The poverty statistics for married-couple families in Gregory County show that 4.4% or 35 of the total 799 families live below the poverty line. Families with 1 or 2 children have the highest poverty rate of 6.5%, comprising of 13 families. On the other hand, families with 3 or 4 children have the lowest poverty rate of 3.0%, which includes 2 families.
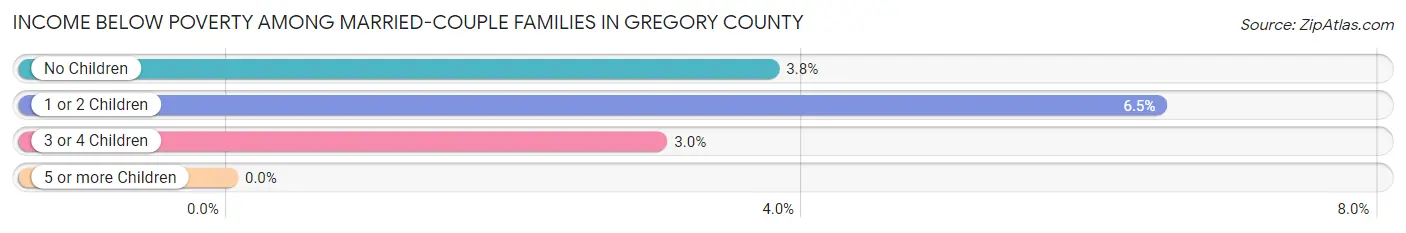
| Children | Above Poverty | Below Poverty |
| No Children | 511 (96.2%) | 20 (3.8%) |
| 1 or 2 Children | 188 (93.5%) | 13 (6.5%) |
| 3 or 4 Children | 65 (97.0%) | 2 (3.0%) |
| 5 or more Children | 0 (0.0%) | 0 (0.0%) |
| Total | 764 (95.6%) | 35 (4.4%) |
Income Below Poverty Among Single-Parent Households in Gregory County
According to the poverty data in Gregory County, 18.6% or 8 single-father households and 44.6% or 41 single-mother households are living below the poverty line. Among single-father households, those with 3 or 4 children have the highest poverty rate, with 8 households (88.9%) experiencing poverty. Likewise, among single-mother households, those with 1 or 2 children have the highest poverty rate, with 26 households (52.0%) falling below the poverty line.
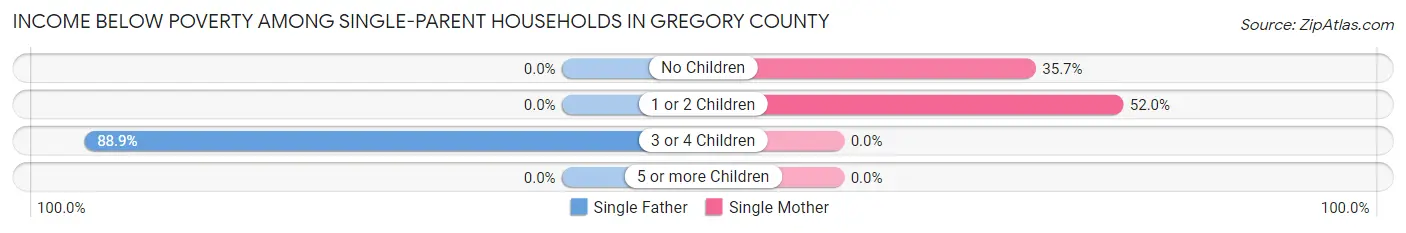
| Children | Single Father | Single Mother |
| No Children | 0 (0.0%) | 15 (35.7%) |
| 1 or 2 Children | 0 (0.0%) | 26 (52.0%) |
| 3 or 4 Children | 8 (88.9%) | 0 (0.0%) |
| 5 or more Children | 0 (0.0%) | 0 (0.0%) |
| Total | 8 (18.6%) | 41 (44.6%) |
Income Below Poverty Among Married-Couple vs Single-Parent Households in Gregory County
The poverty data for Gregory County shows that 35 of the married-couple family households (4.4%) and 49 of the single-parent households (36.3%) are living below the poverty level. Within the married-couple family households, those with 1 or 2 children have the highest poverty rate, with 13 households (6.5%) falling below the poverty line. Among the single-parent households, those with 3 or 4 children have the highest poverty rate, with 8 household (88.9%) living below poverty.
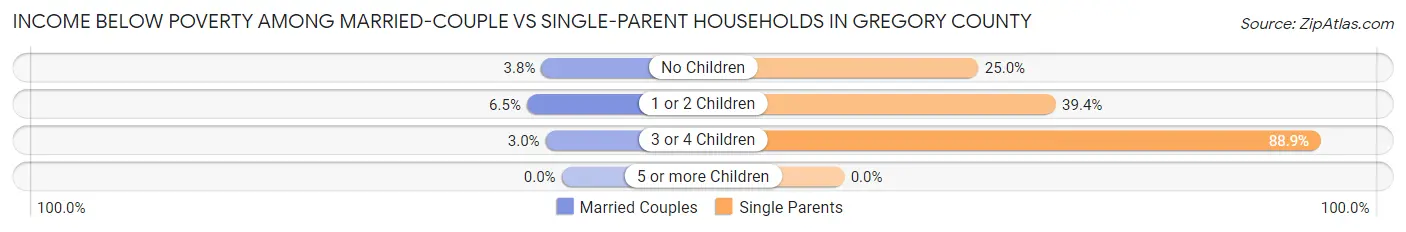
| Children | Married-Couple Families | Single-Parent Households |
| No Children | 20 (3.8%) | 15 (25.0%) |
| 1 or 2 Children | 13 (6.5%) | 26 (39.4%) |
| 3 or 4 Children | 2 (3.0%) | 8 (88.9%) |
| 5 or more Children | 0 (0.0%) | 0 (0.0%) |
| Total | 35 (4.4%) | 49 (36.3%) |
Race in Gregory County
The most populous races in Gregory County are White / Caucasian (3,523 | 88.4%), Native / Alaskan (224 | 5.6%), and Two or more Races (187 | 4.7%).
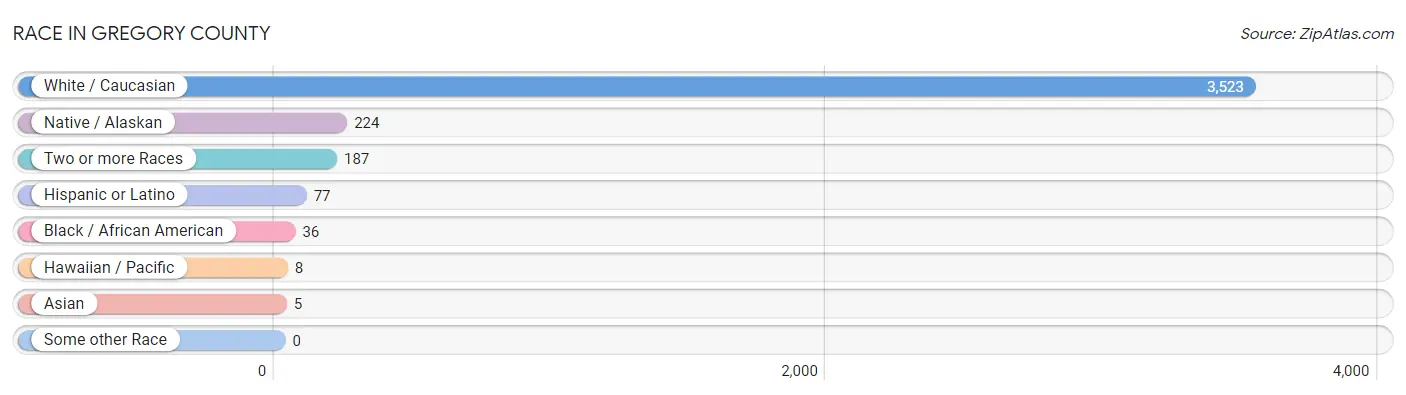
| Race | # Population | % Population |
| Asian | 5 | 0.1% |
| Black / African American | 36 | 0.9% |
| Hawaiian / Pacific | 8 | 0.2% |
| Hispanic or Latino | 77 | 1.9% |
| Native / Alaskan | 224 | 5.6% |
| White / Caucasian | 3,523 | 88.4% |
| Two or more Races | 187 | 4.7% |
| Some other Race | 0 | 0.0% |
| Total | 3,983 | 100.0% |
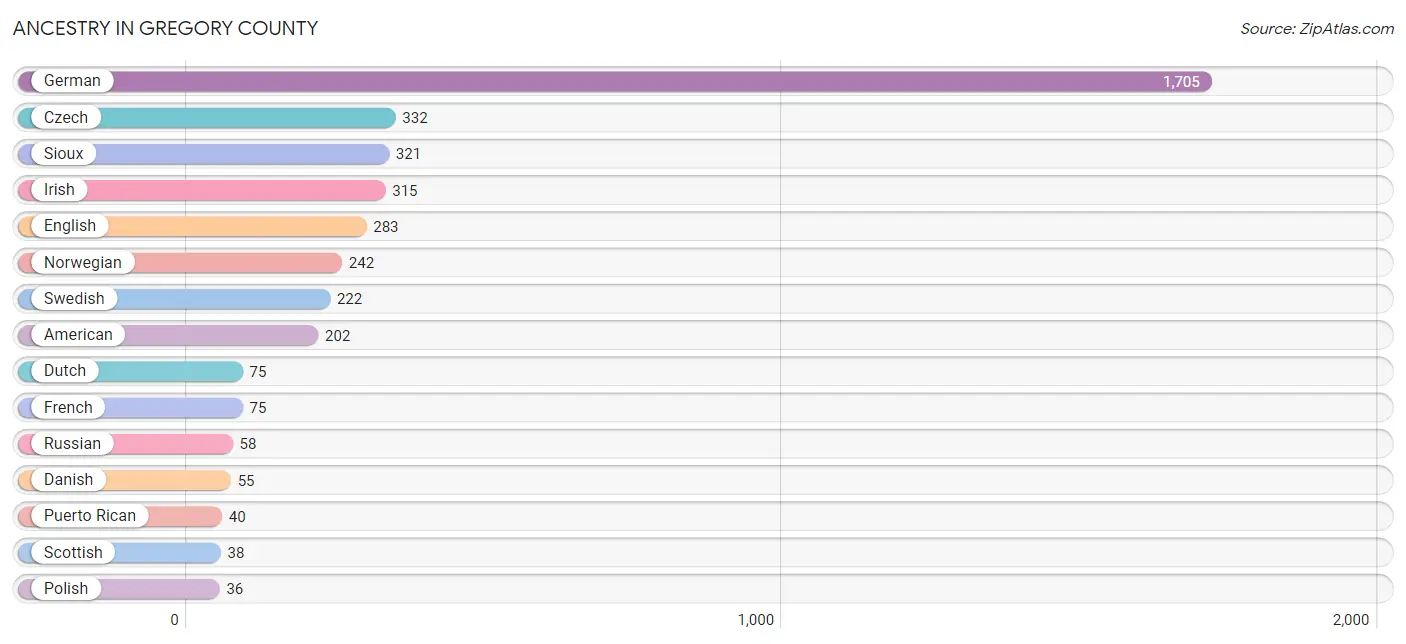
Ancestry in Gregory County
The most populous ancestries reported in Gregory County are German (1,705 | 42.8%), Czech (332 | 8.3%), Sioux (321 | 8.1%), Irish (315 | 7.9%), and English (283 | 7.1%), together accounting for 74.2% of all Gregory County residents.
| Ancestry | # Population | % Population |
| American | 202 | 5.1% |
| Austrian | 3 | 0.1% |
| Belgian | 3 | 0.1% |
| Bhutanese | 2 | 0.1% |
| British | 23 | 0.6% |
| Burmese | 17 | 0.4% |
| Cajun | 1 | 0.0% |
| Central American | 33 | 0.8% |
| Central American Indian | 6 | 0.2% |
| Cherokee | 6 | 0.2% |
| Czech | 332 | 8.3% |
| Czechoslovakian | 34 | 0.9% |
| Danish | 55 | 1.4% |
| Dutch | 75 | 1.9% |
| Eastern European | 8 | 0.2% |
| English | 283 | 7.1% |
| European | 21 | 0.5% |
| Fijian | 8 | 0.2% |
| French | 75 | 1.9% |
| French American Indian | 3 | 0.1% |
| French Canadian | 28 | 0.7% |
| German | 1,705 | 42.8% |
| Guatemalan | 33 | 0.8% |
| Hungarian | 2 | 0.1% |
| Irish | 315 | 7.9% |
| Italian | 3 | 0.1% |
| Korean | 14 | 0.4% |
| Northern European | 4 | 0.1% |
| Norwegian | 242 | 6.1% |
| Pennsylvania German | 3 | 0.1% |
| Polish | 36 | 0.9% |
| Portuguese | 2 | 0.1% |
| Puerto Rican | 40 | 1.0% |
| Russian | 58 | 1.5% |
| Scandinavian | 14 | 0.4% |
| Scotch-Irish | 20 | 0.5% |
| Scottish | 38 | 0.9% |
| Sioux | 321 | 8.1% |
| Spanish | 4 | 0.1% |
| Sri Lankan | 2 | 0.1% |
| Swedish | 222 | 5.6% |
| Swiss | 31 | 0.8% |
| Welsh | 12 | 0.3% | View All 43 Rows |
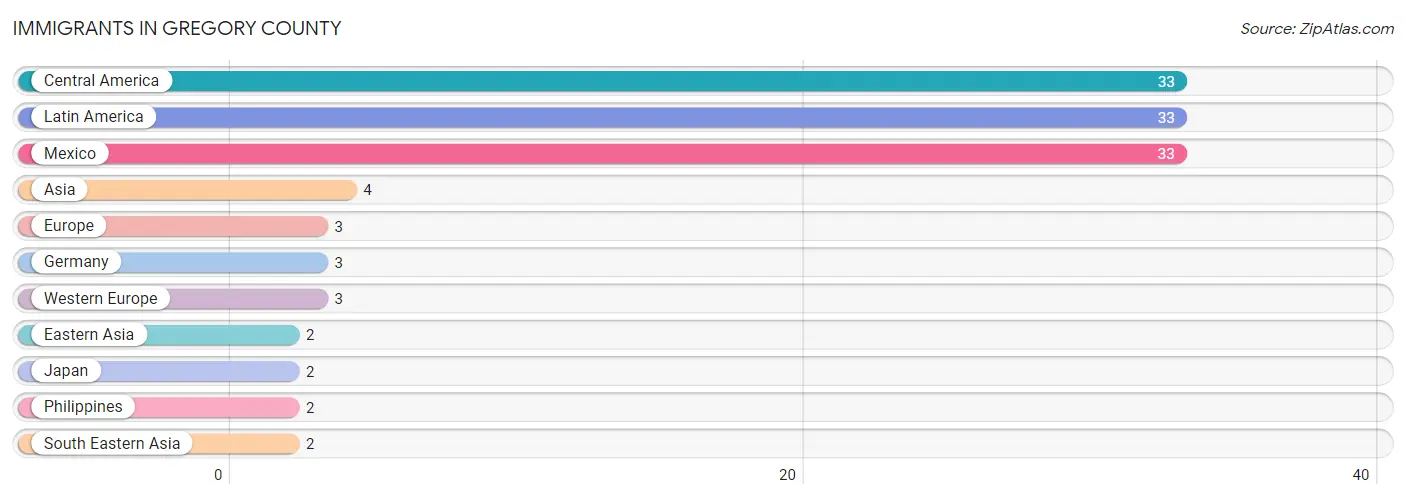
Immigrants in Gregory County
The most numerous immigrant groups reported in Gregory County came from Central America (33 | 0.8%), Latin America (33 | 0.8%), Mexico (33 | 0.8%), Asia (4 | 0.1%), and Europe (3 | 0.1%), together accounting for 2.7% of all Gregory County residents.
| Immigration Origin | # Population | % Population |
| Asia | 4 | 0.1% |
| Central America | 33 | 0.8% |
| Eastern Asia | 2 | 0.1% |
| Europe | 3 | 0.1% |
| Germany | 3 | 0.1% |
| Japan | 2 | 0.1% |
| Latin America | 33 | 0.8% |
| Mexico | 33 | 0.8% |
| Philippines | 2 | 0.1% |
| South Eastern Asia | 2 | 0.1% |
| Western Europe | 3 | 0.1% | View All 11 Rows |
Sex and Age in Gregory County
Sex and Age in Gregory County
The most populous age groups in Gregory County are 15 to 19 Years (176 | 8.5%) for men and 15 to 19 Years (164 | 8.5%) for women.
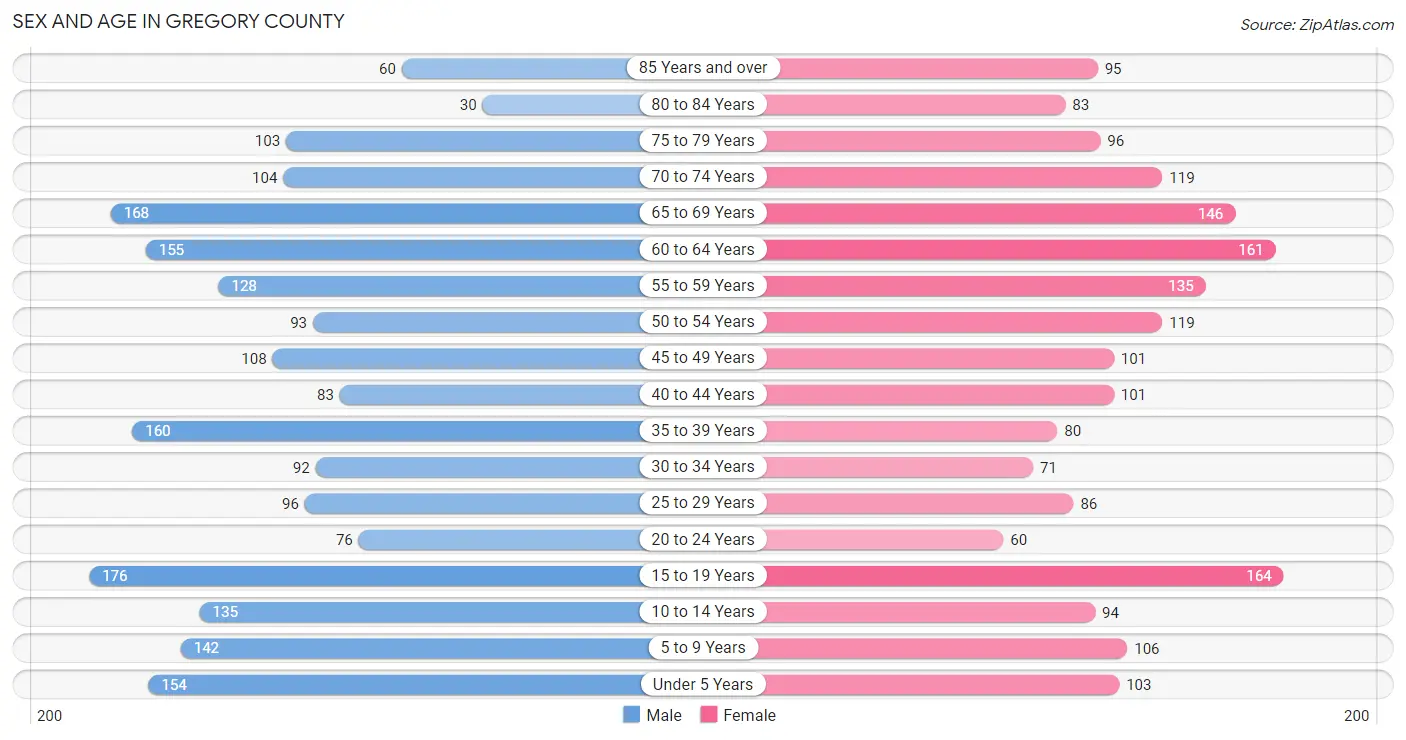
| Age Bracket | Male | Female |
| Under 5 Years | 154 (7.5%) | 103 (5.4%) |
| 5 to 9 Years | 142 (6.9%) | 106 (5.5%) |
| 10 to 14 Years | 135 (6.5%) | 94 (4.9%) |
| 15 to 19 Years | 176 (8.5%) | 164 (8.5%) |
| 20 to 24 Years | 76 (3.7%) | 60 (3.1%) |
| 25 to 29 Years | 96 (4.6%) | 86 (4.5%) |
| 30 to 34 Years | 92 (4.5%) | 71 (3.7%) |
| 35 to 39 Years | 160 (7.8%) | 80 (4.2%) |
| 40 to 44 Years | 83 (4.0%) | 101 (5.3%) |
| 45 to 49 Years | 108 (5.2%) | 101 (5.3%) |
| 50 to 54 Years | 93 (4.5%) | 119 (6.2%) |
| 55 to 59 Years | 128 (6.2%) | 135 (7.0%) |
| 60 to 64 Years | 155 (7.5%) | 161 (8.4%) |
| 65 to 69 Years | 168 (8.1%) | 146 (7.6%) |
| 70 to 74 Years | 104 (5.0%) | 119 (6.2%) |
| 75 to 79 Years | 103 (5.0%) | 96 (5.0%) |
| 80 to 84 Years | 30 (1.5%) | 83 (4.3%) |
| 85 Years and over | 60 (2.9%) | 95 (5.0%) |
| Total | 2,063 (100.0%) | 1,920 (100.0%) |
Families and Households in Gregory County
Median Family Size in Gregory County
The median family size in Gregory County is 3.35 persons per family, with single male/father families (43 | 4.6%) accounting for the largest median family size of 4.26 persons per family. On the other hand, married-couple families (799 | 85.6%) represent the smallest median family size with 3.29 persons per family.
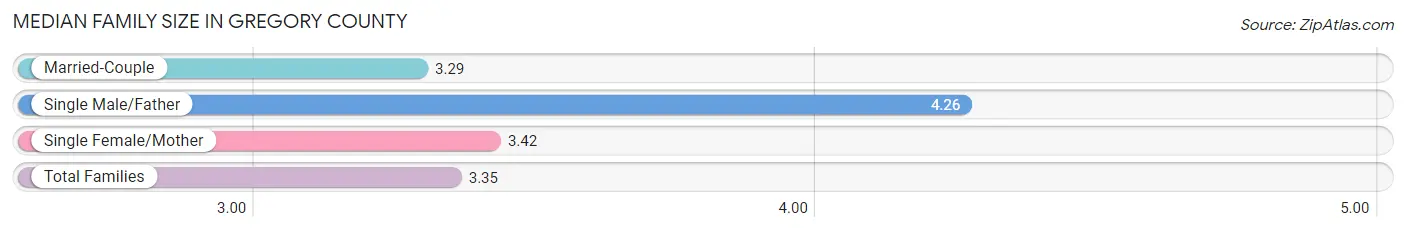
| Family Type | # Families | Family Size |
| Married-Couple | 799 (85.6%) | 3.29 |
| Single Male/Father | 43 (4.6%) | 4.26 |
| Single Female/Mother | 92 (9.9%) | 3.42 |
| Total Families | 934 (100.0%) | 3.35 |
Median Household Size in Gregory County
The median household size in Gregory County is 2.46 persons per household, with single male/father households (43 | 2.7%) accounting for the largest median household size of 4.86 persons per household. non-family households (659 | 41.4%) represent the smallest median household size with 1.13 persons per household.
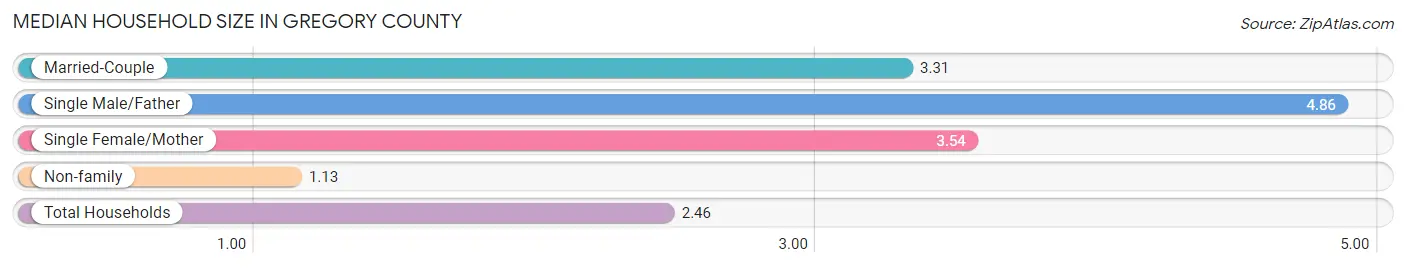
| Household Type | # Households | Household Size |
| Married-Couple | 799 (50.2%) | 3.31 |
| Single Male/Father | 43 (2.7%) | 4.86 |
| Single Female/Mother | 92 (5.8%) | 3.54 |
| Non-family | 659 (41.4%) | 1.13 |
| Total Households | 1,593 (100.0%) | 2.46 |
Household Size by Marriage Status in Gregory County
Out of a total of 1,593 households in Gregory County, 934 (58.6%) are family households, while 659 (41.4%) are nonfamily households. The most numerous type of family households are 2-person households, comprising 540, and the most common type of nonfamily households are 1-person households, comprising 603.
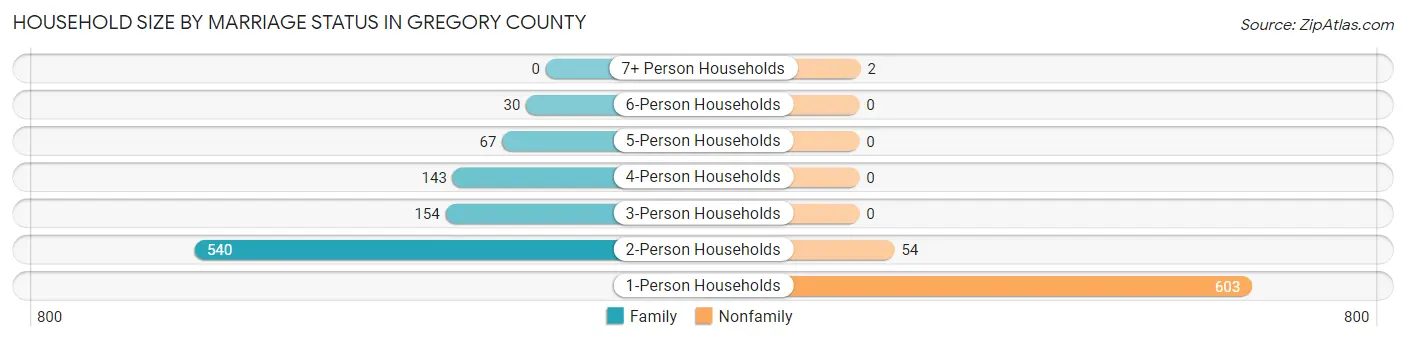
| Household Size | Family Households | Nonfamily Households |
| 1-Person Households | - | 603 (37.9%) |
| 2-Person Households | 540 (33.9%) | 54 (3.4%) |
| 3-Person Households | 154 (9.7%) | 0 (0.0%) |
| 4-Person Households | 143 (9.0%) | 0 (0.0%) |
| 5-Person Households | 67 (4.2%) | 0 (0.0%) |
| 6-Person Households | 30 (1.9%) | 0 (0.0%) |
| 7+ Person Households | 0 (0.0%) | 2 (0.1%) |
| Total | 934 (58.6%) | 659 (41.4%) |
Female Fertility in Gregory County
Fertility by Age in Gregory County
Average fertility rate in Gregory County is 50.0 births per 1,000 women. Women in the age bracket of 20 to 34 years have the highest fertility rate with 129.0 births per 1,000 women. Women in the age bracket of 20 to 34 years acount for 82.4% of all women with births.
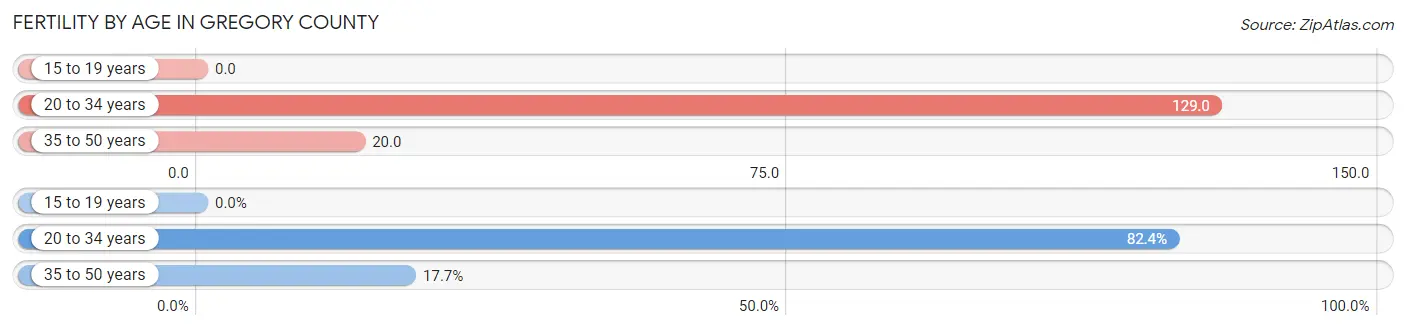
| Age Bracket | Women with Births | Births / 1,000 Women |
| 15 to 19 years | 0 (0.0%) | 0.0 |
| 20 to 34 years | 28 (82.4%) | 129.0 |
| 35 to 50 years | 6 (17.6%) | 20.0 |
| Total | 34 (100.0%) | 50.0 |
Fertility by Age by Marriage Status in Gregory County
85.3% of women with births (34) in Gregory County are married. The highest percentage of unmarried women with births falls into 20 to 34 years age bracket with 17.9% of them unmarried at the time of birth, while the lowest percentage of unmarried women with births belong to 35 to 50 years age bracket with 0.0% of them unmarried.
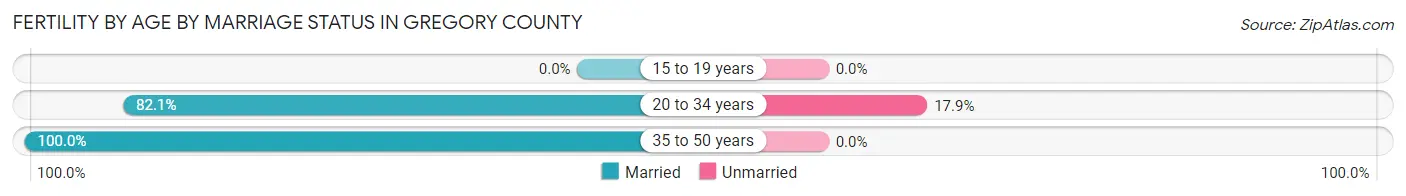
| Age Bracket | Married | Unmarried |
| 15 to 19 years | 0 (0.0%) | 0 (0.0%) |
| 20 to 34 years | 23 (82.1%) | 5 (17.9%) |
| 35 to 50 years | 6 (100.0%) | 0 (0.0%) |
| Total | 29 (85.3%) | 5 (14.7%) |
Fertility by Education in Gregory County
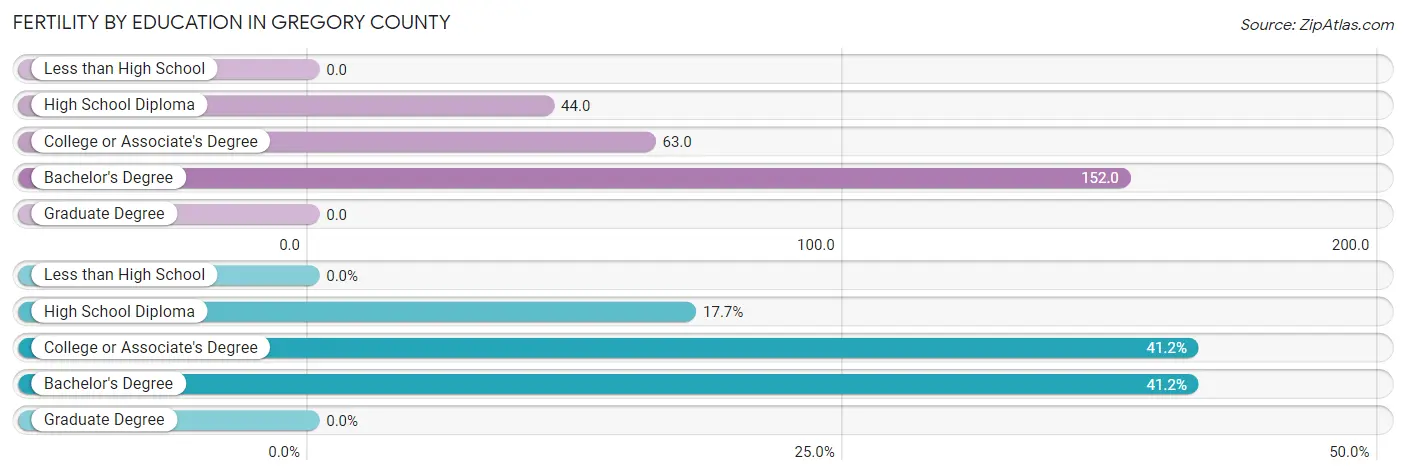
| Educational Attainment | Women with Births | Births / 1,000 Women |
| Less than High School | 0 (0.0%) | 0.0 |
| High School Diploma | 6 (17.6%) | 44.0 |
| College or Associate's Degree | 14 (41.2%) | 63.0 |
| Bachelor's Degree | 14 (41.2%) | 152.0 |
| Graduate Degree | 0 (0.0%) | 0.0 |
| Total | 34 (100.0%) | 50.0 |
Fertility by Education by Marriage Status in Gregory County
14.7% of women with births in Gregory County are unmarried. Women with the educational attainment of college or associate's degree are most likely to be married with 100.0% of them married at childbirth, while women with the educational attainment of high school diploma are least likely to be married with 50.0% of them unmarried at childbirth.
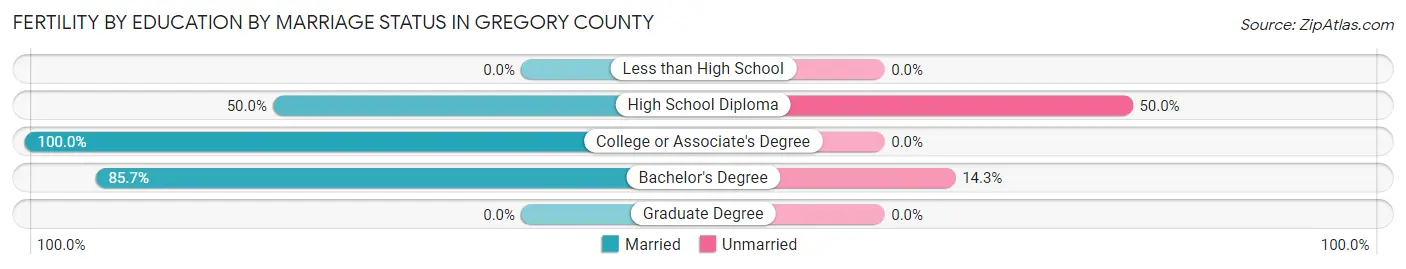
| Educational Attainment | Married | Unmarried |
| Less than High School | 0 (0.0%) | 0 (0.0%) |
| High School Diploma | 3 (50.0%) | 3 (50.0%) |
| College or Associate's Degree | 14 (100.0%) | 0 (0.0%) |
| Bachelor's Degree | 12 (85.7%) | 2 (14.3%) |
| Graduate Degree | 0 (0.0%) | 0 (0.0%) |
| Total | 29 (85.3%) | 5 (14.7%) |
Employment Characteristics in Gregory County
Employment by Class of Employer in Gregory County
Among the 1,895 employed individuals in Gregory County, private company employees (966 | 51.0%), self-employed (not incorporated) (339 | 17.9%), and local government employees (197 | 10.4%) make up the most common classes of employment.
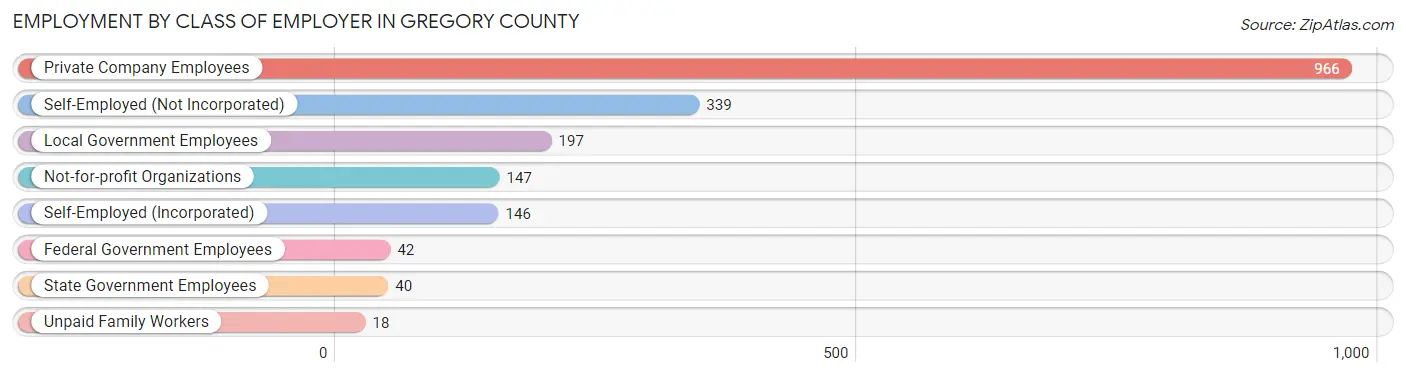
| Employer Class | # Employees | % Employees |
| Private Company Employees | 966 | 51.0% |
| Self-Employed (Incorporated) | 146 | 7.7% |
| Self-Employed (Not Incorporated) | 339 | 17.9% |
| Not-for-profit Organizations | 147 | 7.8% |
| Local Government Employees | 197 | 10.4% |
| State Government Employees | 40 | 2.1% |
| Federal Government Employees | 42 | 2.2% |
| Unpaid Family Workers | 18 | 0.9% |
| Total | 1,895 | 100.0% |
Employment Status by Age in Gregory County
According to the labor force statistics for Gregory County, out of the total population over 16 years of age (3,140), 63.2% or 1,984 individuals are in the labor force, with 2.6% or 52 of them unemployed. The age group with the highest labor force participation rate is 30 to 34 years, with 94.5% or 154 individuals in the labor force. Within the labor force, the 60 to 64 years age range has the highest percentage of unemployed individuals, with 5.5% or 13 of them being unemployed.
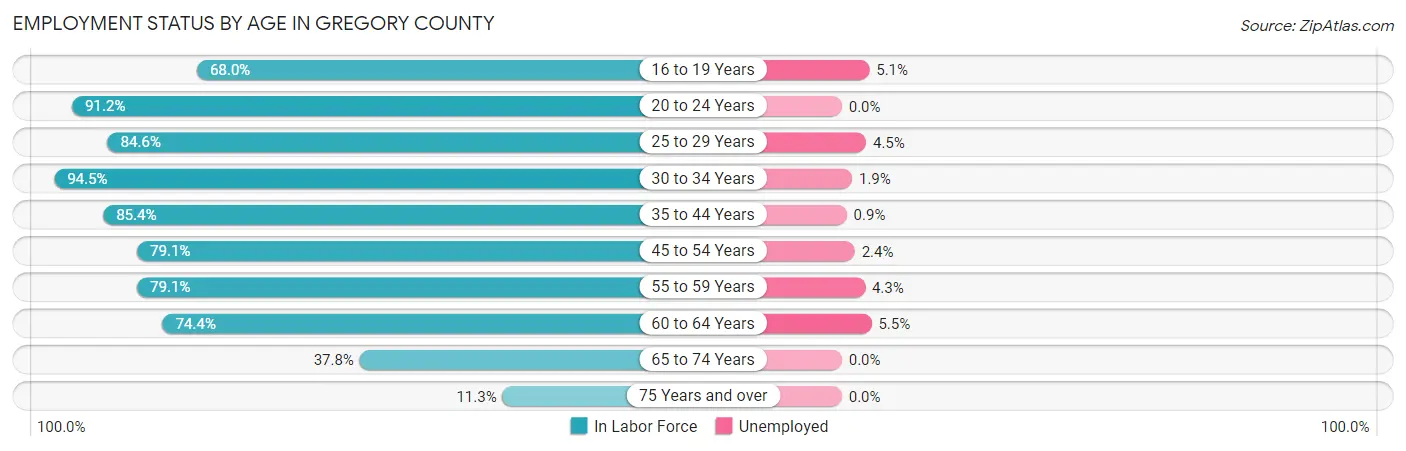
| Age Bracket | In Labor Force | Unemployed |
| 16 to 19 Years | 157 (68.0%) | 8 (5.1%) |
| 20 to 24 Years | 124 (91.2%) | 0 (0.0%) |
| 25 to 29 Years | 154 (84.6%) | 7 (4.5%) |
| 30 to 34 Years | 154 (94.5%) | 3 (1.9%) |
| 35 to 44 Years | 362 (85.4%) | 3 (0.9%) |
| 45 to 54 Years | 333 (79.1%) | 8 (2.4%) |
| 55 to 59 Years | 208 (79.1%) | 9 (4.3%) |
| 60 to 64 Years | 235 (74.4%) | 13 (5.5%) |
| 65 to 74 Years | 203 (37.8%) | 0 (0.0%) |
| 75 Years and over | 53 (11.3%) | 0 (0.0%) |
| Total | 1,984 (63.2%) | 52 (2.6%) |
Employment Status by Educational Attainment in Gregory County
According to labor force statistics for Gregory County, 81.7% of individuals (1,445) out of the total population between 25 and 64 years of age (1,769) are in the labor force, with 3.0% or 43 of them being unemployed. The group with the highest labor force participation rate are those with the educational attainment of bachelor's degree or higher, with 92.6% or 348 individuals in the labor force. Within the labor force, individuals with high school diploma education have the highest percentage of unemployment, with 7.9% or 40 of them being unemployed.
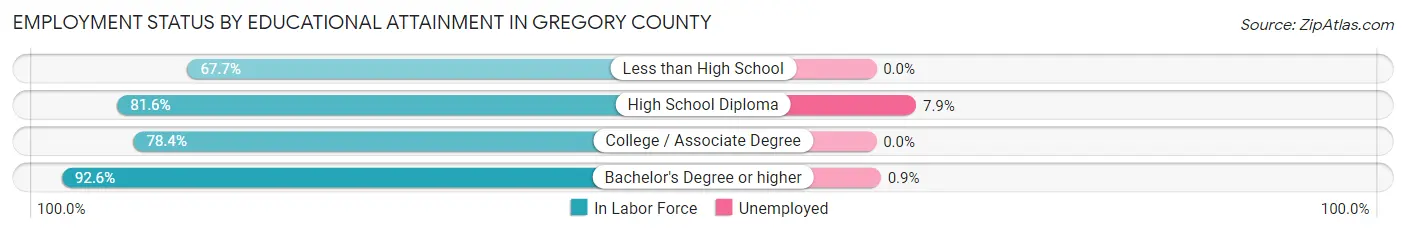
| Educational Attainment | In Labor Force | Unemployed |
| Less than High School | 88 (67.7%) | 0 (0.0%) |
| High School Diploma | 504 (81.6%) | 49 (7.9%) |
| College / Associate Degree | 506 (78.4%) | 0 (0.0%) |
| Bachelor's Degree or higher | 348 (92.6%) | 3 (0.9%) |
| Total | 1,445 (81.7%) | 53 (3.0%) |
Employment Occupations by Sex in Gregory County
Management, Business, Science and Arts Occupations
The most common Management, Business, Science and Arts occupations in Gregory County are Management (373 | 19.4%), Community & Social Service (165 | 8.6%), Health Diagnosing & Treating (111 | 5.8%), Education Instruction & Library (102 | 5.3%), and Health Technologists (95 | 4.9%).
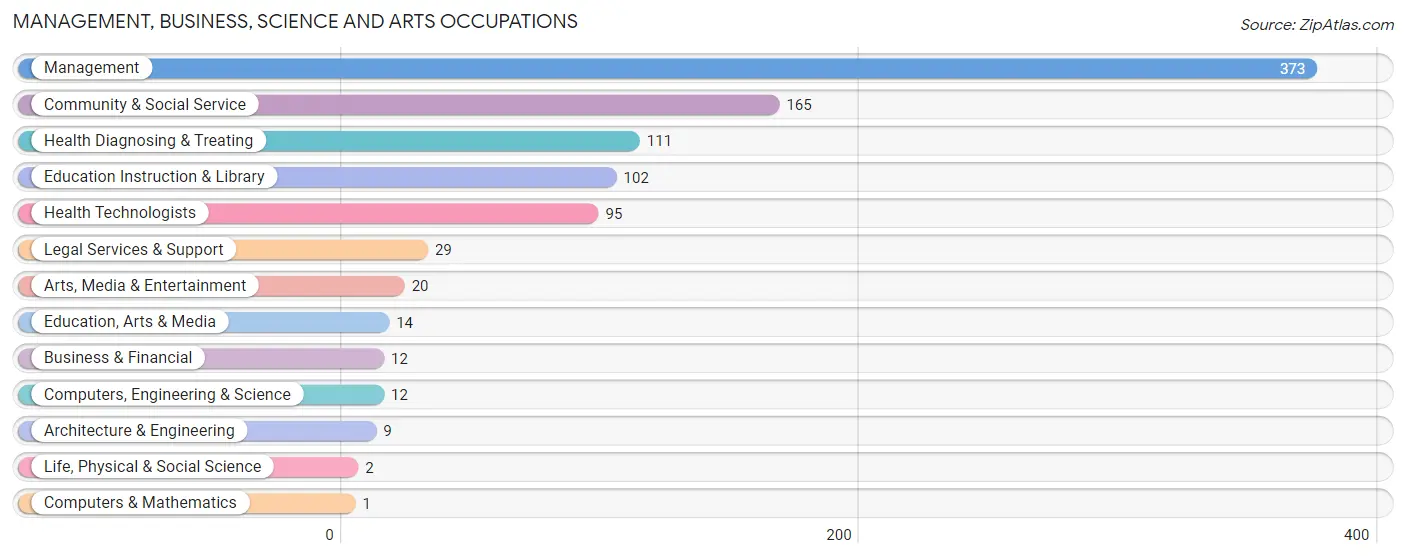
Management, Business, Science and Arts Occupations by Sex
Within the Management, Business, Science and Arts occupations in Gregory County, the most male-oriented occupations are Computers & Mathematics (100.0%), Life, Physical & Social Science (100.0%), and Management (72.4%), while the most female-oriented occupations are Arts, Media & Entertainment (100.0%), Business & Financial (83.3%), and Education Instruction & Library (78.4%).
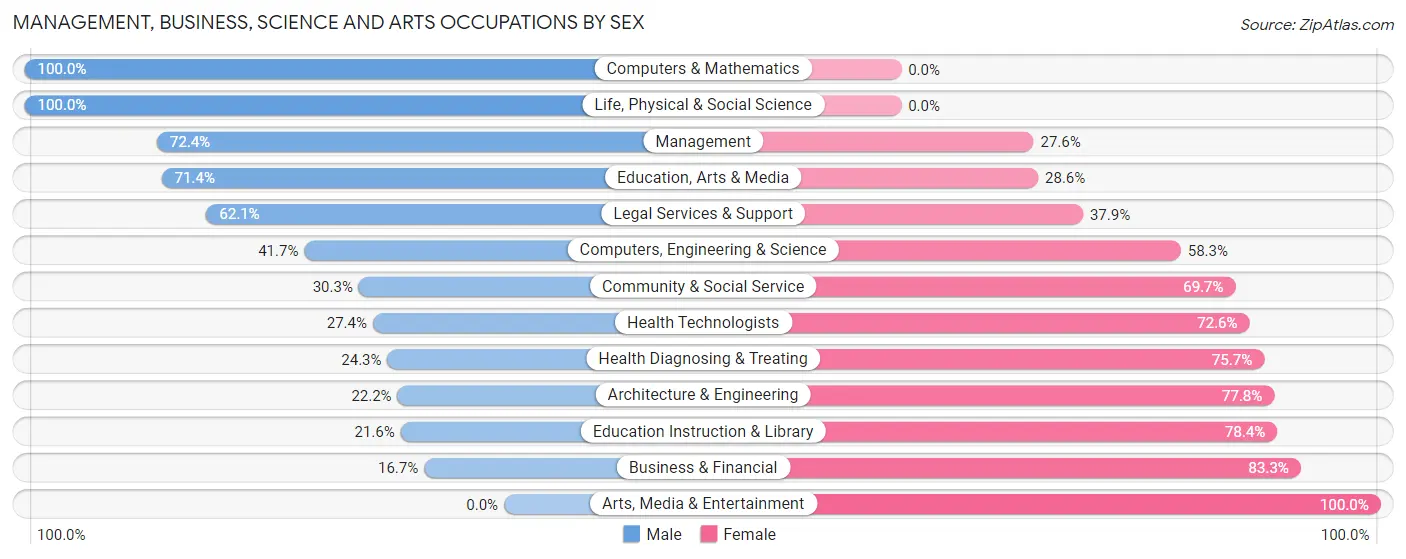
| Occupation | Male | Female |
| Management | 270 (72.4%) | 103 (27.6%) |
| Business & Financial | 2 (16.7%) | 10 (83.3%) |
| Computers, Engineering & Science | 5 (41.7%) | 7 (58.3%) |
| Computers & Mathematics | 1 (100.0%) | 0 (0.0%) |
| Architecture & Engineering | 2 (22.2%) | 7 (77.8%) |
| Life, Physical & Social Science | 2 (100.0%) | 0 (0.0%) |
| Community & Social Service | 50 (30.3%) | 115 (69.7%) |
| Education, Arts & Media | 10 (71.4%) | 4 (28.6%) |
| Legal Services & Support | 18 (62.1%) | 11 (37.9%) |
| Education Instruction & Library | 22 (21.6%) | 80 (78.4%) |
| Arts, Media & Entertainment | 0 (0.0%) | 20 (100.0%) |
| Health Diagnosing & Treating | 27 (24.3%) | 84 (75.7%) |
| Health Technologists | 26 (27.4%) | 69 (72.6%) |
| Total (Category) | 354 (52.6%) | 319 (47.4%) |
| Total (Overall) | 1,016 (52.9%) | 906 (47.1%) |
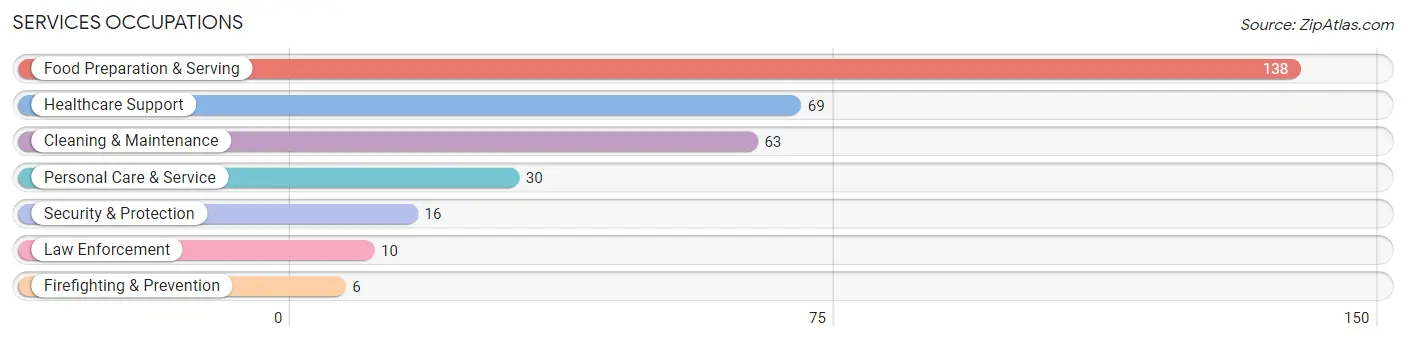
Services Occupations
The most common Services occupations in Gregory County are Food Preparation & Serving (138 | 7.2%), Healthcare Support (69 | 3.6%), Cleaning & Maintenance (63 | 3.3%), Personal Care & Service (30 | 1.6%), and Security & Protection (16 | 0.8%).
Services Occupations by Sex
Within the Services occupations in Gregory County, the most male-oriented occupations are Security & Protection (100.0%), Firefighting & Prevention (100.0%), and Law Enforcement (100.0%), while the most female-oriented occupations are Personal Care & Service (93.3%), Food Preparation & Serving (92.7%), and Healthcare Support (82.6%).
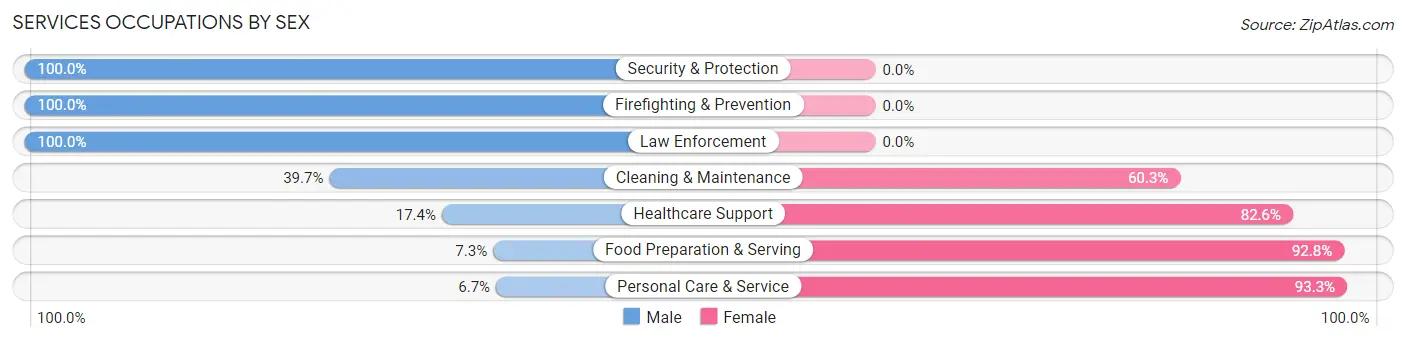
| Occupation | Male | Female |
| Healthcare Support | 12 (17.4%) | 57 (82.6%) |
| Security & Protection | 16 (100.0%) | 0 (0.0%) |
| Firefighting & Prevention | 6 (100.0%) | 0 (0.0%) |
| Law Enforcement | 10 (100.0%) | 0 (0.0%) |
| Food Preparation & Serving | 10 (7.2%) | 128 (92.7%) |
| Cleaning & Maintenance | 25 (39.7%) | 38 (60.3%) |
| Personal Care & Service | 2 (6.7%) | 28 (93.3%) |
| Total (Category) | 65 (20.6%) | 251 (79.4%) |
| Total (Overall) | 1,016 (52.9%) | 906 (47.1%) |
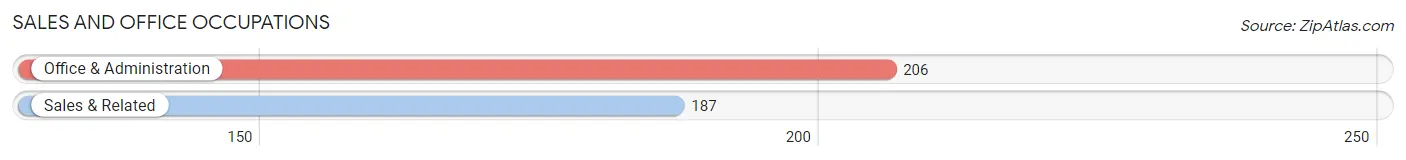
Sales and Office Occupations
The most common Sales and Office occupations in Gregory County are Office & Administration (206 | 10.7%), and Sales & Related (187 | 9.7%).
Sales and Office Occupations by Sex
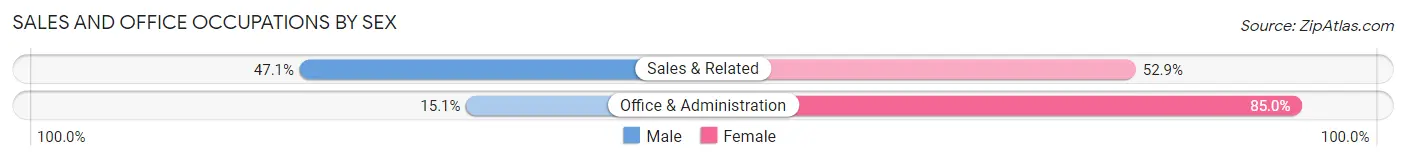
| Occupation | Male | Female |
| Sales & Related | 88 (47.1%) | 99 (52.9%) |
| Office & Administration | 31 (15.0%) | 175 (85.0%) |
| Total (Category) | 119 (30.3%) | 274 (69.7%) |
| Total (Overall) | 1,016 (52.9%) | 906 (47.1%) |
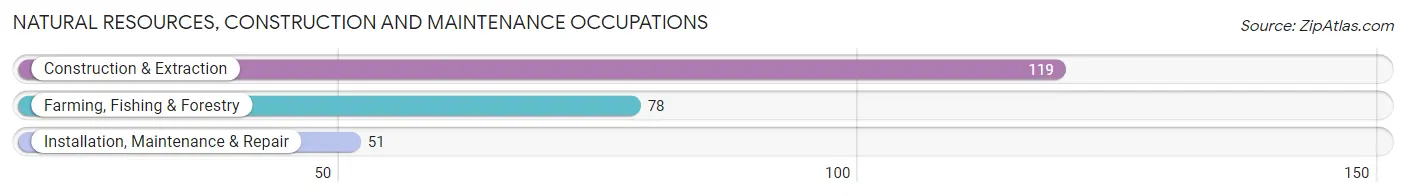
Natural Resources, Construction and Maintenance Occupations
The most common Natural Resources, Construction and Maintenance occupations in Gregory County are Construction & Extraction (119 | 6.2%), Farming, Fishing & Forestry (78 | 4.1%), and Installation, Maintenance & Repair (51 | 2.6%).
Natural Resources, Construction and Maintenance Occupations by Sex
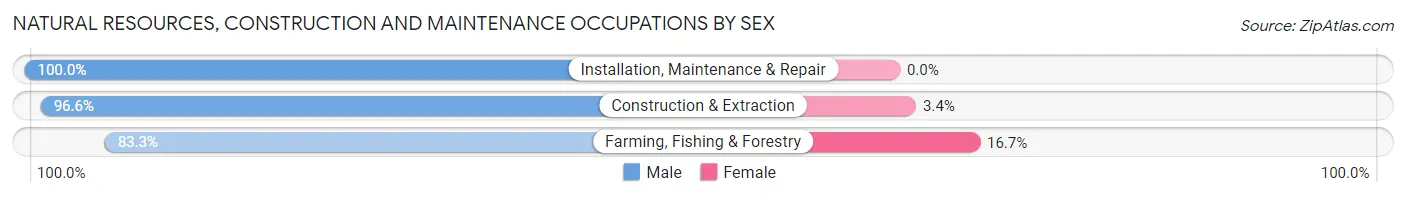
| Occupation | Male | Female |
| Farming, Fishing & Forestry | 65 (83.3%) | 13 (16.7%) |
| Construction & Extraction | 115 (96.6%) | 4 (3.4%) |
| Installation, Maintenance & Repair | 51 (100.0%) | 0 (0.0%) |
| Total (Category) | 231 (93.1%) | 17 (6.9%) |
| Total (Overall) | 1,016 (52.9%) | 906 (47.1%) |
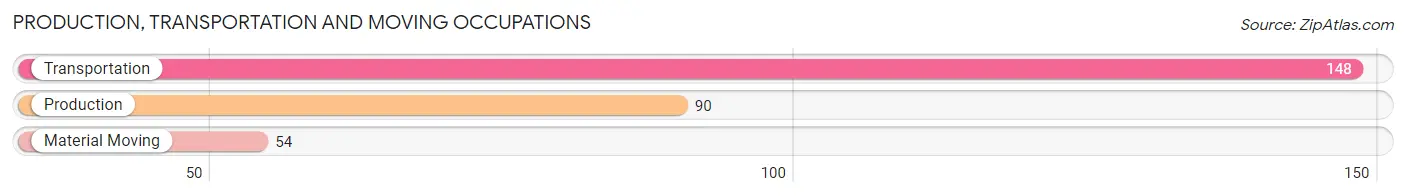
Production, Transportation and Moving Occupations
The most common Production, Transportation and Moving occupations in Gregory County are Transportation (148 | 7.7%), Production (90 | 4.7%), and Material Moving (54 | 2.8%).
Production, Transportation and Moving Occupations by Sex
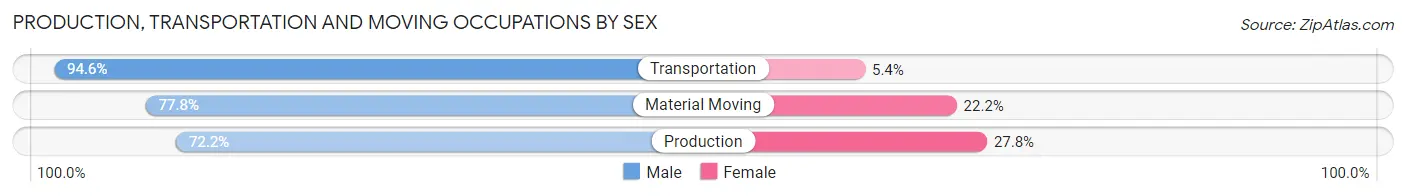
| Occupation | Male | Female |
| Production | 65 (72.2%) | 25 (27.8%) |
| Transportation | 140 (94.6%) | 8 (5.4%) |
| Material Moving | 42 (77.8%) | 12 (22.2%) |
| Total (Category) | 247 (84.6%) | 45 (15.4%) |
| Total (Overall) | 1,016 (52.9%) | 906 (47.1%) |
Employment Industries by Sex in Gregory County
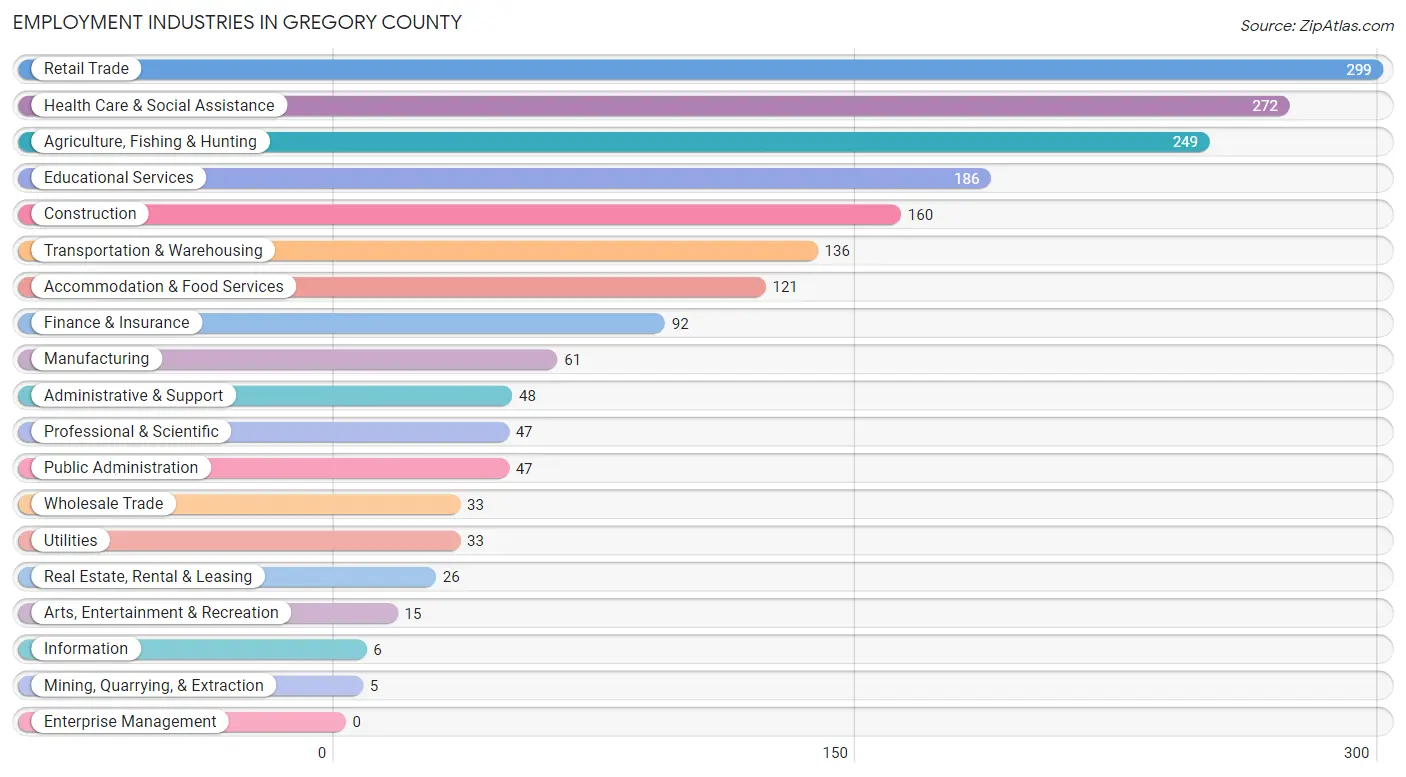
Employment Industries in Gregory County
The major employment industries in Gregory County include Retail Trade (299 | 15.6%), Health Care & Social Assistance (272 | 14.1%), Agriculture, Fishing & Hunting (249 | 13.0%), Educational Services (186 | 9.7%), and Construction (160 | 8.3%).
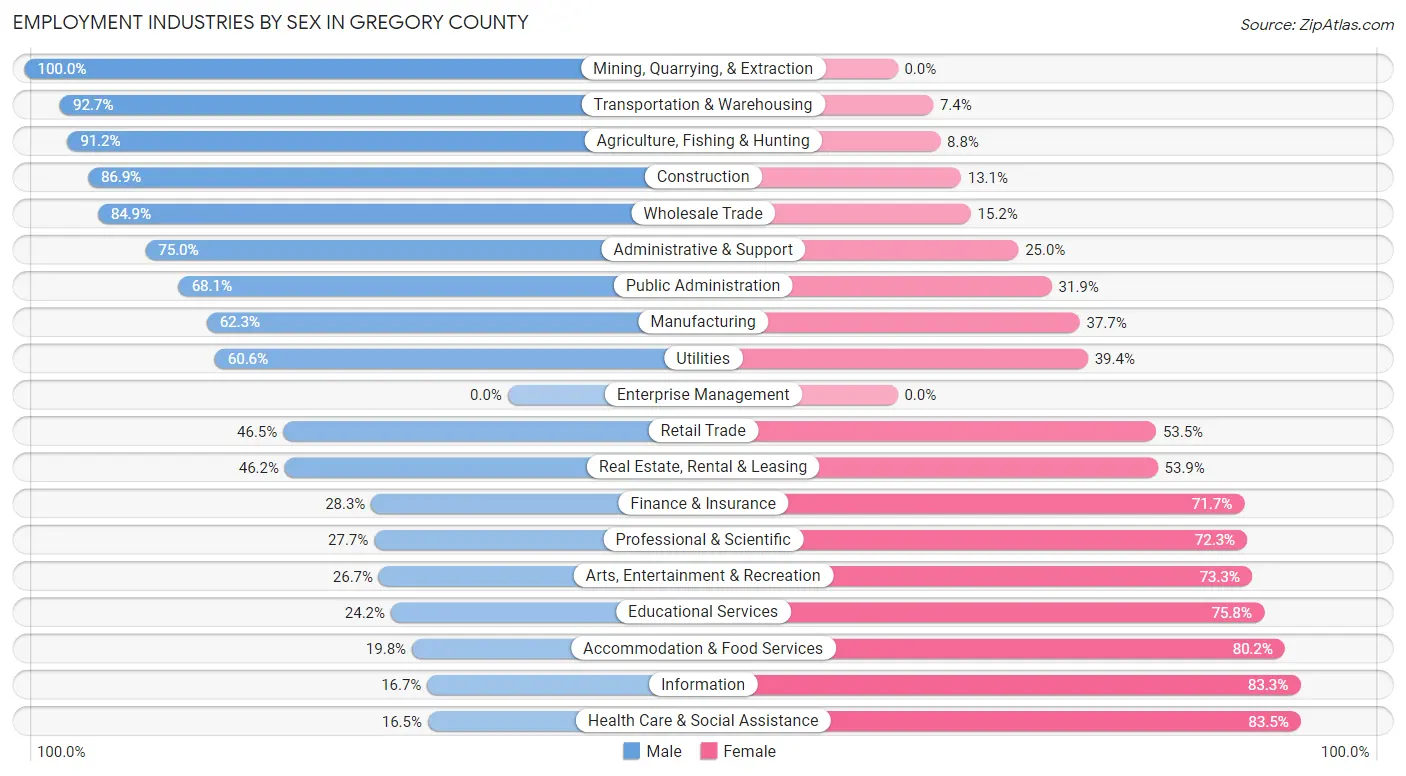
Employment Industries by Sex in Gregory County
The Gregory County industries that see more men than women are Mining, Quarrying, & Extraction (100.0%), Transportation & Warehousing (92.6%), and Agriculture, Fishing & Hunting (91.2%), whereas the industries that tend to have a higher number of women are Health Care & Social Assistance (83.5%), Information (83.3%), and Accommodation & Food Services (80.2%).
| Industry | Male | Female |
| Agriculture, Fishing & Hunting | 227 (91.2%) | 22 (8.8%) |
| Mining, Quarrying, & Extraction | 5 (100.0%) | 0 (0.0%) |
| Construction | 139 (86.9%) | 21 (13.1%) |
| Manufacturing | 38 (62.3%) | 23 (37.7%) |
| Wholesale Trade | 28 (84.9%) | 5 (15.1%) |
| Retail Trade | 139 (46.5%) | 160 (53.5%) |
| Transportation & Warehousing | 126 (92.6%) | 10 (7.3%) |
| Utilities | 20 (60.6%) | 13 (39.4%) |
| Information | 1 (16.7%) | 5 (83.3%) |
| Finance & Insurance | 26 (28.3%) | 66 (71.7%) |
| Real Estate, Rental & Leasing | 12 (46.2%) | 14 (53.8%) |
| Professional & Scientific | 13 (27.7%) | 34 (72.3%) |
| Enterprise Management | 0 (0.0%) | 0 (0.0%) |
| Administrative & Support | 36 (75.0%) | 12 (25.0%) |
| Educational Services | 45 (24.2%) | 141 (75.8%) |
| Health Care & Social Assistance | 45 (16.5%) | 227 (83.5%) |
| Arts, Entertainment & Recreation | 4 (26.7%) | 11 (73.3%) |
| Accommodation & Food Services | 24 (19.8%) | 97 (80.2%) |
| Public Administration | 32 (68.1%) | 15 (31.9%) |
| Total | 1,016 (52.9%) | 906 (47.1%) |
Education in Gregory County
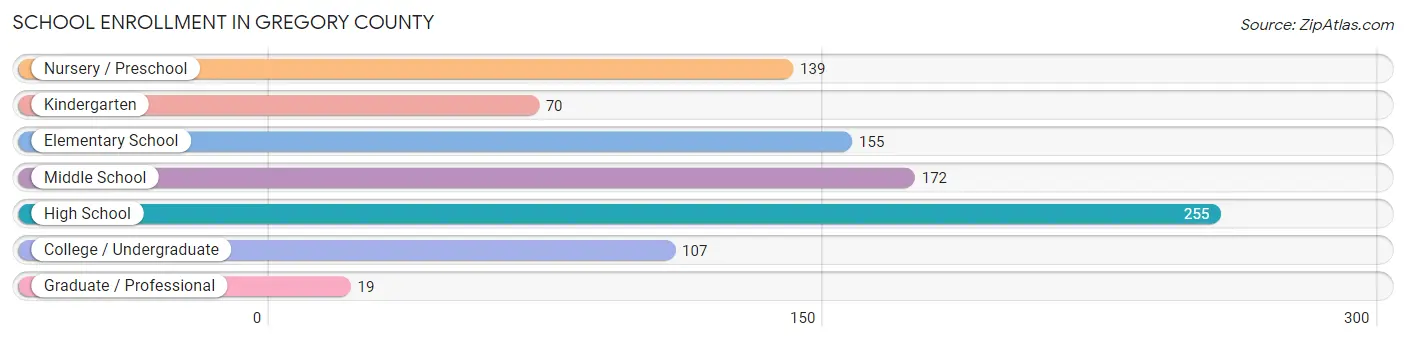
School Enrollment in Gregory County
The most common levels of schooling among the 917 students in Gregory County are high school (255 | 27.8%), middle school (172 | 18.8%), and elementary school (155 | 16.9%).
| School Level | # Students | % Students |
| Nursery / Preschool | 139 | 15.2% |
| Kindergarten | 70 | 7.6% |
| Elementary School | 155 | 16.9% |
| Middle School | 172 | 18.8% |
| High School | 255 | 27.8% |
| College / Undergraduate | 107 | 11.7% |
| Graduate / Professional | 19 | 2.1% |
| Total | 917 | 100.0% |
School Enrollment by Age by Funding Source in Gregory County
Out of a total of 917 students who are enrolled in schools in Gregory County, 33 (3.6%) attend a private institution, while the remaining 884 (96.4%) are enrolled in public schools. The age group of 35 years and over has the highest likelihood of being enrolled in private schools, with 8 (25.8% in the age bracket) enrolled. Conversely, the age group of 3 to 4 year olds has the lowest likelihood of being enrolled in a private school, with 73 (100.0% in the age bracket) attending a public institution.
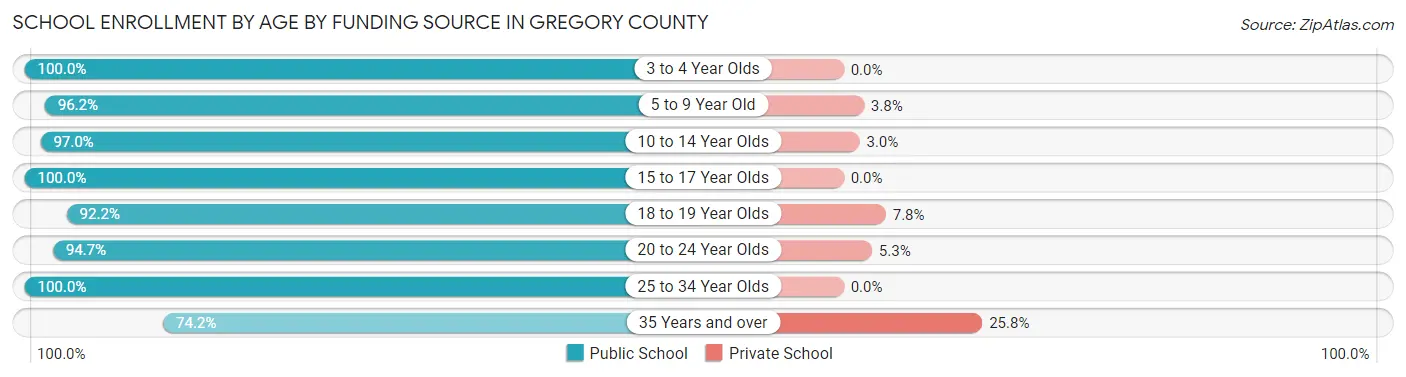
| Age Bracket | Public School | Private School |
| 3 to 4 Year Olds | 73 (100.0%) | 0 (0.0%) |
| 5 to 9 Year Old | 230 (96.2%) | 9 (3.8%) |
| 10 to 14 Year Olds | 197 (97.0%) | 6 (3.0%) |
| 15 to 17 Year Olds | 213 (100.0%) | 0 (0.0%) |
| 18 to 19 Year Olds | 94 (92.2%) | 8 (7.8%) |
| 20 to 24 Year Olds | 36 (94.7%) | 2 (5.3%) |
| 25 to 34 Year Olds | 18 (100.0%) | 0 (0.0%) |
| 35 Years and over | 23 (74.2%) | 8 (25.8%) |
| Total | 884 (96.4%) | 33 (3.6%) |
Educational Attainment by Field of Study in Gregory County
Education (161 | 28.1%), science & technology (82 | 14.3%), business (68 | 11.8%), bio, nature & agricultural (49 | 8.5%), and arts & humanities (44 | 7.7%) are the most common fields of study among 574 individuals in Gregory County who have obtained a bachelor's degree or higher.
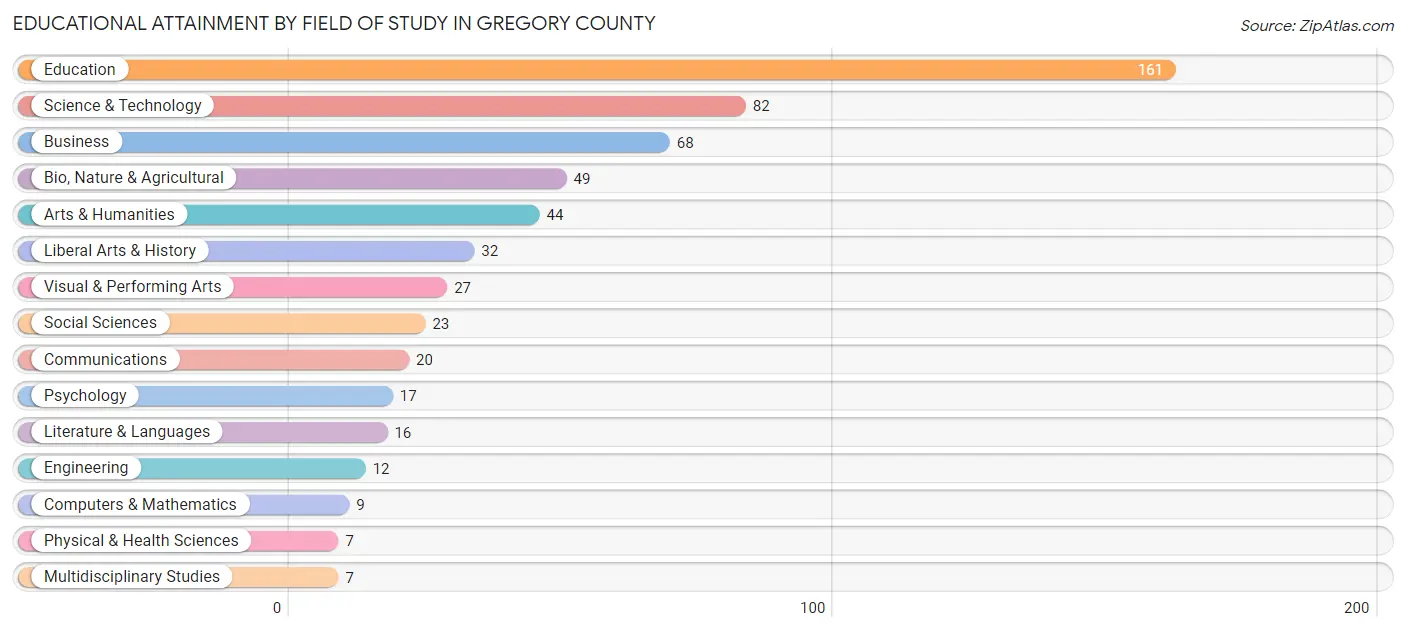
| Field of Study | # Graduates | % Graduates |
| Computers & Mathematics | 9 | 1.6% |
| Bio, Nature & Agricultural | 49 | 8.5% |
| Physical & Health Sciences | 7 | 1.2% |
| Psychology | 17 | 3.0% |
| Social Sciences | 23 | 4.0% |
| Engineering | 12 | 2.1% |
| Multidisciplinary Studies | 7 | 1.2% |
| Science & Technology | 82 | 14.3% |
| Business | 68 | 11.8% |
| Education | 161 | 28.1% |
| Literature & Languages | 16 | 2.8% |
| Liberal Arts & History | 32 | 5.6% |
| Visual & Performing Arts | 27 | 4.7% |
| Communications | 20 | 3.5% |
| Arts & Humanities | 44 | 7.7% |
| Total | 574 | 100.0% |
Transportation & Commute in Gregory County
Vehicle Availability by Sex in Gregory County
The most prevalent vehicle ownership categories in Gregory County are males with 4 vehicles (261, accounting for 25.6%) and females with 4 vehicles (221, making up 29.8%).
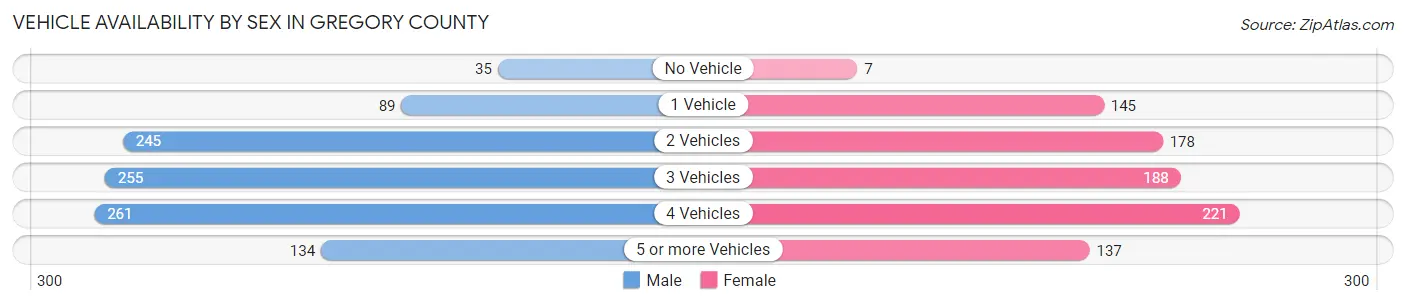
| Vehicles Available | Male | Female |
| No Vehicle | 35 (3.4%) | 7 (0.8%) |
| 1 Vehicle | 89 (8.7%) | 145 (16.6%) |
| 2 Vehicles | 245 (24.0%) | 178 (20.3%) |
| 3 Vehicles | 255 (25.0%) | 188 (21.5%) |
| 4 Vehicles | 261 (25.6%) | 221 (25.2%) |
| 5 or more Vehicles | 134 (13.2%) | 137 (15.6%) |
| Total | 1,019 (100.0%) | 876 (100.0%) |
Commute Time in Gregory County
The most frequently occuring commute durations in Gregory County are less than 5 minutes (482 commuters, 27.6%), 5 to 9 minutes (364 commuters, 20.8%), and 10 to 14 minutes (218 commuters, 12.5%).
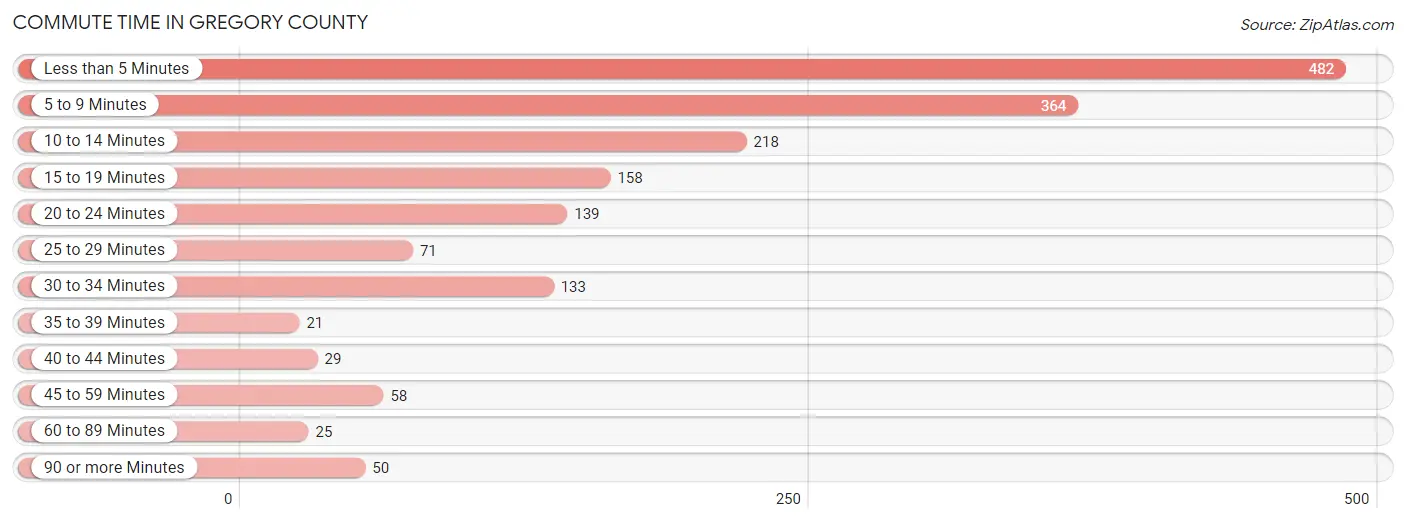
| Commute Time | # Commuters | % Commuters |
| Less than 5 Minutes | 482 | 27.6% |
| 5 to 9 Minutes | 364 | 20.8% |
| 10 to 14 Minutes | 218 | 12.5% |
| 15 to 19 Minutes | 158 | 9.0% |
| 20 to 24 Minutes | 139 | 8.0% |
| 25 to 29 Minutes | 71 | 4.1% |
| 30 to 34 Minutes | 133 | 7.6% |
| 35 to 39 Minutes | 21 | 1.2% |
| 40 to 44 Minutes | 29 | 1.7% |
| 45 to 59 Minutes | 58 | 3.3% |
| 60 to 89 Minutes | 25 | 1.4% |
| 90 or more Minutes | 50 | 2.9% |
Commute Time by Sex in Gregory County
The most common commute times in Gregory County are less than 5 minutes (287 commuters, 29.6%) for males and less than 5 minutes (195 commuters, 25.1%) for females.
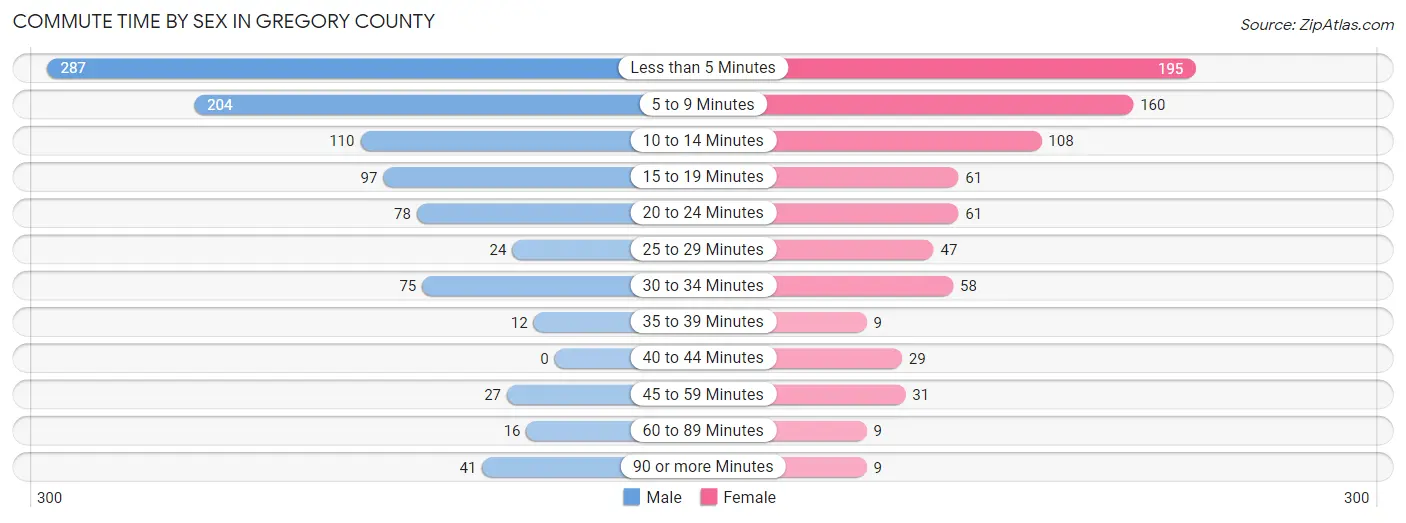
| Commute Time | Male | Female |
| Less than 5 Minutes | 287 (29.6%) | 195 (25.1%) |
| 5 to 9 Minutes | 204 (21.0%) | 160 (20.6%) |
| 10 to 14 Minutes | 110 (11.3%) | 108 (13.9%) |
| 15 to 19 Minutes | 97 (10.0%) | 61 (7.9%) |
| 20 to 24 Minutes | 78 (8.0%) | 61 (7.9%) |
| 25 to 29 Minutes | 24 (2.5%) | 47 (6.0%) |
| 30 to 34 Minutes | 75 (7.7%) | 58 (7.5%) |
| 35 to 39 Minutes | 12 (1.2%) | 9 (1.2%) |
| 40 to 44 Minutes | 0 (0.0%) | 29 (3.7%) |
| 45 to 59 Minutes | 27 (2.8%) | 31 (4.0%) |
| 60 to 89 Minutes | 16 (1.7%) | 9 (1.2%) |
| 90 or more Minutes | 41 (4.2%) | 9 (1.2%) |
Time of Departure to Work by Sex in Gregory County
The most frequent times of departure to work in Gregory County are 7:30 AM to 7:59 AM (283, 29.1%) for males and 7:30 AM to 7:59 AM (199, 25.6%) for females.
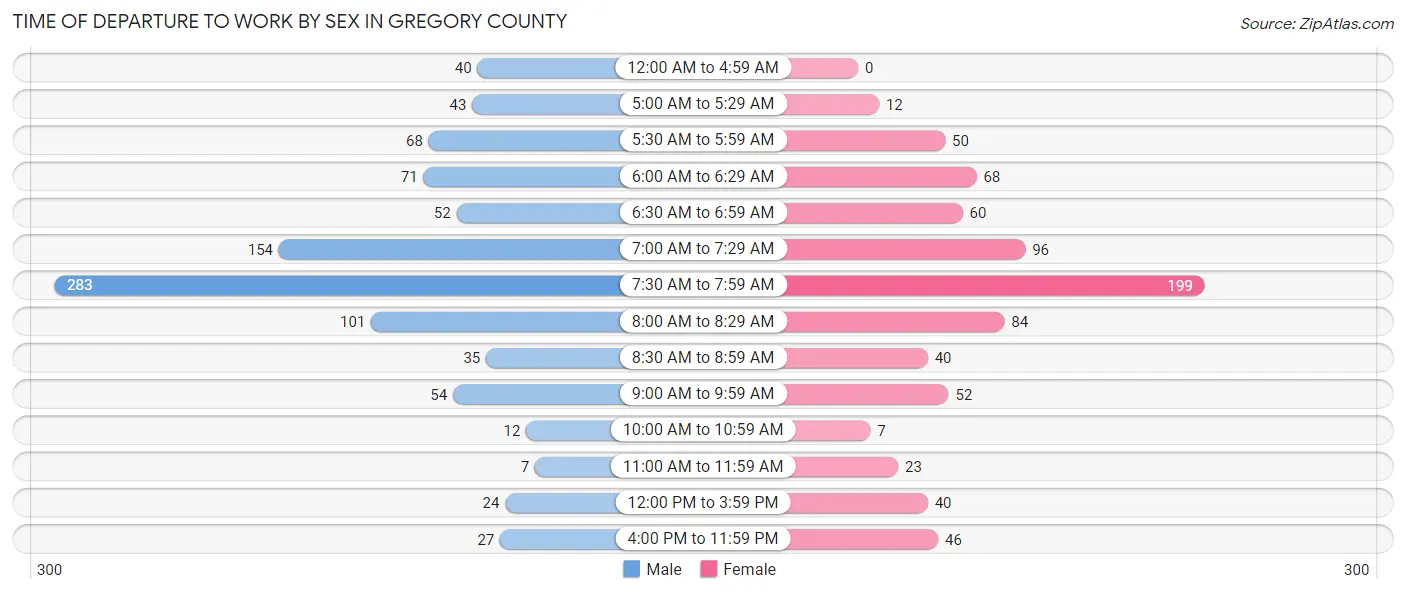
| Time of Departure | Male | Female |
| 12:00 AM to 4:59 AM | 40 (4.1%) | 0 (0.0%) |
| 5:00 AM to 5:29 AM | 43 (4.4%) | 12 (1.5%) |
| 5:30 AM to 5:59 AM | 68 (7.0%) | 50 (6.4%) |
| 6:00 AM to 6:29 AM | 71 (7.3%) | 68 (8.7%) |
| 6:30 AM to 6:59 AM | 52 (5.4%) | 60 (7.7%) |
| 7:00 AM to 7:29 AM | 154 (15.9%) | 96 (12.4%) |
| 7:30 AM to 7:59 AM | 283 (29.1%) | 199 (25.6%) |
| 8:00 AM to 8:29 AM | 101 (10.4%) | 84 (10.8%) |
| 8:30 AM to 8:59 AM | 35 (3.6%) | 40 (5.1%) |
| 9:00 AM to 9:59 AM | 54 (5.6%) | 52 (6.7%) |
| 10:00 AM to 10:59 AM | 12 (1.2%) | 7 (0.9%) |
| 11:00 AM to 11:59 AM | 7 (0.7%) | 23 (3.0%) |
| 12:00 PM to 3:59 PM | 24 (2.5%) | 40 (5.1%) |
| 4:00 PM to 11:59 PM | 27 (2.8%) | 46 (5.9%) |
| Total | 971 (100.0%) | 777 (100.0%) |
Housing Occupancy in Gregory County
Occupancy by Ownership in Gregory County
Of the total 1,593 dwellings in Gregory County, owner-occupied units account for 1,217 (76.4%), while renter-occupied units make up 376 (23.6%).
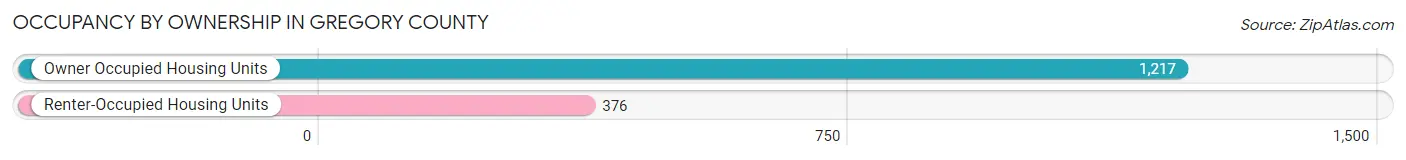
| Occupancy | # Housing Units | % Housing Units |
| Owner Occupied Housing Units | 1,217 | 76.4% |
| Renter-Occupied Housing Units | 376 | 23.6% |
| Total Occupied Housing Units | 1,593 | 100.0% |
Occupancy by Household Size in Gregory County
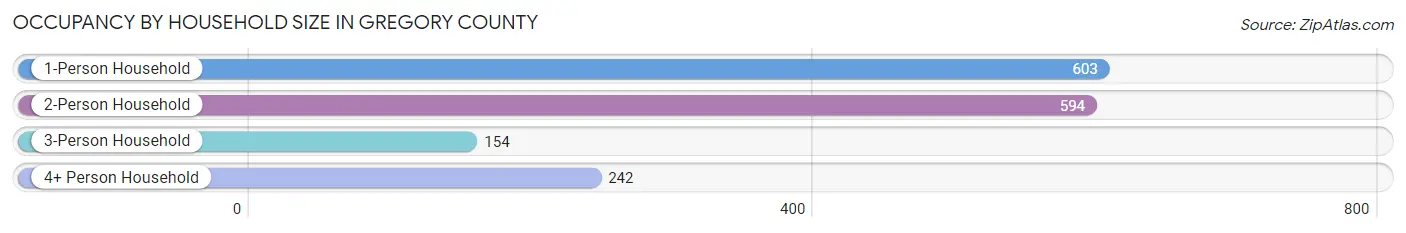
| Household Size | # Housing Units | % Housing Units |
| 1-Person Household | 603 | 37.9% |
| 2-Person Household | 594 | 37.3% |
| 3-Person Household | 154 | 9.7% |
| 4+ Person Household | 242 | 15.2% |
| Total Housing Units | 1,593 | 100.0% |
Occupancy by Ownership by Household Size in Gregory County
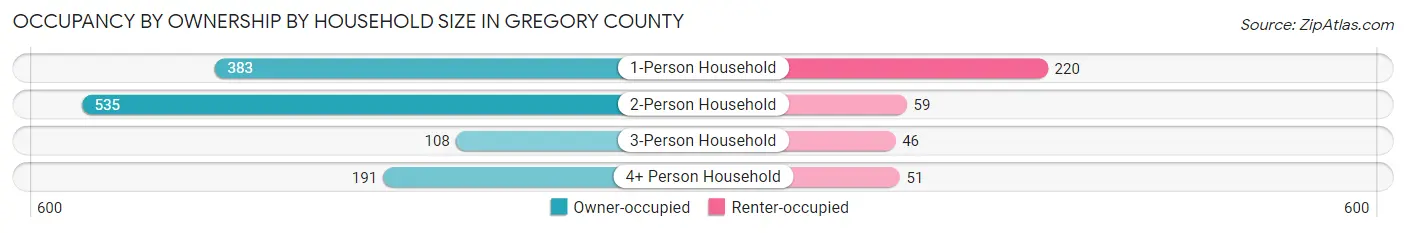
| Household Size | Owner-occupied | Renter-occupied |
| 1-Person Household | 383 (63.5%) | 220 (36.5%) |
| 2-Person Household | 535 (90.1%) | 59 (9.9%) |
| 3-Person Household | 108 (70.1%) | 46 (29.9%) |
| 4+ Person Household | 191 (78.9%) | 51 (21.1%) |
| Total Housing Units | 1,217 (76.4%) | 376 (23.6%) |
Occupancy by Educational Attainment in Gregory County
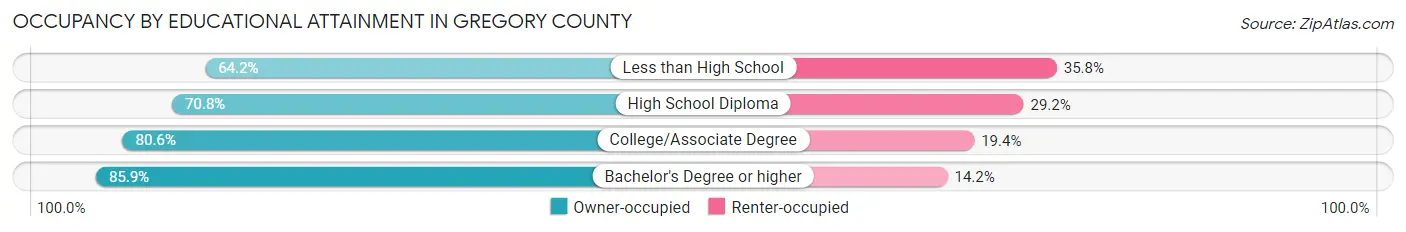
| Household Size | Owner-occupied | Renter-occupied |
| Less than High School | 95 (64.2%) | 53 (35.8%) |
| High School Diploma | 424 (70.8%) | 175 (29.2%) |
| College/Associate Degree | 431 (80.6%) | 104 (19.4%) |
| Bachelor's Degree or higher | 267 (85.9%) | 44 (14.1%) |
Occupancy by Age of Householder in Gregory County
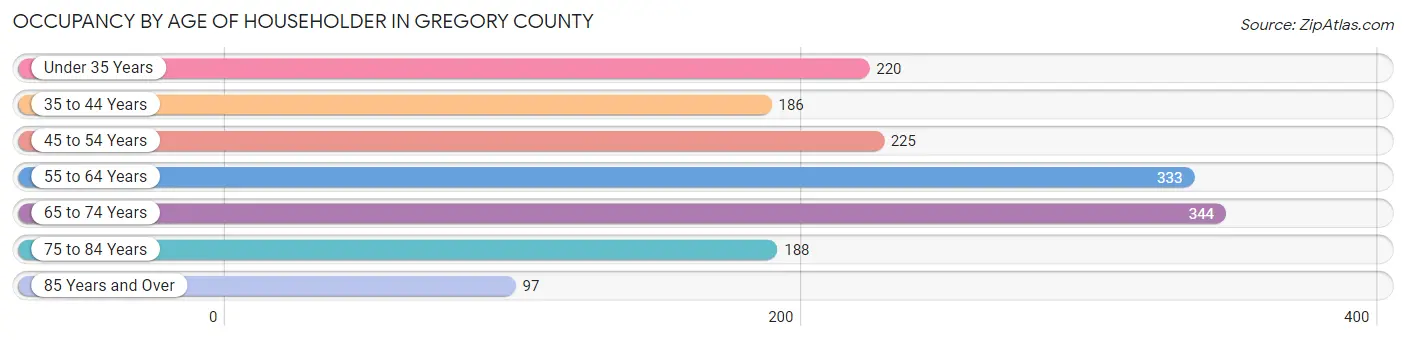
| Age Bracket | # Households | % Households |
| Under 35 Years | 220 | 13.8% |
| 35 to 44 Years | 186 | 11.7% |
| 45 to 54 Years | 225 | 14.1% |
| 55 to 64 Years | 333 | 20.9% |
| 65 to 74 Years | 344 | 21.6% |
| 75 to 84 Years | 188 | 11.8% |
| 85 Years and Over | 97 | 6.1% |
| Total | 1,593 | 100.0% |
Housing Finances in Gregory County
Median Income by Occupancy in Gregory County
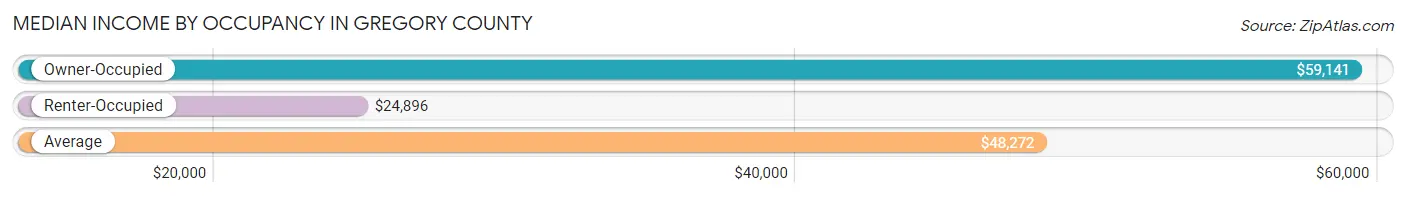
| Occupancy Type | # Households | Median Income |
| Owner-Occupied | 1,217 (76.4%) | $59,141 |
| Renter-Occupied | 376 (23.6%) | $24,896 |
| Average | 1,593 (100.0%) | $48,272 |
Occupancy by Householder Income Bracket in Gregory County
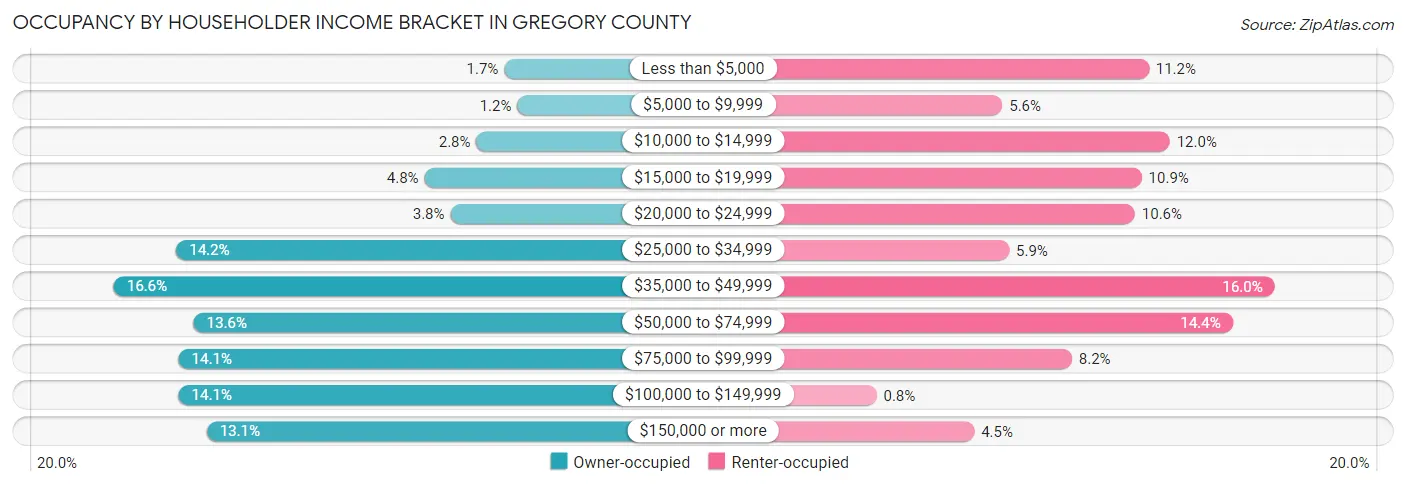
| Income Bracket | Owner-occupied | Renter-occupied |
| Less than $5,000 | 21 (1.7%) | 42 (11.2%) |
| $5,000 to $9,999 | 15 (1.2%) | 21 (5.6%) |
| $10,000 to $14,999 | 34 (2.8%) | 45 (12.0%) |
| $15,000 to $19,999 | 58 (4.8%) | 41 (10.9%) |
| $20,000 to $24,999 | 46 (3.8%) | 40 (10.6%) |
| $25,000 to $34,999 | 173 (14.2%) | 22 (5.9%) |
| $35,000 to $49,999 | 202 (16.6%) | 60 (16.0%) |
| $50,000 to $74,999 | 165 (13.6%) | 54 (14.4%) |
| $75,000 to $99,999 | 172 (14.1%) | 31 (8.2%) |
| $100,000 to $149,999 | 172 (14.1%) | 3 (0.8%) |
| $150,000 or more | 159 (13.1%) | 17 (4.5%) |
| Total | 1,217 (100.0%) | 376 (100.0%) |
Monthly Housing Cost Tiers in Gregory County
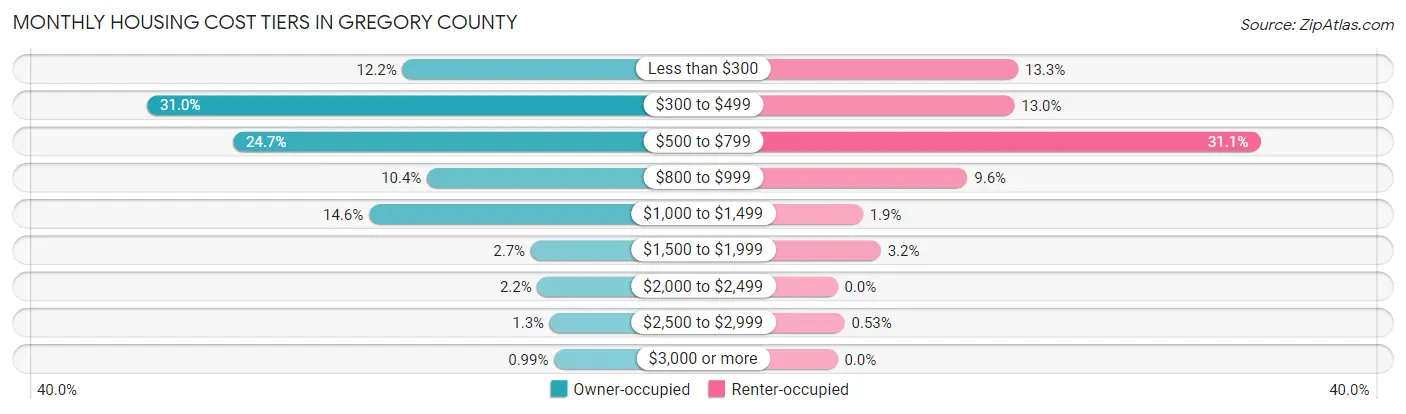
| Monthly Cost | Owner-occupied | Renter-occupied |
| Less than $300 | 148 (12.2%) | 50 (13.3%) |
| $300 to $499 | 377 (31.0%) | 49 (13.0%) |
| $500 to $799 | 300 (24.6%) | 117 (31.1%) |
| $800 to $999 | 126 (10.3%) | 36 (9.6%) |
| $1,000 to $1,499 | 178 (14.6%) | 7 (1.9%) |
| $1,500 to $1,999 | 33 (2.7%) | 12 (3.2%) |
| $2,000 to $2,499 | 27 (2.2%) | 0 (0.0%) |
| $2,500 to $2,999 | 16 (1.3%) | 2 (0.5%) |
| $3,000 or more | 12 (1.0%) | 0 (0.0%) |
| Total | 1,217 (100.0%) | 376 (100.0%) |
Physical Housing Characteristics in Gregory County
Housing Structures in Gregory County
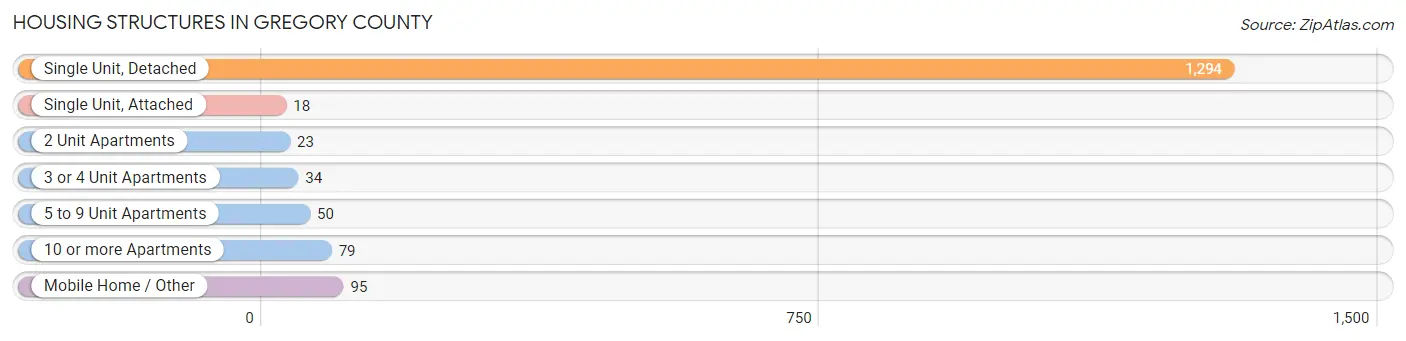
| Structure Type | # Housing Units | % Housing Units |
| Single Unit, Detached | 1,294 | 81.2% |
| Single Unit, Attached | 18 | 1.1% |
| 2 Unit Apartments | 23 | 1.4% |
| 3 or 4 Unit Apartments | 34 | 2.1% |
| 5 to 9 Unit Apartments | 50 | 3.1% |
| 10 or more Apartments | 79 | 5.0% |
| Mobile Home / Other | 95 | 6.0% |
| Total | 1,593 | 100.0% |
Housing Structures by Occupancy in Gregory County
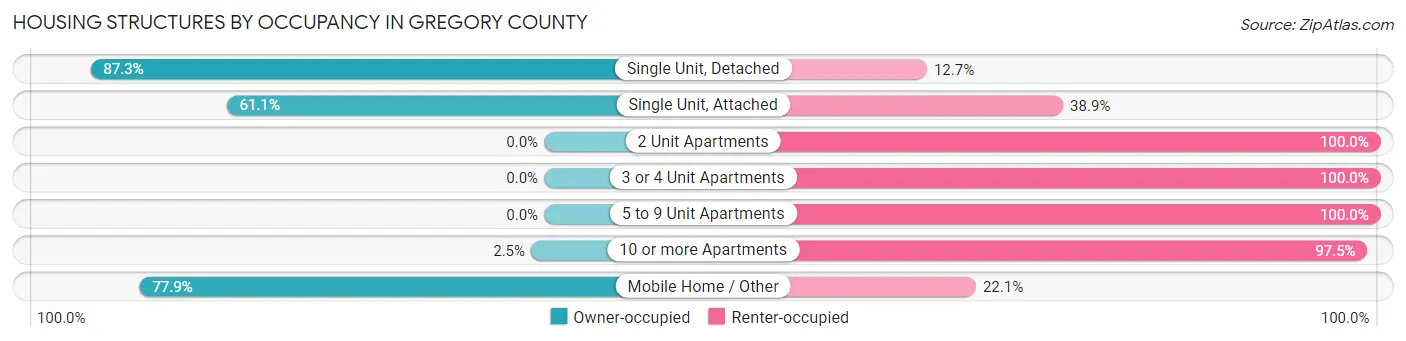
| Structure Type | Owner-occupied | Renter-occupied |
| Single Unit, Detached | 1,130 (87.3%) | 164 (12.7%) |
| Single Unit, Attached | 11 (61.1%) | 7 (38.9%) |
| 2 Unit Apartments | 0 (0.0%) | 23 (100.0%) |
| 3 or 4 Unit Apartments | 0 (0.0%) | 34 (100.0%) |
| 5 to 9 Unit Apartments | 0 (0.0%) | 50 (100.0%) |
| 10 or more Apartments | 2 (2.5%) | 77 (97.5%) |
| Mobile Home / Other | 74 (77.9%) | 21 (22.1%) |
| Total | 1,217 (76.4%) | 376 (23.6%) |
Housing Structures by Number of Rooms in Gregory County
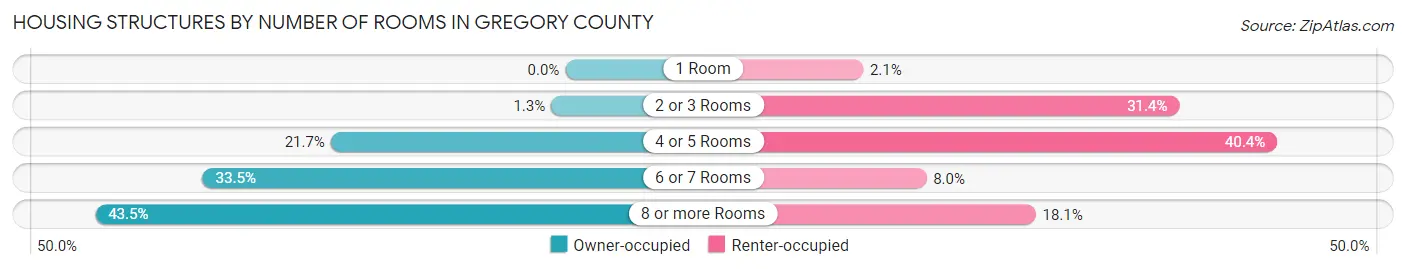
| Number of Rooms | Owner-occupied | Renter-occupied |
| 1 Room | 0 (0.0%) | 8 (2.1%) |
| 2 or 3 Rooms | 16 (1.3%) | 118 (31.4%) |
| 4 or 5 Rooms | 264 (21.7%) | 152 (40.4%) |
| 6 or 7 Rooms | 408 (33.5%) | 30 (8.0%) |
| 8 or more Rooms | 529 (43.5%) | 68 (18.1%) |
| Total | 1,217 (100.0%) | 376 (100.0%) |
Housing Structure by Heating Type in Gregory County
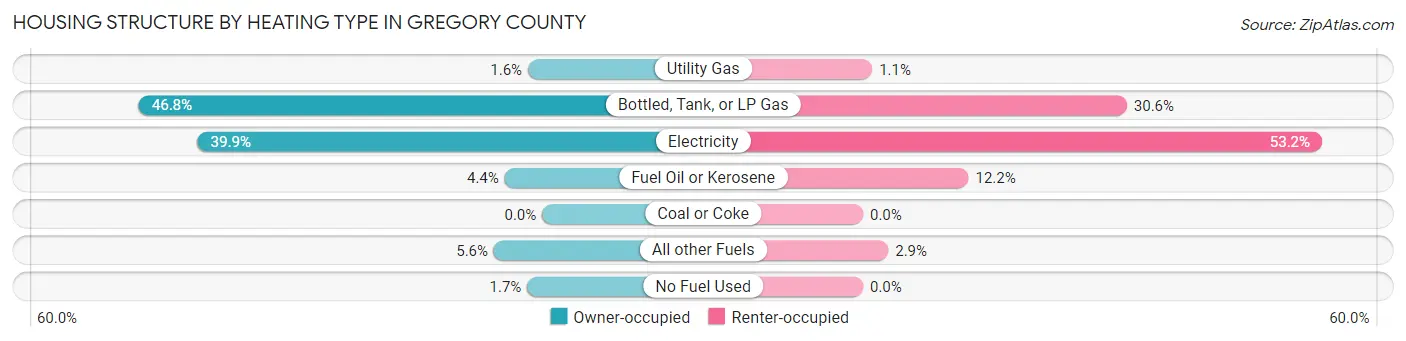
| Heating Type | Owner-occupied | Renter-occupied |
| Utility Gas | 20 (1.6%) | 4 (1.1%) |
| Bottled, Tank, or LP Gas | 569 (46.8%) | 115 (30.6%) |
| Electricity | 486 (39.9%) | 200 (53.2%) |
| Fuel Oil or Kerosene | 53 (4.3%) | 46 (12.2%) |
| Coal or Coke | 0 (0.0%) | 0 (0.0%) |
| All other Fuels | 68 (5.6%) | 11 (2.9%) |
| No Fuel Used | 21 (1.7%) | 0 (0.0%) |
| Total | 1,217 (100.0%) | 376 (100.0%) |
Household Vehicle Usage in Gregory County
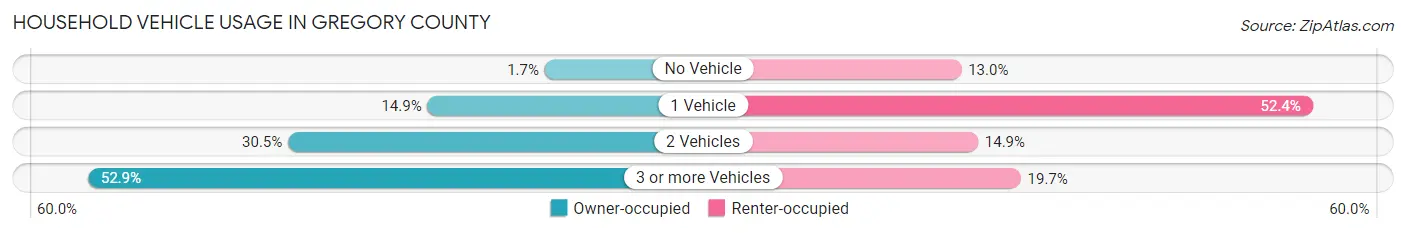
| Vehicles per Household | Owner-occupied | Renter-occupied |
| No Vehicle | 21 (1.7%) | 49 (13.0%) |
| 1 Vehicle | 181 (14.9%) | 197 (52.4%) |
| 2 Vehicles | 371 (30.5%) | 56 (14.9%) |
| 3 or more Vehicles | 644 (52.9%) | 74 (19.7%) |
| Total | 1,217 (100.0%) | 376 (100.0%) |
Real Estate & Mortgages in Gregory County
Real Estate and Mortgage Overview in Gregory County
| Characteristic | Without Mortgage | With Mortgage |
| Housing Units | 871 | 346 |
| Median Property Value | $91,900 | $139,200 |
| Median Household Income | $49,236 | $62 |
| Monthly Housing Costs | $464 | $11 |
| Real Estate Taxes | $1,177 | $9 |
Property Value by Mortgage Status in Gregory County
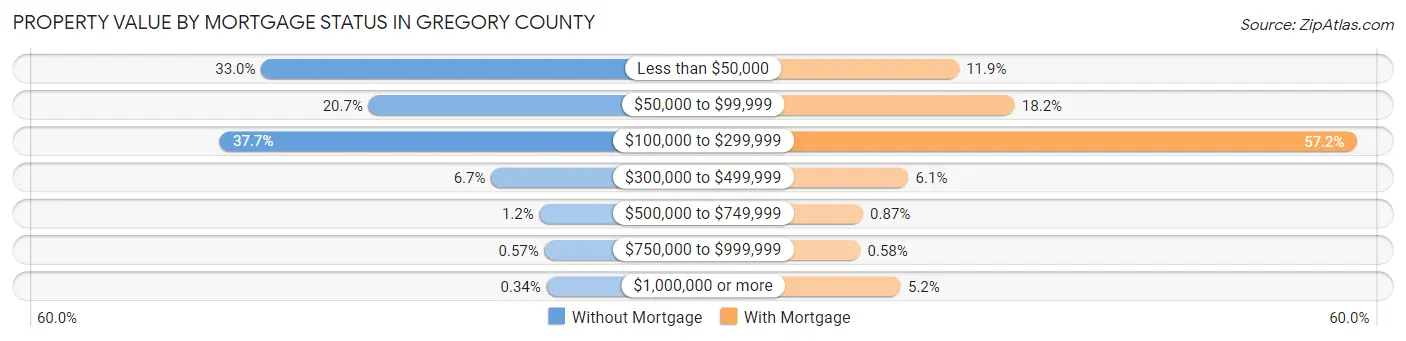
| Property Value | Without Mortgage | With Mortgage |
| Less than $50,000 | 287 (33.0%) | 41 (11.8%) |
| $50,000 to $99,999 | 180 (20.7%) | 63 (18.2%) |
| $100,000 to $299,999 | 328 (37.7%) | 198 (57.2%) |
| $300,000 to $499,999 | 58 (6.7%) | 21 (6.1%) |
| $500,000 to $749,999 | 10 (1.1%) | 3 (0.9%) |
| $750,000 to $999,999 | 5 (0.6%) | 2 (0.6%) |
| $1,000,000 or more | 3 (0.3%) | 18 (5.2%) |
| Total | 871 (100.0%) | 346 (100.0%) |
Household Income by Mortgage Status in Gregory County
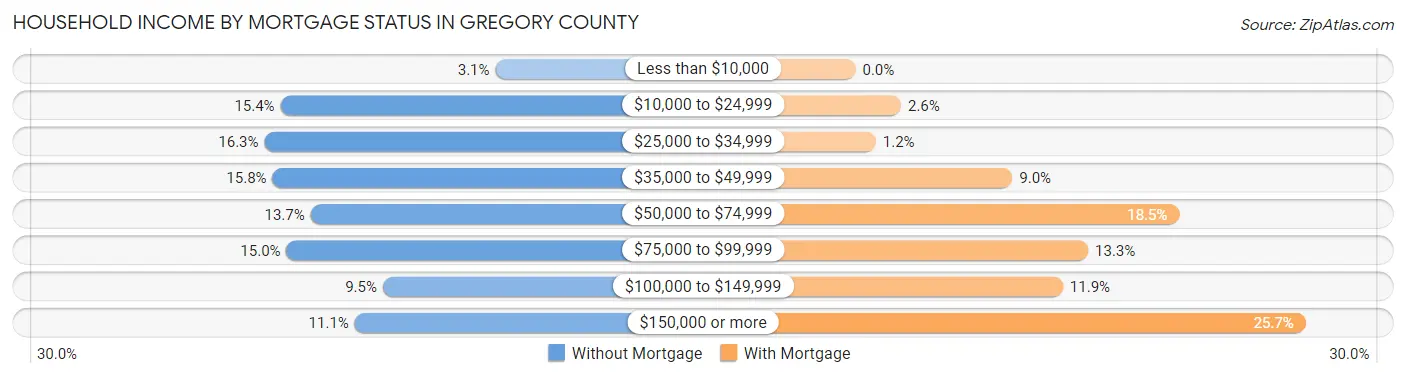
| Household Income | Without Mortgage | With Mortgage |
| Less than $10,000 | 27 (3.1%) | 0 (0.0%) |
| $10,000 to $24,999 | 134 (15.4%) | 9 (2.6%) |
| $25,000 to $34,999 | 142 (16.3%) | 4 (1.2%) |
| $35,000 to $49,999 | 138 (15.8%) | 31 (9.0%) |
| $50,000 to $74,999 | 119 (13.7%) | 64 (18.5%) |
| $75,000 to $99,999 | 131 (15.0%) | 46 (13.3%) |
| $100,000 to $149,999 | 83 (9.5%) | 41 (11.8%) |
| $150,000 or more | 97 (11.1%) | 89 (25.7%) |
| Total | 871 (100.0%) | 346 (100.0%) |
Property Value to Household Income Ratio in Gregory County
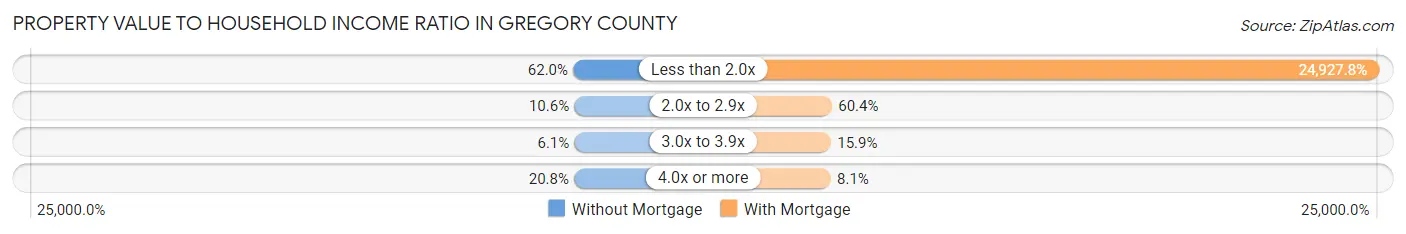
| Value-to-Income Ratio | Without Mortgage | With Mortgage |
| Less than 2.0x | 540 (62.0%) | 86,250 (24,927.8%) |
| 2.0x to 2.9x | 92 (10.6%) | 209 (60.4%) |
| 3.0x to 3.9x | 53 (6.1%) | 55 (15.9%) |
| 4.0x or more | 181 (20.8%) | 28 (8.1%) |
| Total | 871 (100.0%) | 346 (100.0%) |
Real Estate Taxes by Mortgage Status in Gregory County
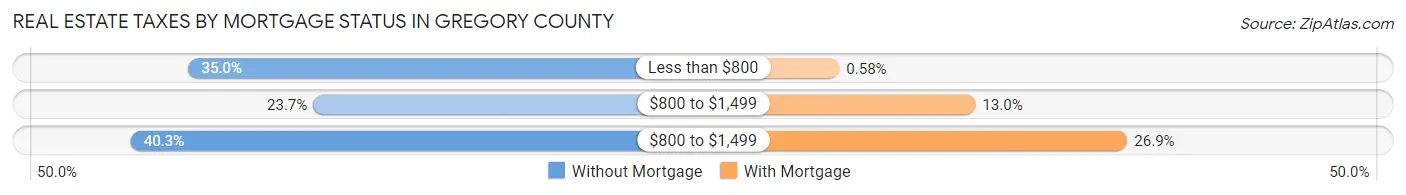
| Property Taxes | Without Mortgage | With Mortgage |
| Less than $800 | 305 (35.0%) | 2 (0.6%) |
| $800 to $1,499 | 206 (23.6%) | 45 (13.0%) |
| $800 to $1,499 | 351 (40.3%) | 93 (26.9%) |
| Total | 871 (100.0%) | 346 (100.0%) |
Health & Disability in Gregory County
Health Insurance Coverage by Age in Gregory County
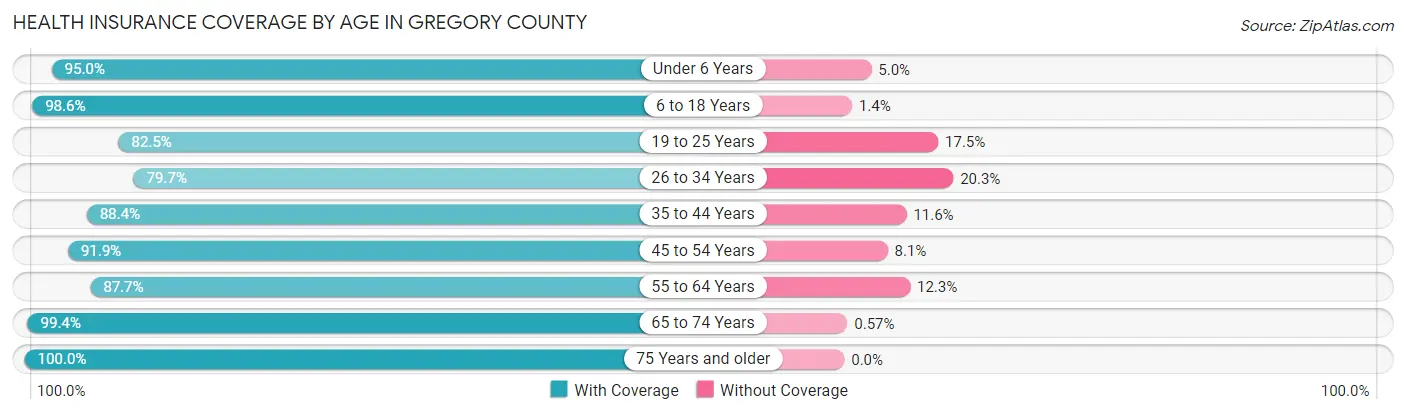
| Age Bracket | With Coverage | Without Coverage |
| Under 6 Years | 320 (95.0%) | 17 (5.0%) |
| 6 to 18 Years | 688 (98.6%) | 10 (1.4%) |
| 19 to 25 Years | 165 (82.5%) | 35 (17.5%) |
| 26 to 34 Years | 255 (79.7%) | 65 (20.3%) |
| 35 to 44 Years | 366 (88.4%) | 48 (11.6%) |
| 45 to 54 Years | 387 (91.9%) | 34 (8.1%) |
| 55 to 64 Years | 508 (87.7%) | 71 (12.3%) |
| 65 to 74 Years | 527 (99.4%) | 3 (0.6%) |
| 75 Years and older | 415 (100.0%) | 0 (0.0%) |
| Total | 3,631 (92.8%) | 283 (7.2%) |
Health Insurance Coverage by Citizenship Status in Gregory County
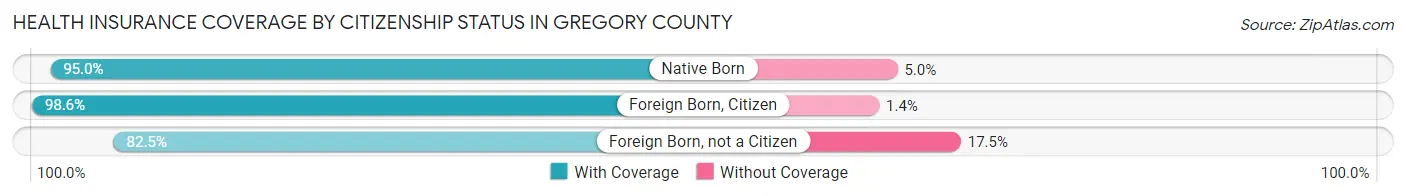
| Citizenship Status | With Coverage | Without Coverage |
| Native Born | 320 (95.0%) | 17 (5.0%) |
| Foreign Born, Citizen | 688 (98.6%) | 10 (1.4%) |
| Foreign Born, not a Citizen | 165 (82.5%) | 35 (17.5%) |
Health Insurance Coverage by Household Income in Gregory County
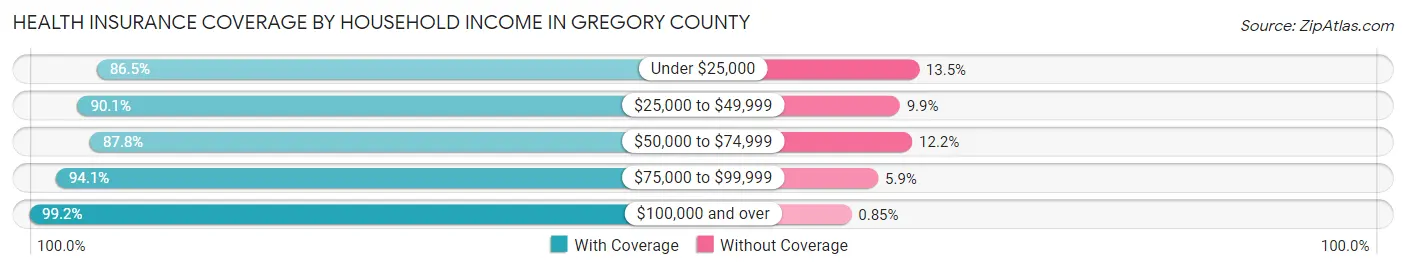
| Household Income | With Coverage | Without Coverage |
| Under $25,000 | 557 (86.5%) | 87 (13.5%) |
| $25,000 to $49,999 | 790 (90.1%) | 87 (9.9%) |
| $50,000 to $74,999 | 459 (87.8%) | 64 (12.2%) |
| $75,000 to $99,999 | 545 (94.1%) | 34 (5.9%) |
| $100,000 and over | 1,280 (99.2%) | 11 (0.9%) |
Public vs Private Health Insurance Coverage by Age in Gregory County
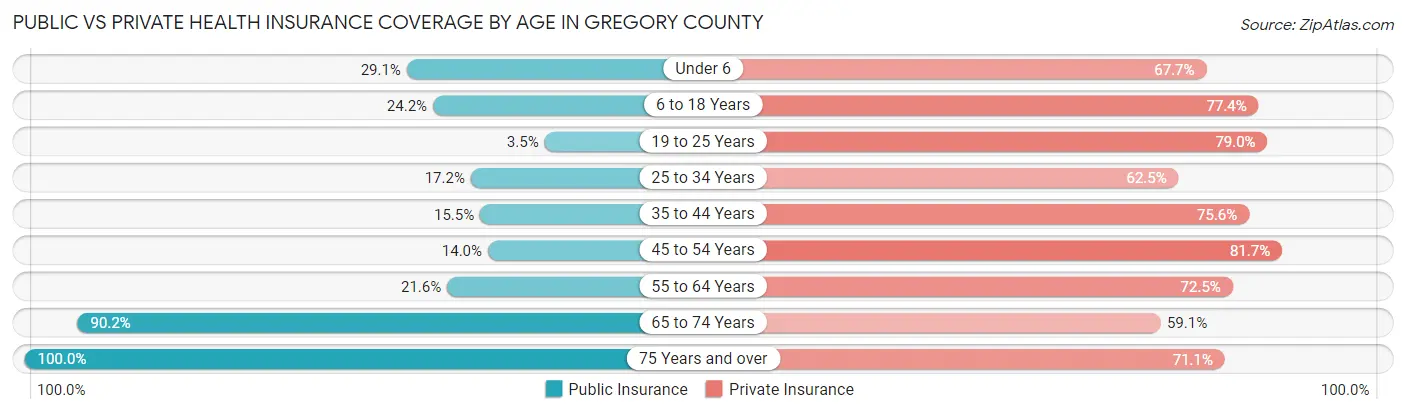
| Age Bracket | Public Insurance | Private Insurance |
| Under 6 | 98 (29.1%) | 228 (67.7%) |
| 6 to 18 Years | 169 (24.2%) | 540 (77.4%) |
| 19 to 25 Years | 7 (3.5%) | 158 (79.0%) |
| 25 to 34 Years | 55 (17.2%) | 200 (62.5%) |
| 35 to 44 Years | 64 (15.5%) | 313 (75.6%) |
| 45 to 54 Years | 59 (14.0%) | 344 (81.7%) |
| 55 to 64 Years | 125 (21.6%) | 420 (72.5%) |
| 65 to 74 Years | 478 (90.2%) | 313 (59.1%) |
| 75 Years and over | 415 (100.0%) | 295 (71.1%) |
| Total | 1,470 (37.6%) | 2,811 (71.8%) |
Disability Status by Sex by Age in Gregory County
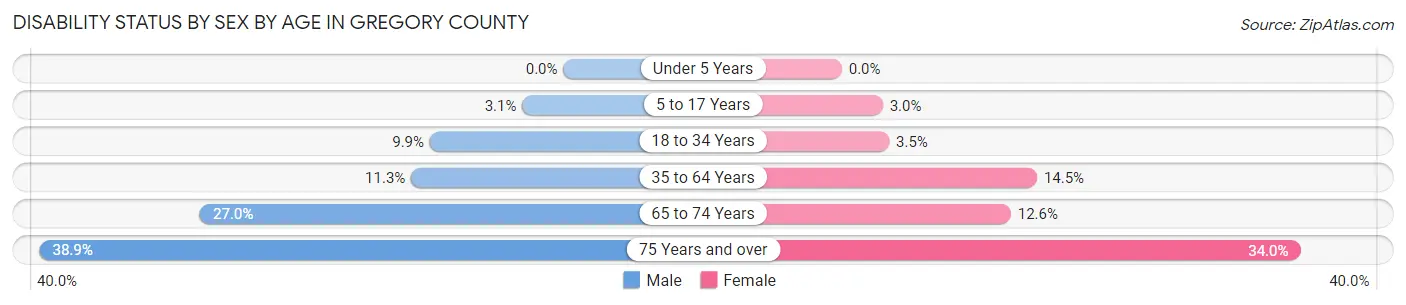
| Age Bracket | Male | Female |
| Under 5 Years | 0 (0.0%) | 0 (0.0%) |
| 5 to 17 Years | 12 (3.0%) | 9 (3.0%) |
| 18 to 34 Years | 32 (9.9%) | 10 (3.5%) |
| 35 to 64 Years | 81 (11.3%) | 101 (14.5%) |
| 65 to 74 Years | 72 (27.0%) | 33 (12.6%) |
| 75 Years and over | 70 (38.9%) | 80 (34.0%) |
Disability Class by Sex by Age in Gregory County
Disability Class: Hearing Difficulty
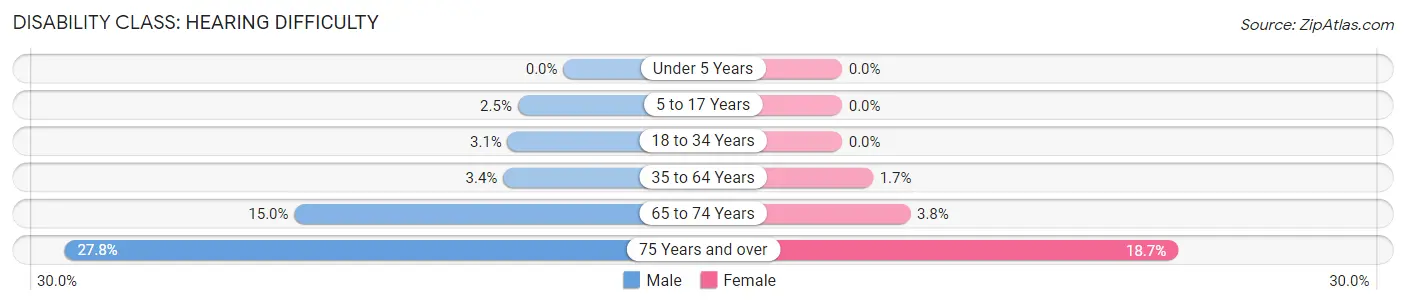
| Age Bracket | Male | Female |
| Under 5 Years | 0 (0.0%) | 0 (0.0%) |
| 5 to 17 Years | 10 (2.5%) | 0 (0.0%) |
| 18 to 34 Years | 10 (3.1%) | 0 (0.0%) |
| 35 to 64 Years | 24 (3.4%) | 12 (1.7%) |
| 65 to 74 Years | 40 (15.0%) | 10 (3.8%) |
| 75 Years and over | 50 (27.8%) | 44 (18.7%) |
Disability Class: Vision Difficulty
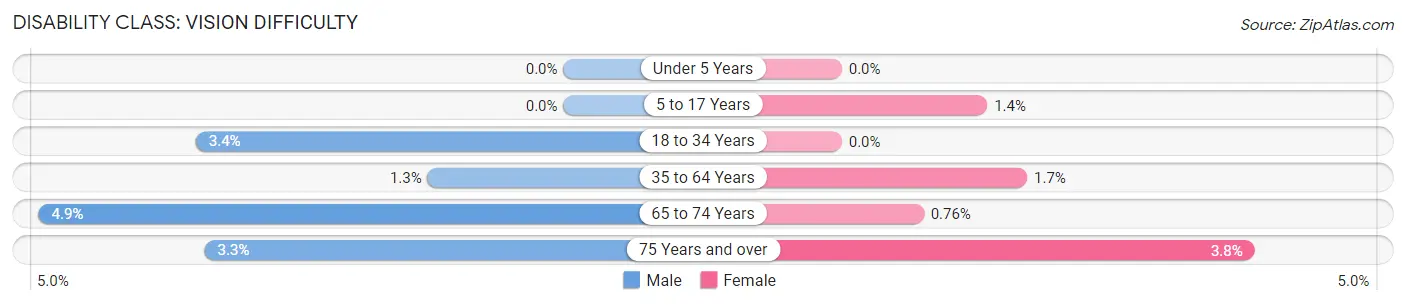
| Age Bracket | Male | Female |
| Under 5 Years | 0 (0.0%) | 0 (0.0%) |
| 5 to 17 Years | 0 (0.0%) | 4 (1.3%) |
| 18 to 34 Years | 11 (3.4%) | 0 (0.0%) |
| 35 to 64 Years | 9 (1.3%) | 12 (1.7%) |
| 65 to 74 Years | 13 (4.9%) | 2 (0.8%) |
| 75 Years and over | 6 (3.3%) | 9 (3.8%) |
Disability Class: Cognitive Difficulty
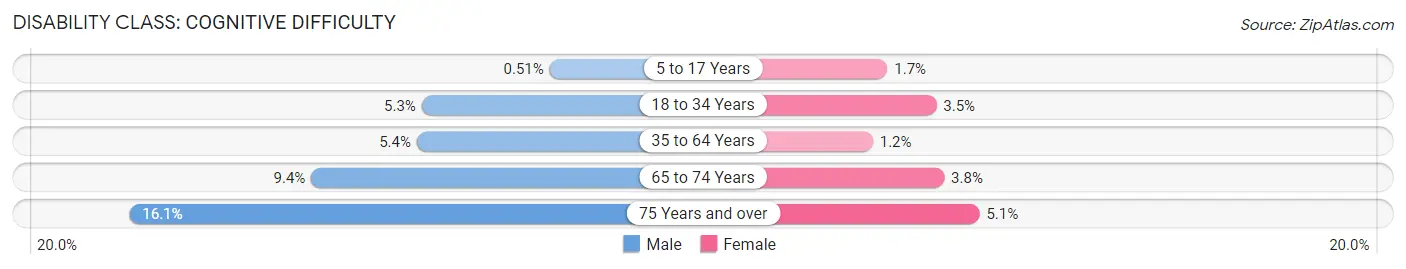
| Age Bracket | Male | Female |
| 5 to 17 Years | 2 (0.5%) | 5 (1.7%) |
| 18 to 34 Years | 17 (5.3%) | 10 (3.5%) |
| 35 to 64 Years | 39 (5.4%) | 8 (1.1%) |
| 65 to 74 Years | 25 (9.4%) | 10 (3.8%) |
| 75 Years and over | 29 (16.1%) | 12 (5.1%) |
Disability Class: Ambulatory Difficulty
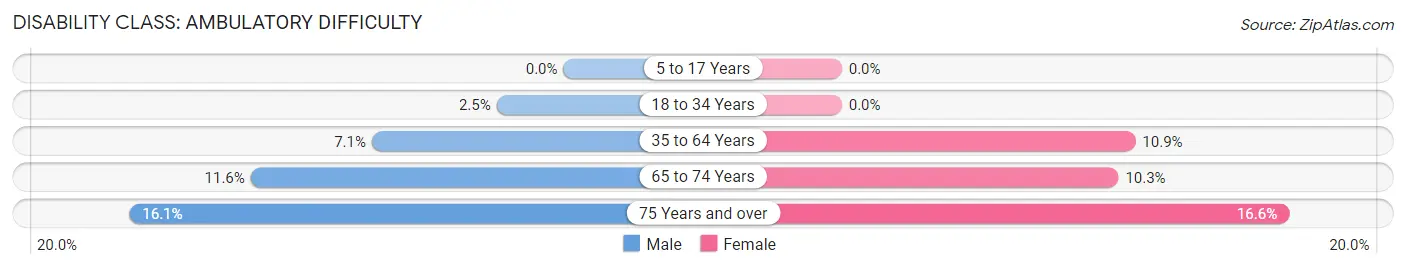
| Age Bracket | Male | Female |
| 5 to 17 Years | 0 (0.0%) | 0 (0.0%) |
| 18 to 34 Years | 8 (2.5%) | 0 (0.0%) |
| 35 to 64 Years | 51 (7.1%) | 76 (10.9%) |
| 65 to 74 Years | 31 (11.6%) | 27 (10.3%) |
| 75 Years and over | 29 (16.1%) | 39 (16.6%) |
Disability Class: Self-Care Difficulty
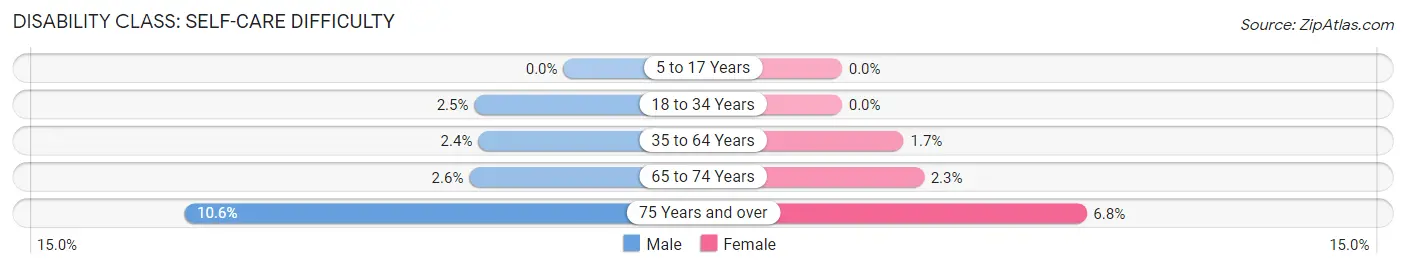
| Age Bracket | Male | Female |
| 5 to 17 Years | 0 (0.0%) | 0 (0.0%) |
| 18 to 34 Years | 8 (2.5%) | 0 (0.0%) |
| 35 to 64 Years | 17 (2.4%) | 12 (1.7%) |
| 65 to 74 Years | 7 (2.6%) | 6 (2.3%) |
| 75 Years and over | 19 (10.6%) | 16 (6.8%) |
Technology Access in Gregory County
Computing Device Access in Gregory County
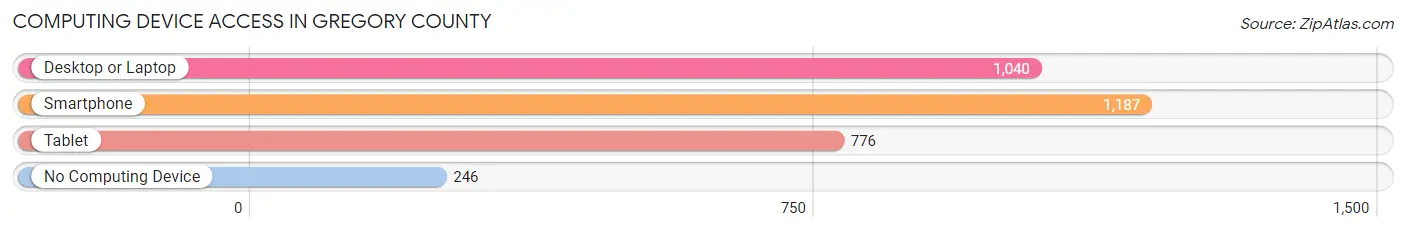
| Device Type | # Households | % Households |
| Desktop or Laptop | 1,040 | 65.3% |
| Smartphone | 1,187 | 74.5% |
| Tablet | 776 | 48.7% |
| No Computing Device | 246 | 15.4% |
| Total | 1,593 | 100.0% |
Internet Access in Gregory County
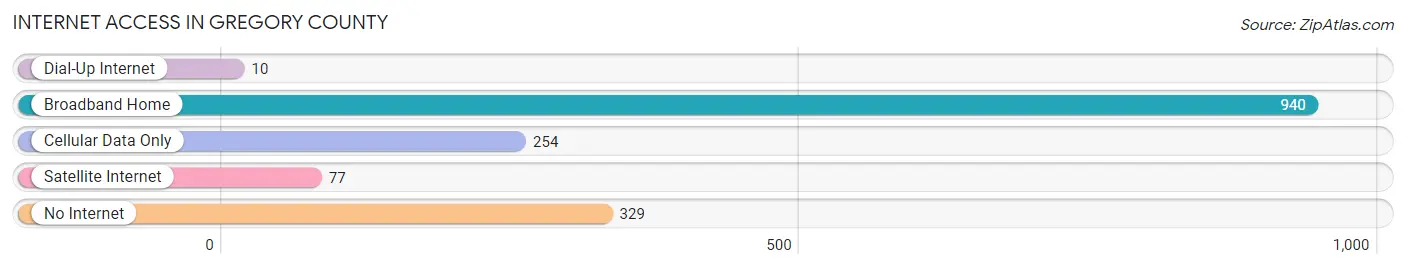
| Internet Type | # Households | % Households |
| Dial-Up Internet | 10 | 0.6% |
| Broadband Home | 940 | 59.0% |
| Cellular Data Only | 254 | 15.9% |
| Satellite Internet | 77 | 4.8% |
| No Internet | 329 | 20.6% |
| Total | 1,593 | 100.0% |
Gregory County Summary
Gregory County is located in the southeastern corner of South Dakota, and is bordered by the states of Nebraska and Iowa. The county seat is Burke, and the county was established in 1883. The county has a total area of 1,072 square miles, and a population of 4,845 as of the 2010 census.
History
The area that is now Gregory County was originally inhabited by the Sioux and other Native American tribes. The first white settlers arrived in the area in the late 1870s, and the county was officially established in 1883. The county was named after James W. Gregory, a prominent politician in the area.
The county was largely agricultural in its early years, with the main crops being wheat, corn, and oats. The county also had a thriving livestock industry, with cattle, sheep, and hogs being the main animals raised.
In the early 1900s, the county began to experience a population boom, as more settlers moved to the area. This population growth was largely due to the construction of the Chicago, Milwaukee, St. Paul and Pacific Railroad, which ran through the county. The railroad brought new economic opportunities to the area, and helped to spur the growth of towns such as Burke, Gregory, and Dallas.
Geography
Gregory County is located in the southeastern corner of South Dakota, and is bordered by the states of Nebraska and Iowa. The county has a total area of 1,072 square miles, and is mostly flat, with some rolling hills in the western part of the county. The county is drained by the Missouri River, which forms its eastern border.
The county has a semi-arid climate, with hot summers and cold winters. The average annual temperature is 48°F, and the average annual precipitation is 19 inches.
Economy
The economy of Gregory County is largely based on agriculture. The main crops grown in the county are wheat, corn, and oats. The county also has a thriving livestock industry, with cattle, sheep, and hogs being the main animals raised.
The county also has a growing tourism industry, with visitors coming to the area to enjoy its natural beauty and outdoor activities. The county is home to several state parks, including the Badlands National Park, which is a popular destination for hikers and campers.
Demographics
As of the 2010 census, the population of Gregory County was 4,845. The population is largely white (94.3%), with small percentages of Native American (2.2%), African American (1.2%), and Asian (0.7%) residents. The median household income is $45,813, and the median age is 44.7 years.
The county is served by two school districts, the Burke School District and the Gregory School District. The county also has several private schools, including Gregory Christian School and Burke Lutheran School.
Common Questions
What is Per Capita Income in Gregory County?
Per Capita income in Gregory County is $31,505.
What is the Median Family Income in Gregory County?
Median Family Income in Gregory County is $73,068.
What is the Median Household income in Gregory County?
Median Household Income in Gregory County is $48,272.
What is Income or Wage Gap in Gregory County?
Income or Wage Gap in Gregory County is 17.3%.
Women in Gregory County earn 82.7 cents for every dollar earned by a man.
What is Inequality or Gini Index in Gregory County?
Inequality or Gini Index in Gregory County is 0.46.
What is the Total Population of Gregory County?
Total Population of Gregory County is 3,983.
What is the Total Male Population of Gregory County?
Total Male Population of Gregory County is 2,063.
What is the Total Female Population of Gregory County?
Total Female Population of Gregory County is 1,920.
What is the Ratio of Males per 100 Females in Gregory County?
There are 107.45 Males per 100 Females in Gregory County.
What is the Ratio of Females per 100 Males in Gregory County?
There are 93.07 Females per 100 Males in Gregory County.
What is the Median Population Age in Gregory County?
Median Population Age in Gregory County is 45.7 Years.
What is the Average Family Size in Gregory County
Average Family Size in Gregory County is 3.4 People.
What is the Average Household Size in Gregory County
Average Household Size in Gregory County is 2.5 People.
How Large is the Labor Force in Gregory County?
There are 1,984 People in the Labor Forcein in Gregory County.
What is the Percentage of People in the Labor Force in Gregory County?
63.2% of People are in the Labor Force in Gregory County.
What is the Unemployment Rate in Gregory County?
Unemployment Rate in Gregory County is 2.6%.