Bennett County, SD Map & Demographics
Bennett County Map

Bennett County Overview
$22,068
PER CAPITA INCOME
$56,250
AVG FAMILY INCOME
$44,821
AVG HOUSEHOLD INCOME
0.3%
WAGE / INCOME GAP [ % ]
99.7¢/ $1
WAGE / INCOME GAP [ $ ]
0.52
INEQUALITY / GINI INDEX
3,391
TOTAL POPULATION
1,597
MALE POPULATION
1,794
FEMALE POPULATION
89.02
MALES / 100 FEMALES
112.34
FEMALES / 100 MALES
27.0
MEDIAN AGE
4.0
AVG FAMILY SIZE
3.3
AVG HOUSEHOLD SIZE
1,183
LABOR FORCE [ PEOPLE ]
50.9%
PERCENT IN LABOR FORCE
7.9%
UNEMPLOYMENT RATE
Bennett County Area Codes
Income in Bennett County
Income Overview in Bennett County
Per Capita Income in Bennett County is $22,068, while median incomes of families and households are $56,250 and $44,821 respectively.
| Characteristic | Number | Measure |
| Per Capita Income | 3,391 | $22,068 |
| Median Family Income | 741 | $56,250 |
| Mean Family Income | 741 | $75,579 |
| Median Household Income | 1,014 | $44,821 |
| Mean Household Income | 1,014 | $66,336 |
| Income Deficit | 741 | $0 |
| Wage / Income Gap (%) | 3,391 | 0.31% |
| Wage / Income Gap ($) | 3,391 | 99.69¢ per $1 |
| Gini / Inequality Index | 3,391 | 0.52 |
Earnings by Sex in Bennett County
Average Earnings in Bennett County are $35,762, $35,682 for men and $35,792 for women, a difference of 0.3%.

| Sex | Number | Average Earnings |
| Male | 634 (53.5%) | $35,682 |
| Female | 551 (46.5%) | $35,792 |
| Total | 1,185 (100.0%) | $35,762 |
Earnings by Sex by Income Bracket in Bennett County
The most common earnings brackets in Bennett County are $100,000+ for men (93 | 14.7%) and $45,000 to $49,999 for women (51 | 9.3%).

| Income | Male | Female |
| $2,499 or less | 36 (5.7%) | 21 (3.8%) |
| $2,500 to $4,999 | 25 (3.9%) | 29 (5.3%) |
| $5,000 to $7,499 | 20 (3.2%) | 29 (5.3%) |
| $7,500 to $9,999 | 23 (3.6%) | 23 (4.2%) |
| $10,000 to $12,499 | 15 (2.4%) | 39 (7.1%) |
| $12,500 to $14,999 | 18 (2.8%) | 23 (4.2%) |
| $15,000 to $17,499 | 27 (4.3%) | 0 (0.0%) |
| $17,500 to $19,999 | 10 (1.6%) | 3 (0.5%) |
| $20,000 to $22,499 | 4 (0.6%) | 35 (6.4%) |
| $22,500 to $24,999 | 24 (3.8%) | 0 (0.0%) |
| $25,000 to $29,999 | 65 (10.2%) | 17 (3.1%) |
| $30,000 to $34,999 | 47 (7.4%) | 47 (8.5%) |
| $35,000 to $39,999 | 33 (5.2%) | 47 (8.5%) |
| $40,000 to $44,999 | 17 (2.7%) | 46 (8.4%) |
| $45,000 to $49,999 | 9 (1.4%) | 51 (9.3%) |
| $50,000 to $54,999 | 53 (8.4%) | 14 (2.5%) |
| $55,000 to $64,999 | 47 (7.4%) | 33 (6.0%) |
| $65,000 to $74,999 | 17 (2.7%) | 31 (5.6%) |
| $75,000 to $99,999 | 51 (8.0%) | 39 (7.1%) |
| $100,000+ | 93 (14.7%) | 24 (4.4%) |
| Total | 634 (100.0%) | 551 (100.0%) |
Earnings by Sex by Educational Attainment in Bennett County
Average earnings in Bennett County are $40,417 for men and $38,088 for women, a difference of 5.8%. Men with an educational attainment of college or associate's degree enjoy the highest average annual earnings of $63,250, while those with less than high school education earn the least with $15,625. Women with an educational attainment of graduate degree earn the most with the average annual earnings of $75,139, while those with high school diploma education have the smallest earnings of $30,313.

| Educational Attainment | Male Income | Female Income |
| Less than High School | $15,625 | $0 |
| High School Diploma | $44,821 | $30,313 |
| College or Associate's Degree | $63,250 | $35,104 |
| Bachelor's Degree | $31,667 | $49,327 |
| Graduate Degree | $38,750 | $75,139 |
| Total | $40,417 | $38,088 |
Family Income in Bennett County
Family Income Brackets in Bennett County
According to the Bennett County family income data, there are 141 families falling into the $50,000 to $74,999 income range, which is the most common income bracket and makes up 19.0% of all families. Conversely, the $150,000 to $199,999 income bracket is the least frequent group with only 29 families (3.9%) belonging to this category.

| Income Bracket | # Families | % Families |
| Less than $10,000 | 101 | 13.6% |
| $10,000 to $14,999 | 43 | 5.8% |
| $15,000 to $24,999 | 59 | 8.0% |
| $25,000 to $34,999 | 71 | 9.6% |
| $35,000 to $49,999 | 78 | 10.5% |
| $50,000 to $74,999 | 141 | 19.0% |
| $75,000 to $99,999 | 82 | 11.1% |
| $100,000 to $149,999 | 71 | 9.6% |
| $150,000 to $199,999 | 29 | 3.9% |
| $200,000+ | 66 | 8.9% |
Family Income by Famaliy Size in Bennett County
5-person families (20 | 2.7%) account for the highest median family income in Bennett County with $100,714 per family, while 2-person families (344 | 46.4%) have the highest median income of $27,829 per family member.

| Income Bracket | # Families | Median Income |
| 2-Person Families | 344 (46.4%) | $55,658 |
| 3-Person Families | 122 (16.5%) | $51,667 |
| 4-Person Families | 111 (15.0%) | $0 |
| 5-Person Families | 20 (2.7%) | $100,714 |
| 6-Person Families | 81 (10.9%) | $0 |
| 7+ Person Families | 63 (8.5%) | $0 |
| Total | 741 (100.0%) | $56,250 |
Family Income by Number of Earners in Bennett County
The median family income in Bennett County is $56,250, with families comprising 3+ earners (83) having the highest median family income of $250,001, while families with no earners (232) have the lowest median family income of $11,042, accounting for 11.2% and 31.3% of families, respectively.
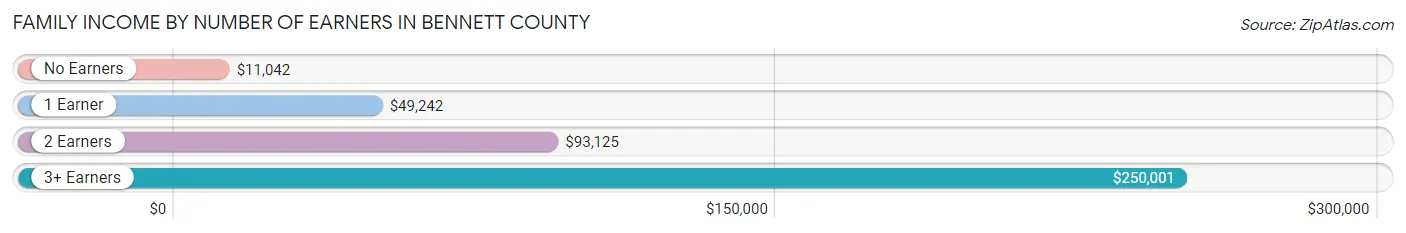
| Number of Earners | # Families | Median Income |
| No Earners | 232 (31.3%) | $11,042 |
| 1 Earner | 206 (27.8%) | $49,242 |
| 2 Earners | 220 (29.7%) | $93,125 |
| 3+ Earners | 83 (11.2%) | $250,001 |
| Total | 741 (100.0%) | $56,250 |
Household Income in Bennett County
Household Income Brackets in Bennett County
With 179 households falling in the category, the $50,000 to $74,999 income range is the most frequent in Bennett County, accounting for 17.6% of all households. In contrast, only 39 households (3.8%) fall into the $150,000 to $199,999 income bracket, making it the least populous group.

| Income Bracket | # Households | % Households |
| Less than $10,000 | 120 | 11.8% |
| $10,000 to $14,999 | 60 | 5.9% |
| $15,000 to $24,999 | 137 | 13.5% |
| $25,000 to $34,999 | 100 | 9.9% |
| $35,000 to $49,999 | 142 | 14.0% |
| $50,000 to $74,999 | 179 | 17.7% |
| $75,000 to $99,999 | 86 | 8.5% |
| $100,000 to $149,999 | 85 | 8.4% |
| $150,000 to $199,999 | 39 | 3.8% |
| $200,000+ | 66 | 6.5% |
Household Income by Householder Age in Bennett County
The median household income in Bennett County is $44,821, with the highest median household income of $70,795 found in the 45 to 64 years age bracket for the primary householder. A total of 377 households (37.2%) fall into this category. Meanwhile, the 15 to 24 years age bracket for the primary householder has the lowest median household income of $0, with 6 households (0.6%) in this group.

| Income Bracket | # Households | Median Income |
| 15 to 24 Years | 6 (0.6%) | $0 |
| 25 to 44 Years | 344 (33.9%) | $48,258 |
| 45 to 64 Years | 377 (37.2%) | $70,795 |
| 65+ Years | 287 (28.3%) | $33,516 |
| Total | 1,014 (100.0%) | $44,821 |
Poverty in Bennett County
Income Below Poverty by Sex and Age in Bennett County
With 28.3% poverty level for males and 30.8% for females among the residents of Bennett County, 5 year old males and 15 year old females are the most vulnerable to poverty, with 31 males (68.9%) and 86 females (66.1%) in their respective age groups living below the poverty level.

| Age Bracket | Male | Female |
| Under 5 Years | 33 (26.0%) | 75 (57.7%) |
| 5 Years | 31 (68.9%) | 10 (27.0%) |
| 6 to 11 Years | 51 (28.2%) | 61 (32.8%) |
| 12 to 14 Years | 69 (66.3%) | 67 (57.3%) |
| 15 Years | 0 (0.0%) | 86 (66.1%) |
| 16 and 17 Years | 0 (0.0%) | 0 (0.0%) |
| 18 to 24 Years | 92 (45.8%) | 17 (13.0%) |
| 25 to 34 Years | 47 (20.9%) | 32 (21.0%) |
| 35 to 44 Years | 63 (45.0%) | 85 (39.9%) |
| 45 to 54 Years | 0 (0.0%) | 44 (25.0%) |
| 55 to 64 Years | 46 (27.1%) | 17 (13.9%) |
| 65 to 74 Years | 11 (9.4%) | 18 (14.0%) |
| 75 Years and over | 4 (5.8%) | 32 (36.8%) |
| Total | 447 (28.3%) | 544 (30.8%) |
Income Above Poverty by Sex and Age in Bennett County
According to the poverty statistics in Bennett County, males aged 15 years and females aged 16 and 17 years are the age groups that are most secure financially, with 100.0% of males and 100.0% of females in these age groups living above the poverty line.
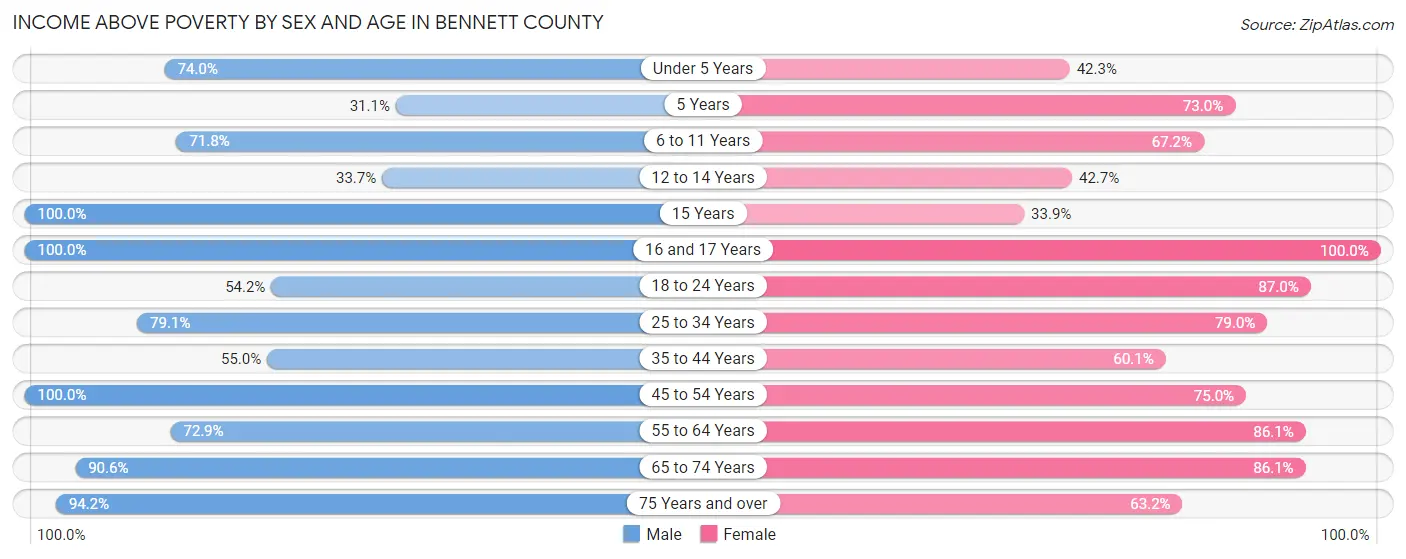
| Age Bracket | Male | Female |
| Under 5 Years | 94 (74.0%) | 55 (42.3%) |
| 5 Years | 14 (31.1%) | 27 (73.0%) |
| 6 to 11 Years | 130 (71.8%) | 125 (67.2%) |
| 12 to 14 Years | 35 (33.7%) | 50 (42.7%) |
| 15 Years | 10 (100.0%) | 44 (33.9%) |
| 16 and 17 Years | 39 (100.0%) | 156 (100.0%) |
| 18 to 24 Years | 109 (54.2%) | 114 (87.0%) |
| 25 to 34 Years | 178 (79.1%) | 120 (78.9%) |
| 35 to 44 Years | 77 (55.0%) | 128 (60.1%) |
| 45 to 54 Years | 154 (100.0%) | 132 (75.0%) |
| 55 to 64 Years | 124 (72.9%) | 105 (86.1%) |
| 65 to 74 Years | 106 (90.6%) | 111 (86.1%) |
| 75 Years and over | 65 (94.2%) | 55 (63.2%) |
| Total | 1,135 (71.7%) | 1,222 (69.2%) |
Income Below Poverty Among Married-Couple Families in Bennett County
The poverty statistics for married-couple families in Bennett County show that 13.0% or 57 of the total 440 families live below the poverty line. Families with 3 or 4 children have the highest poverty rate of 38.0%, comprising of 19 families. On the other hand, families with 5 or more children have the lowest poverty rate of 0.0%, which includes 0 families.

| Children | Above Poverty | Below Poverty |
| No Children | 224 (86.2%) | 36 (13.9%) |
| 1 or 2 Children | 110 (98.2%) | 2 (1.8%) |
| 3 or 4 Children | 31 (62.0%) | 19 (38.0%) |
| 5 or more Children | 18 (100.0%) | 0 (0.0%) |
| Total | 383 (87.1%) | 57 (13.0%) |
Income Below Poverty Among Single-Parent Households in Bennett County
According to the poverty data in Bennett County, 33.3% or 12 single-father households and 54.0% or 143 single-mother households are living below the poverty line. Among single-father households, those with 3 or 4 children have the highest poverty rate, with 7 households (100.0%) experiencing poverty. Likewise, among single-mother households, those with 3 or 4 children have the highest poverty rate, with 43 households (89.6%) falling below the poverty line.

| Children | Single Father | Single Mother |
| No Children | 0 (0.0%) | 52 (70.3%) |
| 1 or 2 Children | 0 (0.0%) | 34 (30.4%) |
| 3 or 4 Children | 7 (100.0%) | 43 (89.6%) |
| 5 or more Children | 5 (100.0%) | 14 (45.2%) |
| Total | 12 (33.3%) | 143 (54.0%) |
Income Below Poverty Among Married-Couple vs Single-Parent Households in Bennett County
The poverty data for Bennett County shows that 57 of the married-couple family households (13.0%) and 155 of the single-parent households (51.5%) are living below the poverty level. Within the married-couple family households, those with 3 or 4 children have the highest poverty rate, with 19 households (38.0%) falling below the poverty line. Among the single-parent households, those with 3 or 4 children have the highest poverty rate, with 50 household (90.9%) living below poverty.

| Children | Married-Couple Families | Single-Parent Households |
| No Children | 36 (13.9%) | 52 (65.0%) |
| 1 or 2 Children | 2 (1.8%) | 34 (26.2%) |
| 3 or 4 Children | 19 (38.0%) | 50 (90.9%) |
| 5 or more Children | 0 (0.0%) | 19 (52.8%) |
| Total | 57 (13.0%) | 155 (51.5%) |
Race in Bennett County
The most populous races in Bennett County are Native / Alaskan (1,822 | 53.7%), White / Caucasian (1,373 | 40.5%), and Hispanic or Latino (315 | 9.3%).

| Race | # Population | % Population |
| Asian | 45 | 1.3% |
| Black / African American | 6 | 0.2% |
| Hawaiian / Pacific | 0 | 0.0% |
| Hispanic or Latino | 315 | 9.3% |
| Native / Alaskan | 1,822 | 53.7% |
| White / Caucasian | 1,373 | 40.5% |
| Two or more Races | 85 | 2.5% |
| Some other Race | 60 | 1.8% |
| Total | 3,391 | 100.0% |
Ancestry in Bennett County
The most populous ancestries reported in Bennett County are Sioux (1,328 | 39.2%), German (727 | 21.4%), Mexican (199 | 5.9%), English (175 | 5.2%), and Norwegian (129 | 3.8%), together accounting for 75.4% of all Bennett County residents.

| Ancestry | # Population | % Population |
| American | 51 | 1.5% |
| British | 38 | 1.1% |
| Cherokee | 12 | 0.4% |
| Cheyenne | 1 | 0.0% |
| Crow | 39 | 1.1% |
| Czech | 39 | 1.1% |
| Czechoslovakian | 12 | 0.4% |
| Danish | 69 | 2.0% |
| Dutch | 14 | 0.4% |
| English | 175 | 5.2% |
| Ethiopian | 6 | 0.2% |
| European | 5 | 0.2% |
| French | 44 | 1.3% |
| German | 727 | 21.4% |
| Indian (Asian) | 6 | 0.2% |
| Irish | 102 | 3.0% |
| Korean | 39 | 1.1% |
| Mexican | 199 | 5.9% |
| Norwegian | 129 | 3.8% |
| Polish | 55 | 1.6% |
| Puerto Rican | 116 | 3.4% |
| Russian | 28 | 0.8% |
| Scandinavian | 2 | 0.1% |
| Scotch-Irish | 84 | 2.5% |
| Scottish | 6 | 0.2% |
| Sioux | 1,328 | 39.2% |
| Subsaharan African | 6 | 0.2% |
| Swedish | 62 | 1.8% |
| Welsh | 14 | 0.4% | View All 29 Rows |
Immigrants in Bennett County
The most numerous immigrant groups reported in Bennett County came from Asia (33 | 1.0%), South Eastern Asia (33 | 1.0%), Philippines (27 | 0.8%), Africa (6 | 0.2%), and Eastern Africa (6 | 0.2%), together accounting for 3.1% of all Bennett County residents.

| Immigration Origin | # Population | % Population |
| Africa | 6 | 0.2% |
| Asia | 33 | 1.0% |
| Eastern Africa | 6 | 0.2% |
| Ethiopia | 6 | 0.2% |
| Oceania | 5 | 0.2% |
| Philippines | 27 | 0.8% |
| South Eastern Asia | 33 | 1.0% |
| Vietnam | 6 | 0.2% | View All 8 Rows |
Sex and Age in Bennett County
Sex and Age in Bennett County
The most populous age groups in Bennett County are 5 to 9 Years (219 | 13.7%) for men and 15 to 19 Years (297 | 16.6%) for women.

| Age Bracket | Male | Female |
| Under 5 Years | 127 (8.0%) | 130 (7.2%) |
| 5 to 9 Years | 219 (13.7%) | 129 (7.2%) |
| 10 to 14 Years | 111 (7.0%) | 211 (11.8%) |
| 15 to 19 Years | 98 (6.1%) | 297 (16.6%) |
| 20 to 24 Years | 152 (9.5%) | 120 (6.7%) |
| 25 to 29 Years | 116 (7.3%) | 80 (4.5%) |
| 30 to 34 Years | 109 (6.8%) | 72 (4.0%) |
| 35 to 39 Years | 70 (4.4%) | 109 (6.1%) |
| 40 to 44 Years | 70 (4.4%) | 104 (5.8%) |
| 45 to 49 Years | 60 (3.8%) | 129 (7.2%) |
| 50 to 54 Years | 94 (5.9%) | 47 (2.6%) |
| 55 to 59 Years | 81 (5.1%) | 86 (4.8%) |
| 60 to 64 Years | 92 (5.8%) | 46 (2.6%) |
| 65 to 69 Years | 82 (5.1%) | 66 (3.7%) |
| 70 to 74 Years | 35 (2.2%) | 63 (3.5%) |
| 75 to 79 Years | 36 (2.2%) | 14 (0.8%) |
| 80 to 84 Years | 29 (1.8%) | 53 (2.9%) |
| 85 Years and over | 16 (1.0%) | 38 (2.1%) |
| Total | 1,597 (100.0%) | 1,794 (100.0%) |
Families and Households in Bennett County
Median Family Size in Bennett County
The median family size in Bennett County is 4.05 persons per family, with single female/mother families (265 | 35.8%) accounting for the largest median family size of 4.73 persons per family. On the other hand, married-couple families (440 | 59.4%) represent the smallest median family size with 3.62 persons per family.

| Family Type | # Families | Family Size |
| Married-Couple | 440 (59.4%) | 3.62 |
| Single Male/Father | 36 (4.9%) | 4.33 |
| Single Female/Mother | 265 (35.8%) | 4.73 |
| Total Families | 741 (100.0%) | 4.05 |
Median Household Size in Bennett County
The median household size in Bennett County is 3.30 persons per household, with single female/mother households (265 | 26.1%) accounting for the largest median household size of 4.82 persons per household. non-family households (273 | 26.9%) represent the smallest median household size with 1.14 persons per household.

| Household Type | # Households | Household Size |
| Married-Couple | 440 (43.4%) | 3.62 |
| Single Male/Father | 36 (3.5%) | 4.58 |
| Single Female/Mother | 265 (26.1%) | 4.82 |
| Non-family | 273 (26.9%) | 1.14 |
| Total Households | 1,014 (100.0%) | 3.30 |
Household Size by Marriage Status in Bennett County
Out of a total of 1,014 households in Bennett County, 741 (73.1%) are family households, while 273 (26.9%) are nonfamily households. The most numerous type of family households are 2-person households, comprising 327, and the most common type of nonfamily households are 1-person households, comprising 226.

| Household Size | Family Households | Nonfamily Households |
| 1-Person Households | - | 226 (22.3%) |
| 2-Person Households | 327 (32.3%) | 47 (4.6%) |
| 3-Person Households | 139 (13.7%) | 0 (0.0%) |
| 4-Person Households | 99 (9.8%) | 0 (0.0%) |
| 5-Person Households | 32 (3.2%) | 0 (0.0%) |
| 6-Person Households | 81 (8.0%) | 0 (0.0%) |
| 7+ Person Households | 63 (6.2%) | 0 (0.0%) |
| Total | 741 (73.1%) | 273 (26.9%) |
Female Fertility in Bennett County
Fertility by Age in Bennett County
Average fertility rate in Bennett County is 47.0 births per 1,000 women. Women in the age bracket of 35 to 50 years have the highest fertility rate with 102.0 births per 1,000 women. Women in the age bracket of 35 to 50 years acount for 81.4% of all women with births.

| Age Bracket | Women with Births | Births / 1,000 Women |
| 15 to 19 years | 0 (0.0%) | 0.0 |
| 20 to 34 years | 8 (18.6%) | 29.0 |
| 35 to 50 years | 35 (81.4%) | 102.0 |
| Total | 43 (100.0%) | 47.0 |
Fertility by Age by Marriage Status in Bennett County
27.9% of women with births (43) in Bennett County are married. The highest percentage of unmarried women with births falls into 20 to 34 years age bracket with 100.0% of them unmarried at the time of birth, while the lowest percentage of unmarried women with births belong to 35 to 50 years age bracket with 65.7% of them unmarried.

| Age Bracket | Married | Unmarried |
| 15 to 19 years | 0 (0.0%) | 0 (0.0%) |
| 20 to 34 years | 0 (0.0%) | 8 (100.0%) |
| 35 to 50 years | 12 (34.3%) | 23 (65.7%) |
| Total | 12 (27.9%) | 31 (72.1%) |
Fertility by Education in Bennett County

| Educational Attainment | Women with Births | Births / 1,000 Women |
| Less than High School | 0 (0.0%) | 0.0 |
| High School Diploma | 26 (60.5%) | 106.0 |
| College or Associate's Degree | 0 (0.0%) | 0.0 |
| Bachelor's Degree | 17 (39.5%) | 142.0 |
| Graduate Degree | 0 (0.0%) | 0.0 |
| Total | 43 (100.0%) | 47.0 |
Fertility by Education by Marriage Status in Bennett County
72.1% of women with births in Bennett County are unmarried. Women with the educational attainment of bachelor's degree are most likely to be married with 70.6% of them married at childbirth, while women with the educational attainment of high school diploma are least likely to be married with 100.0% of them unmarried at childbirth.
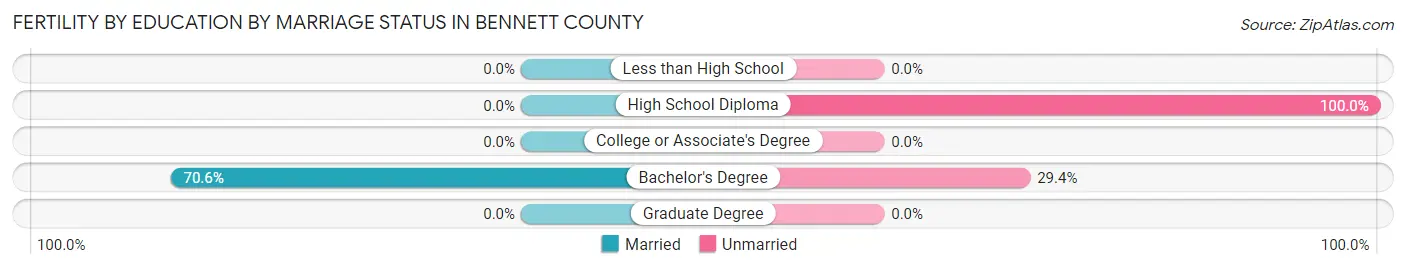
| Educational Attainment | Married | Unmarried |
| Less than High School | 0 (0.0%) | 0 (0.0%) |
| High School Diploma | 0 (0.0%) | 26 (100.0%) |
| College or Associate's Degree | 0 (0.0%) | 0 (0.0%) |
| Bachelor's Degree | 12 (70.6%) | 5 (29.4%) |
| Graduate Degree | 0 (0.0%) | 0 (0.0%) |
| Total | 12 (27.9%) | 31 (72.1%) |
Employment Characteristics in Bennett County
Employment by Class of Employer in Bennett County
Among the 1,072 employed individuals in Bennett County, private company employees (350 | 32.7%), local government employees (268 | 25.0%), and not-for-profit organizations (167 | 15.6%) make up the most common classes of employment.

| Employer Class | # Employees | % Employees |
| Private Company Employees | 350 | 32.7% |
| Self-Employed (Incorporated) | 66 | 6.2% |
| Self-Employed (Not Incorporated) | 154 | 14.4% |
| Not-for-profit Organizations | 167 | 15.6% |
| Local Government Employees | 268 | 25.0% |
| State Government Employees | 36 | 3.4% |
| Federal Government Employees | 31 | 2.9% |
| Unpaid Family Workers | 0 | 0.0% |
| Total | 1,072 | 100.0% |
Employment Status by Age in Bennett County
According to the labor force statistics for Bennett County, out of the total population over 16 years of age (2,324), 50.9% or 1,183 individuals are in the labor force, with 7.9% or 93 of them unemployed. The age group with the highest labor force participation rate is 25 to 29 years, with 80.1% or 157 individuals in the labor force. Within the labor force, the 25 to 29 years age range has the highest percentage of unemployed individuals, with 26.8% or 42 of them being unemployed.

| Age Bracket | In Labor Force | Unemployed |
| 16 to 19 Years | 56 (22.0%) | 0 (0.0%) |
| 20 to 24 Years | 112 (41.2%) | 17 (15.2%) |
| 25 to 29 Years | 157 (80.1%) | 42 (26.8%) |
| 30 to 34 Years | 105 (58.0%) | 0 (0.0%) |
| 35 to 44 Years | 191 (54.1%) | 34 (17.8%) |
| 45 to 54 Years | 259 (78.5%) | 0 (0.0%) |
| 55 to 59 Years | 96 (57.5%) | 0 (0.0%) |
| 60 to 64 Years | 91 (65.9%) | 0 (0.0%) |
| 65 to 74 Years | 86 (35.0%) | 0 (0.0%) |
| 75 Years and over | 31 (16.7%) | 0 (0.0%) |
| Total | 1,183 (50.9%) | 93 (7.9%) |
Employment Status by Educational Attainment in Bennett County
According to labor force statistics for Bennett County, 65.9% of individuals (900) out of the total population between 25 and 64 years of age (1,365) are in the labor force, with 8.5% or 76 of them being unemployed. The group with the highest labor force participation rate are those with the educational attainment of bachelor's degree or higher, with 92.9% or 274 individuals in the labor force. Within the labor force, individuals with less than high school education have the highest percentage of unemployment, with 61.8% or 42 of them being unemployed.
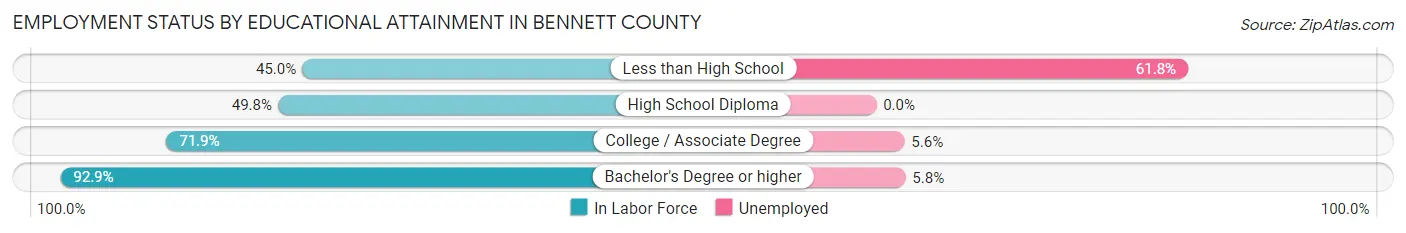
| Educational Attainment | In Labor Force | Unemployed |
| Less than High School | 68 (45.0%) | 93 (61.8%) |
| High School Diploma | 234 (49.8%) | 0 (0.0%) |
| College / Associate Degree | 323 (71.9%) | 25 (5.6%) |
| Bachelor's Degree or higher | 274 (92.9%) | 17 (5.8%) |
| Total | 900 (65.9%) | 116 (8.5%) |
Employment Occupations by Sex in Bennett County
Management, Business, Science and Arts Occupations
The most common Management, Business, Science and Arts occupations in Bennett County are Community & Social Service (178 | 16.3%), Management (164 | 15.0%), Education Instruction & Library (128 | 11.7%), Education, Arts & Media (36 | 3.3%), and Health Diagnosing & Treating (34 | 3.1%).

Management, Business, Science and Arts Occupations by Sex
Within the Management, Business, Science and Arts occupations in Bennett County, the most male-oriented occupations are Arts, Media & Entertainment (100.0%), Management (83.5%), and Computers, Engineering & Science (44.4%), while the most female-oriented occupations are Legal Services & Support (100.0%), Education Instruction & Library (85.2%), and Health Diagnosing & Treating (82.4%).
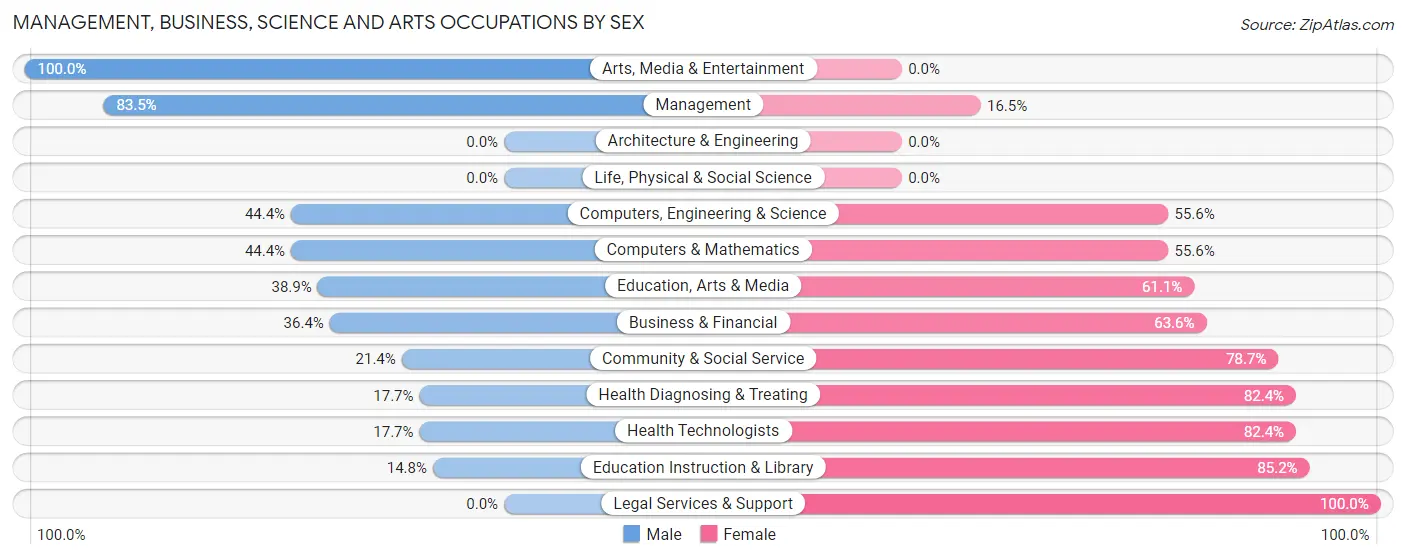
| Occupation | Male | Female |
| Management | 137 (83.5%) | 27 (16.5%) |
| Business & Financial | 12 (36.4%) | 21 (63.6%) |
| Computers, Engineering & Science | 4 (44.4%) | 5 (55.6%) |
| Computers & Mathematics | 4 (44.4%) | 5 (55.6%) |
| Architecture & Engineering | 0 (0.0%) | 0 (0.0%) |
| Life, Physical & Social Science | 0 (0.0%) | 0 (0.0%) |
| Community & Social Service | 38 (21.3%) | 140 (78.6%) |
| Education, Arts & Media | 14 (38.9%) | 22 (61.1%) |
| Legal Services & Support | 0 (0.0%) | 9 (100.0%) |
| Education Instruction & Library | 19 (14.8%) | 109 (85.2%) |
| Arts, Media & Entertainment | 5 (100.0%) | 0 (0.0%) |
| Health Diagnosing & Treating | 6 (17.6%) | 28 (82.4%) |
| Health Technologists | 6 (17.6%) | 28 (82.4%) |
| Total (Category) | 197 (47.1%) | 221 (52.9%) |
| Total (Overall) | 596 (54.6%) | 495 (45.4%) |
Services Occupations
The most common Services occupations in Bennett County are Food Preparation & Serving (63 | 5.8%), Cleaning & Maintenance (47 | 4.3%), Healthcare Support (41 | 3.8%), Security & Protection (30 | 2.8%), and Firefighting & Prevention (30 | 2.8%).

Services Occupations by Sex
Within the Services occupations in Bennett County, the most male-oriented occupations are Security & Protection (100.0%), Firefighting & Prevention (100.0%), and Food Preparation & Serving (65.1%), while the most female-oriented occupations are Personal Care & Service (100.0%), Healthcare Support (85.4%), and Cleaning & Maintenance (78.7%).

| Occupation | Male | Female |
| Healthcare Support | 6 (14.6%) | 35 (85.4%) |
| Security & Protection | 30 (100.0%) | 0 (0.0%) |
| Firefighting & Prevention | 30 (100.0%) | 0 (0.0%) |
| Law Enforcement | 0 (0.0%) | 0 (0.0%) |
| Food Preparation & Serving | 41 (65.1%) | 22 (34.9%) |
| Cleaning & Maintenance | 10 (21.3%) | 37 (78.7%) |
| Personal Care & Service | 0 (0.0%) | 9 (100.0%) |
| Total (Category) | 87 (45.8%) | 103 (54.2%) |
| Total (Overall) | 596 (54.6%) | 495 (45.4%) |
Sales and Office Occupations
The most common Sales and Office occupations in Bennett County are Sales & Related (112 | 10.3%), and Office & Administration (60 | 5.5%).

Sales and Office Occupations by Sex

| Occupation | Male | Female |
| Sales & Related | 65 (58.0%) | 47 (42.0%) |
| Office & Administration | 14 (23.3%) | 46 (76.7%) |
| Total (Category) | 79 (45.9%) | 93 (54.1%) |
| Total (Overall) | 596 (54.6%) | 495 (45.4%) |
Natural Resources, Construction and Maintenance Occupations
The most common Natural Resources, Construction and Maintenance occupations in Bennett County are Construction & Extraction (54 | 5.0%), Farming, Fishing & Forestry (48 | 4.4%), and Installation, Maintenance & Repair (30 | 2.8%).

Natural Resources, Construction and Maintenance Occupations by Sex

| Occupation | Male | Female |
| Farming, Fishing & Forestry | 37 (77.1%) | 11 (22.9%) |
| Construction & Extraction | 54 (100.0%) | 0 (0.0%) |
| Installation, Maintenance & Repair | 30 (100.0%) | 0 (0.0%) |
| Total (Category) | 121 (91.7%) | 11 (8.3%) |
| Total (Overall) | 596 (54.6%) | 495 (45.4%) |
Production, Transportation and Moving Occupations
The most common Production, Transportation and Moving occupations in Bennett County are Production (73 | 6.7%), Material Moving (66 | 6.0%), and Transportation (40 | 3.7%).
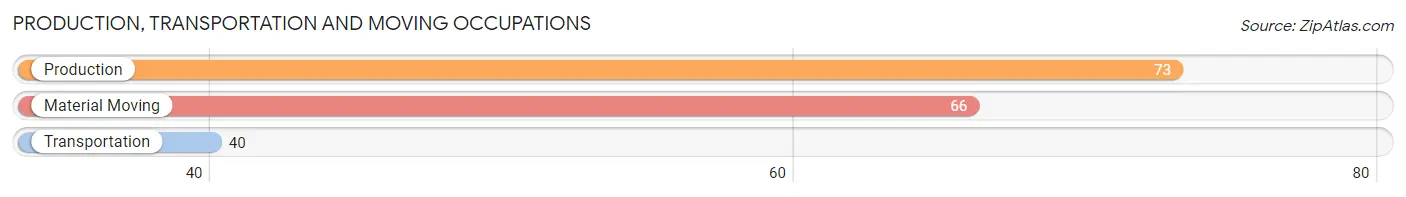
Production, Transportation and Moving Occupations by Sex

| Occupation | Male | Female |
| Production | 40 (54.8%) | 33 (45.2%) |
| Transportation | 28 (70.0%) | 12 (30.0%) |
| Material Moving | 44 (66.7%) | 22 (33.3%) |
| Total (Category) | 112 (62.6%) | 67 (37.4%) |
| Total (Overall) | 596 (54.6%) | 495 (45.4%) |
Employment Industries by Sex in Bennett County
Employment Industries in Bennett County
The major employment industries in Bennett County include Educational Services (224 | 20.5%), Agriculture, Fishing & Hunting (162 | 14.8%), Health Care & Social Assistance (152 | 13.9%), Retail Trade (119 | 10.9%), and Construction (69 | 6.3%).

Employment Industries by Sex in Bennett County
The Bennett County industries that see more men than women are Construction (100.0%), Wholesale Trade (100.0%), and Transportation & Warehousing (100.0%), whereas the industries that tend to have a higher number of women are Manufacturing (100.0%), Educational Services (84.8%), and Public Administration (80.3%).

| Industry | Male | Female |
| Agriculture, Fishing & Hunting | 143 (88.3%) | 19 (11.7%) |
| Mining, Quarrying, & Extraction | 0 (0.0%) | 0 (0.0%) |
| Construction | 69 (100.0%) | 0 (0.0%) |
| Manufacturing | 0 (0.0%) | 29 (100.0%) |
| Wholesale Trade | 9 (100.0%) | 0 (0.0%) |
| Retail Trade | 70 (58.8%) | 49 (41.2%) |
| Transportation & Warehousing | 5 (100.0%) | 0 (0.0%) |
| Utilities | 20 (76.9%) | 6 (23.1%) |
| Information | 25 (100.0%) | 0 (0.0%) |
| Finance & Insurance | 6 (54.5%) | 5 (45.5%) |
| Real Estate, Rental & Leasing | 3 (100.0%) | 0 (0.0%) |
| Professional & Scientific | 10 (100.0%) | 0 (0.0%) |
| Enterprise Management | 0 (0.0%) | 0 (0.0%) |
| Administrative & Support | 39 (100.0%) | 0 (0.0%) |
| Educational Services | 34 (15.2%) | 190 (84.8%) |
| Health Care & Social Assistance | 44 (28.9%) | 108 (71.1%) |
| Arts, Entertainment & Recreation | 30 (66.7%) | 15 (33.3%) |
| Accommodation & Food Services | 55 (80.9%) | 13 (19.1%) |
| Public Administration | 12 (19.7%) | 49 (80.3%) |
| Total | 596 (54.6%) | 495 (45.4%) |
Education in Bennett County
School Enrollment in Bennett County
The most common levels of schooling among the 1,103 students in Bennett County are high school (313 | 28.4%), elementary school (300 | 27.2%), and middle school (296 | 26.8%).

| School Level | # Students | % Students |
| Nursery / Preschool | 24 | 2.2% |
| Kindergarten | 69 | 6.3% |
| Elementary School | 300 | 27.2% |
| Middle School | 296 | 26.8% |
| High School | 313 | 28.4% |
| College / Undergraduate | 82 | 7.4% |
| Graduate / Professional | 19 | 1.7% |
| Total | 1,103 | 100.0% |
School Enrollment by Age by Funding Source in Bennett County
Out of a total of 1,103 students who are enrolled in schools in Bennett County, 17 (1.5%) attend a private institution, while the remaining 1,086 (98.5%) are enrolled in public schools. The age group of 20 to 24 year olds has the highest likelihood of being enrolled in private schools, with 17 (17.2% in the age bracket) enrolled. Conversely, the age group of 3 to 4 year olds has the lowest likelihood of being enrolled in a private school, with 10 (100.0% in the age bracket) attending a public institution.

| Age Bracket | Public School | Private School |
| 3 to 4 Year Olds | 10 (100.0%) | 0 (0.0%) |
| 5 to 9 Year Old | 348 (100.0%) | 0 (0.0%) |
| 10 to 14 Year Olds | 318 (100.0%) | 0 (0.0%) |
| 15 to 17 Year Olds | 237 (100.0%) | 0 (0.0%) |
| 18 to 19 Year Olds | 50 (100.0%) | 0 (0.0%) |
| 20 to 24 Year Olds | 82 (82.8%) | 17 (17.2%) |
| 25 to 34 Year Olds | 33 (100.0%) | 0 (0.0%) |
| 35 Years and over | 8 (100.0%) | 0 (0.0%) |
| Total | 1,086 (98.5%) | 17 (1.5%) |
Educational Attainment by Field of Study in Bennett County
Education (98 | 28.0%), science & technology (76 | 21.7%), liberal arts & history (40 | 11.4%), bio, nature & agricultural (34 | 9.7%), and arts & humanities (30 | 8.6%) are the most common fields of study among 350 individuals in Bennett County who have obtained a bachelor's degree or higher.

| Field of Study | # Graduates | % Graduates |
| Computers & Mathematics | 5 | 1.4% |
| Bio, Nature & Agricultural | 34 | 9.7% |
| Physical & Health Sciences | 11 | 3.1% |
| Psychology | 0 | 0.0% |
| Social Sciences | 6 | 1.7% |
| Engineering | 7 | 2.0% |
| Multidisciplinary Studies | 4 | 1.1% |
| Science & Technology | 76 | 21.7% |
| Business | 19 | 5.4% |
| Education | 98 | 28.0% |
| Literature & Languages | 16 | 4.6% |
| Liberal Arts & History | 40 | 11.4% |
| Visual & Performing Arts | 4 | 1.1% |
| Communications | 0 | 0.0% |
| Arts & Humanities | 30 | 8.6% |
| Total | 350 | 100.0% |
Transportation & Commute in Bennett County
Vehicle Availability by Sex in Bennett County
The most prevalent vehicle ownership categories in Bennett County are males with 2 vehicles (236, accounting for 39.6%) and females with 2 vehicles (140, making up 49.6%).

| Vehicles Available | Male | Female |
| No Vehicle | 55 (9.2%) | 0 (0.0%) |
| 1 Vehicle | 107 (17.9%) | 189 (39.7%) |
| 2 Vehicles | 236 (39.6%) | 140 (29.4%) |
| 3 Vehicles | 107 (17.9%) | 79 (16.6%) |
| 4 Vehicles | 25 (4.2%) | 15 (3.2%) |
| 5 or more Vehicles | 66 (11.1%) | 53 (11.1%) |
| Total | 596 (100.0%) | 476 (100.0%) |
Commute Time in Bennett County
The most frequently occuring commute durations in Bennett County are 5 to 9 minutes (375 commuters, 36.5%), less than 5 minutes (253 commuters, 24.6%), and 10 to 14 minutes (122 commuters, 11.9%).

| Commute Time | # Commuters | % Commuters |
| Less than 5 Minutes | 253 | 24.6% |
| 5 to 9 Minutes | 375 | 36.5% |
| 10 to 14 Minutes | 122 | 11.9% |
| 15 to 19 Minutes | 77 | 7.5% |
| 20 to 24 Minutes | 44 | 4.3% |
| 25 to 29 Minutes | 38 | 3.7% |
| 30 to 34 Minutes | 68 | 6.6% |
| 35 to 39 Minutes | 0 | 0.0% |
| 40 to 44 Minutes | 16 | 1.6% |
| 45 to 59 Minutes | 23 | 2.2% |
| 60 to 89 Minutes | 11 | 1.1% |
| 90 or more Minutes | 0 | 0.0% |
Commute Time by Sex in Bennett County
The most common commute times in Bennett County are less than 5 minutes (193 commuters, 33.7%) for males and 5 to 9 minutes (198 commuters, 43.5%) for females.

| Commute Time | Male | Female |
| Less than 5 Minutes | 193 (33.7%) | 60 (13.2%) |
| 5 to 9 Minutes | 177 (30.9%) | 198 (43.5%) |
| 10 to 14 Minutes | 64 (11.2%) | 58 (12.8%) |
| 15 to 19 Minutes | 70 (12.2%) | 7 (1.5%) |
| 20 to 24 Minutes | 12 (2.1%) | 32 (7.0%) |
| 25 to 29 Minutes | 25 (4.4%) | 13 (2.9%) |
| 30 to 34 Minutes | 0 (0.0%) | 68 (14.9%) |
| 35 to 39 Minutes | 0 (0.0%) | 0 (0.0%) |
| 40 to 44 Minutes | 16 (2.8%) | 0 (0.0%) |
| 45 to 59 Minutes | 4 (0.7%) | 19 (4.2%) |
| 60 to 89 Minutes | 11 (1.9%) | 0 (0.0%) |
| 90 or more Minutes | 0 (0.0%) | 0 (0.0%) |
Time of Departure to Work by Sex in Bennett County
The most frequent times of departure to work in Bennett County are 7:00 AM to 7:29 AM (207, 36.2%) for males and 7:30 AM to 7:59 AM (107, 23.5%) for females.

| Time of Departure | Male | Female |
| 12:00 AM to 4:59 AM | 10 (1.8%) | 2 (0.4%) |
| 5:00 AM to 5:29 AM | 18 (3.2%) | 0 (0.0%) |
| 5:30 AM to 5:59 AM | 6 (1.1%) | 0 (0.0%) |
| 6:00 AM to 6:29 AM | 21 (3.7%) | 27 (5.9%) |
| 6:30 AM to 6:59 AM | 25 (4.4%) | 75 (16.5%) |
| 7:00 AM to 7:29 AM | 207 (36.2%) | 52 (11.4%) |
| 7:30 AM to 7:59 AM | 170 (29.7%) | 107 (23.5%) |
| 8:00 AM to 8:29 AM | 63 (11.0%) | 45 (9.9%) |
| 8:30 AM to 8:59 AM | 0 (0.0%) | 85 (18.7%) |
| 9:00 AM to 9:59 AM | 17 (3.0%) | 0 (0.0%) |
| 10:00 AM to 10:59 AM | 0 (0.0%) | 0 (0.0%) |
| 11:00 AM to 11:59 AM | 35 (6.1%) | 17 (3.7%) |
| 12:00 PM to 3:59 PM | 0 (0.0%) | 8 (1.8%) |
| 4:00 PM to 11:59 PM | 0 (0.0%) | 37 (8.1%) |
| Total | 572 (100.0%) | 455 (100.0%) |
Housing Occupancy in Bennett County
Occupancy by Ownership in Bennett County
Of the total 1,014 dwellings in Bennett County, owner-occupied units account for 615 (60.7%), while renter-occupied units make up 399 (39.4%).

| Occupancy | # Housing Units | % Housing Units |
| Owner Occupied Housing Units | 615 | 60.7% |
| Renter-Occupied Housing Units | 399 | 39.4% |
| Total Occupied Housing Units | 1,014 | 100.0% |
Occupancy by Household Size in Bennett County

| Household Size | # Housing Units | % Housing Units |
| 1-Person Household | 226 | 22.3% |
| 2-Person Household | 374 | 36.9% |
| 3-Person Household | 139 | 13.7% |
| 4+ Person Household | 275 | 27.1% |
| Total Housing Units | 1,014 | 100.0% |
Occupancy by Ownership by Household Size in Bennett County

| Household Size | Owner-occupied | Renter-occupied |
| 1-Person Household | 150 (66.4%) | 76 (33.6%) |
| 2-Person Household | 278 (74.3%) | 96 (25.7%) |
| 3-Person Household | 50 (36.0%) | 89 (64.0%) |
| 4+ Person Household | 137 (49.8%) | 138 (50.2%) |
| Total Housing Units | 615 (60.7%) | 399 (39.4%) |
Occupancy by Educational Attainment in Bennett County

| Household Size | Owner-occupied | Renter-occupied |
| Less than High School | 25 (39.1%) | 39 (60.9%) |
| High School Diploma | 200 (59.9%) | 134 (40.1%) |
| College/Associate Degree | 261 (64.6%) | 143 (35.4%) |
| Bachelor's Degree or higher | 129 (60.9%) | 83 (39.2%) |
Occupancy by Age of Householder in Bennett County

| Age Bracket | # Households | % Households |
| Under 35 Years | 151 | 14.9% |
| 35 to 44 Years | 199 | 19.6% |
| 45 to 54 Years | 186 | 18.3% |
| 55 to 64 Years | 191 | 18.8% |
| 65 to 74 Years | 165 | 16.3% |
| 75 to 84 Years | 86 | 8.5% |
| 85 Years and Over | 36 | 3.5% |
| Total | 1,014 | 100.0% |
Housing Finances in Bennett County
Median Income by Occupancy in Bennett County

| Occupancy Type | # Households | Median Income |
| Owner-Occupied | 615 (60.7%) | $49,583 |
| Renter-Occupied | 399 (39.4%) | $27,330 |
| Average | 1,014 (100.0%) | $44,821 |
Occupancy by Householder Income Bracket in Bennett County

| Income Bracket | Owner-occupied | Renter-occupied |
| Less than $5,000 | 58 (9.4%) | 40 (10.0%) |
| $5,000 to $9,999 | 4 (0.6%) | 18 (4.5%) |
| $10,000 to $14,999 | 5 (0.8%) | 55 (13.8%) |
| $15,000 to $19,999 | 31 (5.0%) | 34 (8.5%) |
| $20,000 to $24,999 | 40 (6.5%) | 32 (8.0%) |
| $25,000 to $34,999 | 73 (11.9%) | 27 (6.8%) |
| $35,000 to $49,999 | 103 (16.8%) | 39 (9.8%) |
| $50,000 to $74,999 | 108 (17.6%) | 71 (17.8%) |
| $75,000 to $99,999 | 42 (6.8%) | 44 (11.0%) |
| $100,000 to $149,999 | 65 (10.6%) | 20 (5.0%) |
| $150,000 or more | 86 (14.0%) | 19 (4.8%) |
| Total | 615 (100.0%) | 399 (100.0%) |
Monthly Housing Cost Tiers in Bennett County

| Monthly Cost | Owner-occupied | Renter-occupied |
| Less than $300 | 69 (11.2%) | 42 (10.5%) |
| $300 to $499 | 131 (21.3%) | 34 (8.5%) |
| $500 to $799 | 145 (23.6%) | 164 (41.1%) |
| $800 to $999 | 120 (19.5%) | 37 (9.3%) |
| $1,000 to $1,499 | 110 (17.9%) | 52 (13.0%) |
| $1,500 to $1,999 | 40 (6.5%) | 0 (0.0%) |
| $2,000 to $2,499 | 0 (0.0%) | 0 (0.0%) |
| $2,500 to $2,999 | 0 (0.0%) | 0 (0.0%) |
| $3,000 or more | 0 (0.0%) | 0 (0.0%) |
| Total | 615 (100.0%) | 399 (100.0%) |
Physical Housing Characteristics in Bennett County
Housing Structures in Bennett County

| Structure Type | # Housing Units | % Housing Units |
| Single Unit, Detached | 906 | 89.3% |
| Single Unit, Attached | 9 | 0.9% |
| 2 Unit Apartments | 10 | 1.0% |
| 3 or 4 Unit Apartments | 9 | 0.9% |
| 5 to 9 Unit Apartments | 26 | 2.6% |
| 10 or more Apartments | 5 | 0.5% |
| Mobile Home / Other | 49 | 4.8% |
| Total | 1,014 | 100.0% |
Housing Structures by Occupancy in Bennett County

| Structure Type | Owner-occupied | Renter-occupied |
| Single Unit, Detached | 556 (61.4%) | 350 (38.6%) |
| Single Unit, Attached | 4 (44.4%) | 5 (55.6%) |
| 2 Unit Apartments | 0 (0.0%) | 10 (100.0%) |
| 3 or 4 Unit Apartments | 6 (66.7%) | 3 (33.3%) |
| 5 to 9 Unit Apartments | 0 (0.0%) | 26 (100.0%) |
| 10 or more Apartments | 0 (0.0%) | 5 (100.0%) |
| Mobile Home / Other | 49 (100.0%) | 0 (0.0%) |
| Total | 615 (60.7%) | 399 (39.4%) |
Housing Structures by Number of Rooms in Bennett County

| Number of Rooms | Owner-occupied | Renter-occupied |
| 1 Room | 0 (0.0%) | 7 (1.8%) |
| 2 or 3 Rooms | 26 (4.2%) | 46 (11.5%) |
| 4 or 5 Rooms | 204 (33.2%) | 161 (40.4%) |
| 6 or 7 Rooms | 233 (37.9%) | 139 (34.8%) |
| 8 or more Rooms | 152 (24.7%) | 46 (11.5%) |
| Total | 615 (100.0%) | 399 (100.0%) |
Housing Structure by Heating Type in Bennett County

| Heating Type | Owner-occupied | Renter-occupied |
| Utility Gas | 0 (0.0%) | 16 (4.0%) |
| Bottled, Tank, or LP Gas | 281 (45.7%) | 240 (60.2%) |
| Electricity | 240 (39.0%) | 139 (34.8%) |
| Fuel Oil or Kerosene | 4 (0.6%) | 0 (0.0%) |
| Coal or Coke | 0 (0.0%) | 0 (0.0%) |
| All other Fuels | 90 (14.6%) | 4 (1.0%) |
| No Fuel Used | 0 (0.0%) | 0 (0.0%) |
| Total | 615 (100.0%) | 399 (100.0%) |
Household Vehicle Usage in Bennett County

| Vehicles per Household | Owner-occupied | Renter-occupied |
| No Vehicle | 15 (2.4%) | 76 (19.1%) |
| 1 Vehicle | 144 (23.4%) | 166 (41.6%) |
| 2 Vehicles | 229 (37.2%) | 107 (26.8%) |
| 3 or more Vehicles | 227 (36.9%) | 50 (12.5%) |
| Total | 615 (100.0%) | 399 (100.0%) |
Real Estate & Mortgages in Bennett County
Real Estate and Mortgage Overview in Bennett County
| Characteristic | Without Mortgage | With Mortgage |
| Housing Units | 415 | 200 |
| Median Property Value | $150,500 | $97,800 |
| Median Household Income | $37,188 | $52 |
| Monthly Housing Costs | $511 | $0 |
| Real Estate Taxes | $1,268 | $5 |
Property Value by Mortgage Status in Bennett County

| Property Value | Without Mortgage | With Mortgage |
| Less than $50,000 | 69 (16.6%) | 21 (10.5%) |
| $50,000 to $99,999 | 80 (19.3%) | 88 (44.0%) |
| $100,000 to $299,999 | 207 (49.9%) | 55 (27.5%) |
| $300,000 to $499,999 | 31 (7.5%) | 3 (1.5%) |
| $500,000 to $749,999 | 0 (0.0%) | 33 (16.5%) |
| $750,000 to $999,999 | 6 (1.5%) | 0 (0.0%) |
| $1,000,000 or more | 22 (5.3%) | 0 (0.0%) |
| Total | 415 (100.0%) | 200 (100.0%) |
Household Income by Mortgage Status in Bennett County

| Household Income | Without Mortgage | With Mortgage |
| Less than $10,000 | 55 (13.3%) | 0 (0.0%) |
| $10,000 to $24,999 | 76 (18.3%) | 7 (3.5%) |
| $25,000 to $34,999 | 66 (15.9%) | 0 (0.0%) |
| $35,000 to $49,999 | 49 (11.8%) | 7 (3.5%) |
| $50,000 to $74,999 | 84 (20.2%) | 54 (27.0%) |
| $75,000 to $99,999 | 33 (8.0%) | 24 (12.0%) |
| $100,000 to $149,999 | 18 (4.3%) | 9 (4.5%) |
| $150,000 or more | 34 (8.2%) | 47 (23.5%) |
| Total | 415 (100.0%) | 200 (100.0%) |
Property Value to Household Income Ratio in Bennett County

| Value-to-Income Ratio | Without Mortgage | With Mortgage |
| Less than 2.0x | 112 (27.0%) | 77,222 (38,611.0%) |
| 2.0x to 2.9x | 79 (19.0%) | 146 (73.0%) |
| 3.0x to 3.9x | 26 (6.3%) | 11 (5.5%) |
| 4.0x or more | 166 (40.0%) | 3 (1.5%) |
| Total | 415 (100.0%) | 200 (100.0%) |
Real Estate Taxes by Mortgage Status in Bennett County

| Property Taxes | Without Mortgage | With Mortgage |
| Less than $800 | 93 (22.4%) | 7 (3.5%) |
| $800 to $1,499 | 83 (20.0%) | 7 (3.5%) |
| $800 to $1,499 | 110 (26.5%) | 80 (40.0%) |
| Total | 415 (100.0%) | 200 (100.0%) |
Health & Disability in Bennett County
Health Insurance Coverage by Age in Bennett County

| Age Bracket | With Coverage | Without Coverage |
| Under 6 Years | 293 (86.4%) | 46 (13.6%) |
| 6 to 18 Years | 686 (70.5%) | 287 (29.5%) |
| 19 to 25 Years | 112 (33.9%) | 218 (66.1%) |
| 26 to 34 Years | 201 (61.1%) | 128 (38.9%) |
| 35 to 44 Years | 256 (72.5%) | 97 (27.5%) |
| 45 to 54 Years | 294 (89.1%) | 36 (10.9%) |
| 55 to 64 Years | 237 (81.2%) | 55 (18.8%) |
| 65 to 74 Years | 246 (100.0%) | 0 (0.0%) |
| 75 Years and older | 156 (100.0%) | 0 (0.0%) |
| Total | 2,481 (74.1%) | 867 (25.9%) |
Health Insurance Coverage by Citizenship Status in Bennett County

| Citizenship Status | With Coverage | Without Coverage |
| Native Born | 293 (86.4%) | 46 (13.6%) |
| Foreign Born, Citizen | 686 (70.5%) | 287 (29.5%) |
| Foreign Born, not a Citizen | 112 (33.9%) | 218 (66.1%) |
Health Insurance Coverage by Household Income in Bennett County

| Household Income | With Coverage | Without Coverage |
| Under $25,000 | 886 (91.1%) | 86 (8.8%) |
| $25,000 to $49,999 | 375 (56.7%) | 286 (43.3%) |
| $50,000 to $74,999 | 402 (54.7%) | 333 (45.3%) |
| $75,000 to $99,999 | 342 (91.9%) | 30 (8.1%) |
| $100,000 and over | 476 (78.3%) | 132 (21.7%) |
Public vs Private Health Insurance Coverage by Age in Bennett County
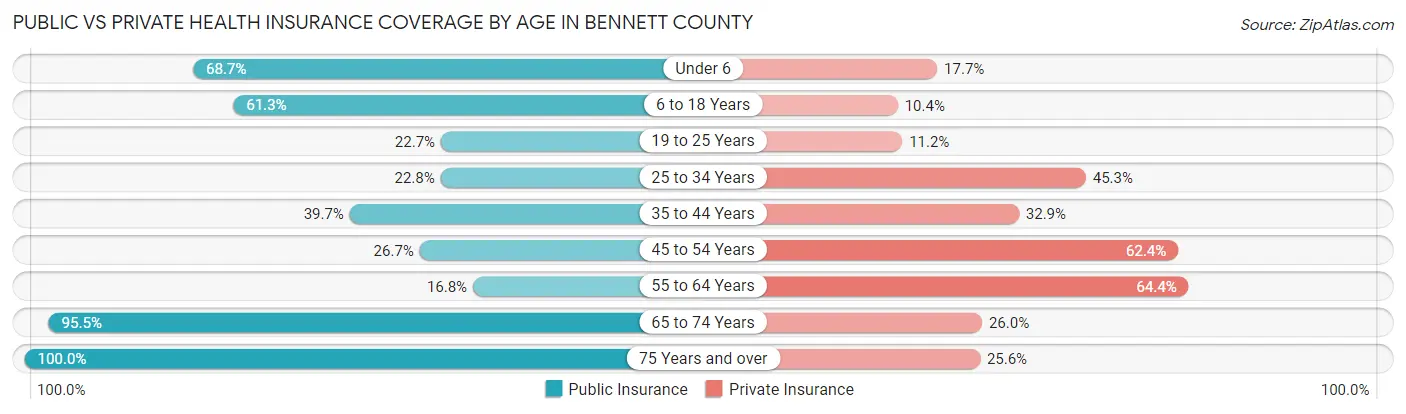
| Age Bracket | Public Insurance | Private Insurance |
| Under 6 | 233 (68.7%) | 60 (17.7%) |
| 6 to 18 Years | 596 (61.3%) | 101 (10.4%) |
| 19 to 25 Years | 75 (22.7%) | 37 (11.2%) |
| 25 to 34 Years | 75 (22.8%) | 149 (45.3%) |
| 35 to 44 Years | 140 (39.7%) | 116 (32.9%) |
| 45 to 54 Years | 88 (26.7%) | 206 (62.4%) |
| 55 to 64 Years | 49 (16.8%) | 188 (64.4%) |
| 65 to 74 Years | 235 (95.5%) | 64 (26.0%) |
| 75 Years and over | 156 (100.0%) | 40 (25.6%) |
| Total | 1,647 (49.2%) | 961 (28.7%) |
Disability Status by Sex by Age in Bennett County

| Age Bracket | Male | Female |
| Under 5 Years | 0 (0.0%) | 0 (0.0%) |
| 5 to 17 Years | 15 (4.0%) | 32 (5.1%) |
| 18 to 34 Years | 47 (11.0%) | 0 (0.0%) |
| 35 to 64 Years | 61 (13.2%) | 59 (11.6%) |
| 65 to 74 Years | 19 (16.2%) | 40 (31.0%) |
| 75 Years and over | 38 (55.1%) | 59 (67.8%) |
Disability Class by Sex by Age in Bennett County
Disability Class: Hearing Difficulty

| Age Bracket | Male | Female |
| Under 5 Years | 0 (0.0%) | 0 (0.0%) |
| 5 to 17 Years | 0 (0.0%) | 0 (0.0%) |
| 18 to 34 Years | 0 (0.0%) | 0 (0.0%) |
| 35 to 64 Years | 45 (9.7%) | 5 (1.0%) |
| 65 to 74 Years | 19 (16.2%) | 6 (4.6%) |
| 75 Years and over | 26 (37.7%) | 29 (33.3%) |
Disability Class: Vision Difficulty
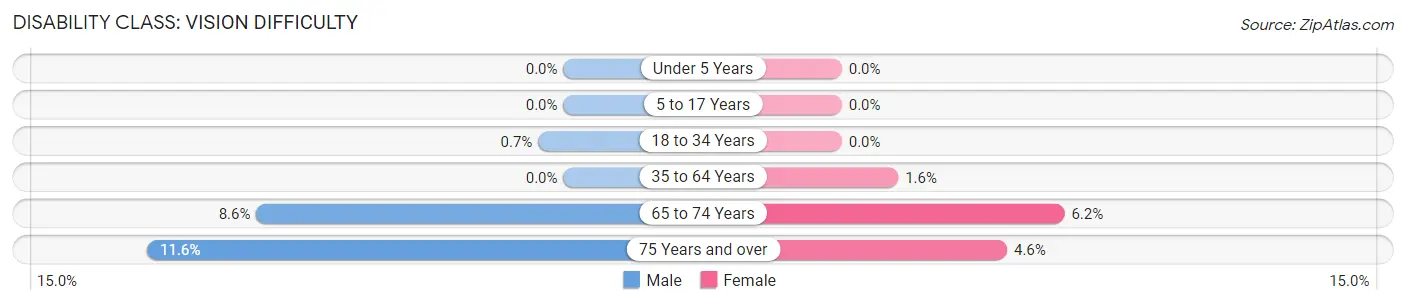
| Age Bracket | Male | Female |
| Under 5 Years | 0 (0.0%) | 0 (0.0%) |
| 5 to 17 Years | 0 (0.0%) | 0 (0.0%) |
| 18 to 34 Years | 3 (0.7%) | 0 (0.0%) |
| 35 to 64 Years | 0 (0.0%) | 8 (1.6%) |
| 65 to 74 Years | 10 (8.6%) | 8 (6.2%) |
| 75 Years and over | 8 (11.6%) | 4 (4.6%) |
Disability Class: Cognitive Difficulty

| Age Bracket | Male | Female |
| 5 to 17 Years | 15 (4.0%) | 16 (2.6%) |
| 18 to 34 Years | 0 (0.0%) | 0 (0.0%) |
| 35 to 64 Years | 39 (8.4%) | 37 (7.2%) |
| 65 to 74 Years | 0 (0.0%) | 0 (0.0%) |
| 75 Years and over | 0 (0.0%) | 1 (1.1%) |
Disability Class: Ambulatory Difficulty

| Age Bracket | Male | Female |
| 5 to 17 Years | 0 (0.0%) | 32 (5.1%) |
| 18 to 34 Years | 20 (4.7%) | 0 (0.0%) |
| 35 to 64 Years | 31 (6.7%) | 54 (10.6%) |
| 65 to 74 Years | 2 (1.7%) | 32 (24.8%) |
| 75 Years and over | 14 (20.3%) | 52 (59.8%) |
Disability Class: Self-Care Difficulty

| Age Bracket | Male | Female |
| 5 to 17 Years | 0 (0.0%) | 32 (5.1%) |
| 18 to 34 Years | 0 (0.0%) | 0 (0.0%) |
| 35 to 64 Years | 31 (6.7%) | 8 (1.6%) |
| 65 to 74 Years | 0 (0.0%) | 20 (15.5%) |
| 75 Years and over | 0 (0.0%) | 11 (12.6%) |
Technology Access in Bennett County
Computing Device Access in Bennett County

| Device Type | # Households | % Households |
| Desktop or Laptop | 682 | 67.3% |
| Smartphone | 783 | 77.2% |
| Tablet | 412 | 40.6% |
| No Computing Device | 172 | 17.0% |
| Total | 1,014 | 100.0% |
Internet Access in Bennett County

| Internet Type | # Households | % Households |
| Dial-Up Internet | 0 | 0.0% |
| Broadband Home | 603 | 59.5% |
| Cellular Data Only | 72 | 7.1% |
| Satellite Internet | 8 | 0.8% |
| No Internet | 331 | 32.6% |
| Total | 1,014 | 100.0% |
Bennett County Summary
Bennett County is located in the southwestern corner of South Dakota, and is the second least populous county in the state. It is bordered by the states of Wyoming and Nebraska, and is part of the Pine Ridge Indian Reservation. The county seat is Martin, and the population was 2,890 at the 2010 census.
History
Bennett County was created in 1909 from parts of Fall River and Shannon counties. It was named after John A. Bennett, a former governor of South Dakota. The county was originally populated by Native Americans, including the Lakota, Cheyenne, and Arapaho tribes.
In the late 19th century, the area was opened up to white settlers, and the county was organized in 1909. The county was largely agricultural, with cattle ranching and farming being the main industries.
Geography
Bennett County is located in the southwestern corner of South Dakota, and is bordered by the states of Wyoming and Nebraska. It is part of the Pine Ridge Indian Reservation. The county has a total area of 1,845 square miles, of which 1,844 square miles is land and 1 square mile is water.
The county is mostly flat, with rolling hills in the east and south. The White River flows through the county, and there are several small lakes and reservoirs. The county is home to the Badlands National Park, which is located in the southwestern corner of the county.
Economy
The economy of Bennett County is largely based on agriculture and ranching. Cattle ranching is the main industry, and the county is home to several large ranches. Farming is also important, with corn, wheat, and soybeans being the main crops.
The county also has a small tourism industry, with visitors coming to the area to visit the Badlands National Park and other attractions.
Demographics
As of the 2010 census, the population of Bennett County was 2,890. The racial makeup of the county was 87.3% White, 0.2% African American, 9.7% Native American, 0.2% Asian, 0.1% Pacific Islander, 0.7% from other races, and 1.9% from two or more races. Hispanic or Latino of any race were 2.2% of the population.
The median income for a household in the county was $30,938, and the median income for a family was $35,938. The per capita income for the county was $14,938. About 17.3% of families and 21.2% of the population were below the poverty line, including 28.3% of those under age 18 and 11.2% of those age 65 or over.
Common Questions
What is Per Capita Income in Bennett County?
Per Capita income in Bennett County is $22,068.
What is the Median Family Income in Bennett County?
Median Family Income in Bennett County is $56,250.
What is the Median Household income in Bennett County?
Median Household Income in Bennett County is $44,821.
What is Income or Wage Gap in Bennett County?
Income or Wage Gap in Bennett County is 0.3%.
Women in Bennett County earn 99.7 cents for every dollar earned by a man.
What is Inequality or Gini Index in Bennett County?
Inequality or Gini Index in Bennett County is 0.52.
What is the Total Population of Bennett County?
Total Population of Bennett County is 3,391.
What is the Total Male Population of Bennett County?
Total Male Population of Bennett County is 1,597.
What is the Total Female Population of Bennett County?
Total Female Population of Bennett County is 1,794.
What is the Ratio of Males per 100 Females in Bennett County?
There are 89.02 Males per 100 Females in Bennett County.
What is the Ratio of Females per 100 Males in Bennett County?
There are 112.34 Females per 100 Males in Bennett County.
What is the Median Population Age in Bennett County?
Median Population Age in Bennett County is 27.0 Years.
What is the Average Family Size in Bennett County
Average Family Size in Bennett County is 4.0 People.
What is the Average Household Size in Bennett County
Average Household Size in Bennett County is 3.3 People.
How Large is the Labor Force in Bennett County?
There are 1,183 People in the Labor Forcein in Bennett County.
What is the Percentage of People in the Labor Force in Bennett County?
50.9% of People are in the Labor Force in Bennett County.
What is the Unemployment Rate in Bennett County?
Unemployment Rate in Bennett County is 7.9%.