Aurora County, SD Map & Demographics
Aurora County Map
Aurora County Overview
$40,299
PER CAPITA INCOME
$85,625
AVG FAMILY INCOME
$71,490
AVG HOUSEHOLD INCOME
26.7%
WAGE / INCOME GAP [ % ]
73.3¢/ $1
WAGE / INCOME GAP [ $ ]
0.45
INEQUALITY / GINI INDEX
2,590
TOTAL POPULATION
1,359
MALE POPULATION
1,231
FEMALE POPULATION
110.40
MALES / 100 FEMALES
90.58
FEMALES / 100 MALES
41.4
MEDIAN AGE
2.9
AVG FAMILY SIZE
2.4
AVG HOUSEHOLD SIZE
1,413
LABOR FORCE [ PEOPLE ]
70.0%
PERCENT IN LABOR FORCE
0.8%
UNEMPLOYMENT RATE
Aurora County Area Codes
Income in Aurora County
Income Overview in Aurora County
Per Capita Income in Aurora County is $40,299, while median incomes of families and households are $85,625 and $71,490 respectively.
| Characteristic | Number | Measure |
| Per Capita Income | 2,590 | $40,299 |
| Median Family Income | 682 | $85,625 |
| Mean Family Income | 682 | $118,197 |
| Median Household Income | 1,053 | $71,490 |
| Mean Household Income | 1,053 | $96,992 |
| Income Deficit | 682 | $0 |
| Wage / Income Gap (%) | 2,590 | 26.72% |
| Wage / Income Gap ($) | 2,590 | 73.28¢ per $1 |
| Gini / Inequality Index | 2,590 | 0.45 |
Earnings by Sex in Aurora County
Average Earnings in Aurora County are $41,642, $47,717 for men and $34,966 for women, a difference of 26.7%.
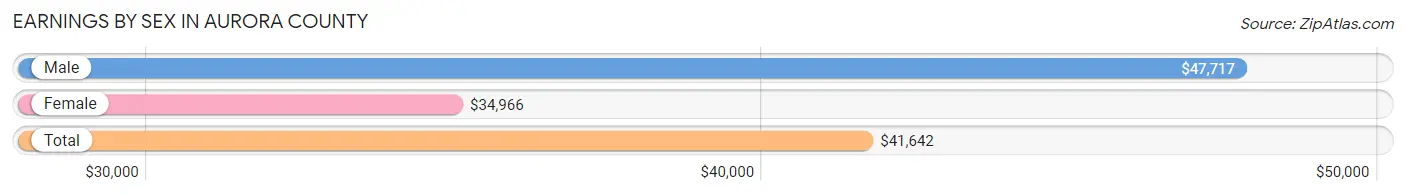
| Sex | Number | Average Earnings |
| Male | 840 (56.1%) | $47,717 |
| Female | 657 (43.9%) | $34,966 |
| Total | 1,497 (100.0%) | $41,642 |
Earnings by Sex by Income Bracket in Aurora County
The most common earnings brackets in Aurora County are $100,000+ for men (119 | 14.2%) and $55,000 to $64,999 for women (68 | 10.3%).
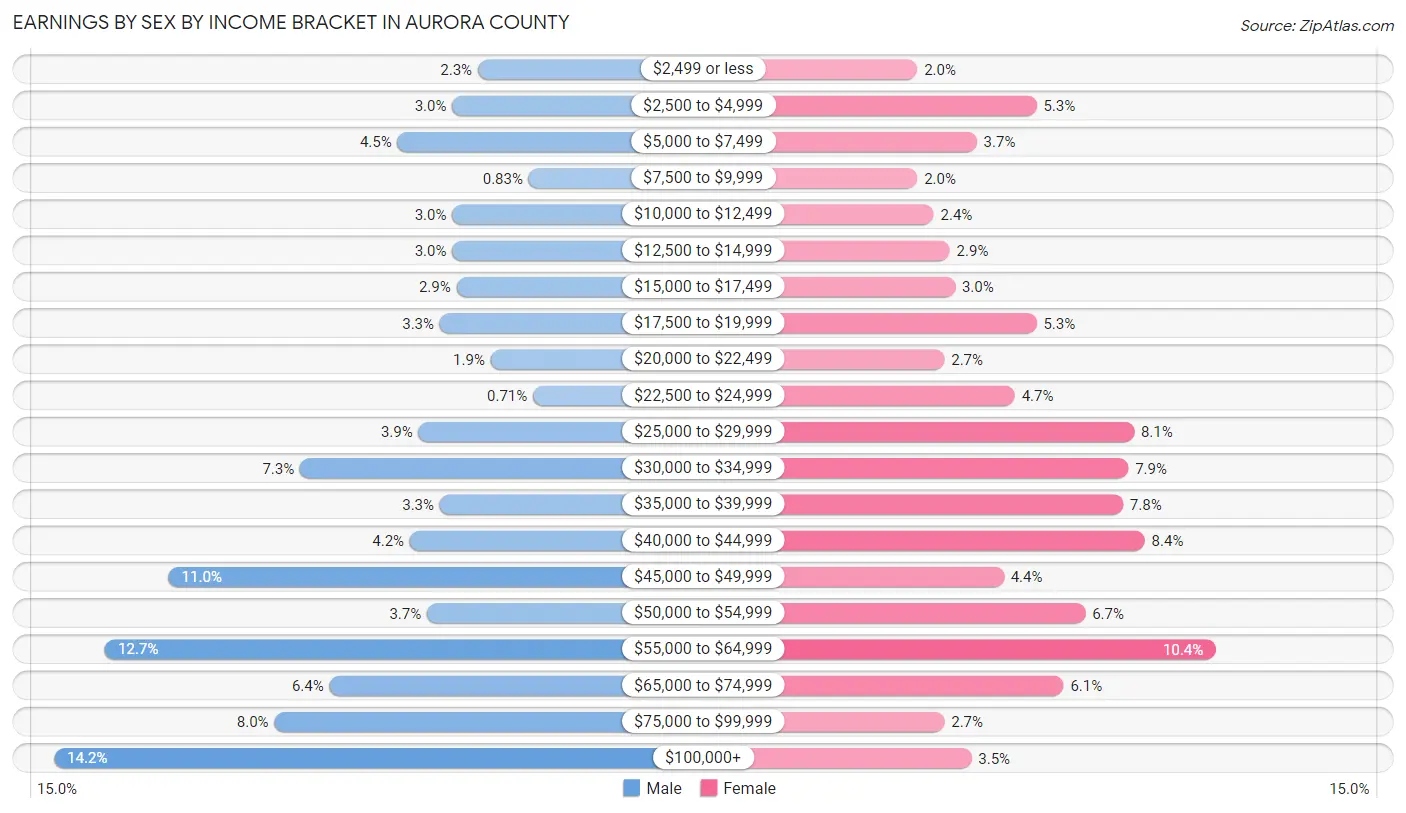
| Income | Male | Female |
| $2,499 or less | 19 (2.3%) | 13 (2.0%) |
| $2,500 to $4,999 | 25 (3.0%) | 35 (5.3%) |
| $5,000 to $7,499 | 38 (4.5%) | 24 (3.6%) |
| $7,500 to $9,999 | 7 (0.8%) | 13 (2.0%) |
| $10,000 to $12,499 | 25 (3.0%) | 16 (2.4%) |
| $12,500 to $14,999 | 25 (3.0%) | 19 (2.9%) |
| $15,000 to $17,499 | 24 (2.9%) | 20 (3.0%) |
| $17,500 to $19,999 | 28 (3.3%) | 35 (5.3%) |
| $20,000 to $22,499 | 16 (1.9%) | 18 (2.7%) |
| $22,500 to $24,999 | 6 (0.7%) | 31 (4.7%) |
| $25,000 to $29,999 | 33 (3.9%) | 53 (8.1%) |
| $30,000 to $34,999 | 61 (7.3%) | 52 (7.9%) |
| $35,000 to $39,999 | 28 (3.3%) | 51 (7.8%) |
| $40,000 to $44,999 | 35 (4.2%) | 55 (8.4%) |
| $45,000 to $49,999 | 92 (11.0%) | 29 (4.4%) |
| $50,000 to $54,999 | 31 (3.7%) | 44 (6.7%) |
| $55,000 to $64,999 | 107 (12.7%) | 68 (10.3%) |
| $65,000 to $74,999 | 54 (6.4%) | 40 (6.1%) |
| $75,000 to $99,999 | 67 (8.0%) | 18 (2.7%) |
| $100,000+ | 119 (14.2%) | 23 (3.5%) |
| Total | 840 (100.0%) | 657 (100.0%) |
Earnings by Sex by Educational Attainment in Aurora County
Average earnings in Aurora County are $52,125 for men and $38,583 for women, a difference of 26.0%. Men with an educational attainment of college or associate's degree enjoy the highest average annual earnings of $57,813, while those with high school diploma education earn the least with $44,250. Women with an educational attainment of bachelor's degree earn the most with the average annual earnings of $55,938, while those with high school diploma education have the smallest earnings of $24,792.
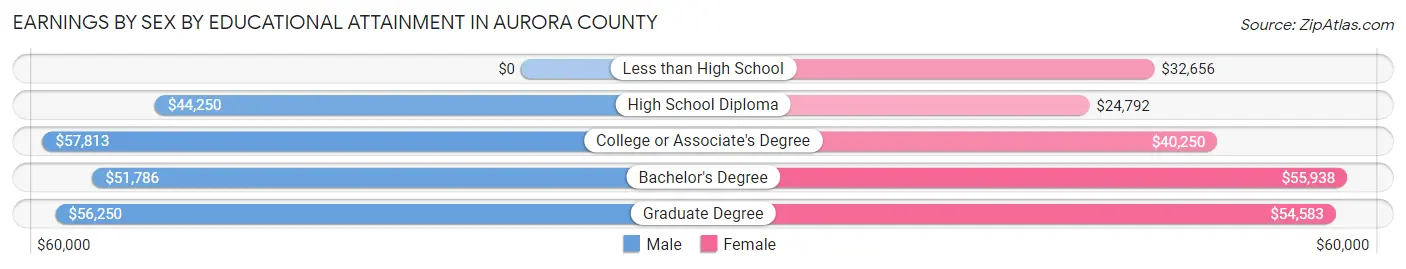
| Educational Attainment | Male Income | Female Income |
| Less than High School | - | - |
| High School Diploma | $44,250 | $24,792 |
| College or Associate's Degree | $57,813 | $40,250 |
| Bachelor's Degree | $51,786 | $55,938 |
| Graduate Degree | $56,250 | $54,583 |
| Total | $52,125 | $38,583 |
Family Income in Aurora County
Family Income Brackets in Aurora County
According to the Aurora County family income data, there are 173 families falling into the $100,000 to $149,999 income range, which is the most common income bracket and makes up 25.4% of all families.
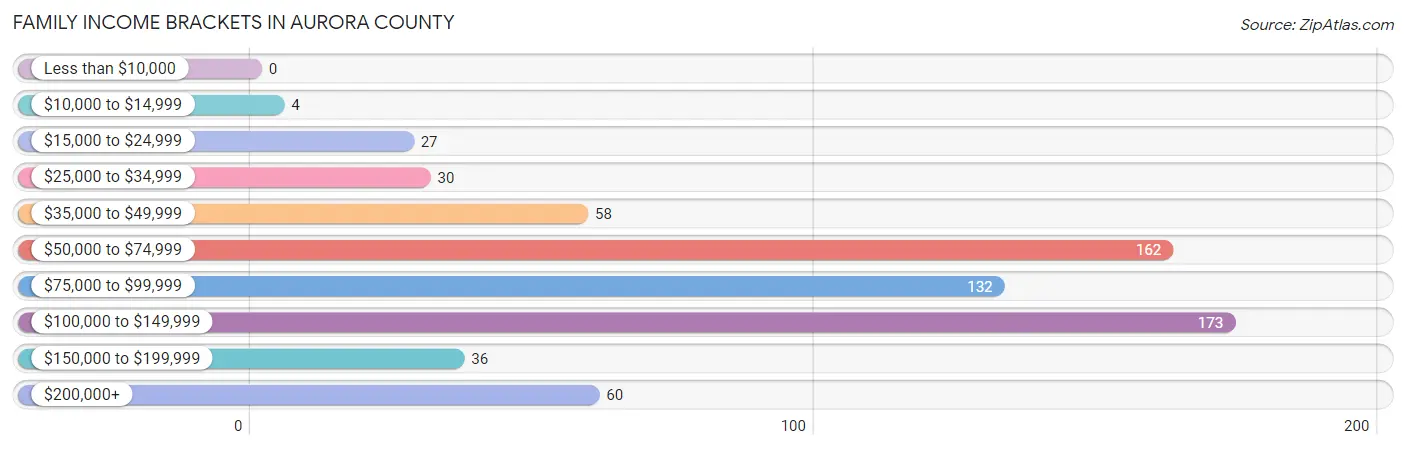
| Income Bracket | # Families | % Families |
| Less than $10,000 | 0 | 0.0% |
| $10,000 to $14,999 | 4 | 0.6% |
| $15,000 to $24,999 | 27 | 4.0% |
| $25,000 to $34,999 | 30 | 4.4% |
| $35,000 to $49,999 | 58 | 8.5% |
| $50,000 to $74,999 | 162 | 23.8% |
| $75,000 to $99,999 | 132 | 19.4% |
| $100,000 to $149,999 | 173 | 25.4% |
| $150,000 to $199,999 | 36 | 5.3% |
| $200,000+ | 60 | 8.8% |
Family Income by Famaliy Size in Aurora County
5-person families (78 | 11.4%) account for the highest median family income in Aurora County with $133,333 per family, while 3-person families (95 | 13.9%) have the highest median income of $36,719 per family member.
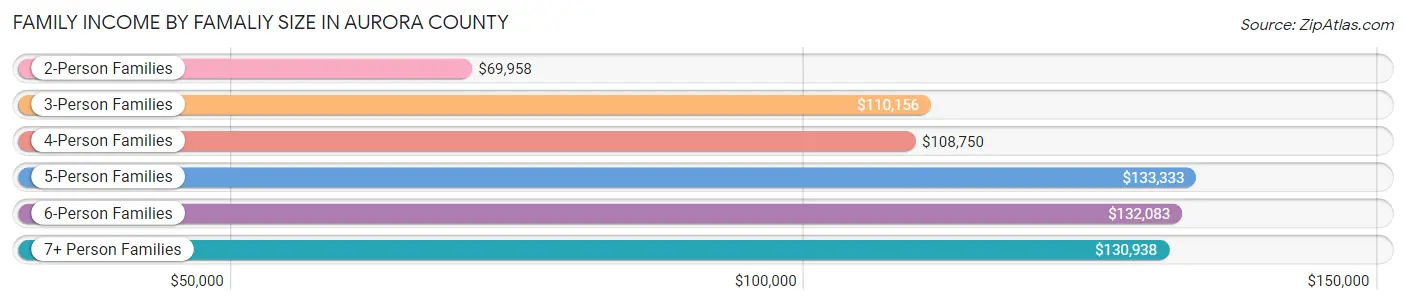
| Income Bracket | # Families | Median Income |
| 2-Person Families | 395 (57.9%) | $69,958 |
| 3-Person Families | 95 (13.9%) | $110,156 |
| 4-Person Families | 90 (13.2%) | $108,750 |
| 5-Person Families | 78 (11.4%) | $133,333 |
| 6-Person Families | 17 (2.5%) | $132,083 |
| 7+ Person Families | 7 (1.0%) | $130,938 |
| Total | 682 (100.0%) | $85,625 |
Family Income by Number of Earners in Aurora County
The median family income in Aurora County is $85,625, with families comprising 3+ earners (67) having the highest median family income of $138,750, while families with 1 earner (169) have the lowest median family income of $57,159, accounting for 9.8% and 24.8% of families, respectively.
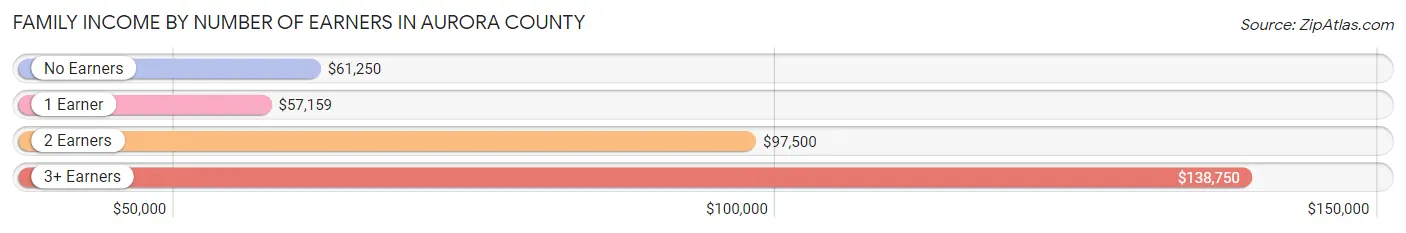
| Number of Earners | # Families | Median Income |
| No Earners | 74 (10.8%) | $61,250 |
| 1 Earner | 169 (24.8%) | $57,159 |
| 2 Earners | 372 (54.5%) | $97,500 |
| 3+ Earners | 67 (9.8%) | $138,750 |
| Total | 682 (100.0%) | $85,625 |
Household Income in Aurora County
Household Income Brackets in Aurora County
With 220 households falling in the category, the $50,000 to $74,999 income range is the most frequent in Aurora County, accounting for 20.9% of all households. In contrast, only 8 households (0.8%) fall into the less than $10,000 income bracket, making it the least populous group.
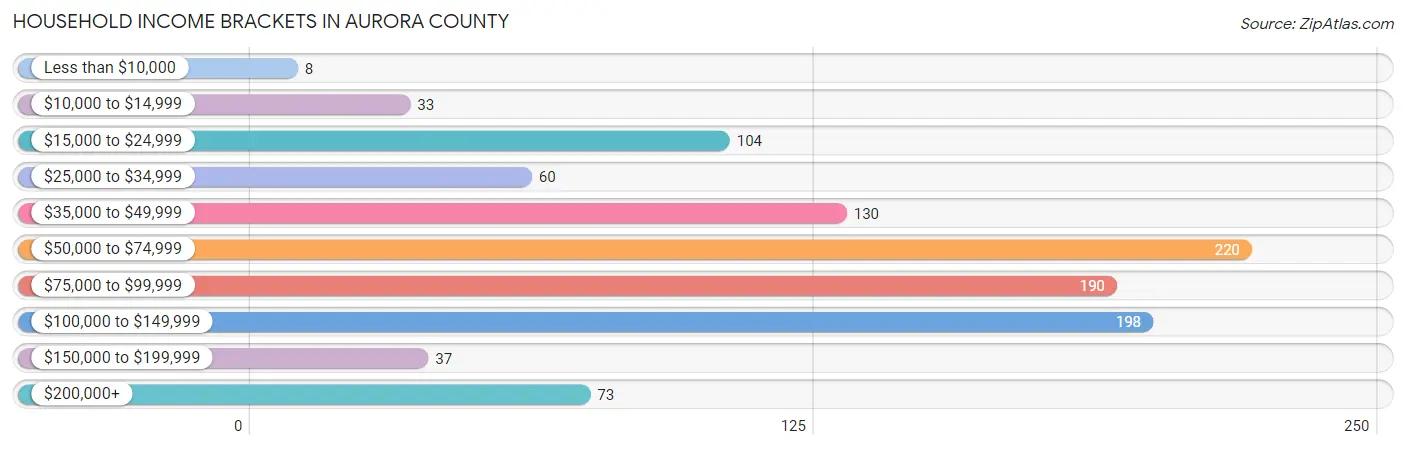
| Income Bracket | # Households | % Households |
| Less than $10,000 | 8 | 0.8% |
| $10,000 to $14,999 | 33 | 3.1% |
| $15,000 to $24,999 | 104 | 9.9% |
| $25,000 to $34,999 | 60 | 5.7% |
| $35,000 to $49,999 | 130 | 12.3% |
| $50,000 to $74,999 | 220 | 20.9% |
| $75,000 to $99,999 | 190 | 18.0% |
| $100,000 to $149,999 | 198 | 18.8% |
| $150,000 to $199,999 | 37 | 3.5% |
| $200,000+ | 73 | 6.9% |
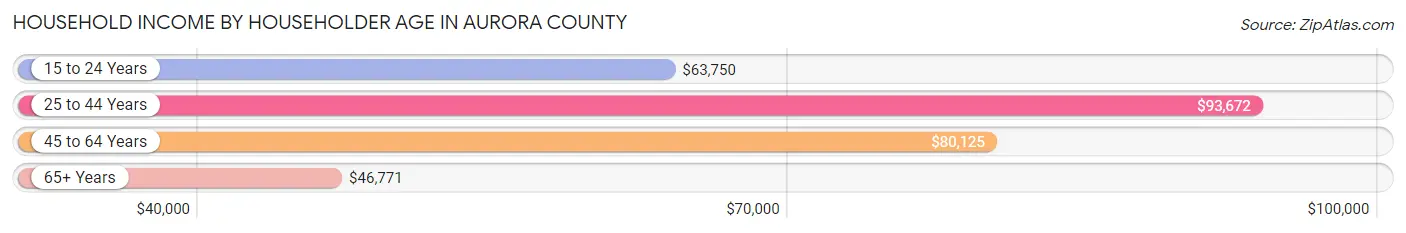
Household Income by Householder Age in Aurora County
The median household income in Aurora County is $71,490, with the highest median household income of $93,672 found in the 25 to 44 years age bracket for the primary householder. A total of 277 households (26.3%) fall into this category. Meanwhile, the 65+ years age bracket for the primary householder has the lowest median household income of $46,771, with 317 households (30.1%) in this group.
| Income Bracket | # Households | Median Income |
| 15 to 24 Years | 50 (4.8%) | $63,750 |
| 25 to 44 Years | 277 (26.3%) | $93,672 |
| 45 to 64 Years | 409 (38.8%) | $80,125 |
| 65+ Years | 317 (30.1%) | $46,771 |
| Total | 1,053 (100.0%) | $71,490 |
Poverty in Aurora County
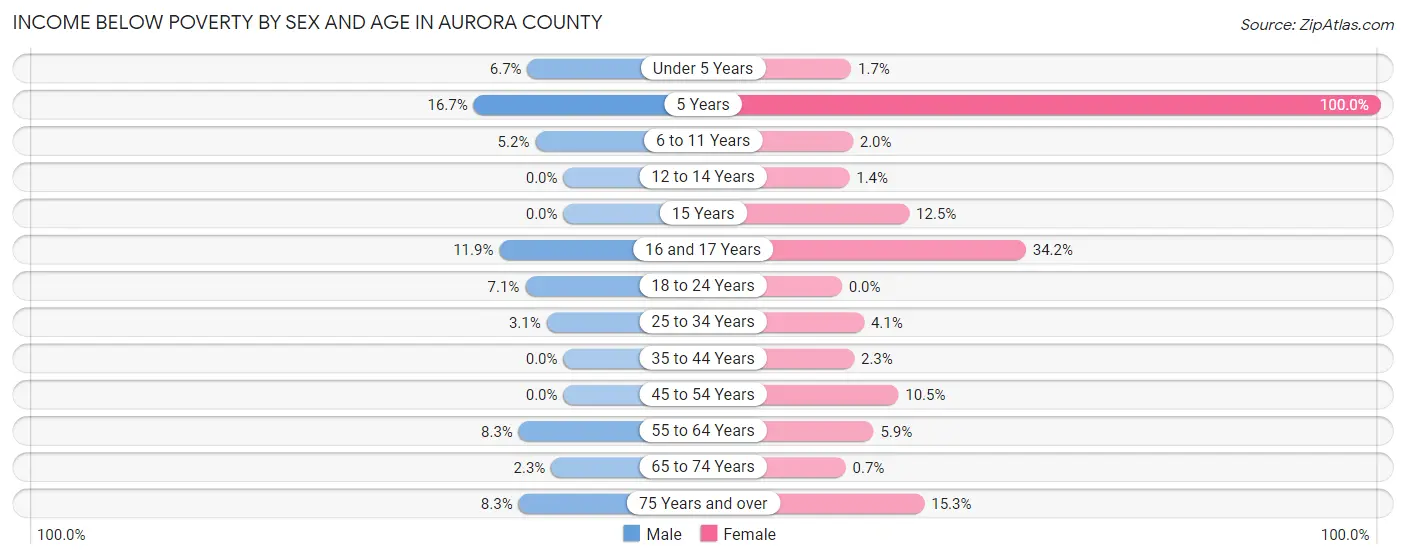
Income Below Poverty by Sex and Age in Aurora County
With 4.4% poverty level for males and 5.9% for females among the residents of Aurora County, 5 year old males and 5 year old females are the most vulnerable to poverty, with 3 males (16.7%) and 1 females (100.0%) in their respective age groups living below the poverty level.
| Age Bracket | Male | Female |
| Under 5 Years | 4 (6.7%) | 2 (1.7%) |
| 5 Years | 3 (16.7%) | 1 (100.0%) |
| 6 to 11 Years | 7 (5.2%) | 1 (2.0%) |
| 12 to 14 Years | 0 (0.0%) | 1 (1.4%) |
| 15 Years | 0 (0.0%) | 1 (12.5%) |
| 16 and 17 Years | 5 (11.9%) | 14 (34.2%) |
| 18 to 24 Years | 8 (7.1%) | 0 (0.0%) |
| 25 to 34 Years | 5 (3.1%) | 4 (4.1%) |
| 35 to 44 Years | 0 (0.0%) | 3 (2.3%) |
| 45 to 54 Years | 0 (0.0%) | 17 (10.5%) |
| 55 to 64 Years | 16 (8.3%) | 10 (5.9%) |
| 65 to 74 Years | 3 (2.3%) | 1 (0.7%) |
| 75 Years and over | 7 (8.3%) | 15 (15.3%) |
| Total | 58 (4.4%) | 70 (5.9%) |
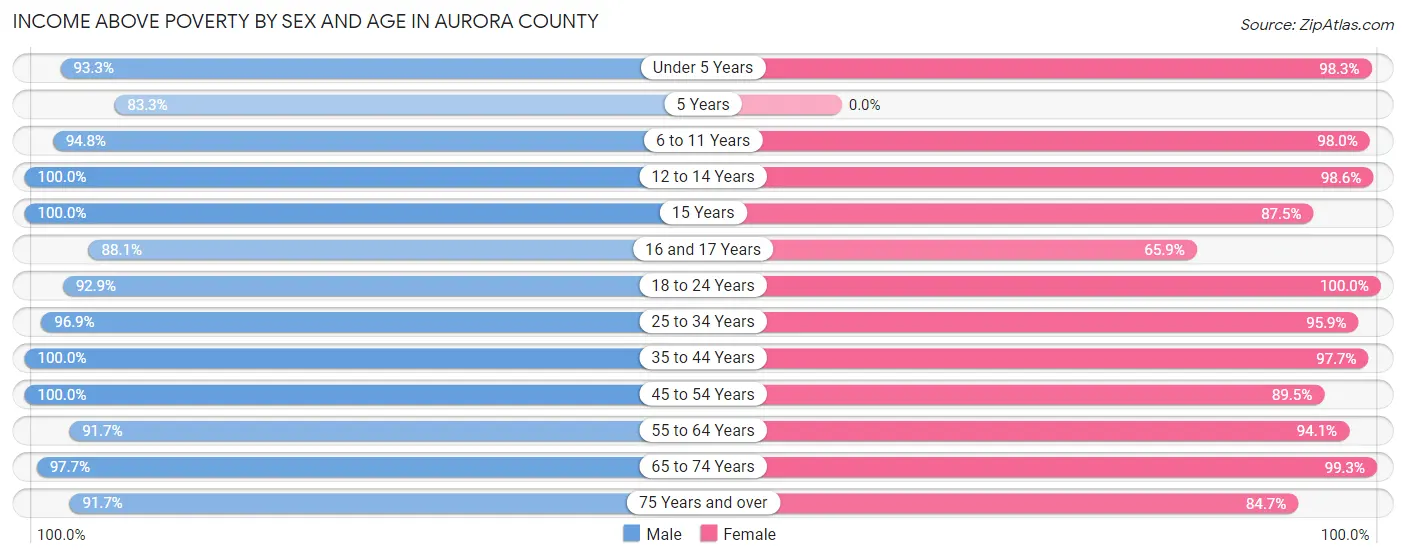
Income Above Poverty by Sex and Age in Aurora County
According to the poverty statistics in Aurora County, males aged 12 to 14 years and females aged 18 to 24 years are the age groups that are most secure financially, with 100.0% of males and 100.0% of females in these age groups living above the poverty line.
| Age Bracket | Male | Female |
| Under 5 Years | 56 (93.3%) | 114 (98.3%) |
| 5 Years | 15 (83.3%) | 0 (0.0%) |
| 6 to 11 Years | 127 (94.8%) | 48 (98.0%) |
| 12 to 14 Years | 46 (100.0%) | 71 (98.6%) |
| 15 Years | 21 (100.0%) | 7 (87.5%) |
| 16 and 17 Years | 37 (88.1%) | 27 (65.8%) |
| 18 to 24 Years | 105 (92.9%) | 93 (100.0%) |
| 25 to 34 Years | 155 (96.9%) | 93 (95.9%) |
| 35 to 44 Years | 170 (100.0%) | 129 (97.7%) |
| 45 to 54 Years | 135 (100.0%) | 145 (89.5%) |
| 55 to 64 Years | 177 (91.7%) | 160 (94.1%) |
| 65 to 74 Years | 130 (97.7%) | 142 (99.3%) |
| 75 Years and over | 77 (91.7%) | 83 (84.7%) |
| Total | 1,251 (95.6%) | 1,112 (94.1%) |
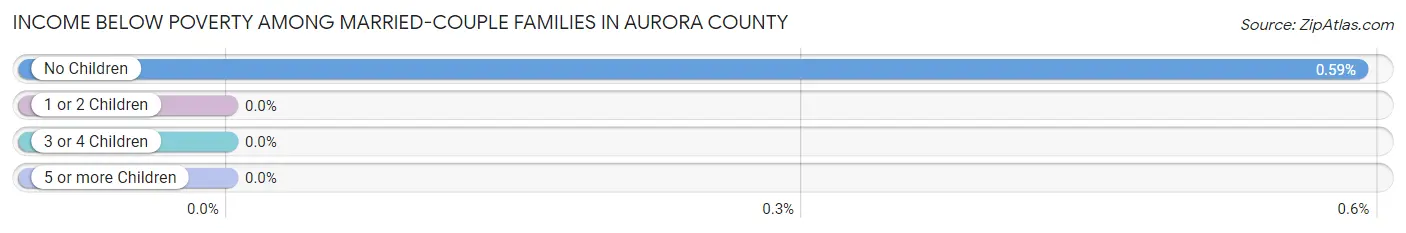
Income Below Poverty Among Married-Couple Families in Aurora County
The poverty statistics for married-couple families in Aurora County show that 0.4% or 2 of the total 572 families live below the poverty line. Families with no children have the highest poverty rate of 0.6%, comprising of 2 families. On the other hand, families with 1 or 2 children have the lowest poverty rate of 0.0%, which includes 0 families.
| Children | Above Poverty | Below Poverty |
| No Children | 336 (99.4%) | 2 (0.6%) |
| 1 or 2 Children | 155 (100.0%) | 0 (0.0%) |
| 3 or 4 Children | 76 (100.0%) | 0 (0.0%) |
| 5 or more Children | 3 (100.0%) | 0 (0.0%) |
| Total | 570 (99.7%) | 2 (0.4%) |
Income Below Poverty Among Single-Parent Households in Aurora County
According to the poverty data in Aurora County, 7.1% or 4 single-father households and 14.8% or 8 single-mother households are living below the poverty line. Among single-father households, those with 1 or 2 children have the highest poverty rate, with 4 households (16.0%) experiencing poverty. Likewise, among single-mother households, those with 3 or 4 children have the highest poverty rate, with 5 households (35.7%) falling below the poverty line.
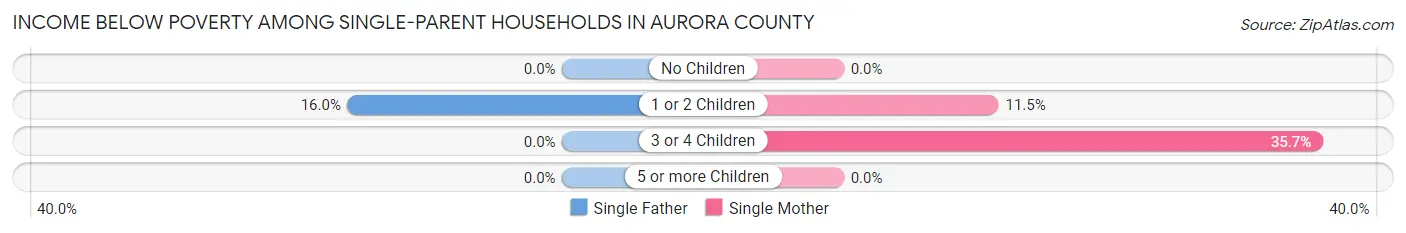
| Children | Single Father | Single Mother |
| No Children | 0 (0.0%) | 0 (0.0%) |
| 1 or 2 Children | 4 (16.0%) | 3 (11.5%) |
| 3 or 4 Children | 0 (0.0%) | 5 (35.7%) |
| 5 or more Children | 0 (0.0%) | 0 (0.0%) |
| Total | 4 (7.1%) | 8 (14.8%) |
Income Below Poverty Among Married-Couple vs Single-Parent Households in Aurora County
The poverty data for Aurora County shows that 2 of the married-couple family households (0.4%) and 12 of the single-parent households (10.9%) are living below the poverty level. Within the married-couple family households, those with no children have the highest poverty rate, with 2 households (0.6%) falling below the poverty line. Among the single-parent households, those with 3 or 4 children have the highest poverty rate, with 5 household (35.7%) living below poverty.
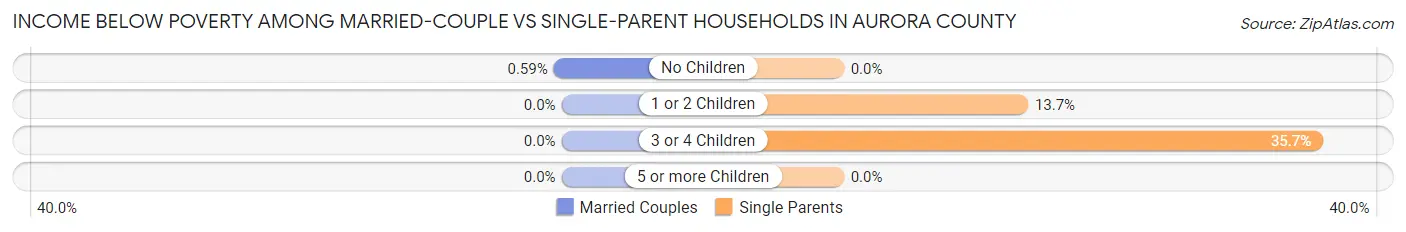
| Children | Married-Couple Families | Single-Parent Households |
| No Children | 2 (0.6%) | 0 (0.0%) |
| 1 or 2 Children | 0 (0.0%) | 7 (13.7%) |
| 3 or 4 Children | 0 (0.0%) | 5 (35.7%) |
| 5 or more Children | 0 (0.0%) | 0 (0.0%) |
| Total | 2 (0.4%) | 12 (10.9%) |
Race in Aurora County
The most populous races in Aurora County are White / Caucasian (2,415 | 93.2%), Hispanic or Latino (172 | 6.6%), and Native / Alaskan (62 | 2.4%).
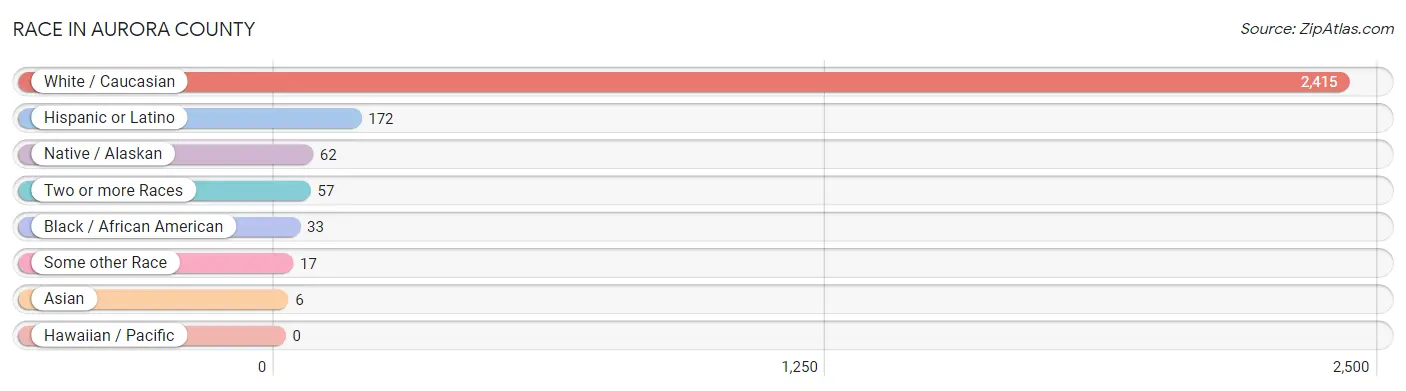
| Race | # Population | % Population |
| Asian | 6 | 0.2% |
| Black / African American | 33 | 1.3% |
| Hawaiian / Pacific | 0 | 0.0% |
| Hispanic or Latino | 172 | 6.6% |
| Native / Alaskan | 62 | 2.4% |
| White / Caucasian | 2,415 | 93.2% |
| Two or more Races | 57 | 2.2% |
| Some other Race | 17 | 0.7% |
| Total | 2,590 | 100.0% |
Ancestry in Aurora County
The most populous ancestries reported in Aurora County are German (1,055 | 40.7%), Dutch (315 | 12.2%), American (241 | 9.3%), Norwegian (231 | 8.9%), and Mexican (161 | 6.2%), together accounting for 77.3% of all Aurora County residents.
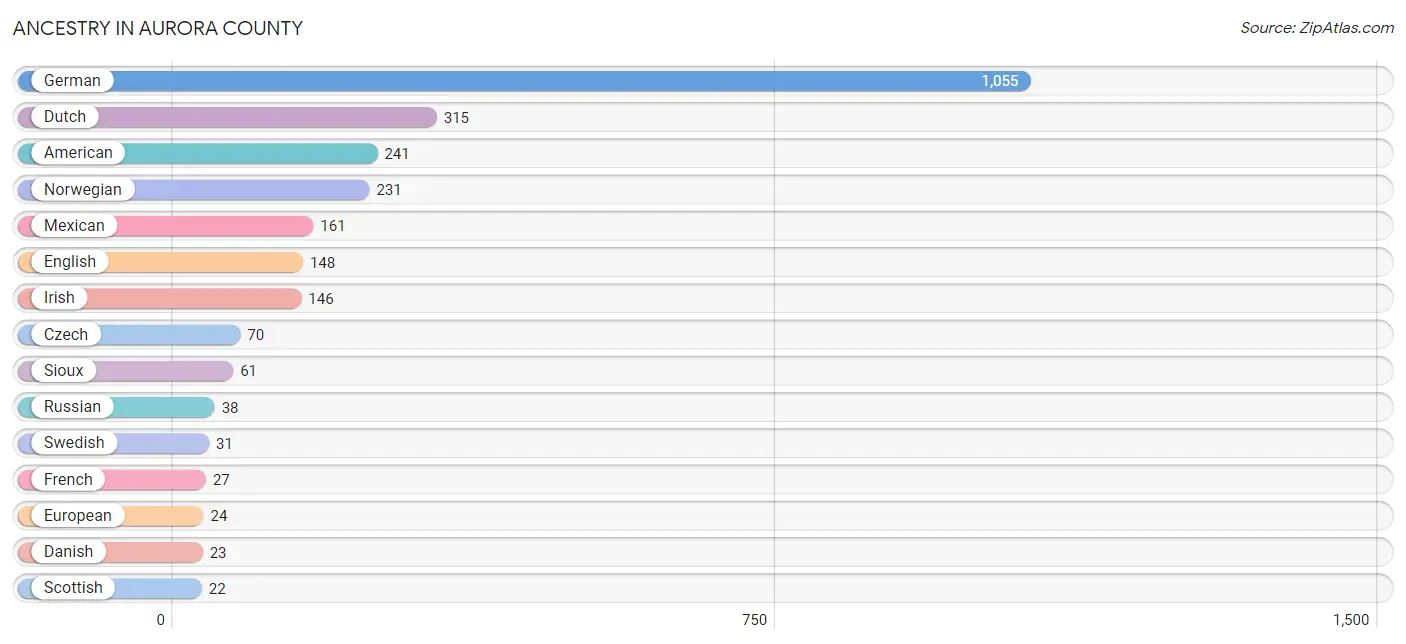
| Ancestry | # Population | % Population |
| American | 241 | 9.3% |
| Barbadian | 3 | 0.1% |
| Belgian | 2 | 0.1% |
| Brazilian | 11 | 0.4% |
| British | 10 | 0.4% |
| Chippewa | 2 | 0.1% |
| Czech | 70 | 2.7% |
| Czechoslovakian | 1 | 0.0% |
| Danish | 23 | 0.9% |
| Dutch | 315 | 12.2% |
| English | 148 | 5.7% |
| European | 24 | 0.9% |
| French | 27 | 1.0% |
| French Canadian | 2 | 0.1% |
| German | 1,055 | 40.7% |
| Haitian | 11 | 0.4% |
| Hungarian | 5 | 0.2% |
| Irish | 146 | 5.6% |
| Italian | 8 | 0.3% |
| Korean | 6 | 0.2% |
| Luxembourger | 3 | 0.1% |
| Mexican | 161 | 6.2% |
| Northern European | 2 | 0.1% |
| Norwegian | 231 | 8.9% |
| Polish | 19 | 0.7% |
| Portuguese | 3 | 0.1% |
| Russian | 38 | 1.5% |
| Scandinavian | 8 | 0.3% |
| Scotch-Irish | 4 | 0.2% |
| Scottish | 22 | 0.9% |
| Sioux | 61 | 2.4% |
| Slovak | 1 | 0.0% |
| Slovene | 2 | 0.1% |
| Spaniard | 1 | 0.0% |
| Subsaharan African | 9 | 0.4% |
| Sudanese | 9 | 0.4% |
| Swedish | 31 | 1.2% |
| Welsh | 11 | 0.4% | View All 38 Rows |
Immigrants in Aurora County
The most numerous immigrant groups reported in Aurora County came from Latin America (96 | 3.7%), Central America (82 | 3.2%), Mexico (82 | 3.2%), Brazil (14 | 0.5%), and South America (14 | 0.5%), together accounting for 11.1% of all Aurora County residents.
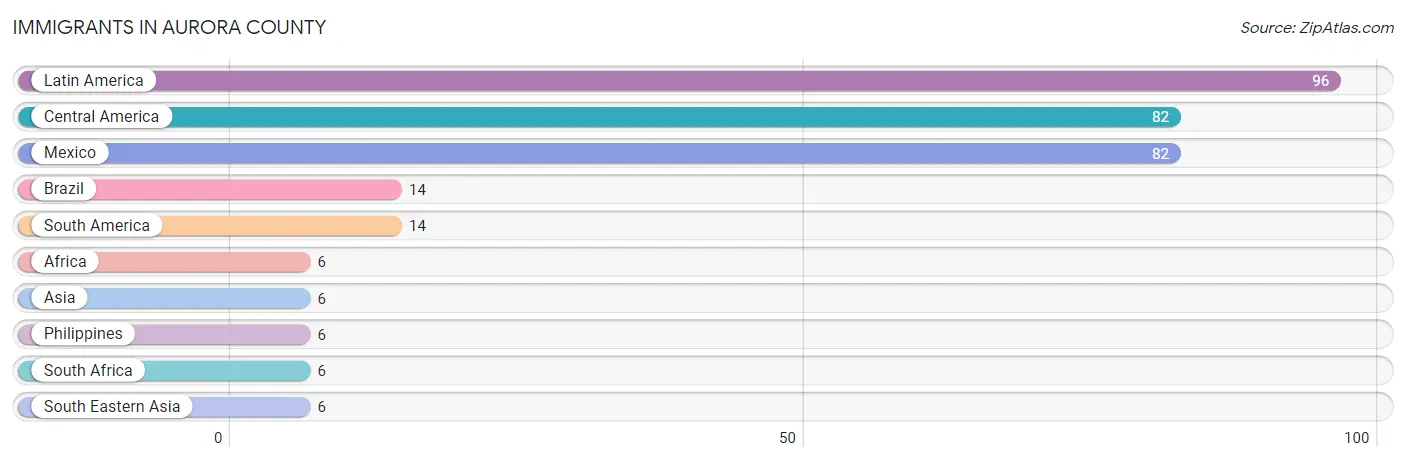
| Immigration Origin | # Population | % Population |
| Africa | 6 | 0.2% |
| Asia | 6 | 0.2% |
| Brazil | 14 | 0.5% |
| Central America | 82 | 3.2% |
| Latin America | 96 | 3.7% |
| Mexico | 82 | 3.2% |
| Philippines | 6 | 0.2% |
| South Africa | 6 | 0.2% |
| South America | 14 | 0.5% |
| South Eastern Asia | 6 | 0.2% | View All 10 Rows |
Sex and Age in Aurora County
Sex and Age in Aurora County
The most populous age groups in Aurora County are 55 to 59 Years (113 | 8.3%) for men and Under 5 Years (116 | 9.4%) for women.
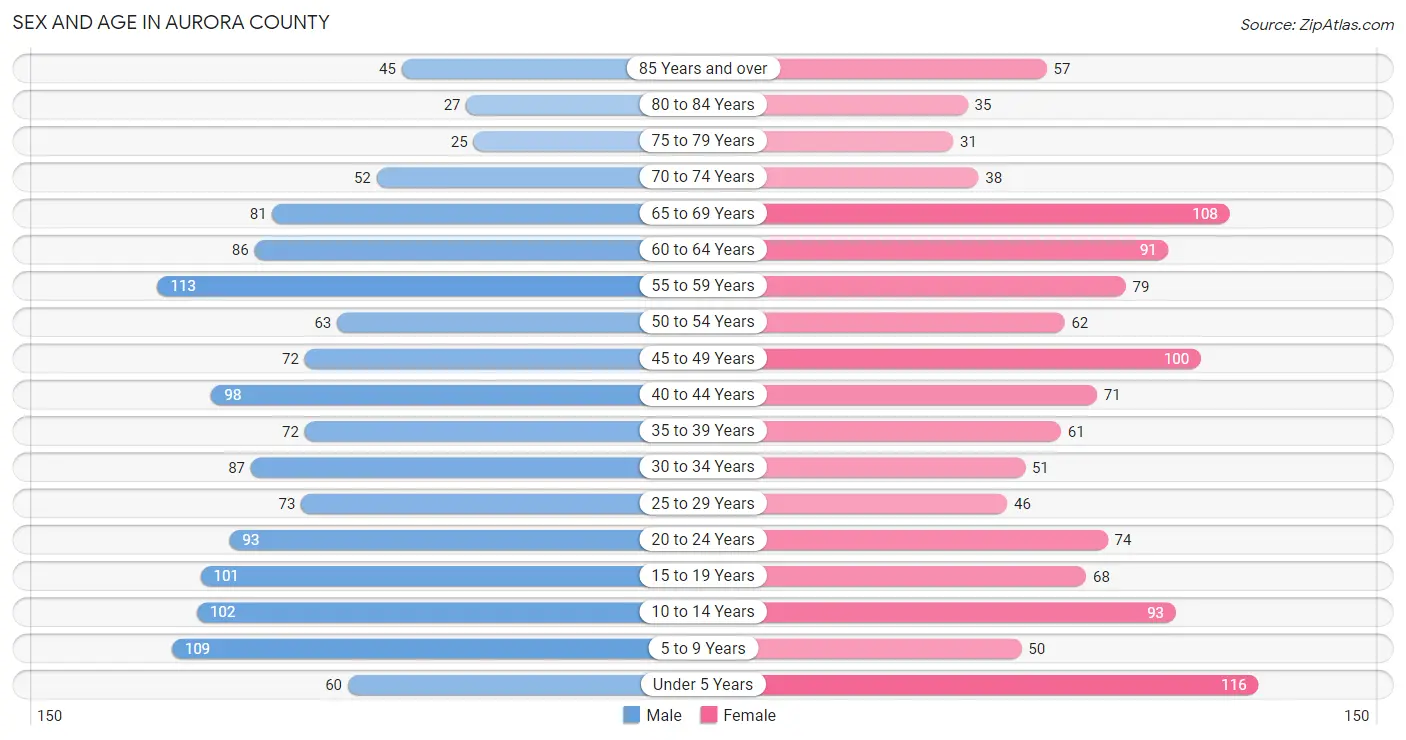
| Age Bracket | Male | Female |
| Under 5 Years | 60 (4.4%) | 116 (9.4%) |
| 5 to 9 Years | 109 (8.0%) | 50 (4.1%) |
| 10 to 14 Years | 102 (7.5%) | 93 (7.5%) |
| 15 to 19 Years | 101 (7.4%) | 68 (5.5%) |
| 20 to 24 Years | 93 (6.8%) | 74 (6.0%) |
| 25 to 29 Years | 73 (5.4%) | 46 (3.7%) |
| 30 to 34 Years | 87 (6.4%) | 51 (4.1%) |
| 35 to 39 Years | 72 (5.3%) | 61 (5.0%) |
| 40 to 44 Years | 98 (7.2%) | 71 (5.8%) |
| 45 to 49 Years | 72 (5.3%) | 100 (8.1%) |
| 50 to 54 Years | 63 (4.6%) | 62 (5.0%) |
| 55 to 59 Years | 113 (8.3%) | 79 (6.4%) |
| 60 to 64 Years | 86 (6.3%) | 91 (7.4%) |
| 65 to 69 Years | 81 (6.0%) | 108 (8.8%) |
| 70 to 74 Years | 52 (3.8%) | 38 (3.1%) |
| 75 to 79 Years | 25 (1.8%) | 31 (2.5%) |
| 80 to 84 Years | 27 (2.0%) | 35 (2.8%) |
| 85 Years and over | 45 (3.3%) | 57 (4.6%) |
| Total | 1,359 (100.0%) | 1,231 (100.0%) |
Families and Households in Aurora County
Median Family Size in Aurora County
The median family size in Aurora County is 2.93 persons per family, with single female/mother families (54 | 7.9%) accounting for the largest median family size of 3.04 persons per family. On the other hand, single male/father families (56 | 8.2%) represent the smallest median family size with 1.98 persons per family.

| Family Type | # Families | Family Size |
| Married-Couple | 572 (83.9%) | 3.01 |
| Single Male/Father | 56 (8.2%) | 1.98 |
| Single Female/Mother | 54 (7.9%) | 3.04 |
| Total Families | 682 (100.0%) | 2.93 |
Median Household Size in Aurora County
The median household size in Aurora County is 2.36 persons per household, with single female/mother households (54 | 5.1%) accounting for the largest median household size of 3.24 persons per household. non-family households (371 | 35.2%) represent the smallest median household size with 1.17 persons per household.

| Household Type | # Households | Household Size |
| Married-Couple | 572 (54.3%) | 3.04 |
| Single Male/Father | 56 (5.3%) | 2.43 |
| Single Female/Mother | 54 (5.1%) | 3.24 |
| Non-family | 371 (35.2%) | 1.17 |
| Total Households | 1,053 (100.0%) | 2.36 |
Household Size by Marriage Status in Aurora County
Out of a total of 1,053 households in Aurora County, 682 (64.8%) are family households, while 371 (35.2%) are nonfamily households. The most numerous type of family households are 2-person households, comprising 363, and the most common type of nonfamily households are 1-person households, comprising 329.
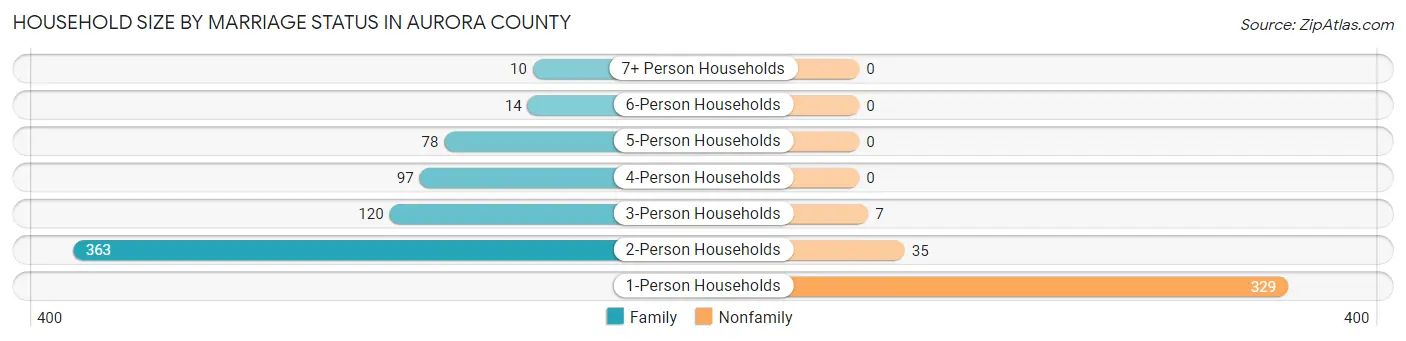
| Household Size | Family Households | Nonfamily Households |
| 1-Person Households | - | 329 (31.2%) |
| 2-Person Households | 363 (34.5%) | 35 (3.3%) |
| 3-Person Households | 120 (11.4%) | 7 (0.7%) |
| 4-Person Households | 97 (9.2%) | 0 (0.0%) |
| 5-Person Households | 78 (7.4%) | 0 (0.0%) |
| 6-Person Households | 14 (1.3%) | 0 (0.0%) |
| 7+ Person Households | 10 (0.9%) | 0 (0.0%) |
| Total | 682 (64.8%) | 371 (35.2%) |
Female Fertility in Aurora County
Fertility by Age in Aurora County
Average fertility rate in Aurora County is 32.0 births per 1,000 women. Women in the age bracket of 20 to 34 years have the highest fertility rate with 58.0 births per 1,000 women. Women in the age bracket of 20 to 34 years acount for 66.7% of all women with births.
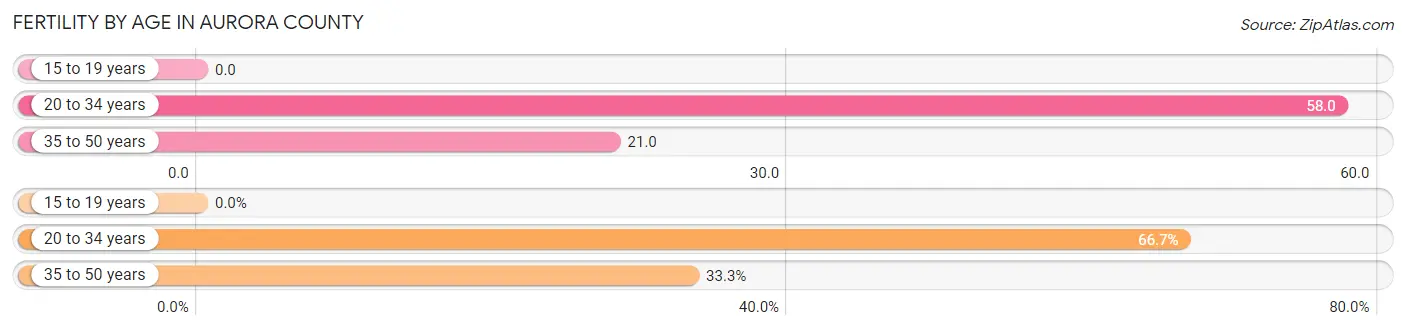
| Age Bracket | Women with Births | Births / 1,000 Women |
| 15 to 19 years | 0 (0.0%) | 0.0 |
| 20 to 34 years | 10 (66.7%) | 58.0 |
| 35 to 50 years | 5 (33.3%) | 21.0 |
| Total | 15 (100.0%) | 32.0 |
Fertility by Age by Marriage Status in Aurora County
66.7% of women with births (15) in Aurora County are married. The highest percentage of unmarried women with births falls into 20 to 34 years age bracket with 50.0% of them unmarried at the time of birth, while the lowest percentage of unmarried women with births belong to 35 to 50 years age bracket with 0.0% of them unmarried.
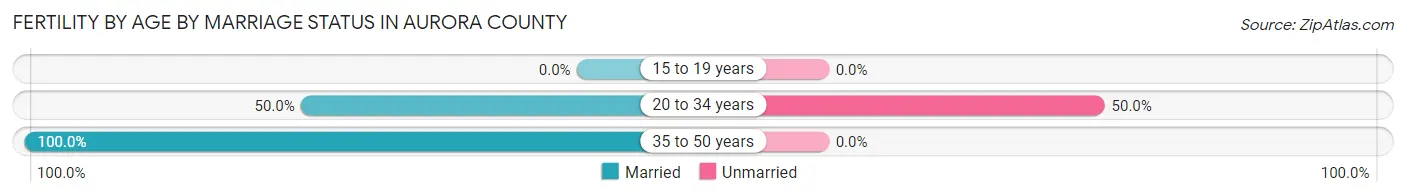
| Age Bracket | Married | Unmarried |
| 15 to 19 years | 0 (0.0%) | 0 (0.0%) |
| 20 to 34 years | 5 (50.0%) | 5 (50.0%) |
| 35 to 50 years | 5 (100.0%) | 0 (0.0%) |
| Total | 10 (66.7%) | 5 (33.3%) |
Fertility by Education in Aurora County
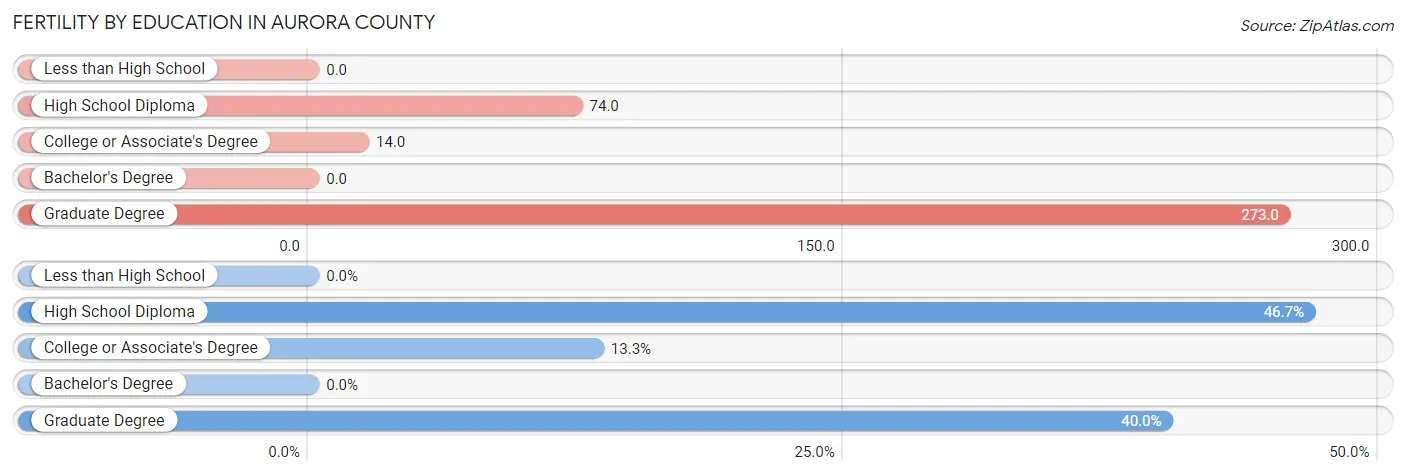
| Educational Attainment | Women with Births | Births / 1,000 Women |
| Less than High School | 0 (0.0%) | 0.0 |
| High School Diploma | 7 (46.7%) | 74.0 |
| College or Associate's Degree | 2 (13.3%) | 14.0 |
| Bachelor's Degree | 0 (0.0%) | 0.0 |
| Graduate Degree | 6 (40.0%) | 273.0 |
| Total | 15 (100.0%) | 32.0 |
Fertility by Education by Marriage Status in Aurora County
33.3% of women with births in Aurora County are unmarried. Women with the educational attainment of college or associate's degree are most likely to be married with 100.0% of them married at childbirth, while women with the educational attainment of high school diploma are least likely to be married with 71.4% of them unmarried at childbirth.
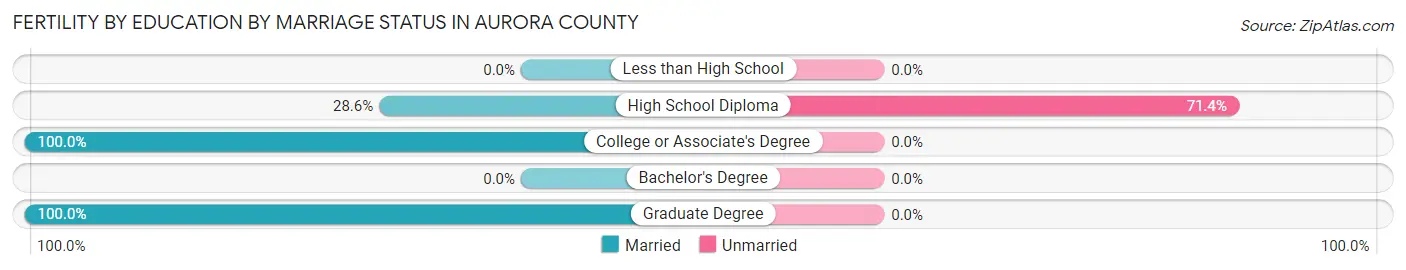
| Educational Attainment | Married | Unmarried |
| Less than High School | 0 (0.0%) | 0 (0.0%) |
| High School Diploma | 2 (28.6%) | 5 (71.4%) |
| College or Associate's Degree | 2 (100.0%) | 0 (0.0%) |
| Bachelor's Degree | 0 (0.0%) | 0 (0.0%) |
| Graduate Degree | 6 (100.0%) | 0 (0.0%) |
| Total | 10 (66.7%) | 5 (33.3%) |
Employment Characteristics in Aurora County
Employment by Class of Employer in Aurora County
Among the 1,384 employed individuals in Aurora County, private company employees (812 | 58.7%), self-employed (not incorporated) (217 | 15.7%), and not-for-profit organizations (120 | 8.7%) make up the most common classes of employment.
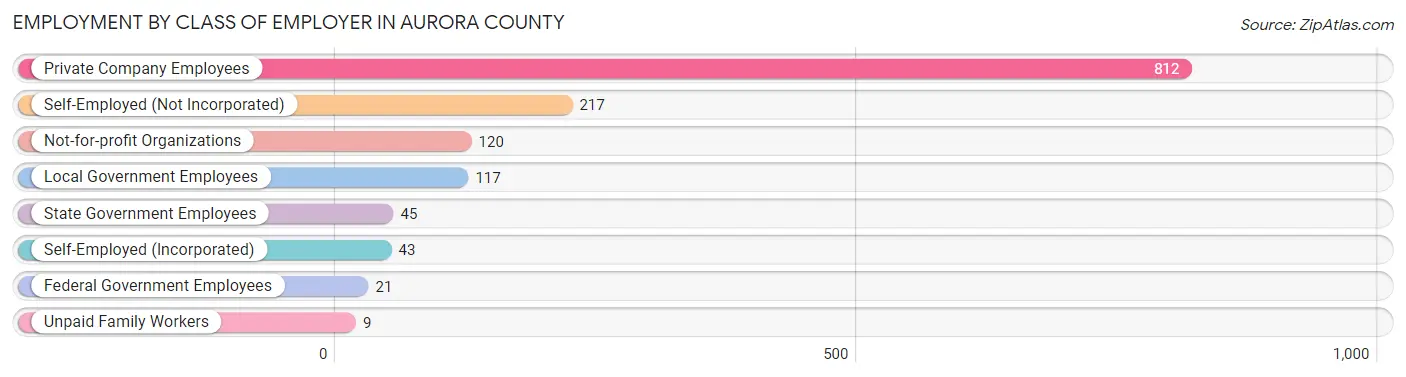
| Employer Class | # Employees | % Employees |
| Private Company Employees | 812 | 58.7% |
| Self-Employed (Incorporated) | 43 | 3.1% |
| Self-Employed (Not Incorporated) | 217 | 15.7% |
| Not-for-profit Organizations | 120 | 8.7% |
| Local Government Employees | 117 | 8.5% |
| State Government Employees | 45 | 3.3% |
| Federal Government Employees | 21 | 1.5% |
| Unpaid Family Workers | 9 | 0.6% |
| Total | 1,384 | 100.0% |
Employment Status by Age in Aurora County
According to the labor force statistics for Aurora County, out of the total population over 16 years of age (2,018), 70.0% or 1,413 individuals are in the labor force, with 0.8% or 11 of them unemployed. The age group with the highest labor force participation rate is 30 to 34 years, with 97.8% or 135 individuals in the labor force. Within the labor force, the 16 to 19 years age range has the highest percentage of unemployed individuals, with 16.0% or 8 of them being unemployed.
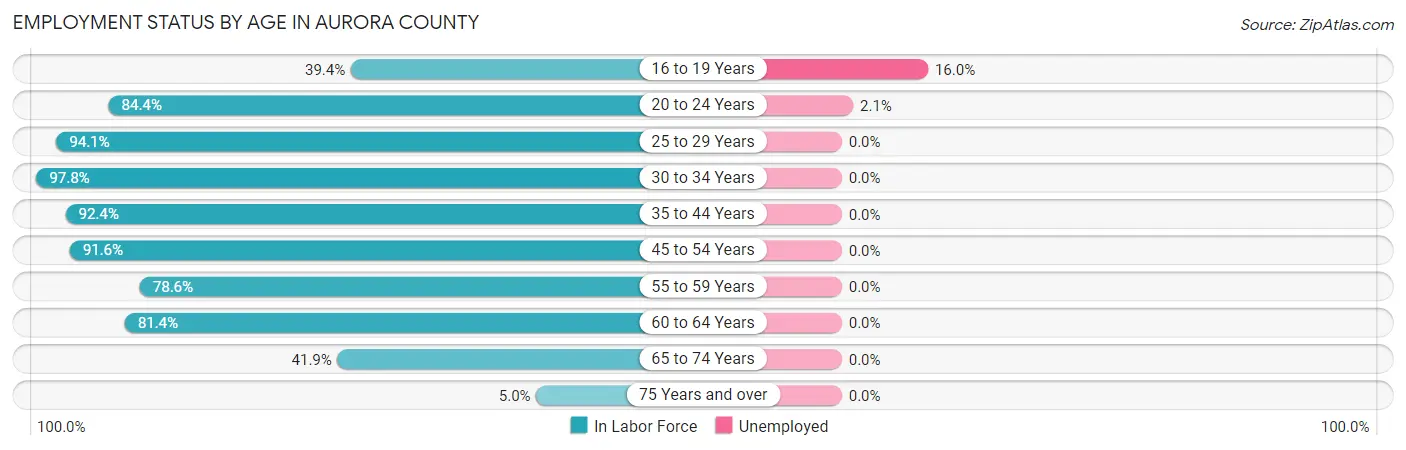
| Age Bracket | In Labor Force | Unemployed |
| 16 to 19 Years | 50 (39.4%) | 8 (16.0%) |
| 20 to 24 Years | 141 (84.4%) | 3 (2.1%) |
| 25 to 29 Years | 112 (94.1%) | 0 (0.0%) |
| 30 to 34 Years | 135 (97.8%) | 0 (0.0%) |
| 35 to 44 Years | 279 (92.4%) | 0 (0.0%) |
| 45 to 54 Years | 272 (91.6%) | 0 (0.0%) |
| 55 to 59 Years | 151 (78.6%) | 0 (0.0%) |
| 60 to 64 Years | 144 (81.4%) | 0 (0.0%) |
| 65 to 74 Years | 117 (41.9%) | 0 (0.0%) |
| 75 Years and over | 11 (5.0%) | 0 (0.0%) |
| Total | 1,413 (70.0%) | 11 (0.8%) |
Employment Status by Educational Attainment in Aurora County
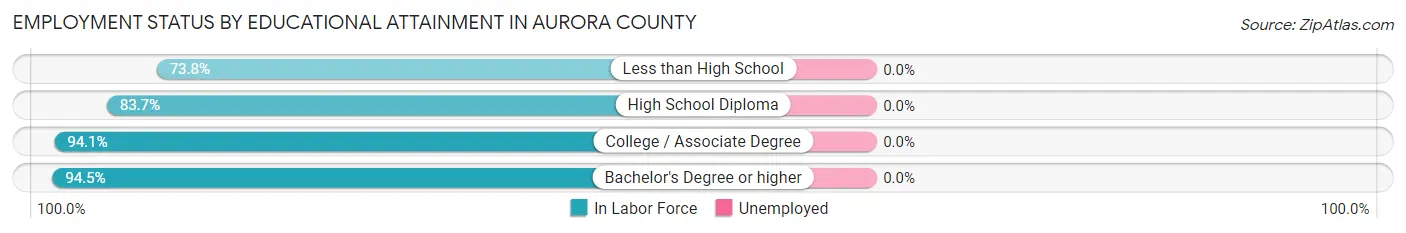
| Educational Attainment | In Labor Force | Unemployed |
| Less than High School | 79 (73.8%) | 0 (0.0%) |
| High School Diploma | 313 (83.7%) | 0 (0.0%) |
| College / Associate Degree | 459 (94.1%) | 0 (0.0%) |
| Bachelor's Degree or higher | 242 (94.5%) | 0 (0.0%) |
| Total | 1,093 (89.2%) | 0 (0.0%) |
Employment Occupations by Sex in Aurora County
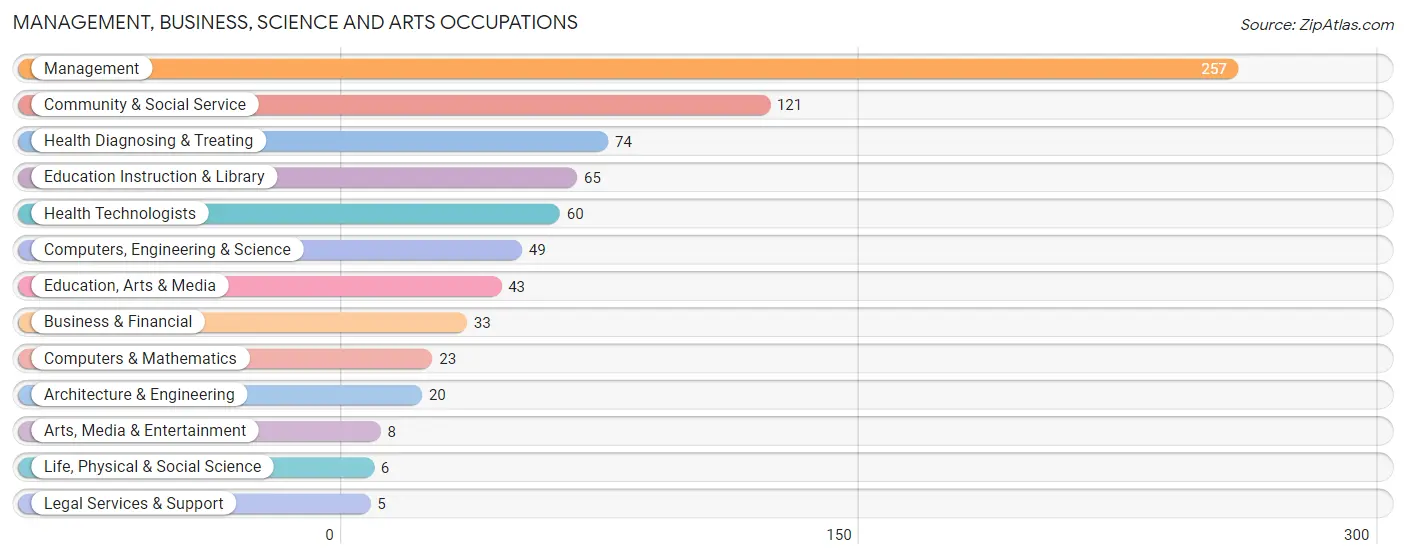
Management, Business, Science and Arts Occupations
The most common Management, Business, Science and Arts occupations in Aurora County are Management (257 | 18.4%), Community & Social Service (121 | 8.7%), Health Diagnosing & Treating (74 | 5.3%), Education Instruction & Library (65 | 4.7%), and Health Technologists (60 | 4.3%).
Management, Business, Science and Arts Occupations by Sex
Within the Management, Business, Science and Arts occupations in Aurora County, the most male-oriented occupations are Architecture & Engineering (100.0%), Computers, Engineering & Science (93.9%), and Computers & Mathematics (91.3%), while the most female-oriented occupations are Arts, Media & Entertainment (100.0%), Education Instruction & Library (93.9%), and Health Diagnosing & Treating (87.8%).
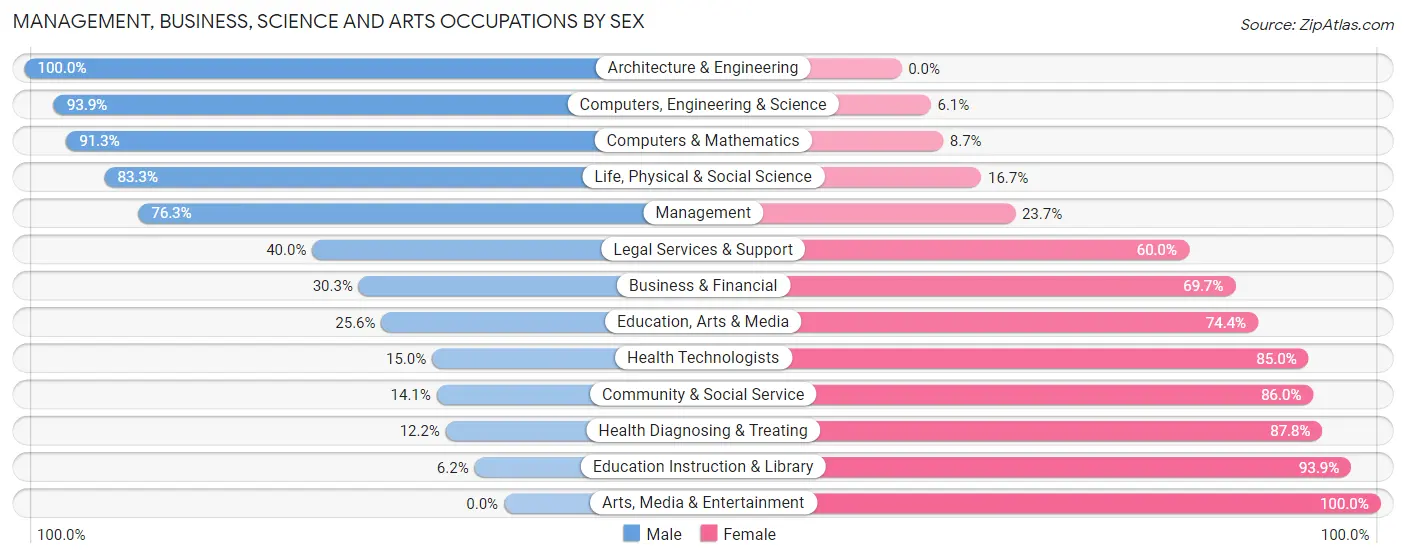
| Occupation | Male | Female |
| Management | 196 (76.3%) | 61 (23.7%) |
| Business & Financial | 10 (30.3%) | 23 (69.7%) |
| Computers, Engineering & Science | 46 (93.9%) | 3 (6.1%) |
| Computers & Mathematics | 21 (91.3%) | 2 (8.7%) |
| Architecture & Engineering | 20 (100.0%) | 0 (0.0%) |
| Life, Physical & Social Science | 5 (83.3%) | 1 (16.7%) |
| Community & Social Service | 17 (14.1%) | 104 (86.0%) |
| Education, Arts & Media | 11 (25.6%) | 32 (74.4%) |
| Legal Services & Support | 2 (40.0%) | 3 (60.0%) |
| Education Instruction & Library | 4 (6.1%) | 61 (93.9%) |
| Arts, Media & Entertainment | 0 (0.0%) | 8 (100.0%) |
| Health Diagnosing & Treating | 9 (12.2%) | 65 (87.8%) |
| Health Technologists | 9 (15.0%) | 51 (85.0%) |
| Total (Category) | 278 (52.1%) | 256 (47.9%) |
| Total (Overall) | 786 (56.3%) | 610 (43.7%) |
Services Occupations
The most common Services occupations in Aurora County are Food Preparation & Serving (66 | 4.7%), Cleaning & Maintenance (45 | 3.2%), Healthcare Support (38 | 2.7%), Personal Care & Service (38 | 2.7%), and Security & Protection (4 | 0.3%).
Services Occupations by Sex
Within the Services occupations in Aurora County, the most male-oriented occupations are Security & Protection (100.0%), Firefighting & Prevention (100.0%), and Law Enforcement (100.0%), while the most female-oriented occupations are Healthcare Support (100.0%), Personal Care & Service (81.6%), and Food Preparation & Serving (77.3%).
| Occupation | Male | Female |
| Healthcare Support | 0 (0.0%) | 38 (100.0%) |
| Security & Protection | 4 (100.0%) | 0 (0.0%) |
| Firefighting & Prevention | 2 (100.0%) | 0 (0.0%) |
| Law Enforcement | 2 (100.0%) | 0 (0.0%) |
| Food Preparation & Serving | 15 (22.7%) | 51 (77.3%) |
| Cleaning & Maintenance | 28 (62.2%) | 17 (37.8%) |
| Personal Care & Service | 7 (18.4%) | 31 (81.6%) |
| Total (Category) | 54 (28.3%) | 137 (71.7%) |
| Total (Overall) | 786 (56.3%) | 610 (43.7%) |
Sales and Office Occupations
The most common Sales and Office occupations in Aurora County are Office & Administration (125 | 8.9%), and Sales & Related (103 | 7.4%).

Sales and Office Occupations by Sex
| Occupation | Male | Female |
| Sales & Related | 49 (47.6%) | 54 (52.4%) |
| Office & Administration | 27 (21.6%) | 98 (78.4%) |
| Total (Category) | 76 (33.3%) | 152 (66.7%) |
| Total (Overall) | 786 (56.3%) | 610 (43.7%) |
Natural Resources, Construction and Maintenance Occupations
The most common Natural Resources, Construction and Maintenance occupations in Aurora County are Farming, Fishing & Forestry (111 | 8.0%), Installation, Maintenance & Repair (62 | 4.4%), and Construction & Extraction (28 | 2.0%).
Natural Resources, Construction and Maintenance Occupations by Sex
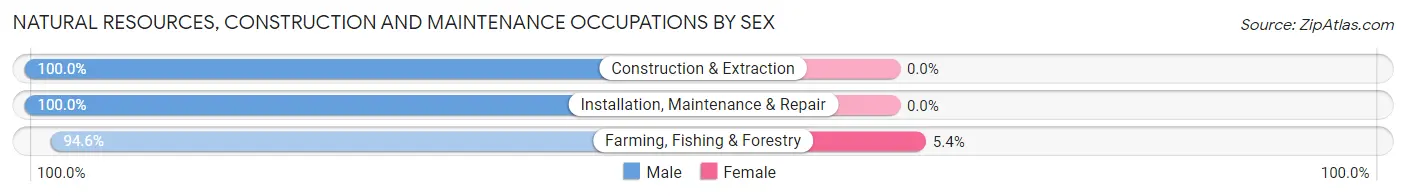
| Occupation | Male | Female |
| Farming, Fishing & Forestry | 105 (94.6%) | 6 (5.4%) |
| Construction & Extraction | 28 (100.0%) | 0 (0.0%) |
| Installation, Maintenance & Repair | 62 (100.0%) | 0 (0.0%) |
| Total (Category) | 195 (97.0%) | 6 (3.0%) |
| Total (Overall) | 786 (56.3%) | 610 (43.7%) |
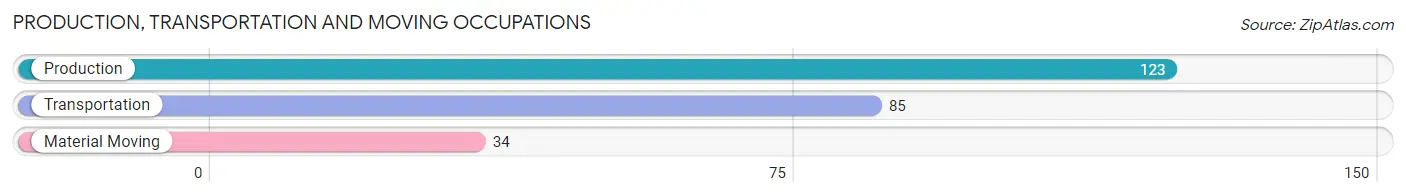
Production, Transportation and Moving Occupations
The most common Production, Transportation and Moving occupations in Aurora County are Production (123 | 8.8%), Transportation (85 | 6.1%), and Material Moving (34 | 2.4%).
Production, Transportation and Moving Occupations by Sex
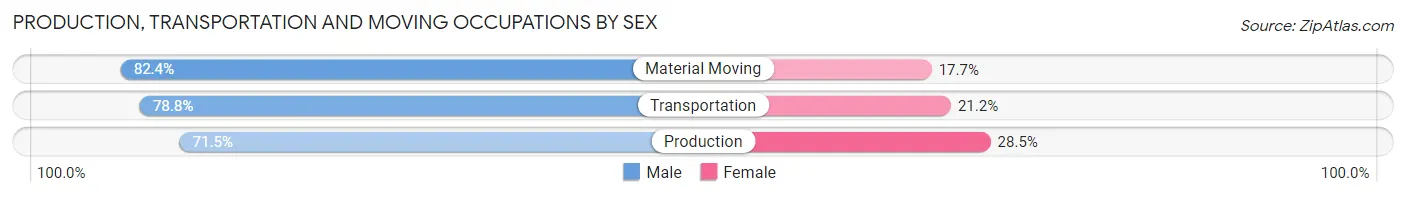
| Occupation | Male | Female |
| Production | 88 (71.5%) | 35 (28.5%) |
| Transportation | 67 (78.8%) | 18 (21.2%) |
| Material Moving | 28 (82.4%) | 6 (17.6%) |
| Total (Category) | 183 (75.6%) | 59 (24.4%) |
| Total (Overall) | 786 (56.3%) | 610 (43.7%) |
Employment Industries by Sex in Aurora County
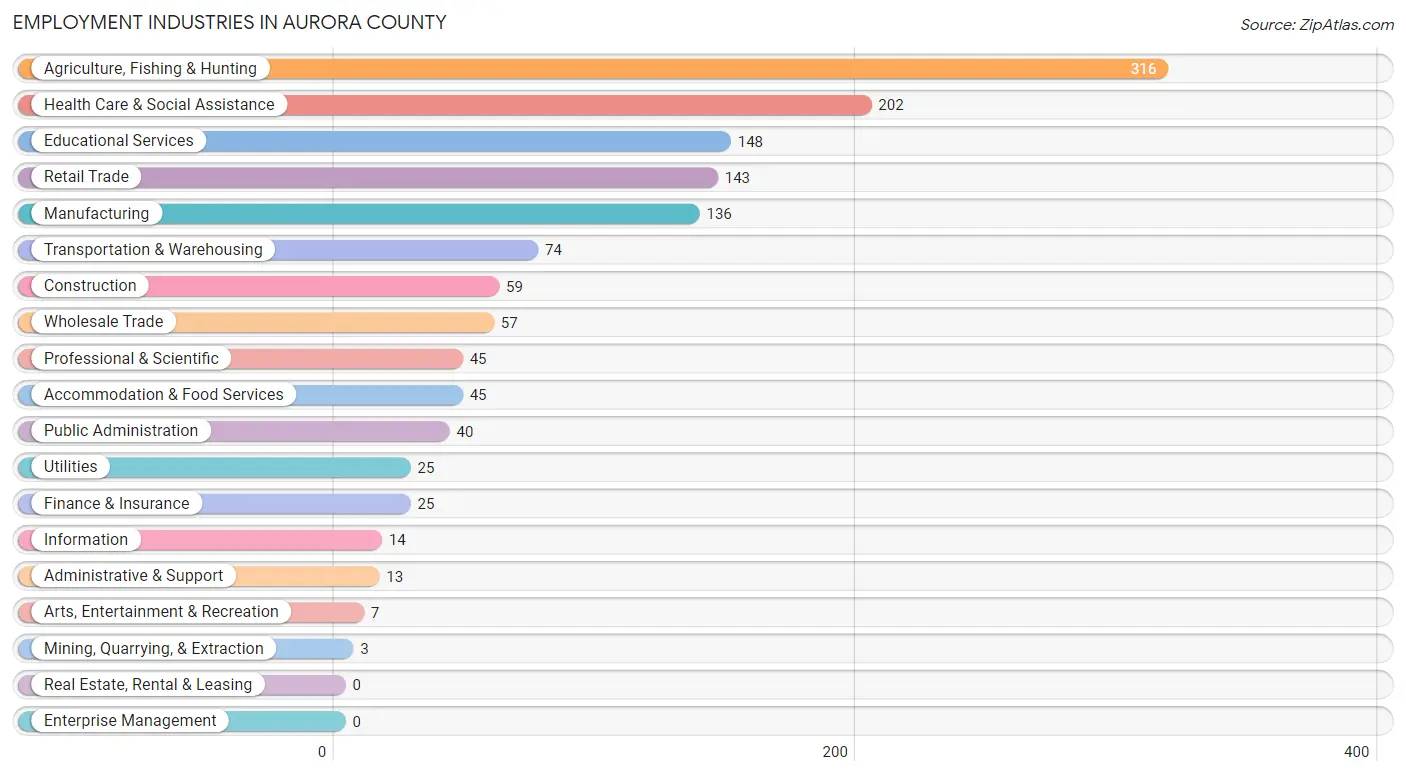
Employment Industries in Aurora County
The major employment industries in Aurora County include Agriculture, Fishing & Hunting (316 | 22.6%), Health Care & Social Assistance (202 | 14.5%), Educational Services (148 | 10.6%), Retail Trade (143 | 10.2%), and Manufacturing (136 | 9.7%).
Employment Industries by Sex in Aurora County
The Aurora County industries that see more men than women are Arts, Entertainment & Recreation (100.0%), Utilities (96.0%), and Agriculture, Fishing & Hunting (90.8%), whereas the industries that tend to have a higher number of women are Mining, Quarrying, & Extraction (100.0%), Public Administration (92.5%), and Educational Services (81.8%).
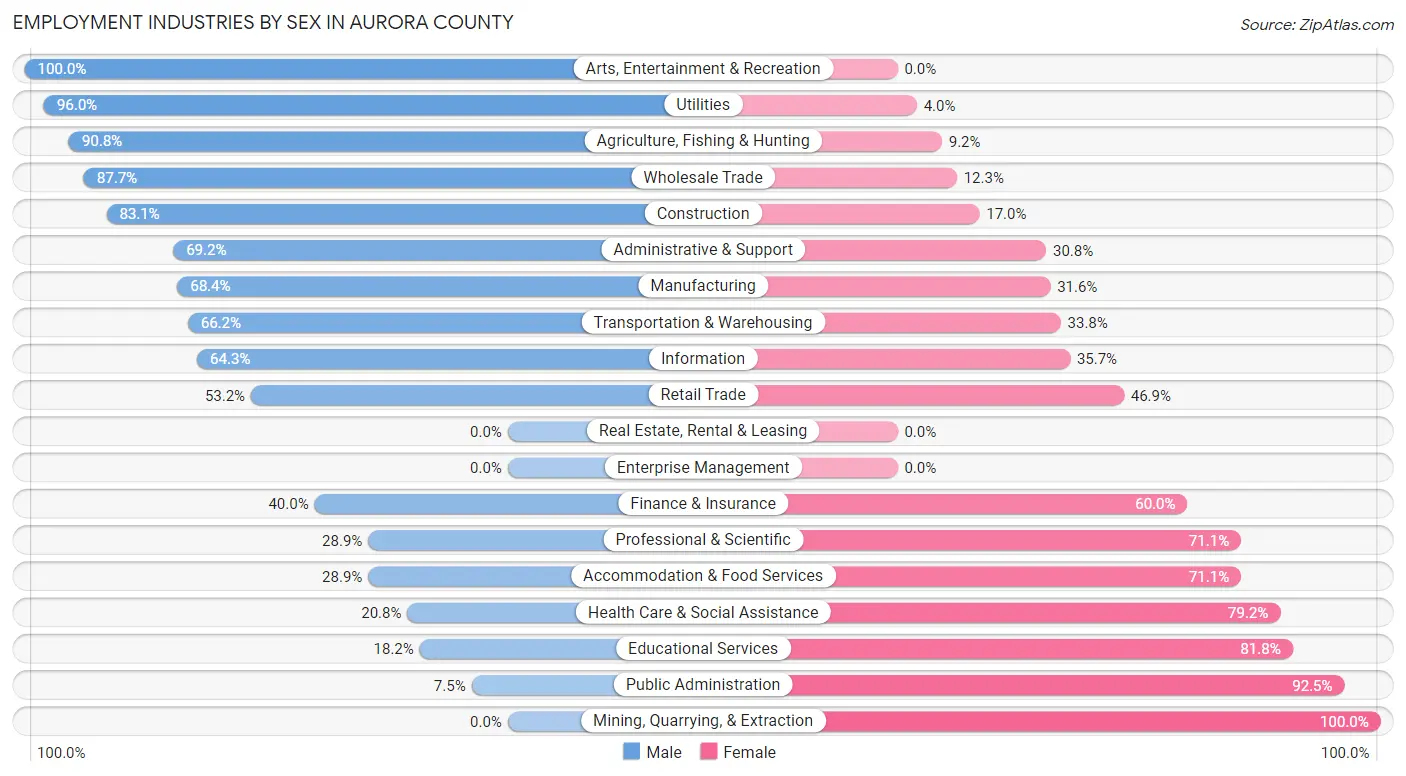
| Industry | Male | Female |
| Agriculture, Fishing & Hunting | 287 (90.8%) | 29 (9.2%) |
| Mining, Quarrying, & Extraction | 0 (0.0%) | 3 (100.0%) |
| Construction | 49 (83.1%) | 10 (17.0%) |
| Manufacturing | 93 (68.4%) | 43 (31.6%) |
| Wholesale Trade | 50 (87.7%) | 7 (12.3%) |
| Retail Trade | 76 (53.1%) | 67 (46.9%) |
| Transportation & Warehousing | 49 (66.2%) | 25 (33.8%) |
| Utilities | 24 (96.0%) | 1 (4.0%) |
| Information | 9 (64.3%) | 5 (35.7%) |
| Finance & Insurance | 10 (40.0%) | 15 (60.0%) |
| Real Estate, Rental & Leasing | 0 (0.0%) | 0 (0.0%) |
| Professional & Scientific | 13 (28.9%) | 32 (71.1%) |
| Enterprise Management | 0 (0.0%) | 0 (0.0%) |
| Administrative & Support | 9 (69.2%) | 4 (30.8%) |
| Educational Services | 27 (18.2%) | 121 (81.8%) |
| Health Care & Social Assistance | 42 (20.8%) | 160 (79.2%) |
| Arts, Entertainment & Recreation | 7 (100.0%) | 0 (0.0%) |
| Accommodation & Food Services | 13 (28.9%) | 32 (71.1%) |
| Public Administration | 3 (7.5%) | 37 (92.5%) |
| Total | 786 (56.3%) | 610 (43.7%) |
Education in Aurora County
School Enrollment in Aurora County
The most common levels of schooling among the 584 students in Aurora County are high school (172 | 29.4%), elementary school (155 | 26.5%), and middle school (137 | 23.5%).
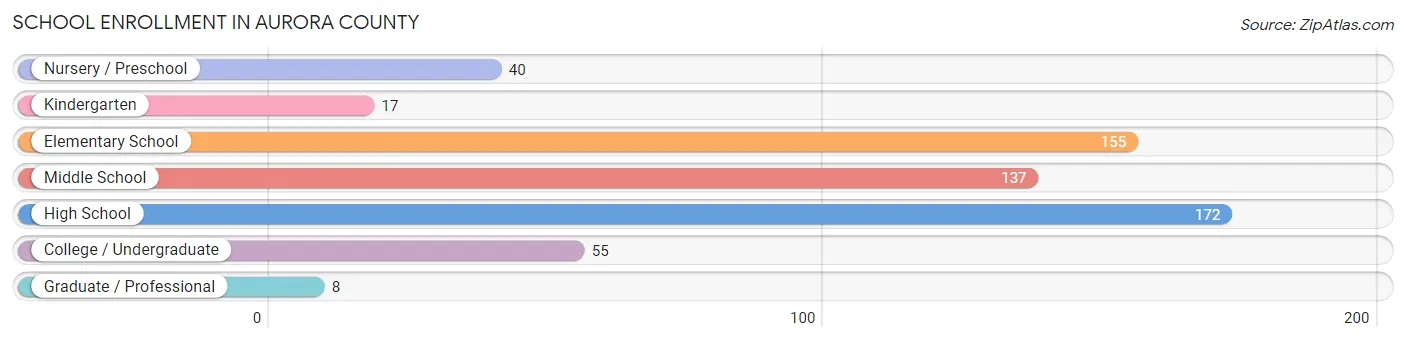
| School Level | # Students | % Students |
| Nursery / Preschool | 40 | 6.9% |
| Kindergarten | 17 | 2.9% |
| Elementary School | 155 | 26.5% |
| Middle School | 137 | 23.5% |
| High School | 172 | 29.4% |
| College / Undergraduate | 55 | 9.4% |
| Graduate / Professional | 8 | 1.4% |
| Total | 584 | 100.0% |
School Enrollment by Age by Funding Source in Aurora County
Out of a total of 584 students who are enrolled in schools in Aurora County, 46 (7.9%) attend a private institution, while the remaining 538 (92.1%) are enrolled in public schools. The age group of 20 to 24 year olds has the highest likelihood of being enrolled in private schools, with 11 (31.4% in the age bracket) enrolled. Conversely, the age group of 3 to 4 year olds has the lowest likelihood of being enrolled in a private school, with 23 (100.0% in the age bracket) attending a public institution.
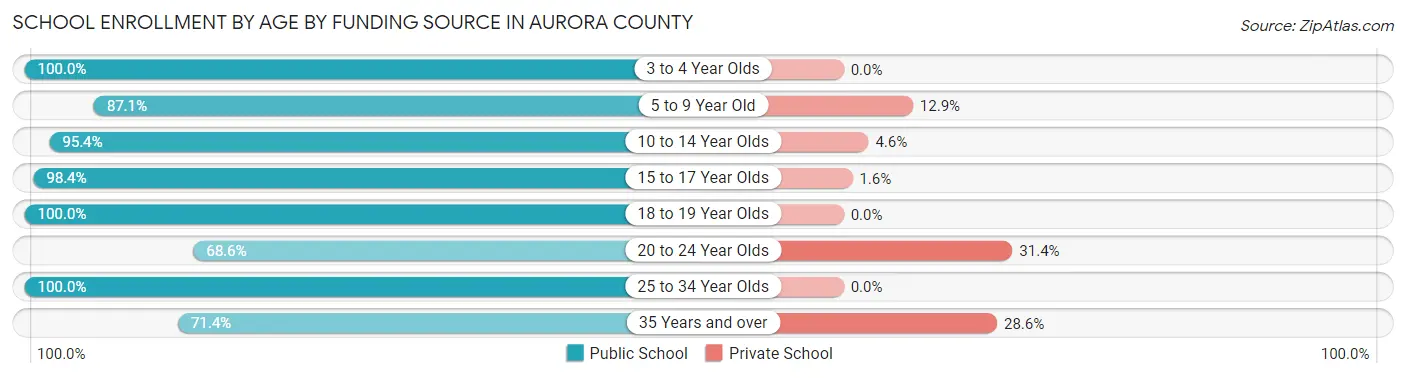
| Age Bracket | Public School | Private School |
| 3 to 4 Year Olds | 23 (100.0%) | 0 (0.0%) |
| 5 to 9 Year Old | 135 (87.1%) | 20 (12.9%) |
| 10 to 14 Year Olds | 186 (95.4%) | 9 (4.6%) |
| 15 to 17 Year Olds | 120 (98.4%) | 2 (1.6%) |
| 18 to 19 Year Olds | 37 (100.0%) | 0 (0.0%) |
| 20 to 24 Year Olds | 24 (68.6%) | 11 (31.4%) |
| 25 to 34 Year Olds | 3 (100.0%) | 0 (0.0%) |
| 35 Years and over | 10 (71.4%) | 4 (28.6%) |
| Total | 538 (92.1%) | 46 (7.9%) |
Educational Attainment by Field of Study in Aurora County
Education (85 | 26.2%), science & technology (75 | 23.1%), business (47 | 14.5%), arts & humanities (27 | 8.3%), and engineering (16 | 4.9%) are the most common fields of study among 325 individuals in Aurora County who have obtained a bachelor's degree or higher.
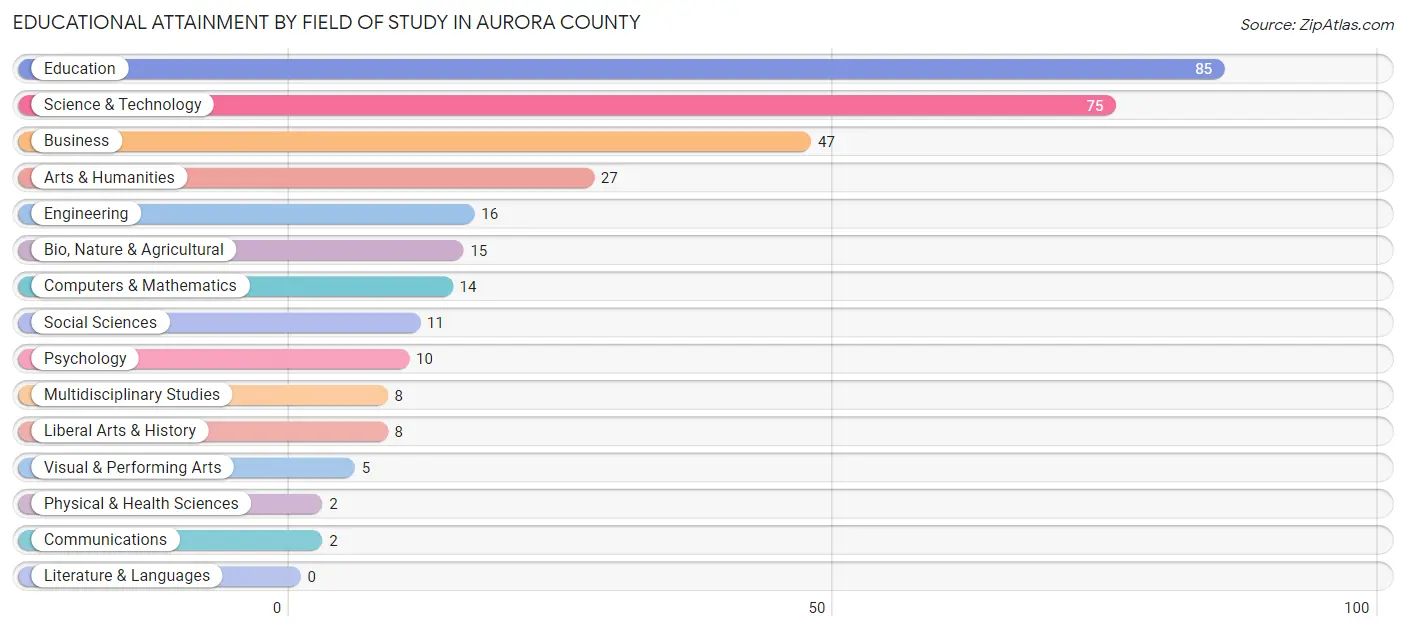
| Field of Study | # Graduates | % Graduates |
| Computers & Mathematics | 14 | 4.3% |
| Bio, Nature & Agricultural | 15 | 4.6% |
| Physical & Health Sciences | 2 | 0.6% |
| Psychology | 10 | 3.1% |
| Social Sciences | 11 | 3.4% |
| Engineering | 16 | 4.9% |
| Multidisciplinary Studies | 8 | 2.5% |
| Science & Technology | 75 | 23.1% |
| Business | 47 | 14.5% |
| Education | 85 | 26.2% |
| Literature & Languages | 0 | 0.0% |
| Liberal Arts & History | 8 | 2.5% |
| Visual & Performing Arts | 5 | 1.5% |
| Communications | 2 | 0.6% |
| Arts & Humanities | 27 | 8.3% |
| Total | 325 | 100.0% |
Transportation & Commute in Aurora County
Vehicle Availability by Sex in Aurora County
The most prevalent vehicle ownership categories in Aurora County are males with 3 vehicles (279, accounting for 35.5%) and females with 3 vehicles (185, making up 47.0%).
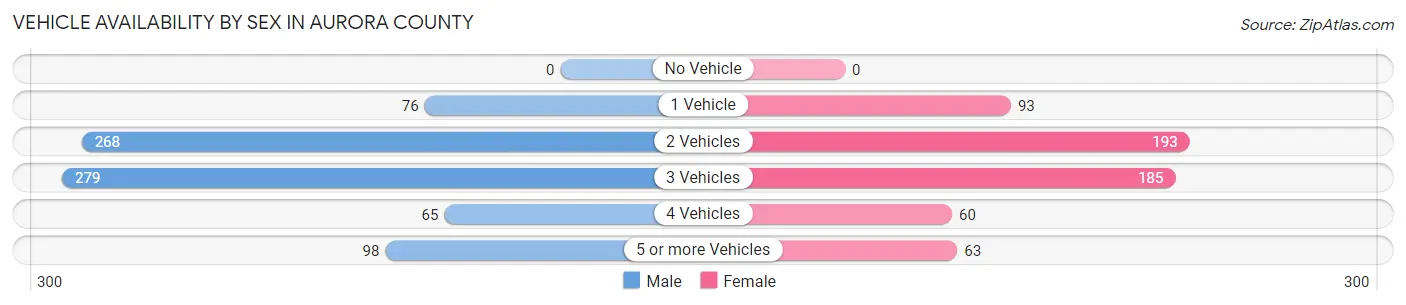
| Vehicles Available | Male | Female |
| No Vehicle | 0 (0.0%) | 0 (0.0%) |
| 1 Vehicle | 76 (9.7%) | 93 (15.7%) |
| 2 Vehicles | 268 (34.1%) | 193 (32.5%) |
| 3 Vehicles | 279 (35.5%) | 185 (31.1%) |
| 4 Vehicles | 65 (8.3%) | 60 (10.1%) |
| 5 or more Vehicles | 98 (12.5%) | 63 (10.6%) |
| Total | 786 (100.0%) | 594 (100.0%) |
Commute Time in Aurora County
The most frequently occuring commute durations in Aurora County are 5 to 9 minutes (241 commuters, 20.1%), 30 to 34 minutes (176 commuters, 14.6%), and 10 to 14 minutes (159 commuters, 13.2%).
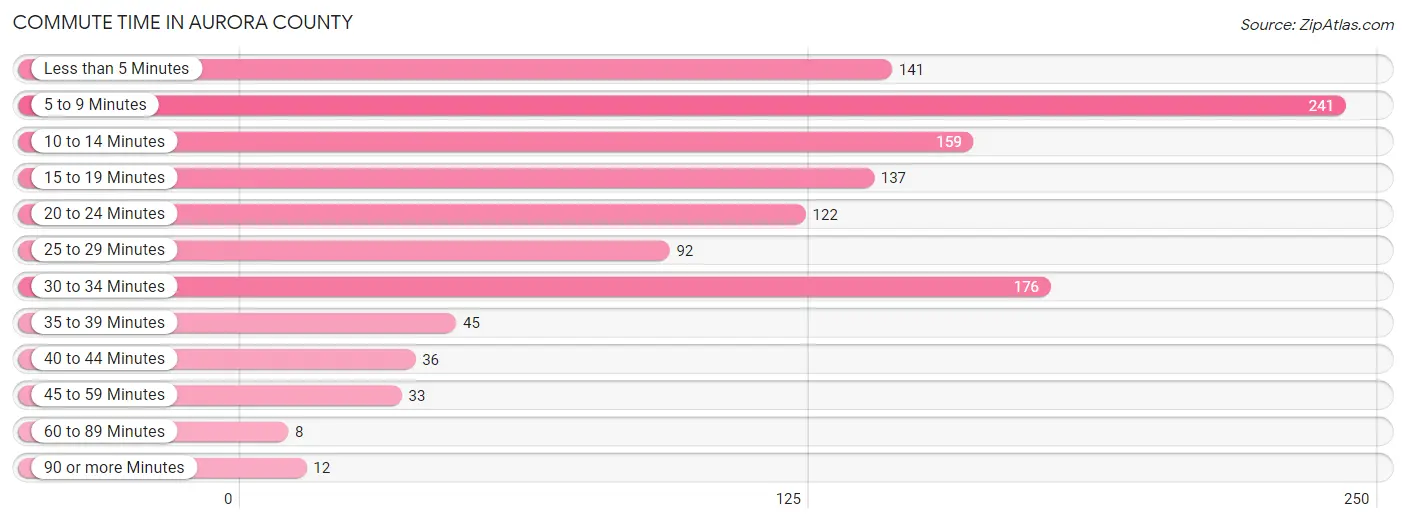
| Commute Time | # Commuters | % Commuters |
| Less than 5 Minutes | 141 | 11.7% |
| 5 to 9 Minutes | 241 | 20.1% |
| 10 to 14 Minutes | 159 | 13.2% |
| 15 to 19 Minutes | 137 | 11.4% |
| 20 to 24 Minutes | 122 | 10.2% |
| 25 to 29 Minutes | 92 | 7.6% |
| 30 to 34 Minutes | 176 | 14.6% |
| 35 to 39 Minutes | 45 | 3.7% |
| 40 to 44 Minutes | 36 | 3.0% |
| 45 to 59 Minutes | 33 | 2.8% |
| 60 to 89 Minutes | 8 | 0.7% |
| 90 or more Minutes | 12 | 1.0% |
Commute Time by Sex in Aurora County
The most common commute times in Aurora County are 5 to 9 minutes (154 commuters, 22.4%) for males and 5 to 9 minutes (87 commuters, 16.9%) for females.
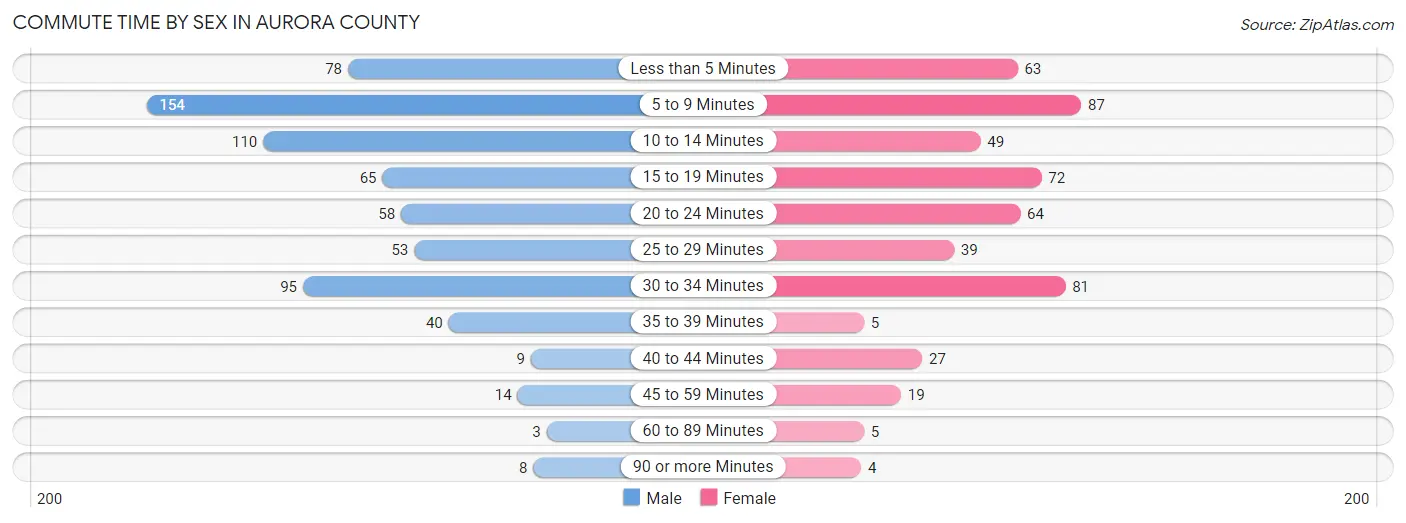
| Commute Time | Male | Female |
| Less than 5 Minutes | 78 (11.4%) | 63 (12.2%) |
| 5 to 9 Minutes | 154 (22.4%) | 87 (16.9%) |
| 10 to 14 Minutes | 110 (16.0%) | 49 (9.5%) |
| 15 to 19 Minutes | 65 (9.5%) | 72 (14.0%) |
| 20 to 24 Minutes | 58 (8.4%) | 64 (12.4%) |
| 25 to 29 Minutes | 53 (7.7%) | 39 (7.6%) |
| 30 to 34 Minutes | 95 (13.8%) | 81 (15.7%) |
| 35 to 39 Minutes | 40 (5.8%) | 5 (1.0%) |
| 40 to 44 Minutes | 9 (1.3%) | 27 (5.2%) |
| 45 to 59 Minutes | 14 (2.0%) | 19 (3.7%) |
| 60 to 89 Minutes | 3 (0.4%) | 5 (1.0%) |
| 90 or more Minutes | 8 (1.2%) | 4 (0.8%) |
Time of Departure to Work by Sex in Aurora County
The most frequent times of departure to work in Aurora County are 7:30 AM to 7:59 AM (134, 19.5%) for males and 7:30 AM to 7:59 AM (146, 28.3%) for females.
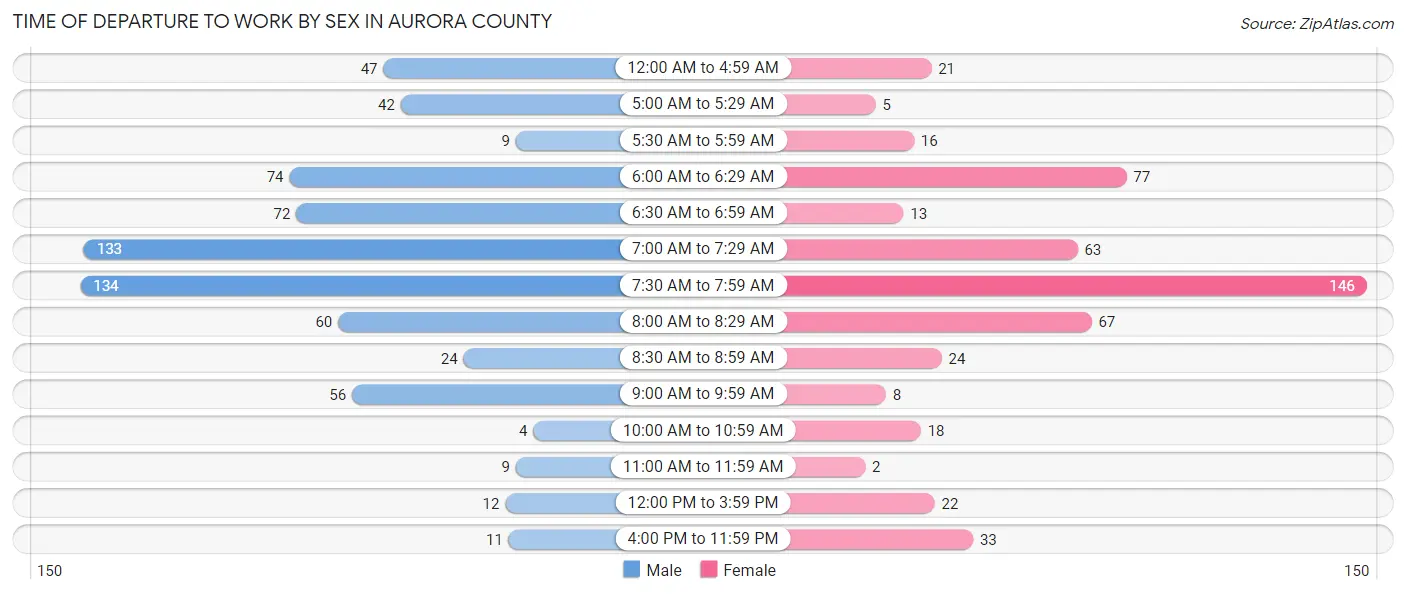
| Time of Departure | Male | Female |
| 12:00 AM to 4:59 AM | 47 (6.8%) | 21 (4.1%) |
| 5:00 AM to 5:29 AM | 42 (6.1%) | 5 (1.0%) |
| 5:30 AM to 5:59 AM | 9 (1.3%) | 16 (3.1%) |
| 6:00 AM to 6:29 AM | 74 (10.8%) | 77 (14.9%) |
| 6:30 AM to 6:59 AM | 72 (10.5%) | 13 (2.5%) |
| 7:00 AM to 7:29 AM | 133 (19.4%) | 63 (12.2%) |
| 7:30 AM to 7:59 AM | 134 (19.5%) | 146 (28.3%) |
| 8:00 AM to 8:29 AM | 60 (8.7%) | 67 (13.0%) |
| 8:30 AM to 8:59 AM | 24 (3.5%) | 24 (4.7%) |
| 9:00 AM to 9:59 AM | 56 (8.2%) | 8 (1.5%) |
| 10:00 AM to 10:59 AM | 4 (0.6%) | 18 (3.5%) |
| 11:00 AM to 11:59 AM | 9 (1.3%) | 2 (0.4%) |
| 12:00 PM to 3:59 PM | 12 (1.8%) | 22 (4.3%) |
| 4:00 PM to 11:59 PM | 11 (1.6%) | 33 (6.4%) |
| Total | 687 (100.0%) | 515 (100.0%) |
Housing Occupancy in Aurora County
Occupancy by Ownership in Aurora County
Of the total 1,053 dwellings in Aurora County, owner-occupied units account for 807 (76.6%), while renter-occupied units make up 246 (23.4%).
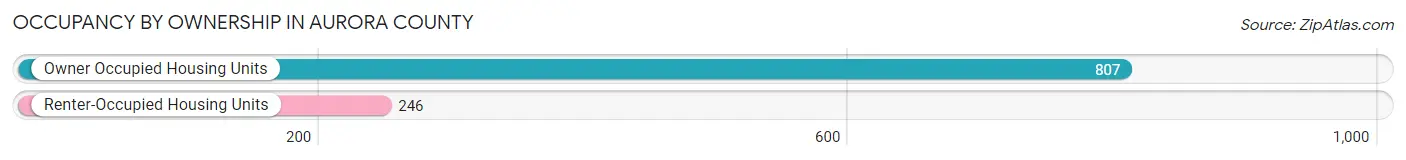
| Occupancy | # Housing Units | % Housing Units |
| Owner Occupied Housing Units | 807 | 76.6% |
| Renter-Occupied Housing Units | 246 | 23.4% |
| Total Occupied Housing Units | 1,053 | 100.0% |
Occupancy by Household Size in Aurora County
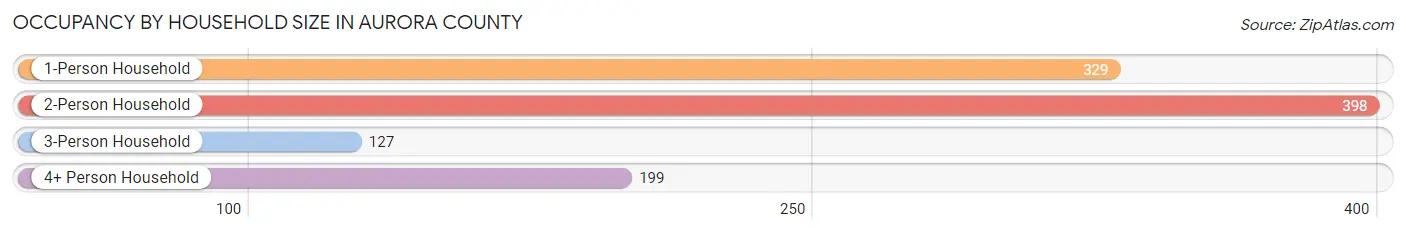
| Household Size | # Housing Units | % Housing Units |
| 1-Person Household | 329 | 31.2% |
| 2-Person Household | 398 | 37.8% |
| 3-Person Household | 127 | 12.1% |
| 4+ Person Household | 199 | 18.9% |
| Total Housing Units | 1,053 | 100.0% |
Occupancy by Ownership by Household Size in Aurora County
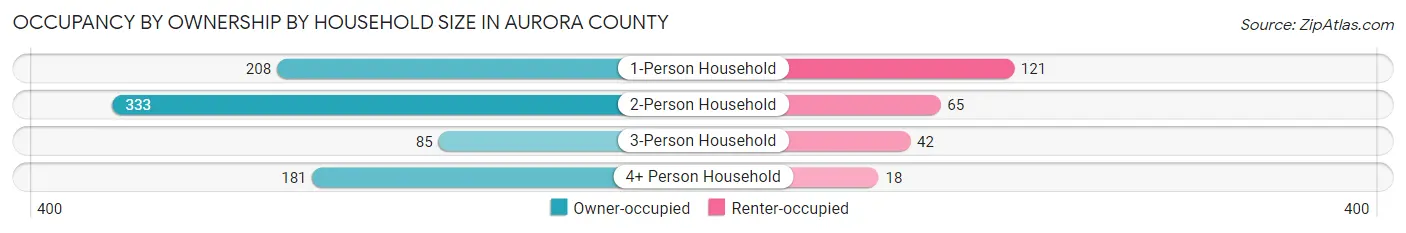
| Household Size | Owner-occupied | Renter-occupied |
| 1-Person Household | 208 (63.2%) | 121 (36.8%) |
| 2-Person Household | 333 (83.7%) | 65 (16.3%) |
| 3-Person Household | 85 (66.9%) | 42 (33.1%) |
| 4+ Person Household | 181 (90.9%) | 18 (9.0%) |
| Total Housing Units | 807 (76.6%) | 246 (23.4%) |
Occupancy by Educational Attainment in Aurora County
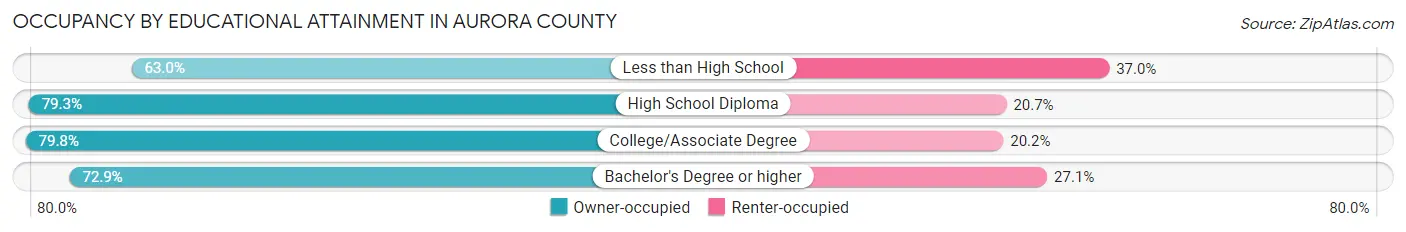
| Household Size | Owner-occupied | Renter-occupied |
| Less than High School | 58 (63.0%) | 34 (37.0%) |
| High School Diploma | 288 (79.3%) | 75 (20.7%) |
| College/Associate Degree | 289 (79.8%) | 73 (20.2%) |
| Bachelor's Degree or higher | 172 (72.9%) | 64 (27.1%) |
Occupancy by Age of Householder in Aurora County
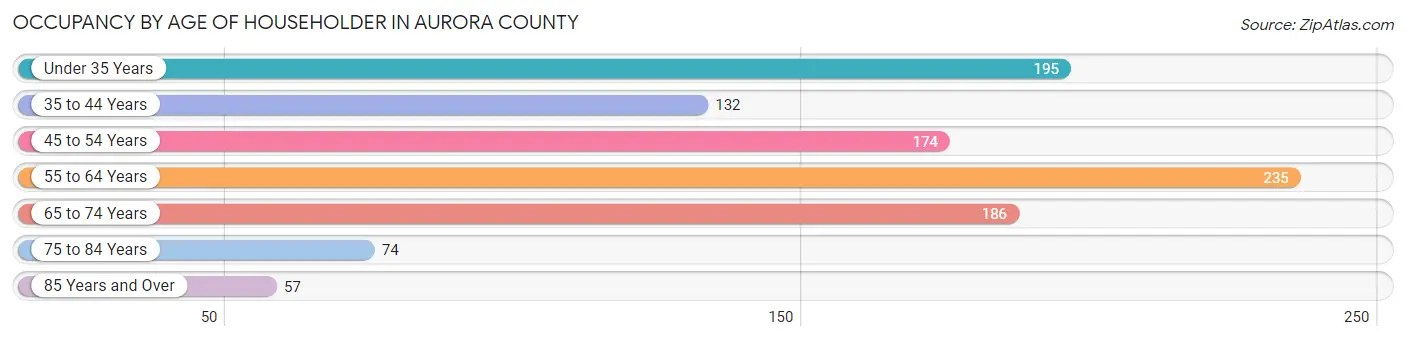
| Age Bracket | # Households | % Households |
| Under 35 Years | 195 | 18.5% |
| 35 to 44 Years | 132 | 12.5% |
| 45 to 54 Years | 174 | 16.5% |
| 55 to 64 Years | 235 | 22.3% |
| 65 to 74 Years | 186 | 17.7% |
| 75 to 84 Years | 74 | 7.0% |
| 85 Years and Over | 57 | 5.4% |
| Total | 1,053 | 100.0% |
Housing Finances in Aurora County
Median Income by Occupancy in Aurora County
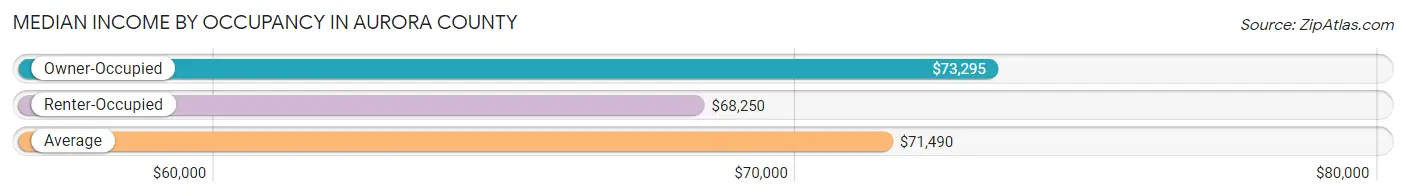
| Occupancy Type | # Households | Median Income |
| Owner-Occupied | 807 (76.6%) | $73,295 |
| Renter-Occupied | 246 (23.4%) | $68,250 |
| Average | 1,053 (100.0%) | $71,490 |
Occupancy by Householder Income Bracket in Aurora County
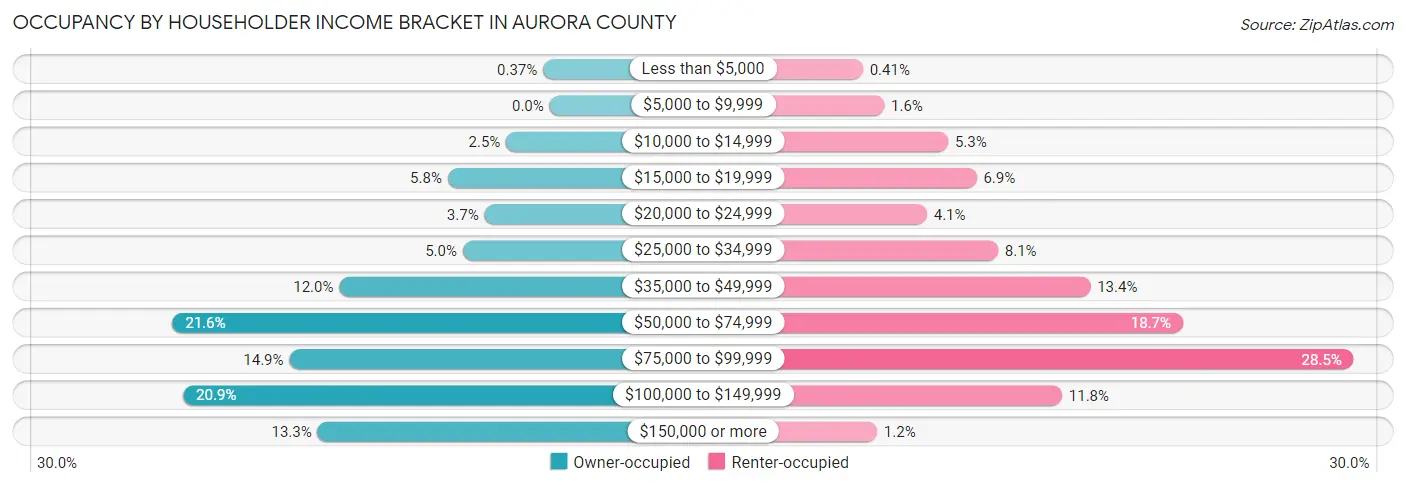
| Income Bracket | Owner-occupied | Renter-occupied |
| Less than $5,000 | 3 (0.4%) | 1 (0.4%) |
| $5,000 to $9,999 | 0 (0.0%) | 4 (1.6%) |
| $10,000 to $14,999 | 20 (2.5%) | 13 (5.3%) |
| $15,000 to $19,999 | 47 (5.8%) | 17 (6.9%) |
| $20,000 to $24,999 | 30 (3.7%) | 10 (4.1%) |
| $25,000 to $34,999 | 40 (5.0%) | 20 (8.1%) |
| $35,000 to $49,999 | 97 (12.0%) | 33 (13.4%) |
| $50,000 to $74,999 | 174 (21.6%) | 46 (18.7%) |
| $75,000 to $99,999 | 120 (14.9%) | 70 (28.5%) |
| $100,000 to $149,999 | 169 (20.9%) | 29 (11.8%) |
| $150,000 or more | 107 (13.3%) | 3 (1.2%) |
| Total | 807 (100.0%) | 246 (100.0%) |
Monthly Housing Cost Tiers in Aurora County
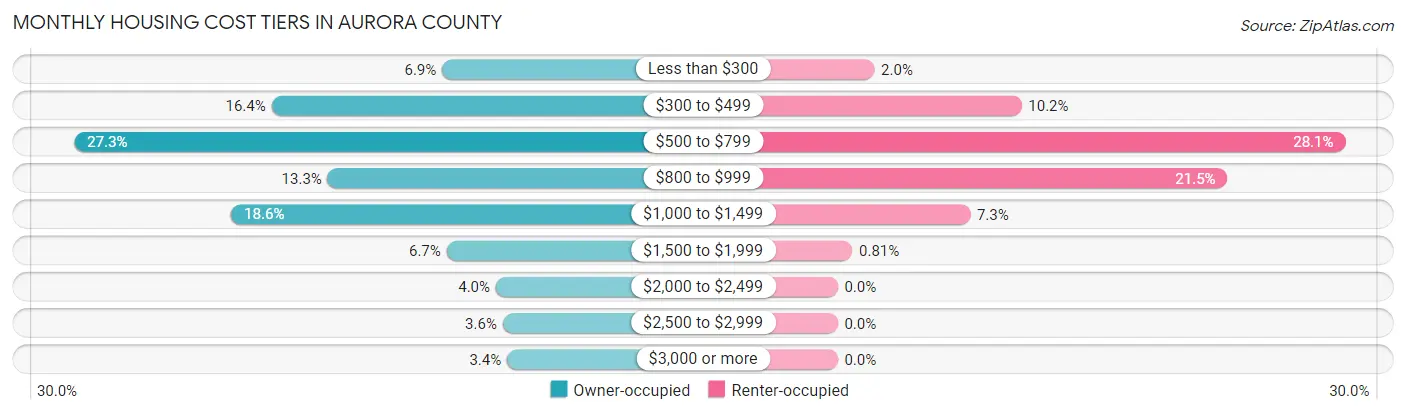
| Monthly Cost | Owner-occupied | Renter-occupied |
| Less than $300 | 56 (6.9%) | 5 (2.0%) |
| $300 to $499 | 132 (16.4%) | 25 (10.2%) |
| $500 to $799 | 220 (27.3%) | 69 (28.1%) |
| $800 to $999 | 107 (13.3%) | 53 (21.5%) |
| $1,000 to $1,499 | 150 (18.6%) | 18 (7.3%) |
| $1,500 to $1,999 | 54 (6.7%) | 2 (0.8%) |
| $2,000 to $2,499 | 32 (4.0%) | 0 (0.0%) |
| $2,500 to $2,999 | 29 (3.6%) | 0 (0.0%) |
| $3,000 or more | 27 (3.4%) | 0 (0.0%) |
| Total | 807 (100.0%) | 246 (100.0%) |
Physical Housing Characteristics in Aurora County
Housing Structures in Aurora County
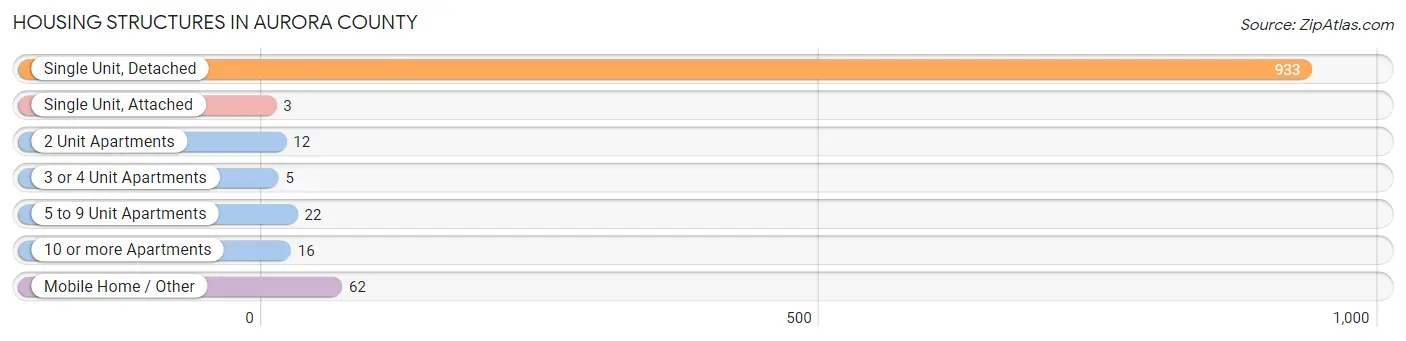
| Structure Type | # Housing Units | % Housing Units |
| Single Unit, Detached | 933 | 88.6% |
| Single Unit, Attached | 3 | 0.3% |
| 2 Unit Apartments | 12 | 1.1% |
| 3 or 4 Unit Apartments | 5 | 0.5% |
| 5 to 9 Unit Apartments | 22 | 2.1% |
| 10 or more Apartments | 16 | 1.5% |
| Mobile Home / Other | 62 | 5.9% |
| Total | 1,053 | 100.0% |
Housing Structures by Occupancy in Aurora County
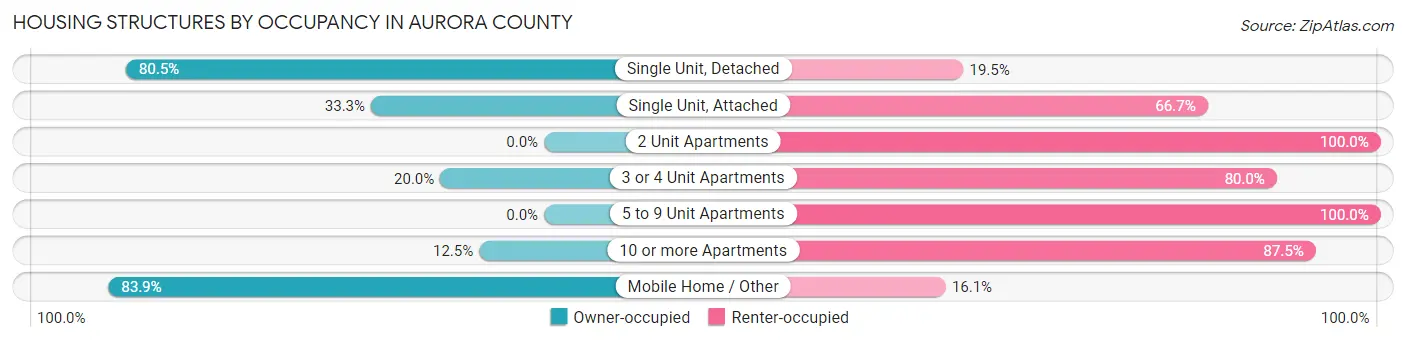
| Structure Type | Owner-occupied | Renter-occupied |
| Single Unit, Detached | 751 (80.5%) | 182 (19.5%) |
| Single Unit, Attached | 1 (33.3%) | 2 (66.7%) |
| 2 Unit Apartments | 0 (0.0%) | 12 (100.0%) |
| 3 or 4 Unit Apartments | 1 (20.0%) | 4 (80.0%) |
| 5 to 9 Unit Apartments | 0 (0.0%) | 22 (100.0%) |
| 10 or more Apartments | 2 (12.5%) | 14 (87.5%) |
| Mobile Home / Other | 52 (83.9%) | 10 (16.1%) |
| Total | 807 (76.6%) | 246 (23.4%) |
Housing Structures by Number of Rooms in Aurora County
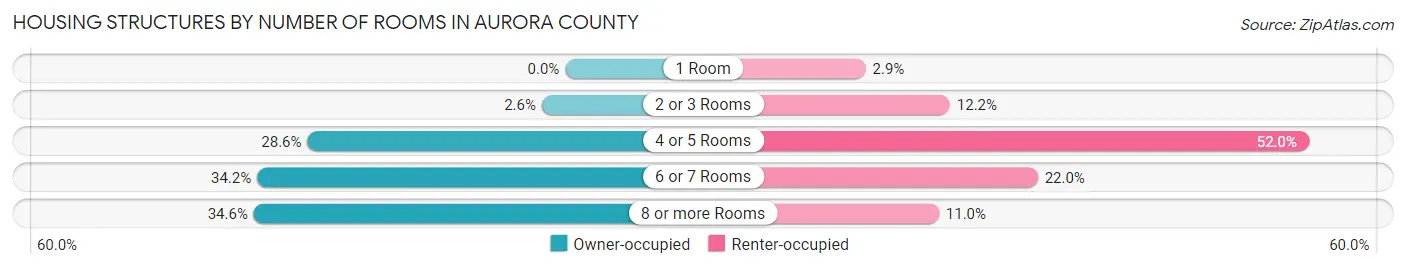
| Number of Rooms | Owner-occupied | Renter-occupied |
| 1 Room | 0 (0.0%) | 7 (2.9%) |
| 2 or 3 Rooms | 21 (2.6%) | 30 (12.2%) |
| 4 or 5 Rooms | 231 (28.6%) | 128 (52.0%) |
| 6 or 7 Rooms | 276 (34.2%) | 54 (22.0%) |
| 8 or more Rooms | 279 (34.6%) | 27 (11.0%) |
| Total | 807 (100.0%) | 246 (100.0%) |
Housing Structure by Heating Type in Aurora County
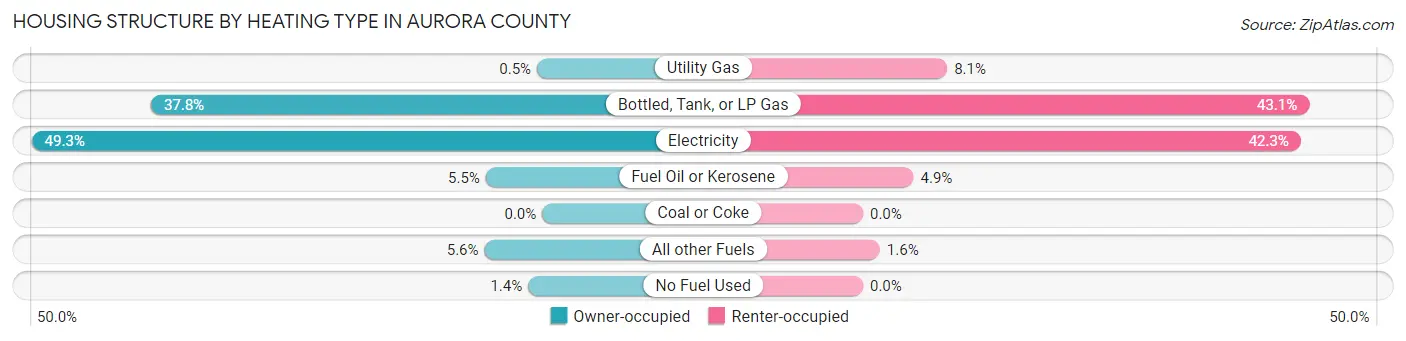
| Heating Type | Owner-occupied | Renter-occupied |
| Utility Gas | 4 (0.5%) | 20 (8.1%) |
| Bottled, Tank, or LP Gas | 305 (37.8%) | 106 (43.1%) |
| Electricity | 398 (49.3%) | 104 (42.3%) |
| Fuel Oil or Kerosene | 44 (5.4%) | 12 (4.9%) |
| Coal or Coke | 0 (0.0%) | 0 (0.0%) |
| All other Fuels | 45 (5.6%) | 4 (1.6%) |
| No Fuel Used | 11 (1.4%) | 0 (0.0%) |
| Total | 807 (100.0%) | 246 (100.0%) |
Household Vehicle Usage in Aurora County
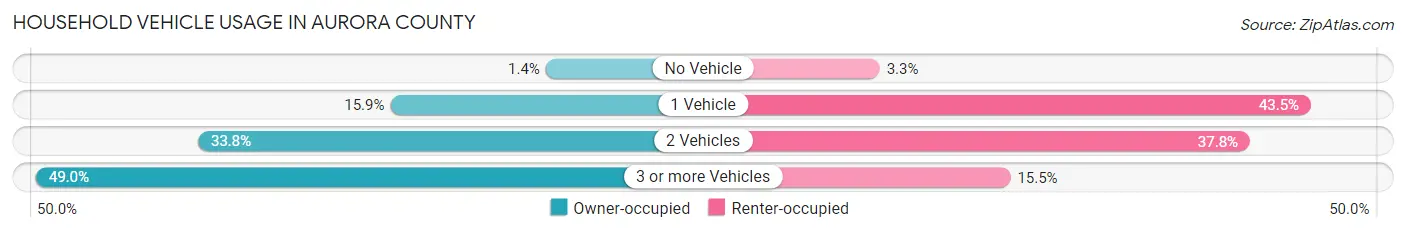
| Vehicles per Household | Owner-occupied | Renter-occupied |
| No Vehicle | 11 (1.4%) | 8 (3.3%) |
| 1 Vehicle | 128 (15.9%) | 107 (43.5%) |
| 2 Vehicles | 273 (33.8%) | 93 (37.8%) |
| 3 or more Vehicles | 395 (48.9%) | 38 (15.4%) |
| Total | 807 (100.0%) | 246 (100.0%) |
Real Estate & Mortgages in Aurora County
Real Estate and Mortgage Overview in Aurora County
| Characteristic | Without Mortgage | With Mortgage |
| Housing Units | 476 | 331 |
| Median Property Value | $107,600 | $145,400 |
| Median Household Income | $63,000 | $75 |
| Monthly Housing Costs | $566 | $25 |
| Real Estate Taxes | $1,303 | $1 |
Property Value by Mortgage Status in Aurora County
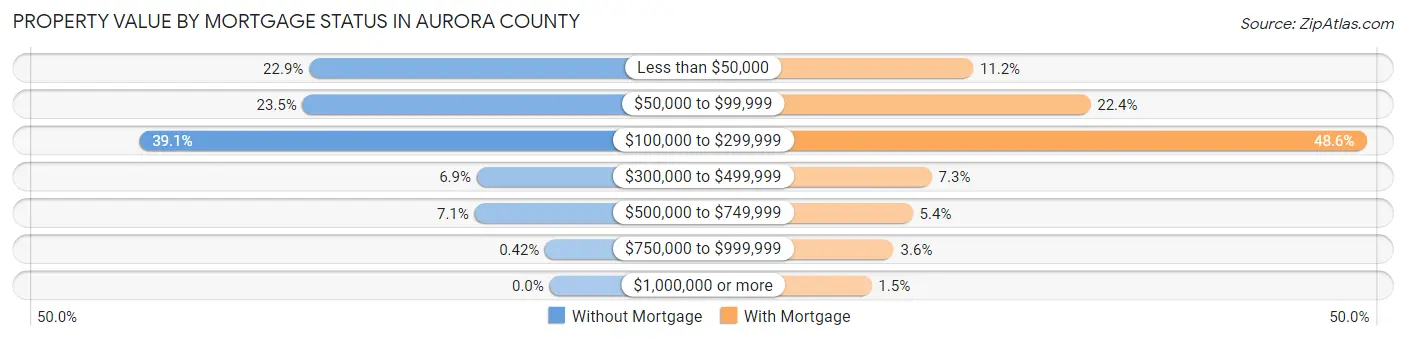
| Property Value | Without Mortgage | With Mortgage |
| Less than $50,000 | 109 (22.9%) | 37 (11.2%) |
| $50,000 to $99,999 | 112 (23.5%) | 74 (22.4%) |
| $100,000 to $299,999 | 186 (39.1%) | 161 (48.6%) |
| $300,000 to $499,999 | 33 (6.9%) | 24 (7.2%) |
| $500,000 to $749,999 | 34 (7.1%) | 18 (5.4%) |
| $750,000 to $999,999 | 2 (0.4%) | 12 (3.6%) |
| $1,000,000 or more | 0 (0.0%) | 5 (1.5%) |
| Total | 476 (100.0%) | 331 (100.0%) |
Household Income by Mortgage Status in Aurora County
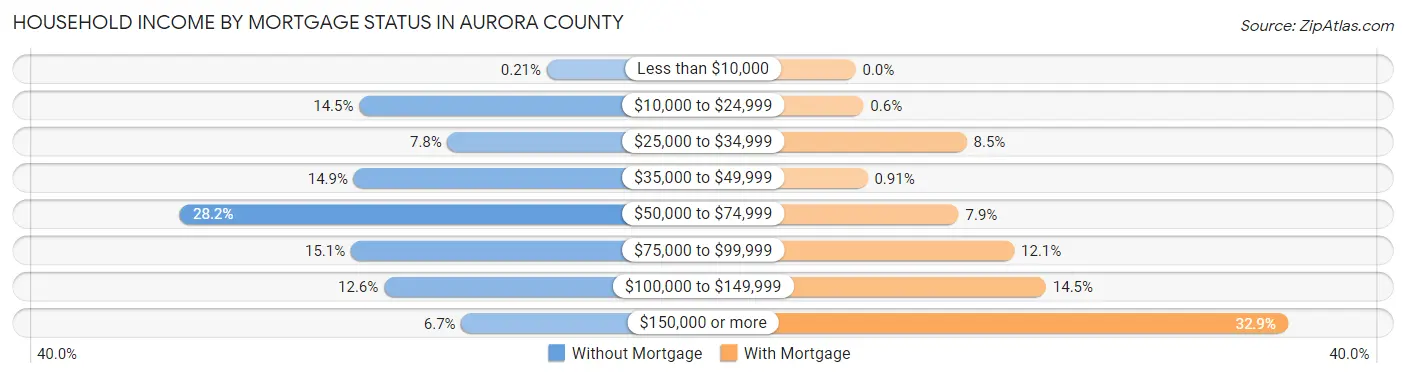
| Household Income | Without Mortgage | With Mortgage |
| Less than $10,000 | 1 (0.2%) | 0 (0.0%) |
| $10,000 to $24,999 | 69 (14.5%) | 2 (0.6%) |
| $25,000 to $34,999 | 37 (7.8%) | 28 (8.5%) |
| $35,000 to $49,999 | 71 (14.9%) | 3 (0.9%) |
| $50,000 to $74,999 | 134 (28.1%) | 26 (7.9%) |
| $75,000 to $99,999 | 72 (15.1%) | 40 (12.1%) |
| $100,000 to $149,999 | 60 (12.6%) | 48 (14.5%) |
| $150,000 or more | 32 (6.7%) | 109 (32.9%) |
| Total | 476 (100.0%) | 331 (100.0%) |
Property Value to Household Income Ratio in Aurora County
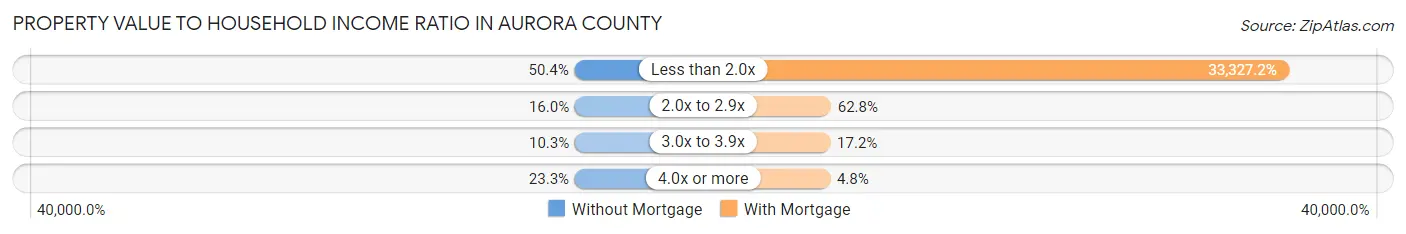
| Value-to-Income Ratio | Without Mortgage | With Mortgage |
| Less than 2.0x | 240 (50.4%) | 110,313 (33,327.2%) |
| 2.0x to 2.9x | 76 (16.0%) | 208 (62.8%) |
| 3.0x to 3.9x | 49 (10.3%) | 57 (17.2%) |
| 4.0x or more | 111 (23.3%) | 16 (4.8%) |
| Total | 476 (100.0%) | 331 (100.0%) |
Real Estate Taxes by Mortgage Status in Aurora County
| Property Taxes | Without Mortgage | With Mortgage |
| Less than $800 | 120 (25.2%) | 0 (0.0%) |
| $800 to $1,499 | 150 (31.5%) | 44 (13.3%) |
| $800 to $1,499 | 180 (37.8%) | 125 (37.8%) |
| Total | 476 (100.0%) | 331 (100.0%) |
Health & Disability in Aurora County
Health Insurance Coverage by Age in Aurora County
| Age Bracket | With Coverage | Without Coverage |
| Under 6 Years | 172 (86.4%) | 27 (13.6%) |
| 6 to 18 Years | 436 (98.6%) | 6 (1.4%) |
| 19 to 25 Years | 158 (80.2%) | 39 (19.8%) |
| 26 to 34 Years | 211 (88.3%) | 28 (11.7%) |
| 35 to 44 Years | 291 (96.4%) | 11 (3.6%) |
| 45 to 54 Years | 265 (90.7%) | 27 (9.2%) |
| 55 to 64 Years | 329 (90.6%) | 34 (9.4%) |
| 65 to 74 Years | 276 (100.0%) | 0 (0.0%) |
| 75 Years and older | 182 (100.0%) | 0 (0.0%) |
| Total | 2,320 (93.1%) | 172 (6.9%) |
Health Insurance Coverage by Citizenship Status in Aurora County
| Citizenship Status | With Coverage | Without Coverage |
| Native Born | 172 (86.4%) | 27 (13.6%) |
| Foreign Born, Citizen | 436 (98.6%) | 6 (1.4%) |
| Foreign Born, not a Citizen | 158 (80.2%) | 39 (19.8%) |
Health Insurance Coverage by Household Income in Aurora County
| Household Income | With Coverage | Without Coverage |
| Under $25,000 | 181 (88.3%) | 24 (11.7%) |
| $25,000 to $49,999 | 267 (92.4%) | 22 (7.6%) |
| $50,000 to $74,999 | 420 (88.6%) | 54 (11.4%) |
| $75,000 to $99,999 | 436 (98.6%) | 6 (1.4%) |
| $100,000 and over | 1,009 (94.6%) | 58 (5.4%) |
Public vs Private Health Insurance Coverage by Age in Aurora County
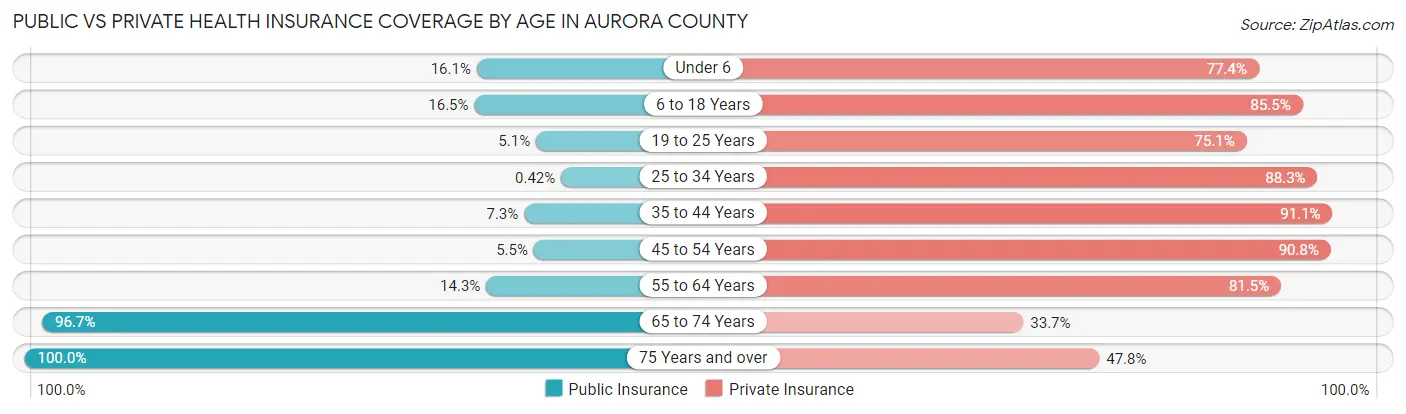
| Age Bracket | Public Insurance | Private Insurance |
| Under 6 | 32 (16.1%) | 154 (77.4%) |
| 6 to 18 Years | 73 (16.5%) | 378 (85.5%) |
| 19 to 25 Years | 10 (5.1%) | 148 (75.1%) |
| 25 to 34 Years | 1 (0.4%) | 211 (88.3%) |
| 35 to 44 Years | 22 (7.3%) | 275 (91.1%) |
| 45 to 54 Years | 16 (5.5%) | 265 (90.7%) |
| 55 to 64 Years | 52 (14.3%) | 296 (81.5%) |
| 65 to 74 Years | 267 (96.7%) | 93 (33.7%) |
| 75 Years and over | 182 (100.0%) | 87 (47.8%) |
| Total | 655 (26.3%) | 1,907 (76.5%) |
Disability Status by Sex by Age in Aurora County
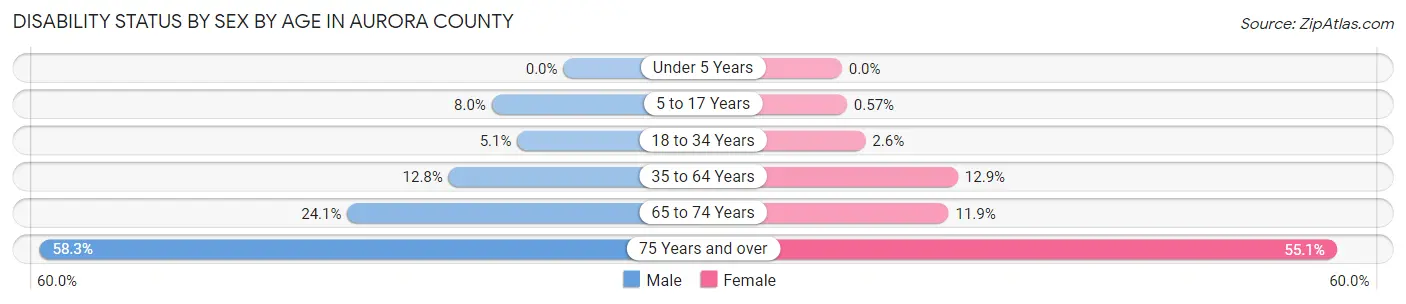
| Age Bracket | Male | Female |
| Under 5 Years | 0 (0.0%) | 0 (0.0%) |
| 5 to 17 Years | 21 (8.0%) | 1 (0.6%) |
| 18 to 34 Years | 14 (5.1%) | 5 (2.6%) |
| 35 to 64 Years | 63 (12.8%) | 60 (12.9%) |
| 65 to 74 Years | 32 (24.1%) | 17 (11.9%) |
| 75 Years and over | 49 (58.3%) | 54 (55.1%) |
Disability Class by Sex by Age in Aurora County
Disability Class: Hearing Difficulty
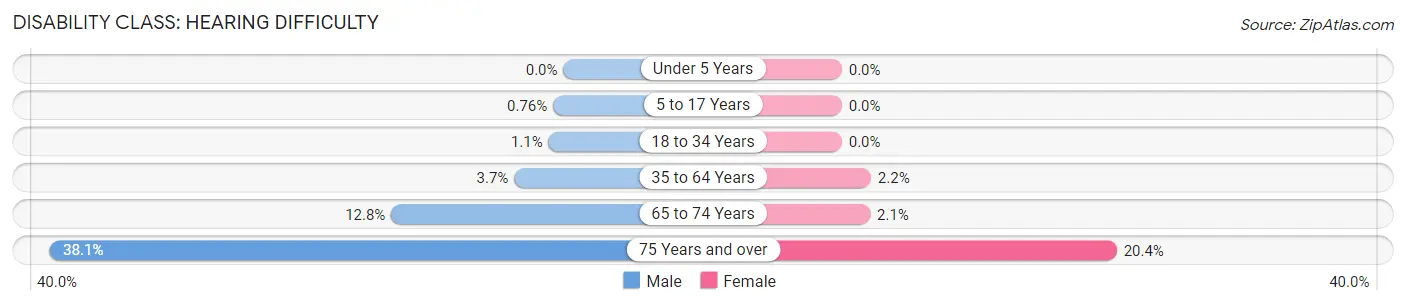
| Age Bracket | Male | Female |
| Under 5 Years | 0 (0.0%) | 0 (0.0%) |
| 5 to 17 Years | 2 (0.8%) | 0 (0.0%) |
| 18 to 34 Years | 3 (1.1%) | 0 (0.0%) |
| 35 to 64 Years | 18 (3.6%) | 10 (2.2%) |
| 65 to 74 Years | 17 (12.8%) | 3 (2.1%) |
| 75 Years and over | 32 (38.1%) | 20 (20.4%) |
Disability Class: Vision Difficulty
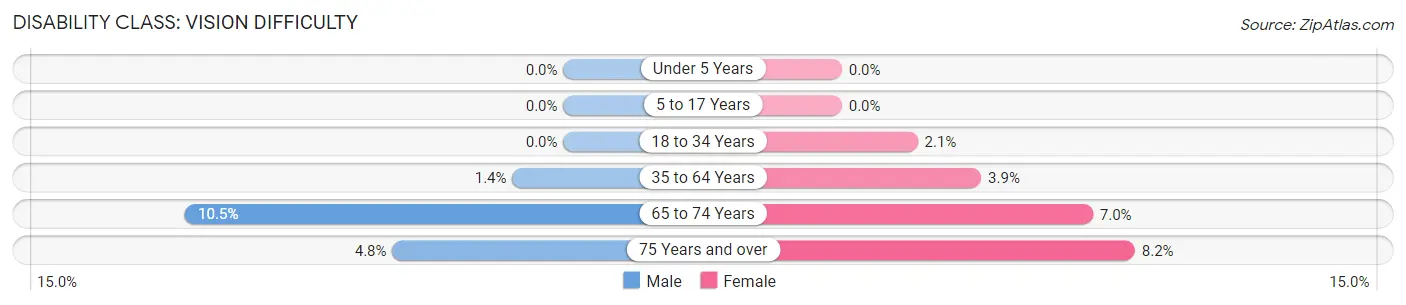
| Age Bracket | Male | Female |
| Under 5 Years | 0 (0.0%) | 0 (0.0%) |
| 5 to 17 Years | 0 (0.0%) | 0 (0.0%) |
| 18 to 34 Years | 0 (0.0%) | 4 (2.1%) |
| 35 to 64 Years | 7 (1.4%) | 18 (3.9%) |
| 65 to 74 Years | 14 (10.5%) | 10 (7.0%) |
| 75 Years and over | 4 (4.8%) | 8 (8.2%) |
Disability Class: Cognitive Difficulty
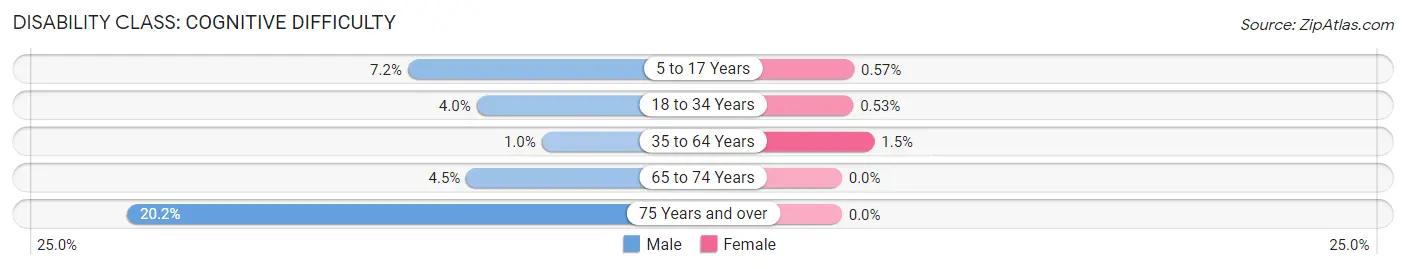
| Age Bracket | Male | Female |
| 5 to 17 Years | 19 (7.2%) | 1 (0.6%) |
| 18 to 34 Years | 11 (4.0%) | 1 (0.5%) |
| 35 to 64 Years | 5 (1.0%) | 7 (1.5%) |
| 65 to 74 Years | 6 (4.5%) | 0 (0.0%) |
| 75 Years and over | 17 (20.2%) | 0 (0.0%) |
Disability Class: Ambulatory Difficulty
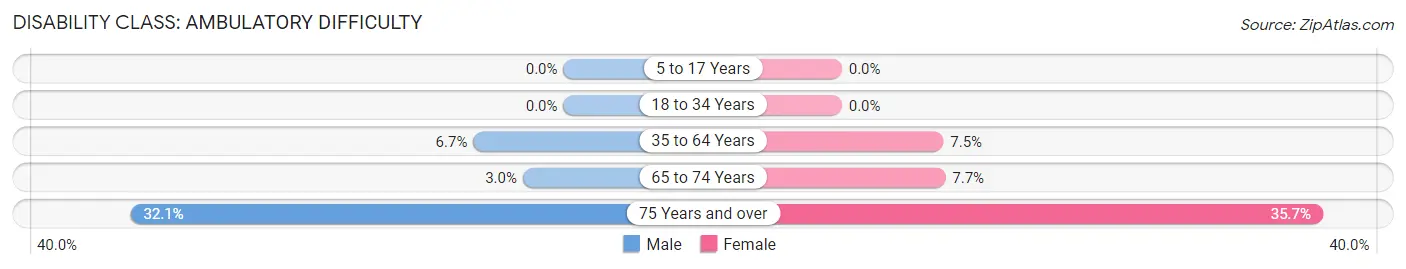
| Age Bracket | Male | Female |
| 5 to 17 Years | 0 (0.0%) | 0 (0.0%) |
| 18 to 34 Years | 0 (0.0%) | 0 (0.0%) |
| 35 to 64 Years | 33 (6.7%) | 35 (7.5%) |
| 65 to 74 Years | 4 (3.0%) | 11 (7.7%) |
| 75 Years and over | 27 (32.1%) | 35 (35.7%) |
Disability Class: Self-Care Difficulty
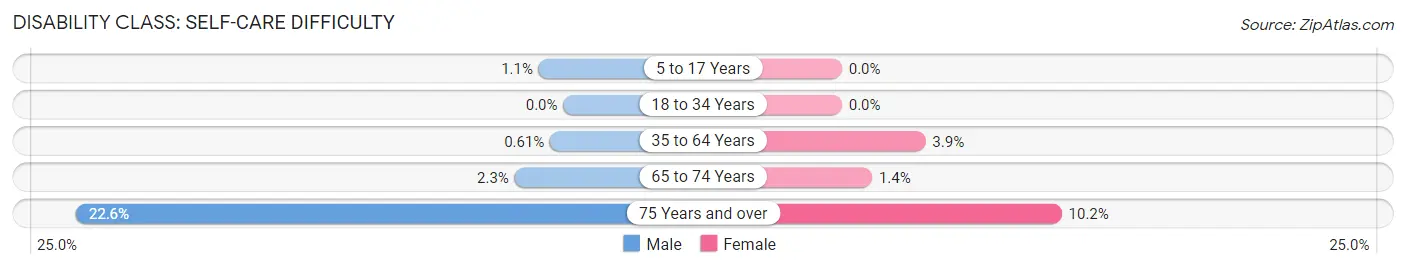
| Age Bracket | Male | Female |
| 5 to 17 Years | 3 (1.1%) | 0 (0.0%) |
| 18 to 34 Years | 0 (0.0%) | 0 (0.0%) |
| 35 to 64 Years | 3 (0.6%) | 18 (3.9%) |
| 65 to 74 Years | 3 (2.3%) | 2 (1.4%) |
| 75 Years and over | 19 (22.6%) | 10 (10.2%) |
Technology Access in Aurora County
Computing Device Access in Aurora County
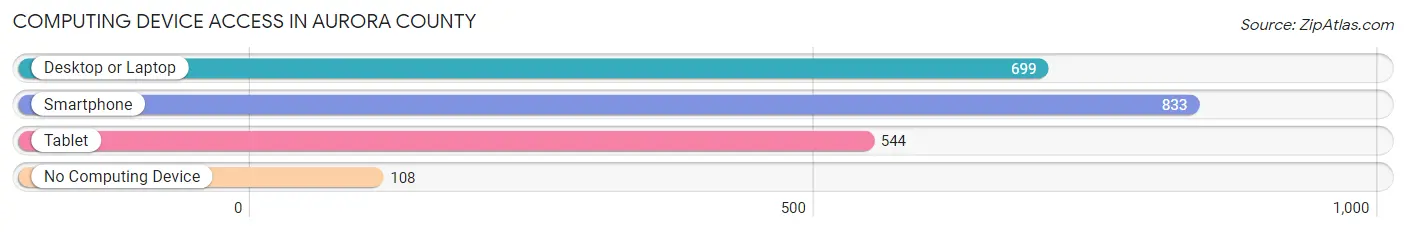
| Device Type | # Households | % Households |
| Desktop or Laptop | 699 | 66.4% |
| Smartphone | 833 | 79.1% |
| Tablet | 544 | 51.7% |
| No Computing Device | 108 | 10.3% |
| Total | 1,053 | 100.0% |
Internet Access in Aurora County
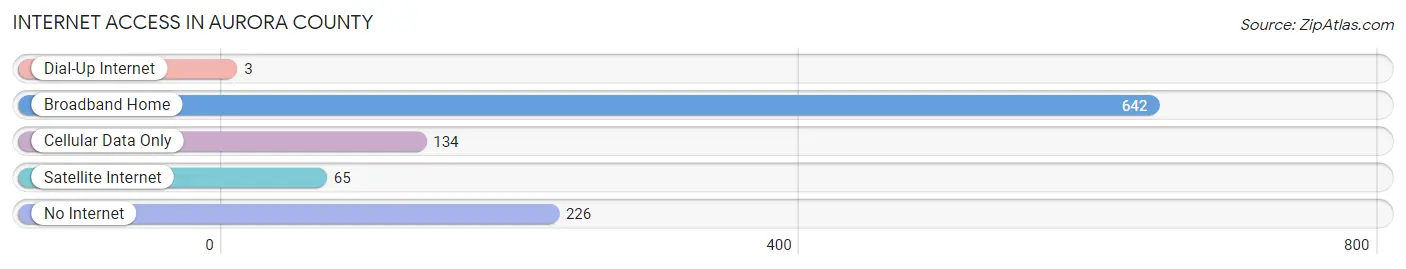
| Internet Type | # Households | % Households |
| Dial-Up Internet | 3 | 0.3% |
| Broadband Home | 642 | 61.0% |
| Cellular Data Only | 134 | 12.7% |
| Satellite Internet | 65 | 6.2% |
| No Internet | 226 | 21.5% |
| Total | 1,053 | 100.0% |
Aurora County Summary
Aurora County is located in the southeastern corner of South Dakota, and is bordered by the states of Minnesota and Iowa. It is part of the Sioux Falls Metropolitan Statistical Area, and is the second-smallest county in the state. The county seat is Plankinton, and the population was 2,072 at the 2010 census.
History
Aurora County was established in 1879, and was named after Aurora, the Roman goddess of the dawn. The county was originally part of the Dakota Territory, and was part of the original land grant given to the Sioux Indians in 1868. The county was organized in 1883, and the first county seat was located in Plankinton.
Geography
Aurora County covers an area of 576 square miles, and is located in the southeastern corner of South Dakota. It is bordered by the states of Minnesota and Iowa, and is part of the Sioux Falls Metropolitan Statistical Area. The county is mostly rural, with the majority of the land being used for agricultural purposes. The terrain is mostly flat, with some rolling hills in the northern part of the county. The county is home to several small lakes, including Lake Aurora, which is the largest.
The county is home to several small towns, including Plankinton, which is the county seat, and White Lake, which is the largest town in the county. The county is also home to several small unincorporated communities, including Aurora, Bridgewater, and Stickney.
Economy
Aurora County is primarily an agricultural county, with the majority of the land being used for farming and ranching. The county is home to several large farms, and the main crops grown in the county are corn, soybeans, and wheat. The county is also home to several small businesses, including a few restaurants, a grocery store, and a few gas stations.
The county is home to several small manufacturing companies, including a few food processing plants, a furniture factory, and a few metal fabrication companies. The county is also home to several small service businesses, including a few auto repair shops, a few construction companies, and a few landscaping companies.
Demographics
As of the 2010 census, there were 2,072 people, 845 households, and 590 families living in Aurora County. The population density was 3.6 people per square mile. The racial makeup of the county was 97.3% White, 0.4% African American, 0.2% Native American, 0.2% Asian, 0.1% Pacific Islander, 0.7% from other races, and 1.1% from two or more races. Hispanic or Latino of any race were 1.7% of the population.
The median income for a household in the county was $41,944, and the median income for a family was $50,000. The per capita income for the county was $20,845. About 8.2% of families and 10.2% of the population were below the poverty line, including 13.2% of those under age 18 and 8.3% of those age 65 or over.
Common Questions
What is Per Capita Income in Aurora County?
Per Capita income in Aurora County is $40,299.
What is the Median Family Income in Aurora County?
Median Family Income in Aurora County is $85,625.
What is the Median Household income in Aurora County?
Median Household Income in Aurora County is $71,490.
What is Income or Wage Gap in Aurora County?
Income or Wage Gap in Aurora County is 26.7%.
Women in Aurora County earn 73.3 cents for every dollar earned by a man.
What is Inequality or Gini Index in Aurora County?
Inequality or Gini Index in Aurora County is 0.45.
What is the Total Population of Aurora County?
Total Population of Aurora County is 2,590.
What is the Total Male Population of Aurora County?
Total Male Population of Aurora County is 1,359.
What is the Total Female Population of Aurora County?
Total Female Population of Aurora County is 1,231.
What is the Ratio of Males per 100 Females in Aurora County?
There are 110.40 Males per 100 Females in Aurora County.
What is the Ratio of Females per 100 Males in Aurora County?
There are 90.58 Females per 100 Males in Aurora County.
What is the Median Population Age in Aurora County?
Median Population Age in Aurora County is 41.4 Years.
What is the Average Family Size in Aurora County
Average Family Size in Aurora County is 2.9 People.
What is the Average Household Size in Aurora County
Average Household Size in Aurora County is 2.4 People.
How Large is the Labor Force in Aurora County?
There are 1,413 People in the Labor Forcein in Aurora County.
What is the Percentage of People in the Labor Force in Aurora County?
70.0% of People are in the Labor Force in Aurora County.
What is the Unemployment Rate in Aurora County?
Unemployment Rate in Aurora County is 0.8%.