Zip Codes with the Highest Percentage of Population Employed in Accommodation & Food Services in Little Neck, NY
RELATED REPORTS & OPTIONS
Accommodation & Food Services
Little Neck
Compare Zip Codes
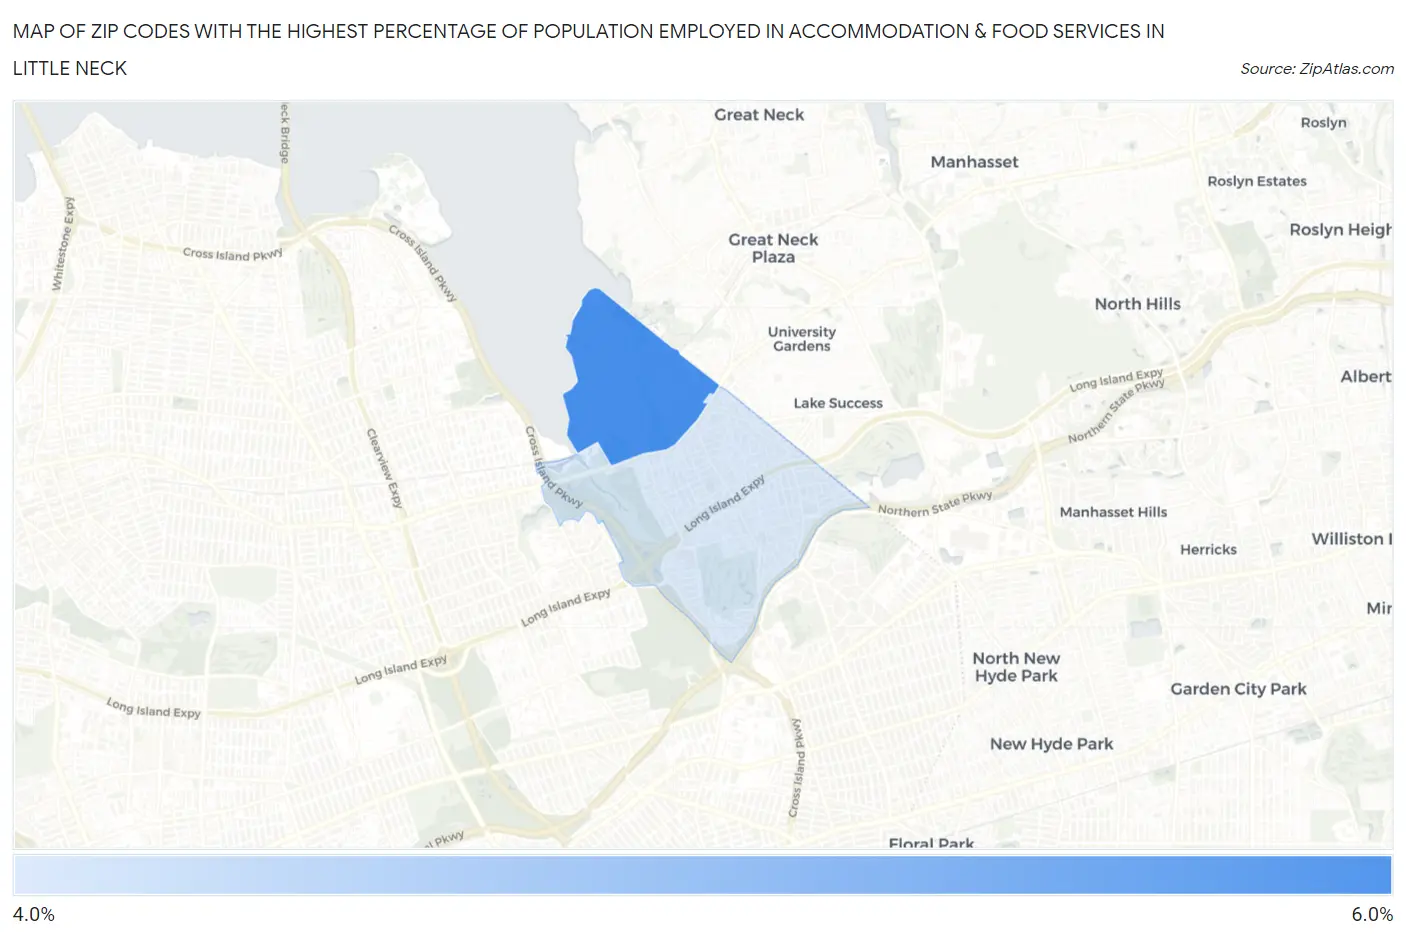
Map of Zip Codes with the Highest Percentage of Population Employed in Accommodation & Food Services in Little Neck
4.9%
5.1%
Zip Codes with the Highest Percentage of Population Employed in Accommodation & Food Services in Little Neck, NY
| Zip Code | % Employed | vs State | vs National | |
| 1. | 11363 | 5.1% | 6.2%(-1.06)#846 | 6.9%(-1.78)#16,455 |
| 2. | 11362 | 4.9% | 6.2%(-1.24)#888 | 6.9%(-1.96)#17,091 |
1
Common Questions
What are the Top Zip Codes with the Highest Percentage of Population Employed in Accommodation & Food Services in Little Neck, NY?
Top Zip Codes with the Highest Percentage of Population Employed in Accommodation & Food Services in Little Neck, NY are:
What zip code has the Highest Percentage of Population Employed in Accommodation & Food Services in Little Neck, NY?
11363 has the Highest Percentage of Population Employed in Accommodation & Food Services in Little Neck, NY with 5.1%.
What is the Percentage of Population Employed in Accommodation & Food Services in New York?
Percentage of Population Employed in Accommodation & Food Services in New York is 6.2%.
What is the Percentage of Population Employed in Accommodation & Food Services in the United States?
Percentage of Population Employed in Accommodation & Food Services in the United States is 6.9%.