Zip Codes with the Highest Percentage of Population Employed in Accommodation & Food Services in Hempstead, NY
RELATED REPORTS & OPTIONS
Accommodation & Food Services
Hempstead
Compare Zip Codes
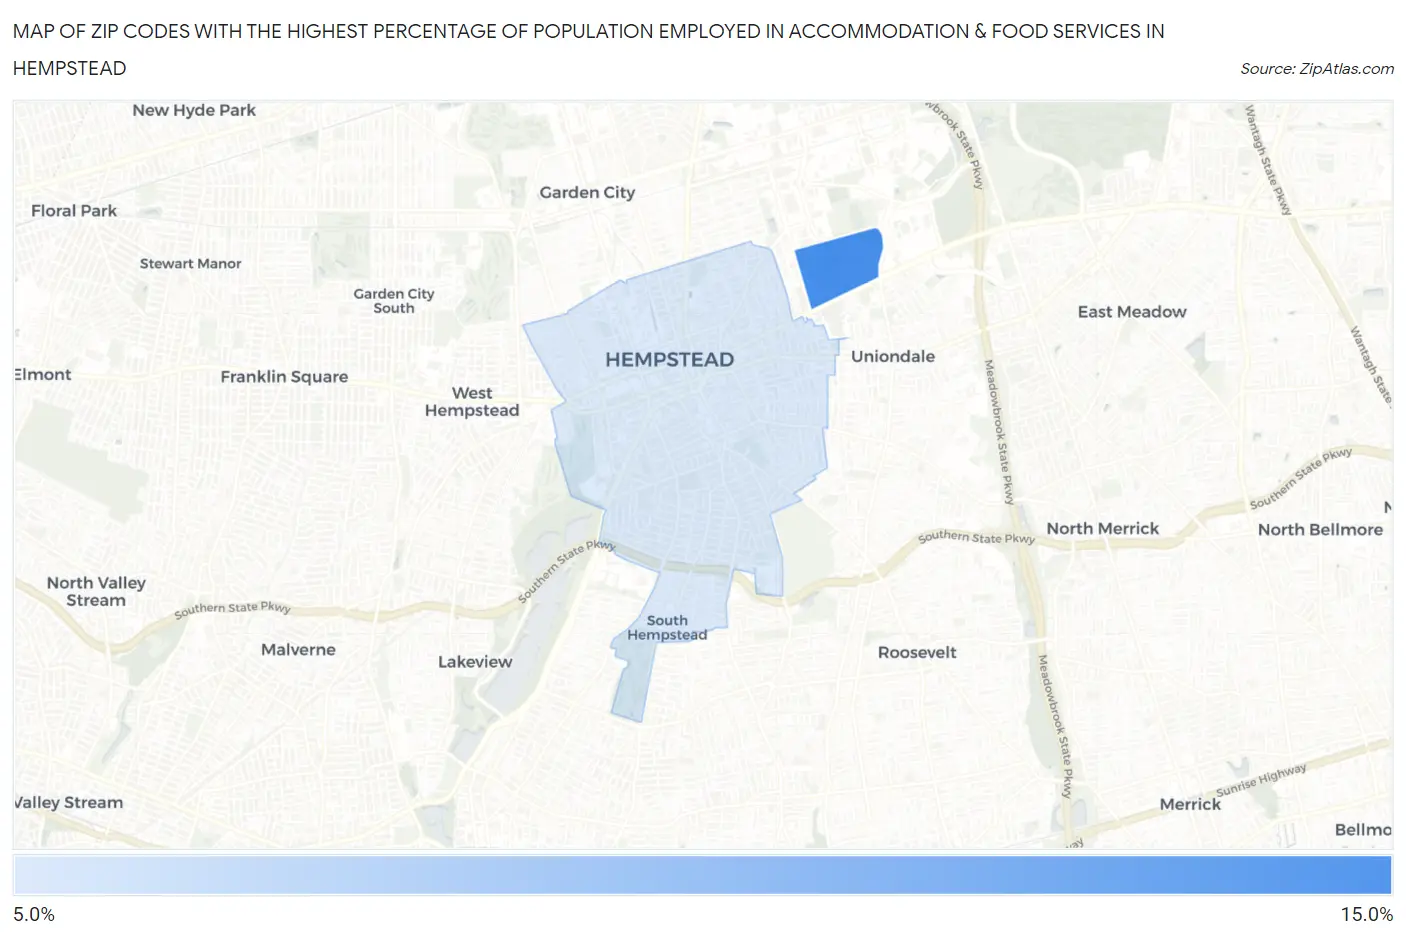
Map of Zip Codes with the Highest Percentage of Population Employed in Accommodation & Food Services in Hempstead
7.1%
10.8%
Zip Codes with the Highest Percentage of Population Employed in Accommodation & Food Services in Hempstead, NY
| Zip Code | % Employed | vs State | vs National | |
| 1. | 11549 | 10.8% | 6.2%(+4.63)#188 | 6.9%(+3.91)#3,727 |
| 2. | 11550 | 7.1% | 6.2%(+0.942)#484 | 6.9%(+0.225)#10,032 |
1
Common Questions
What are the Top Zip Codes with the Highest Percentage of Population Employed in Accommodation & Food Services in Hempstead, NY?
Top Zip Codes with the Highest Percentage of Population Employed in Accommodation & Food Services in Hempstead, NY are:
What zip code has the Highest Percentage of Population Employed in Accommodation & Food Services in Hempstead, NY?
11549 has the Highest Percentage of Population Employed in Accommodation & Food Services in Hempstead, NY with 10.8%.
What is the Percentage of Population Employed in Accommodation & Food Services in Hempstead, NY?
Percentage of Population Employed in Accommodation & Food Services in Hempstead is 7.4%.
What is the Percentage of Population Employed in Accommodation & Food Services in New York?
Percentage of Population Employed in Accommodation & Food Services in New York is 6.2%.
What is the Percentage of Population Employed in Accommodation & Food Services in the United States?
Percentage of Population Employed in Accommodation & Food Services in the United States is 6.9%.