Zip Codes with the Highest Percentage of Households With One or more Vehicles in Bronx, NY

RELATED REPORTS & OPTIONS

Households with 1 or more Cars
Population
Families and Households
Female Fertility
Female Fertility (Unmarried)
Race (Community Size)
Race (Percentage)
Ancestry (Community Size)
AfghanAfricanAlaska NativeAlbanianAmericanApacheArabArgentineanArmenianAustralianAustrianBahamianBangladeshiBarbadianBelgianBelizeanBermudanBhutaneseBlackfeetBolivianBrazilianBritishBritish West IndianBulgarianBurmeseCambodianCanadianCape VerdeanCelticCentral AmericanCentral American IndianCherokeeChileanChoctawColombianCosta RicanCroatianCubanCzechCzechoslovakianDanishDominicanDutchDutch West IndianEastern EuropeanEcuadorianEgyptianEnglishEthiopianEuropeanFilipinoFinnishFrenchFrench American IndianFrench CanadianGermanGhanaianGreekGuamanian / ChamorroGuatemalanGuyaneseHaitianHonduranHungarianIndian (Asian)IndonesianInupiatIranianIraqiIrishIroquoisIsraeliItalianJamaicanJapaneseJordanianKenyanKoreanLaotianLatvianLebaneseLiberianLithuanianMacedonianMalaysianMexicanMexican American IndianMongolianMoroccanNative HawaiianNavajoNicaraguanNigerianNorthern EuropeanNorwegianPakistaniPalestinianPanamanianParaguayanPeruvianPolishPortuguesePuerto RicanRomanianRussianSalvadoranSamoanScandinavianScotch-IrishScottishSenegaleseSerbianSierra LeoneanSiouxSlavicSlovakSloveneSomaliSouth AfricanSouth AmericanSouth American IndianSpaniardSpanishSpanish AmericanSpanish American IndianSri LankanSubsaharan AfricanSudaneseSwedishSwissSyrianThaiTrinidadian and TobagonianTurkishU.S. Virgin IslanderUgandanUkrainianUruguayanVenezuelanVietnameseWelshWest IndianYugoslavian
Ancestry (Percentage)
AfghanAfricanAlaska NativeAlbanianAmericanApacheArabArgentineanArmenianAustralianAustrianBahamianBangladeshiBarbadianBelgianBelizeanBermudanBhutaneseBlackfeetBolivianBrazilianBritishBritish West IndianBulgarianBurmeseCambodianCanadianCape VerdeanCelticCentral AmericanCentral American IndianCherokeeChileanChoctawColombianCosta RicanCroatianCubanCzechCzechoslovakianDanishDominicanDutchDutch West IndianEastern EuropeanEcuadorianEgyptianEnglishEthiopianEuropeanFilipinoFinnishFrenchFrench American IndianFrench CanadianGermanGhanaianGreekGuamanian / ChamorroGuatemalanGuyaneseHaitianHonduranHungarianIndian (Asian)IndonesianInupiatIranianIraqiIrishIroquoisIsraeliItalianJamaicanJapaneseJordanianKenyanKoreanLaotianLatvianLebaneseLiberianLithuanianMacedonianMalaysianMexicanMexican American IndianMongolianMoroccanNative HawaiianNavajoNicaraguanNigerianNorthern EuropeanNorwegianPakistaniPalestinianPanamanianParaguayanPeruvianPolishPortuguesePuerto RicanRomanianRussianSalvadoranSamoanScandinavianScotch-IrishScottishSenegaleseSerbianSierra LeoneanSiouxSlavicSlovakSloveneSomaliSouth AfricanSouth AmericanSouth American IndianSpaniardSpanishSpanish AmericanSpanish American IndianSri LankanSubsaharan AfricanSudaneseSwedishSwissSyrianThaiTrinidadian and TobagonianTurkishU.S. Virgin IslanderUgandanUkrainianUruguayanVenezuelanVietnameseWelshWest IndianYugoslavian
Immigrant Origin (Total)
AfghanistanAfricaAlbaniaArgentinaAsiaAustraliaAustriaBahamasBangladeshBarbadosBelarusBelgiumBelizeBoliviaBosnia and HerzegovinaBrazilBulgariaBurma / MyanmarCambodiaCameroonCanadaCaribbeanCentral AmericaChileChinaColombiaCongoCosta RicaCroatiaCubaCzechoslovakiaDominicaDominican RepublicEastern AfricaEastern AsiaEastern EuropeEcuadorEgyptEl SalvadorEnglandEritreaEthiopiaEuropeFranceGermanyGhanaGreeceGrenadaGuatemalaGuyanaHaitiHondurasHong KongHungaryIndiaIndonesiaIranIraqIrelandIsraelItalyJamaicaJapanJordanKazakhstanKenyaKoreaKuwaitLatin AmericaLatviaLebanonLiberiaLithuaniaMalaysiaMexicoMiddle AfricaMoroccoNepalNetherlandsNicaraguaNigeriaNorth MacedoniaNorthern AfricaNorthern EuropeOceaniaPakistanPanamaPeruPhilippinesPolandPortugalRomaniaRussiaSaudi ArabiaScotlandSenegalSerbiaSierra LeoneSingaporeSomaliaSouth AfricaSouth AmericaSouth Central AsiaSouth Eastern AsiaSouthern EuropeSpainSri LankaSt. Vincent and the GrenadinesSudanSwedenSwitzerlandSyriaTaiwanThailandTrinidad and TobagoTurkeyUgandaUkraineUruguayUzbekistanVenezuelaVietnamWest IndiesWestern AfricaWestern AsiaWestern EuropeYemenZaire
Immigrant Origin (Percentage)
AfghanistanAfricaAlbaniaArgentinaAsiaAustraliaAustriaBahamasBangladeshBarbadosBelarusBelgiumBelizeBoliviaBosnia and HerzegovinaBrazilBulgariaBurma / MyanmarCambodiaCameroonCanadaCaribbeanCentral AmericaChileChinaColombiaCongoCosta RicaCroatiaCubaCzechoslovakiaDominicaDominican RepublicEastern AfricaEastern AsiaEastern EuropeEcuadorEgyptEl SalvadorEnglandEritreaEthiopiaEuropeFranceGermanyGhanaGreeceGrenadaGuatemalaGuyanaHaitiHondurasHong KongHungaryIndiaIndonesiaIranIraqIrelandIsraelItalyJamaicaJapanJordanKazakhstanKenyaKoreaKuwaitLatin AmericaLatviaLebanonLiberiaLithuaniaMalaysiaMexicoMiddle AfricaMoroccoNepalNetherlandsNicaraguaNigeriaNorth MacedoniaNorthern AfricaNorthern EuropeOceaniaPakistanPanamaPeruPhilippinesPolandPortugalRomaniaRussiaSaudi ArabiaScotlandSenegalSerbiaSierra LeoneSingaporeSomaliaSouth AfricaSouth AmericaSouth Central AsiaSouth Eastern AsiaSouthern EuropeSpainSri LankaSt. Vincent and the GrenadinesSudanSwedenSwitzerlandSyriaTaiwanThailandTrinidad and TobagoTurkeyUgandaUkraineUruguayUzbekistanVenezuelaVietnamWest IndiesWestern AfricaWestern AsiaWestern EuropeYemenZaire
Income
Income (Families)
Income (Households)
Poverty
Poverty (Families)
Unemployment
Employment Occupations
Employment Industries
Employer Class
Commute Time
Commute Means
School Enrollment
Education by Degree Field
Occupancy
Finances
Physical Characteristics
Bronx
Compare Zip Codes
Comparison Subject

Map of Zip Codes with the Highest Percentage of Households With One or more Vehicles in Bronx

19.9%
87.3%
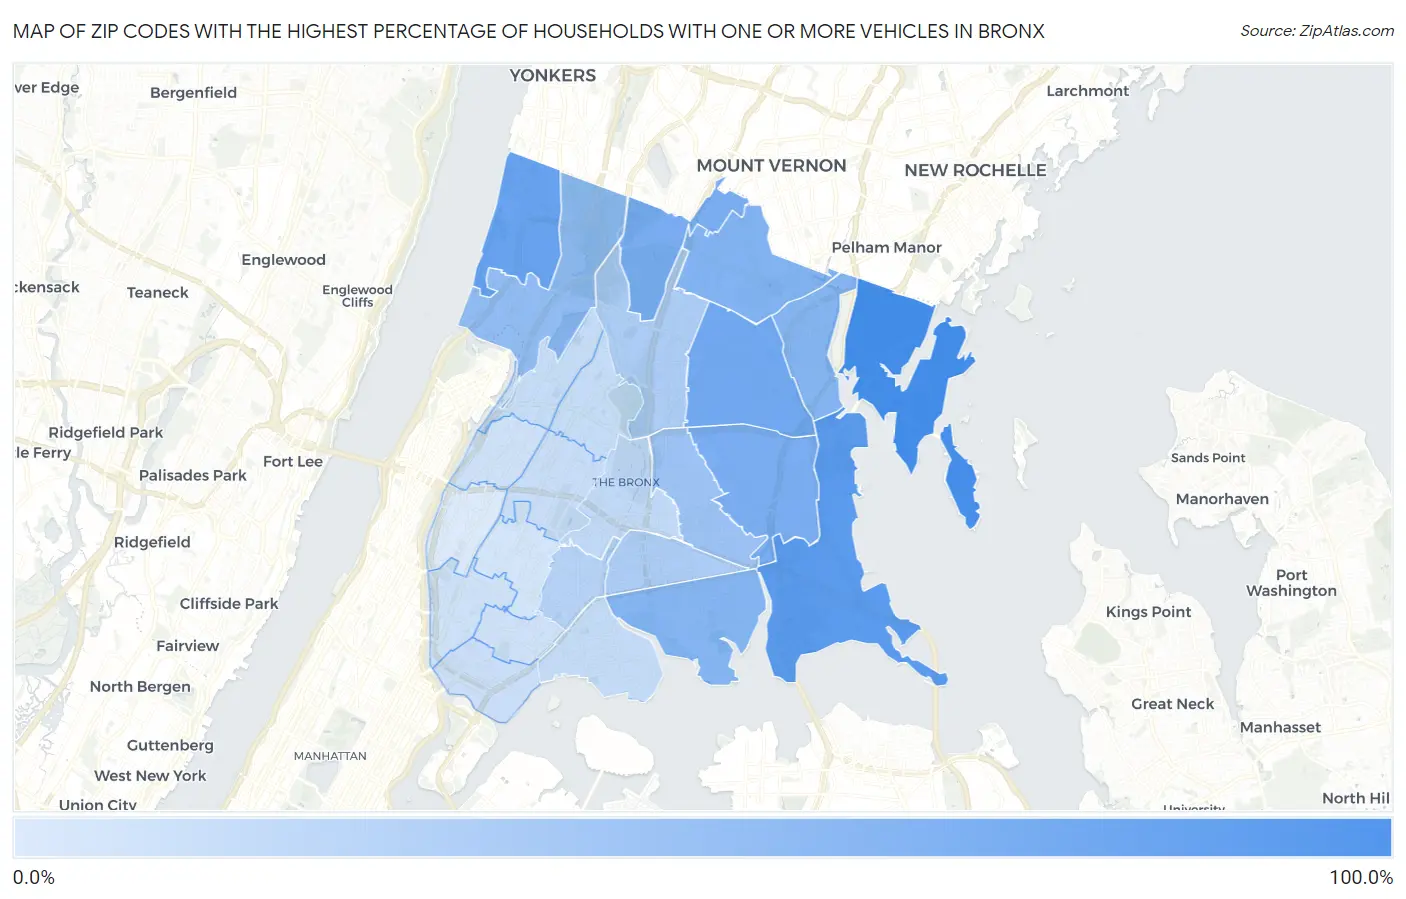
Zip Codes with the Highest Percentage of Households With One or more Vehicles in Bronx Map

Zip Codes with the Highest Percentage of Households With One or more Vehicles in Bronx, NY

Zip Code Housholds With 1+ Cars vs State vs National
1. 10464 87.3% 71.1% (+16.2)#1,381 91.7% (-4.40)#29,590
2. 10465 75.8% 71.1% (+4.70)#1,549 91.7% (-15.9)#31,694
3. 10471 69.6% 71.1% (-1.50)#1,582 91.7% (-22.1)#32,036
4. 10469 65.2% 71.1% (-5.90)#1,608 91.7% (-26.5)#32,178
5. 10461 61.4% 71.1% (-9.70)#1,615 91.7% (-30.3)#32,274
6. 10470 60.9% 71.1% (-10.2)#1,616 91.7% (-30.8)#32,285
7. 10466 57.5% 71.1% (-13.6)#1,626 91.7% (-34.2)#32,352
8. 10473 55.7% 71.1% (-15.4)#1,641 91.7% (-36.0)#32,400
9. 10475 55.5% 71.1% (-15.6)#1,642 91.7% (-36.2)#32,406
10. 10463 50.6% 71.1% (-20.5)#1,651 91.7% (-41.1)#32,466
11. 10462 45.1% 71.1% (-26.0)#1,660 91.7% (-46.6)#32,511
12. 10467 38.4% 71.1% (-32.7)#1,671 91.7% (-53.3)#32,556
13. 10472 38.4% 71.1% (-32.7)#1,672 91.7% (-53.3)#32,557
14. 10459 34.4% 71.1% (-36.7)#1,682 91.7% (-57.3)#32,587
15. 10460 30.3% 71.1% (-40.8)#1,698 91.7% (-61.4)#32,624
16. 10474 29.6% 71.1% (-41.5)#1,702 91.7% (-62.1)#32,630
17. 10458 28.3% 71.1% (-42.8)#1,707 91.7% (-63.4)#32,637
18. 10468 28.2% 71.1% (-42.9)#1,708 91.7% (-63.5)#32,639
19. 10457 27.9% 71.1% (-43.2)#1,709 91.7% (-63.8)#32,640
20. 10454 26.7% 71.1% (-44.4)#1,714 91.7% (-65.0)#32,648
21. 10453 25.1% 71.1% (-46.0)#1,717 91.7% (-66.6)#32,655
22. 10455 25.0% 71.1% (-46.1)#1,719 91.7% (-66.7)#32,657
23. 10451 24.8% 71.1% (-46.3)#1,722 91.7% (-66.9)#32,662
24. 10456 23.5% 71.1% (-47.6)#1,725 91.7% (-68.2)#32,668
25. 10452 19.9% 71.1% (-51.2)#1,733 91.7% (-71.8)#32,687

Common Questions

What are the Top 10 Zip Codes with the Highest Percentage of Households With One or more Vehicles in Bronx, NY?
Top 10 Zip Codes with the Highest Percentage of Households With One or more Vehicles in Bronx, NY are:
#1
87.3%
#2
75.8%
#3
69.6%
#4
65.2%
#5
61.4%
#6
60.9%
#7
57.5%
#8
55.7%
#9
55.5%
#10
50.6%
What zip code has the Highest Percentage of Households With One or more Vehicles in Bronx, NY?
10464 has the Highest Percentage of Households With One or more Vehicles in Bronx, NY with 87.3%.
What is the Percentage of Households With One or more Vehicles in New York?
Percentage of Households With One or more Vehicles in New York is 71.1%.
What is the Percentage of Households With One or more Vehicles in the United States?
Percentage of Households With One or more Vehicles in the United States is 91.7%.