Zip Codes with the Highest Percentage of Population with a Degree in Visual and Performing Arts in Nevada
RELATED REPORTS & OPTIONS
Visual and Performing Arts
Nevada
Compare Zip Codes
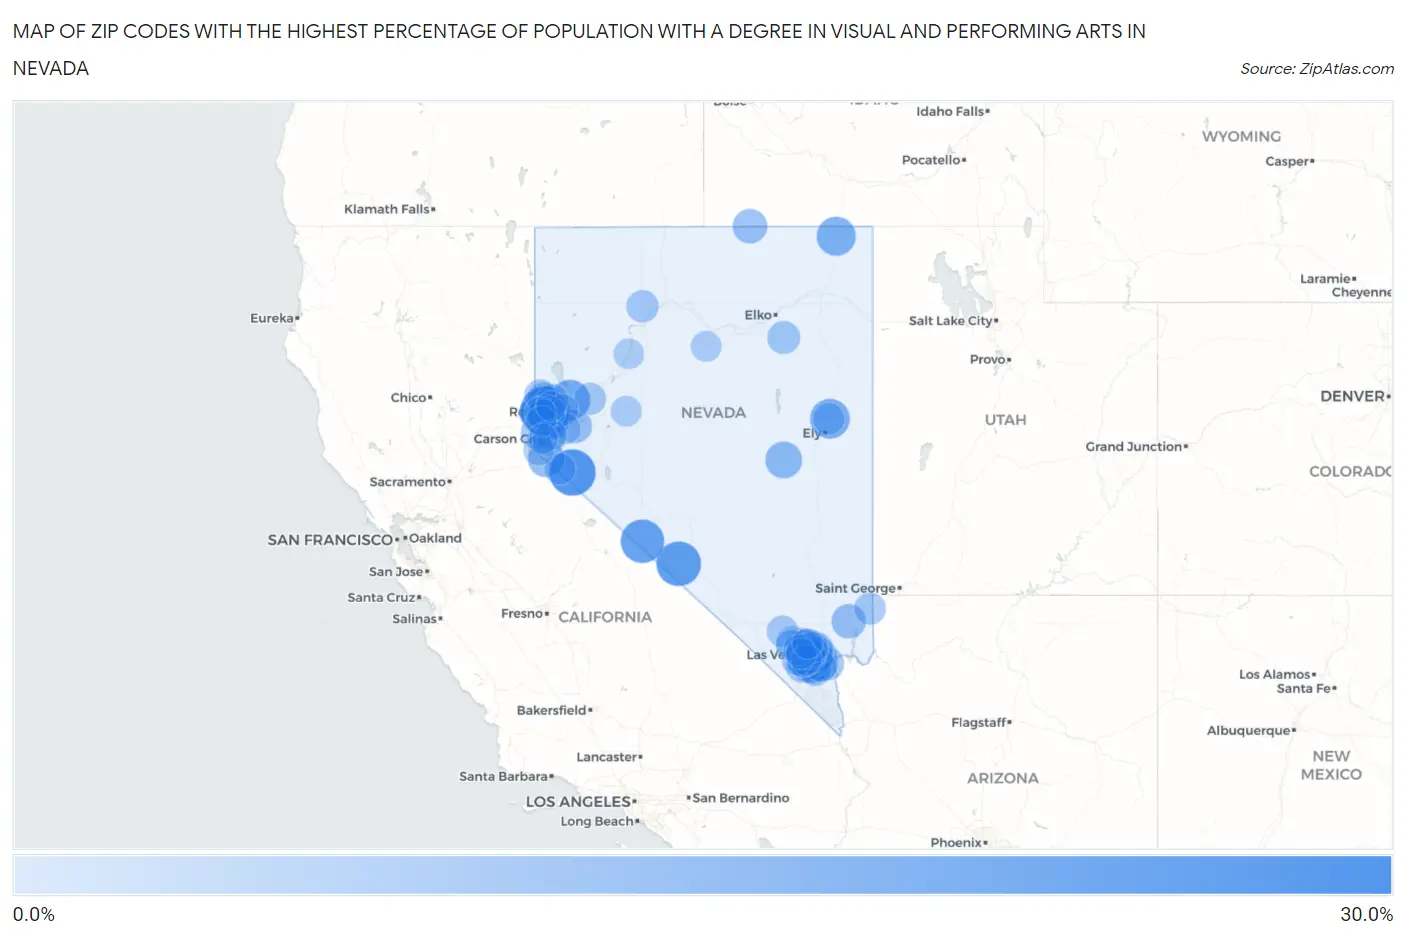
Map of Zip Codes with the Highest Percentage of Population with a Degree in Visual and Performing Arts in Nevada
0.0%
30.0%
Zip Codes with the Highest Percentage of Population with a Degree in Visual and Performing Arts in Nevada
| Zip Code | % Graduates | vs State | vs National | |
| 1. | 89557 | 29.0% | 3.8%(+25.2)#1 | 4.3%(+24.7)#238 |
| 2. | 89444 | 24.4% | 3.8%(+20.6)#2 | 4.3%(+20.1)#327 |
| 3. | 89013 | 21.8% | 3.8%(+18.0)#3 | 4.3%(+17.5)#402 |
| 4. | 89010 | 20.2% | 3.8%(+16.4)#4 | 4.3%(+15.9)#465 |
| 5. | 89442 | 15.9% | 3.8%(+12.1)#5 | 4.3%(+11.6)#729 |
| 6. | 89318 | 14.7% | 3.8%(+10.9)#6 | 4.3%(+10.5)#844 |
| 7. | 89825 | 13.9% | 3.8%(+10.1)#7 | 4.3%(+9.69)#965 |
| 8. | 89314 | 10.5% | 3.8%(+6.73)#8 | 4.3%(+6.27)#1,670 |
| 9. | 89460 | 10.5% | 3.8%(+6.66)#9 | 4.3%(+6.20)#1,694 |
| 10. | 89169 | 10.1% | 3.8%(+6.27)#10 | 4.3%(+5.82)#1,801 |
| 11. | 89107 | 7.6% | 3.8%(+3.84)#11 | 4.3%(+3.38)#3,122 |
| 12. | 89832 | 7.4% | 3.8%(+3.56)#12 | 4.3%(+3.10)#3,328 |
| 13. | 89501 | 7.3% | 3.8%(+3.52)#13 | 4.3%(+3.06)#3,364 |
| 14. | 89021 | 7.3% | 3.8%(+3.52)#14 | 4.3%(+3.06)#3,366 |
| 15. | 89103 | 7.1% | 3.8%(+3.27)#15 | 4.3%(+2.81)#3,600 |
| 16. | 89110 | 7.0% | 3.8%(+3.22)#16 | 4.3%(+2.76)#3,652 |
| 17. | 89104 | 6.9% | 3.8%(+3.09)#17 | 4.3%(+2.63)#3,780 |
| 18. | 89429 | 6.7% | 3.8%(+2.94)#18 | 4.3%(+2.48)#3,948 |
| 19. | 89183 | 6.5% | 3.8%(+2.70)#19 | 4.3%(+2.24)#4,242 |
| 20. | 89121 | 6.4% | 3.8%(+2.64)#20 | 4.3%(+2.18)#4,311 |
| 21. | 89503 | 6.2% | 3.8%(+2.44)#21 | 4.3%(+1.98)#4,554 |
| 22. | 89146 | 6.2% | 3.8%(+2.40)#22 | 4.3%(+1.94)#4,612 |
| 23. | 89156 | 6.0% | 3.8%(+2.25)#23 | 4.3%(+1.79)#4,817 |
| 24. | 89102 | 5.9% | 3.8%(+2.13)#24 | 4.3%(+1.67)#4,974 |
| 25. | 89005 | 5.6% | 3.8%(+1.83)#25 | 4.3%(+1.37)#5,463 |
| 26. | 89178 | 5.5% | 3.8%(+1.71)#26 | 4.3%(+1.25)#5,675 |
| 27. | 89451 | 5.5% | 3.8%(+1.70)#27 | 4.3%(+1.24)#5,703 |
| 28. | 89502 | 5.5% | 3.8%(+1.69)#28 | 4.3%(+1.23)#5,714 |
| 29. | 89128 | 5.4% | 3.8%(+1.59)#29 | 4.3%(+1.13)#5,887 |
| 30. | 89117 | 5.3% | 3.8%(+1.48)#30 | 4.3%(+1.02)#6,103 |
| 31. | 89433 | 5.2% | 3.8%(+1.42)#31 | 4.3%(+0.962)#6,218 |
| 32. | 89119 | 5.1% | 3.8%(+1.35)#32 | 4.3%(+0.895)#6,343 |
| 33. | 89815 | 5.1% | 3.8%(+1.30)#33 | 4.3%(+0.837)#6,439 |
| 34. | 89101 | 5.1% | 3.8%(+1.28)#34 | 4.3%(+0.817)#6,488 |
| 35. | 89506 | 5.0% | 3.8%(+1.16)#35 | 4.3%(+0.698)#6,769 |
| 36. | 89074 | 4.7% | 3.8%(+0.925)#36 | 4.3%(+0.465)#7,263 |
| 37. | 89158 | 4.6% | 3.8%(+0.843)#37 | 4.3%(+0.384)#7,456 |
| 38. | 89149 | 4.4% | 3.8%(+0.565)#38 | 4.3%(+0.106)#8,199 |
| 39. | 89166 | 4.3% | 3.8%(+0.513)#39 | 4.3%(+0.054)#8,340 |
| 40. | 89147 | 4.3% | 3.8%(+0.509)#40 | 4.3%(+0.050)#8,347 |
| 41. | 89086 | 4.3% | 3.8%(+0.483)#41 | 4.3%(+0.024)#8,417 |
| 42. | 89445 | 4.2% | 3.8%(+0.441)#42 | 4.3%(-0.019)#8,527 |
| 43. | 89014 | 4.2% | 3.8%(+0.408)#43 | 4.3%(-0.051)#8,623 |
| 44. | 89512 | 4.2% | 3.8%(+0.402)#44 | 4.3%(-0.058)#8,646 |
| 45. | 89012 | 4.1% | 3.8%(+0.330)#45 | 4.3%(-0.129)#8,862 |
| 46. | 89134 | 4.1% | 3.8%(+0.320)#46 | 4.3%(-0.140)#8,899 |
| 47. | 89123 | 4.0% | 3.8%(+0.237)#47 | 4.3%(-0.223)#9,158 |
| 48. | 89015 | 4.0% | 3.8%(+0.211)#48 | 4.3%(-0.249)#9,254 |
| 49. | 89120 | 3.8% | 3.8%(+0.050)#49 | 4.3%(-0.409)#9,759 |
| 50. | 89052 | 3.8% | 3.8%(-0.017)#50 | 4.3%(-0.477)#9,922 |
| 51. | 89408 | 3.7% | 3.8%(-0.095)#51 | 4.3%(-0.554)#10,176 |
| 52. | 89141 | 3.6% | 3.8%(-0.143)#52 | 4.3%(-0.602)#10,330 |
| 53. | 89108 | 3.6% | 3.8%(-0.147)#53 | 4.3%(-0.606)#10,351 |
| 54. | 89139 | 3.6% | 3.8%(-0.186)#54 | 4.3%(-0.645)#10,483 |
| 55. | 89122 | 3.6% | 3.8%(-0.193)#55 | 4.3%(-0.652)#10,503 |
| 56. | 89044 | 3.6% | 3.8%(-0.204)#56 | 4.3%(-0.663)#10,537 |
| 57. | 89441 | 3.6% | 3.8%(-0.215)#57 | 4.3%(-0.674)#10,569 |
| 58. | 89701 | 3.6% | 3.8%(-0.224)#58 | 4.3%(-0.684)#10,623 |
| 59. | 89143 | 3.6% | 3.8%(-0.238)#59 | 4.3%(-0.697)#10,679 |
| 60. | 89142 | 3.5% | 3.8%(-0.270)#60 | 4.3%(-0.730)#10,806 |
| 61. | 89031 | 3.5% | 3.8%(-0.287)#61 | 4.3%(-0.746)#10,858 |
| 62. | 89145 | 3.5% | 3.8%(-0.293)#62 | 4.3%(-0.753)#10,878 |
| 63. | 89115 | 3.5% | 3.8%(-0.296)#63 | 4.3%(-0.755)#10,887 |
| 64. | 89113 | 3.5% | 3.8%(-0.302)#64 | 4.3%(-0.761)#10,915 |
| 65. | 89027 | 3.5% | 3.8%(-0.316)#65 | 4.3%(-0.775)#10,973 |
| 66. | 89521 | 3.5% | 3.8%(-0.328)#66 | 4.3%(-0.787)#11,014 |
| 67. | 89509 | 3.5% | 3.8%(-0.333)#67 | 4.3%(-0.792)#11,036 |
| 68. | 89434 | 3.4% | 3.8%(-0.354)#68 | 4.3%(-0.813)#11,118 |
| 69. | 89129 | 3.4% | 3.8%(-0.398)#69 | 4.3%(-0.858)#11,277 |
| 70. | 89301 | 3.4% | 3.8%(-0.405)#70 | 4.3%(-0.864)#11,302 |
| 71. | 89109 | 3.2% | 3.8%(-0.592)#71 | 4.3%(-1.05)#11,984 |
| 72. | 89148 | 3.1% | 3.8%(-0.731)#72 | 4.3%(-1.19)#12,497 |
| 73. | 89070 | 3.0% | 3.8%(-0.799)#73 | 4.3%(-1.26)#12,752 |
| 74. | 89439 | 3.0% | 3.8%(-0.811)#74 | 4.3%(-1.27)#12,799 |
| 75. | 89403 | 2.9% | 3.8%(-0.878)#75 | 4.3%(-1.34)#13,036 |
| 76. | 89002 | 2.8% | 3.8%(-0.948)#76 | 4.3%(-1.41)#13,312 |
| 77. | 89410 | 2.8% | 3.8%(-0.950)#77 | 4.3%(-1.41)#13,319 |
| 78. | 89130 | 2.8% | 3.8%(-0.976)#78 | 4.3%(-1.44)#13,420 |
| 79. | 89508 | 2.8% | 3.8%(-1.02)#79 | 4.3%(-1.48)#13,599 |
| 80. | 89135 | 2.7% | 3.8%(-1.08)#80 | 4.3%(-1.54)#13,832 |
| 81. | 89431 | 2.7% | 3.8%(-1.11)#81 | 4.3%(-1.57)#13,963 |
| 82. | 89131 | 2.6% | 3.8%(-1.23)#82 | 4.3%(-1.69)#14,382 |
| 83. | 89519 | 2.5% | 3.8%(-1.25)#83 | 4.3%(-1.71)#14,485 |
| 84. | 89124 | 2.4% | 3.8%(-1.38)#84 | 4.3%(-1.84)#14,966 |
| 85. | 89523 | 2.4% | 3.8%(-1.39)#85 | 4.3%(-1.85)#14,990 |
| 86. | 89030 | 2.4% | 3.8%(-1.39)#86 | 4.3%(-1.85)#14,991 |
| 87. | 89106 | 2.4% | 3.8%(-1.40)#87 | 4.3%(-1.86)#15,041 |
| 88. | 89081 | 2.4% | 3.8%(-1.42)#88 | 4.3%(-1.88)#15,086 |
| 89. | 89138 | 2.3% | 3.8%(-1.49)#89 | 4.3%(-1.95)#15,380 |
| 90. | 89406 | 2.2% | 3.8%(-1.56)#90 | 4.3%(-2.02)#15,604 |
| 91. | 89706 | 2.2% | 3.8%(-1.58)#91 | 4.3%(-2.03)#15,650 |
| 92. | 89118 | 2.2% | 3.8%(-1.61)#92 | 4.3%(-2.07)#15,767 |
| 93. | 89448 | 2.1% | 3.8%(-1.72)#93 | 4.3%(-2.18)#16,149 |
| 94. | 89511 | 2.0% | 3.8%(-1.74)#94 | 4.3%(-2.20)#16,268 |
| 95. | 89820 | 2.0% | 3.8%(-1.80)#95 | 4.3%(-2.26)#16,470 |
| 96. | 89144 | 2.0% | 3.8%(-1.81)#96 | 4.3%(-2.27)#16,503 |
| 97. | 89085 | 1.7% | 3.8%(-2.06)#97 | 4.3%(-2.52)#17,373 |
| 98. | 89703 | 1.7% | 3.8%(-2.09)#98 | 4.3%(-2.55)#17,480 |
| 99. | 89436 | 1.6% | 3.8%(-2.21)#99 | 4.3%(-2.67)#17,894 |
| 100. | 89419 | 1.5% | 3.8%(-2.27)#100 | 4.3%(-2.73)#18,102 |
1
2Common Questions
What are the Top 10 Zip Codes with the Highest Percentage of Population with a Degree in Visual and Performing Arts in Nevada?
Top 10 Zip Codes with the Highest Percentage of Population with a Degree in Visual and Performing Arts in Nevada are:
What zip code has the Highest Percentage of Population with a Degree in Visual and Performing Arts in Nevada?
89557 has the Highest Percentage of Population with a Degree in Visual and Performing Arts in Nevada with 29.0%.
What is the Percentage of Population with a Degree in Visual and Performing Arts in the State of Nevada?
Percentage of Population with a Degree in Visual and Performing Arts in Nevada is 3.8%.
What is the Percentage of Population with a Degree in Visual and Performing Arts in the United States?
Percentage of Population with a Degree in Visual and Performing Arts in the United States is 4.3%.