Zip Codes with the Highest Percentage of Population Employed in Farming, Fishing & Forestry in Nevada
RELATED REPORTS & OPTIONS
Farming, Fishing & Forestry
Nevada
Compare Zip Codes
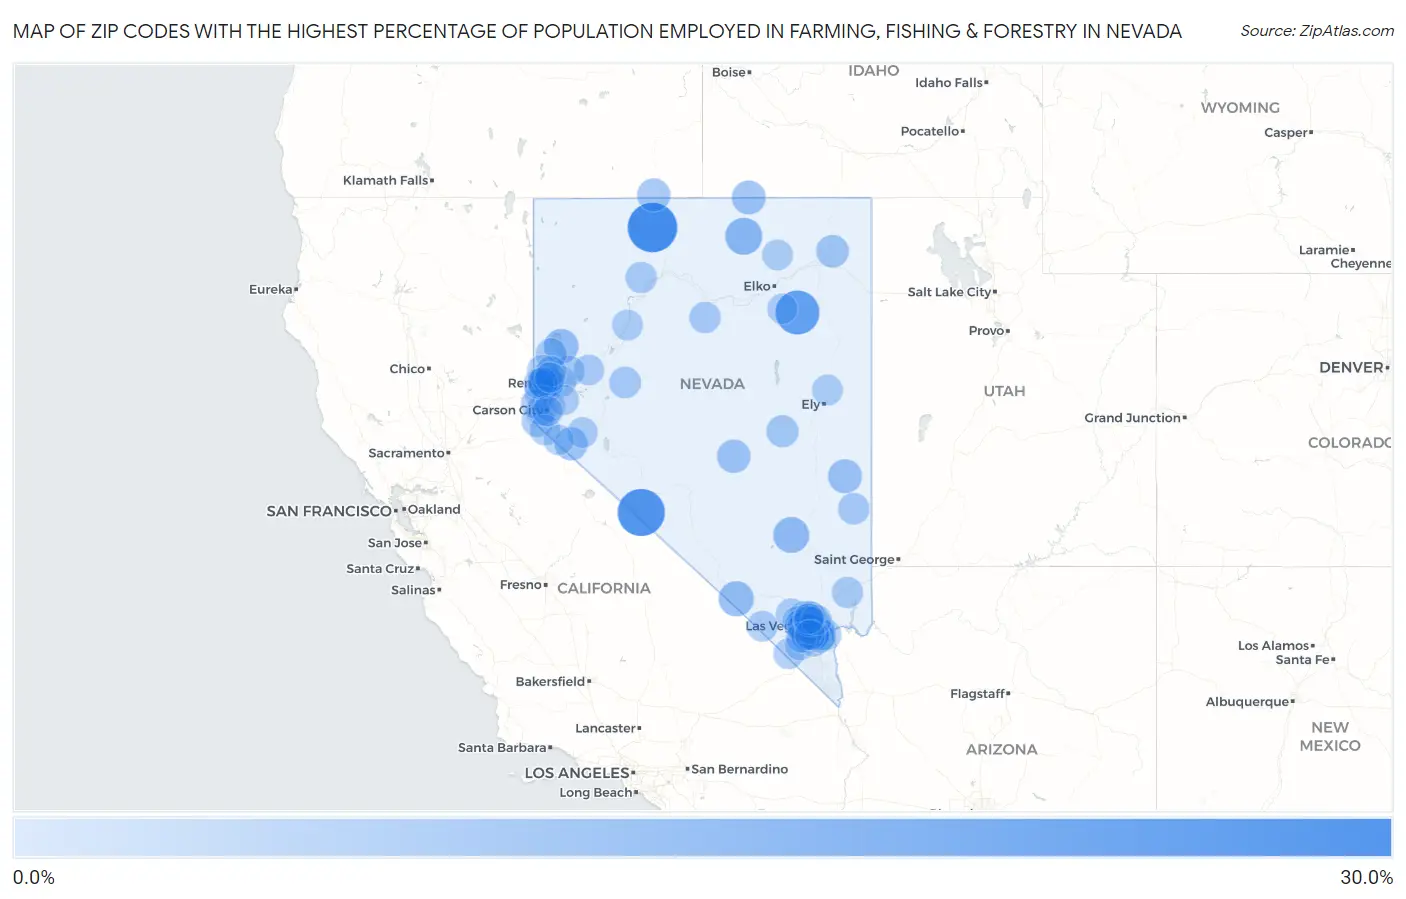
Map of Zip Codes with the Highest Percentage of Population Employed in Farming, Fishing & Forestry in Nevada
0.0%
30.0%
Zip Codes with the Highest Percentage of Population Employed in Farming, Fishing & Forestry in Nevada
| Zip Code | % Employed | vs State | vs National | |
| 1. | 89425 | 29.8% | 0.19%(+29.6)#1 | 0.61%(+29.2)#197 |
| 2. | 89010 | 26.1% | 0.19%(+25.9)#2 | 0.61%(+25.5)#263 |
| 3. | 89833 | 20.8% | 0.19%(+20.6)#3 | 0.61%(+20.2)#372 |
| 4. | 89834 | 10.0% | 0.19%(+9.81)#4 | 0.61%(+9.39)#1,211 |
| 5. | 89001 | 8.3% | 0.19%(+8.16)#5 | 0.61%(+7.74)#1,551 |
| 6. | 89020 | 7.2% | 0.19%(+7.06)#6 | 0.61%(+6.64)#1,894 |
| 7. | 89424 | 6.3% | 0.19%(+6.13)#7 | 0.61%(+5.71)#2,229 |
| 8. | 89043 | 5.5% | 0.19%(+5.30)#8 | 0.61%(+4.88)#2,659 |
| 9. | 89832 | 5.3% | 0.19%(+5.14)#9 | 0.61%(+4.72)#2,730 |
| 10. | 89049 | 4.7% | 0.19%(+4.48)#10 | 0.61%(+4.06)#3,178 |
| 11. | 89421 | 4.3% | 0.19%(+4.07)#11 | 0.61%(+3.65)#3,496 |
| 12. | 89444 | 4.2% | 0.19%(+4.03)#12 | 0.61%(+3.61)#3,528 |
| 13. | 89835 | 3.5% | 0.19%(+3.29)#13 | 0.61%(+2.88)#4,219 |
| 14. | 89314 | 2.6% | 0.19%(+2.44)#14 | 0.61%(+2.03)#5,347 |
| 15. | 89406 | 1.9% | 0.19%(+1.70)#15 | 0.61%(+1.28)#6,795 |
| 16. | 89448 | 1.8% | 0.19%(+1.60)#16 | 0.61%(+1.18)#7,068 |
| 17. | 89042 | 1.7% | 0.19%(+1.49)#17 | 0.61%(+1.07)#7,361 |
| 18. | 89820 | 1.6% | 0.19%(+1.40)#18 | 0.61%(+0.978)#7,641 |
| 19. | 89445 | 1.3% | 0.19%(+1.13)#19 | 0.61%(+0.707)#8,524 |
| 20. | 89442 | 1.2% | 0.19%(+1.05)#20 | 0.61%(+0.632)#8,806 |
| 21. | 89021 | 1.2% | 0.19%(+0.993)#21 | 0.61%(+0.574)#9,005 |
| 22. | 89510 | 1.0% | 0.19%(+0.850)#22 | 0.61%(+0.431)#9,578 |
| 23. | 89501 | 0.95% | 0.19%(+0.760)#23 | 0.61%(+0.341)#10,007 |
| 24. | 89109 | 0.94% | 0.19%(+0.750)#24 | 0.61%(+0.331)#10,060 |
| 25. | 89301 | 0.63% | 0.19%(+0.440)#25 | 0.61%(+0.021)#11,842 |
| 26. | 89511 | 0.62% | 0.19%(+0.435)#26 | 0.61%(+0.016)#11,875 |
| 27. | 89801 | 0.58% | 0.19%(+0.389)#27 | 0.61%(-0.030)#12,242 |
| 28. | 89419 | 0.56% | 0.19%(+0.374)#28 | 0.61%(-0.045)#12,380 |
| 29. | 89048 | 0.54% | 0.19%(+0.356)#29 | 0.61%(-0.062)#12,501 |
| 30. | 89119 | 0.46% | 0.19%(+0.275)#30 | 0.61%(-0.144)#13,169 |
| 31. | 89512 | 0.45% | 0.19%(+0.266)#31 | 0.61%(-0.153)#13,258 |
| 32. | 89019 | 0.45% | 0.19%(+0.259)#32 | 0.61%(-0.160)#13,332 |
| 33. | 89408 | 0.44% | 0.19%(+0.254)#33 | 0.61%(-0.165)#13,378 |
| 34. | 89108 | 0.43% | 0.19%(+0.242)#34 | 0.61%(-0.177)#13,508 |
| 35. | 89107 | 0.37% | 0.19%(+0.186)#35 | 0.61%(-0.233)#14,020 |
| 36. | 89156 | 0.36% | 0.19%(+0.170)#36 | 0.61%(-0.249)#14,185 |
| 37. | 89101 | 0.35% | 0.19%(+0.163)#37 | 0.61%(-0.256)#14,273 |
| 38. | 89509 | 0.35% | 0.19%(+0.159)#38 | 0.61%(-0.260)#14,310 |
| 39. | 89103 | 0.34% | 0.19%(+0.154)#39 | 0.61%(-0.265)#14,357 |
| 40. | 89166 | 0.34% | 0.19%(+0.150)#40 | 0.61%(-0.269)#14,409 |
| 41. | 89086 | 0.33% | 0.19%(+0.144)#41 | 0.61%(-0.275)#14,477 |
| 42. | 89106 | 0.33% | 0.19%(+0.143)#42 | 0.61%(-0.275)#14,485 |
| 43. | 89502 | 0.32% | 0.19%(+0.132)#43 | 0.61%(-0.287)#14,614 |
| 44. | 89703 | 0.26% | 0.19%(+0.071)#44 | 0.61%(-0.348)#15,314 |
| 45. | 89447 | 0.26% | 0.19%(+0.070)#45 | 0.61%(-0.349)#15,329 |
| 46. | 89044 | 0.21% | 0.19%(+0.025)#46 | 0.61%(-0.394)#15,973 |
| 47. | 89434 | 0.21% | 0.19%(+0.020)#47 | 0.61%(-0.399)#16,042 |
| 48. | 89118 | 0.20% | 0.19%(+0.012)#48 | 0.61%(-0.407)#16,150 |
| 49. | 89110 | 0.20% | 0.19%(+0.010)#49 | 0.61%(-0.408)#16,175 |
| 50. | 89146 | 0.19% | 0.19%(+0.000)#50 | 0.61%(-0.418)#16,324 |
| 51. | 89011 | 0.18% | 0.19%(-0.011)#51 | 0.61%(-0.430)#16,491 |
| 52. | 89433 | 0.17% | 0.19%(-0.018)#52 | 0.61%(-0.437)#16,595 |
| 53. | 89128 | 0.17% | 0.19%(-0.020)#53 | 0.61%(-0.439)#16,630 |
| 54. | 89141 | 0.17% | 0.19%(-0.020)#54 | 0.61%(-0.439)#16,633 |
| 55. | 89451 | 0.17% | 0.19%(-0.021)#55 | 0.61%(-0.440)#16,649 |
| 56. | 89706 | 0.16% | 0.19%(-0.031)#56 | 0.61%(-0.450)#16,825 |
| 57. | 89121 | 0.15% | 0.19%(-0.032)#57 | 0.61%(-0.451)#16,839 |
| 58. | 89179 | 0.15% | 0.19%(-0.036)#58 | 0.61%(-0.455)#16,903 |
| 59. | 89460 | 0.15% | 0.19%(-0.041)#59 | 0.61%(-0.460)#16,997 |
| 60. | 89030 | 0.14% | 0.19%(-0.045)#60 | 0.61%(-0.464)#17,083 |
| 61. | 89130 | 0.14% | 0.19%(-0.046)#61 | 0.61%(-0.465)#17,088 |
| 62. | 89005 | 0.12% | 0.19%(-0.068)#62 | 0.61%(-0.487)#17,452 |
| 63. | 89403 | 0.11% | 0.19%(-0.075)#63 | 0.61%(-0.494)#17,568 |
| 64. | 89431 | 0.11% | 0.19%(-0.079)#64 | 0.61%(-0.498)#17,627 |
| 65. | 89506 | 0.098% | 0.19%(-0.089)#65 | 0.61%(-0.508)#17,805 |
| 66. | 89122 | 0.095% | 0.19%(-0.092)#66 | 0.61%(-0.511)#17,851 |
| 67. | 89131 | 0.094% | 0.19%(-0.093)#67 | 0.61%(-0.512)#17,866 |
| 68. | 89015 | 0.091% | 0.19%(-0.095)#68 | 0.61%(-0.514)#17,905 |
| 69. | 89138 | 0.091% | 0.19%(-0.096)#69 | 0.61%(-0.515)#17,915 |
| 70. | 89441 | 0.088% | 0.19%(-0.099)#70 | 0.61%(-0.518)#17,970 |
| 71. | 89002 | 0.083% | 0.19%(-0.103)#71 | 0.61%(-0.522)#18,049 |
| 72. | 89815 | 0.081% | 0.19%(-0.106)#72 | 0.61%(-0.524)#18,102 |
| 73. | 89104 | 0.079% | 0.19%(-0.108)#73 | 0.61%(-0.527)#18,140 |
| 74. | 89102 | 0.075% | 0.19%(-0.112)#74 | 0.61%(-0.531)#18,211 |
| 75. | 89012 | 0.074% | 0.19%(-0.113)#75 | 0.61%(-0.532)#18,236 |
| 76. | 89144 | 0.072% | 0.19%(-0.114)#76 | 0.61%(-0.533)#18,258 |
| 77. | 89074 | 0.072% | 0.19%(-0.115)#77 | 0.61%(-0.534)#18,268 |
| 78. | 89523 | 0.058% | 0.19%(-0.129)#78 | 0.61%(-0.547)#18,514 |
| 79. | 89503 | 0.054% | 0.19%(-0.132)#79 | 0.61%(-0.551)#18,587 |
| 80. | 89139 | 0.046% | 0.19%(-0.141)#80 | 0.61%(-0.559)#18,716 |
| 81. | 89436 | 0.046% | 0.19%(-0.141)#81 | 0.61%(-0.560)#18,725 |
| 82. | 89117 | 0.044% | 0.19%(-0.142)#82 | 0.61%(-0.561)#18,753 |
| 83. | 89084 | 0.040% | 0.19%(-0.146)#83 | 0.61%(-0.565)#18,803 |
| 84. | 89169 | 0.038% | 0.19%(-0.148)#84 | 0.61%(-0.567)#18,834 |
| 85. | 89178 | 0.032% | 0.19%(-0.155)#85 | 0.61%(-0.574)#18,933 |
| 86. | 89032 | 0.031% | 0.19%(-0.155)#86 | 0.61%(-0.574)#18,947 |
| 87. | 89701 | 0.029% | 0.19%(-0.158)#87 | 0.61%(-0.577)#18,974 |
| 88. | 89115 | 0.029% | 0.19%(-0.158)#88 | 0.61%(-0.577)#18,976 |
| 89. | 89031 | 0.026% | 0.19%(-0.161)#89 | 0.61%(-0.580)#19,004 |
| 90. | 89410 | 0.020% | 0.19%(-0.166)#90 | 0.61%(-0.585)#19,072 |
| 91. | 89123 | 0.016% | 0.19%(-0.171)#91 | 0.61%(-0.590)#19,109 |
1
2Common Questions
What are the Top 10 Zip Codes with the Highest Percentage of Population Employed in Farming, Fishing & Forestry in Nevada?
Top 10 Zip Codes with the Highest Percentage of Population Employed in Farming, Fishing & Forestry in Nevada are:
What zip code has the Highest Percentage of Population Employed in Farming, Fishing & Forestry in Nevada?
89425 has the Highest Percentage of Population Employed in Farming, Fishing & Forestry in Nevada with 29.8%.
What is the Percentage of Population Employed in Farming, Fishing & Forestry in the State of Nevada?
Percentage of Population Employed in Farming, Fishing & Forestry in Nevada is 0.19%.
What is the Percentage of Population Employed in Farming, Fishing & Forestry in the United States?
Percentage of Population Employed in Farming, Fishing & Forestry in the United States is 0.61%.