Zip Codes with the Highest Percentage of Population Employed in Computer & Mathematics in Missoula, MT
RELATED REPORTS & OPTIONS
Computer & Mathematics
Missoula
Compare Zip Codes
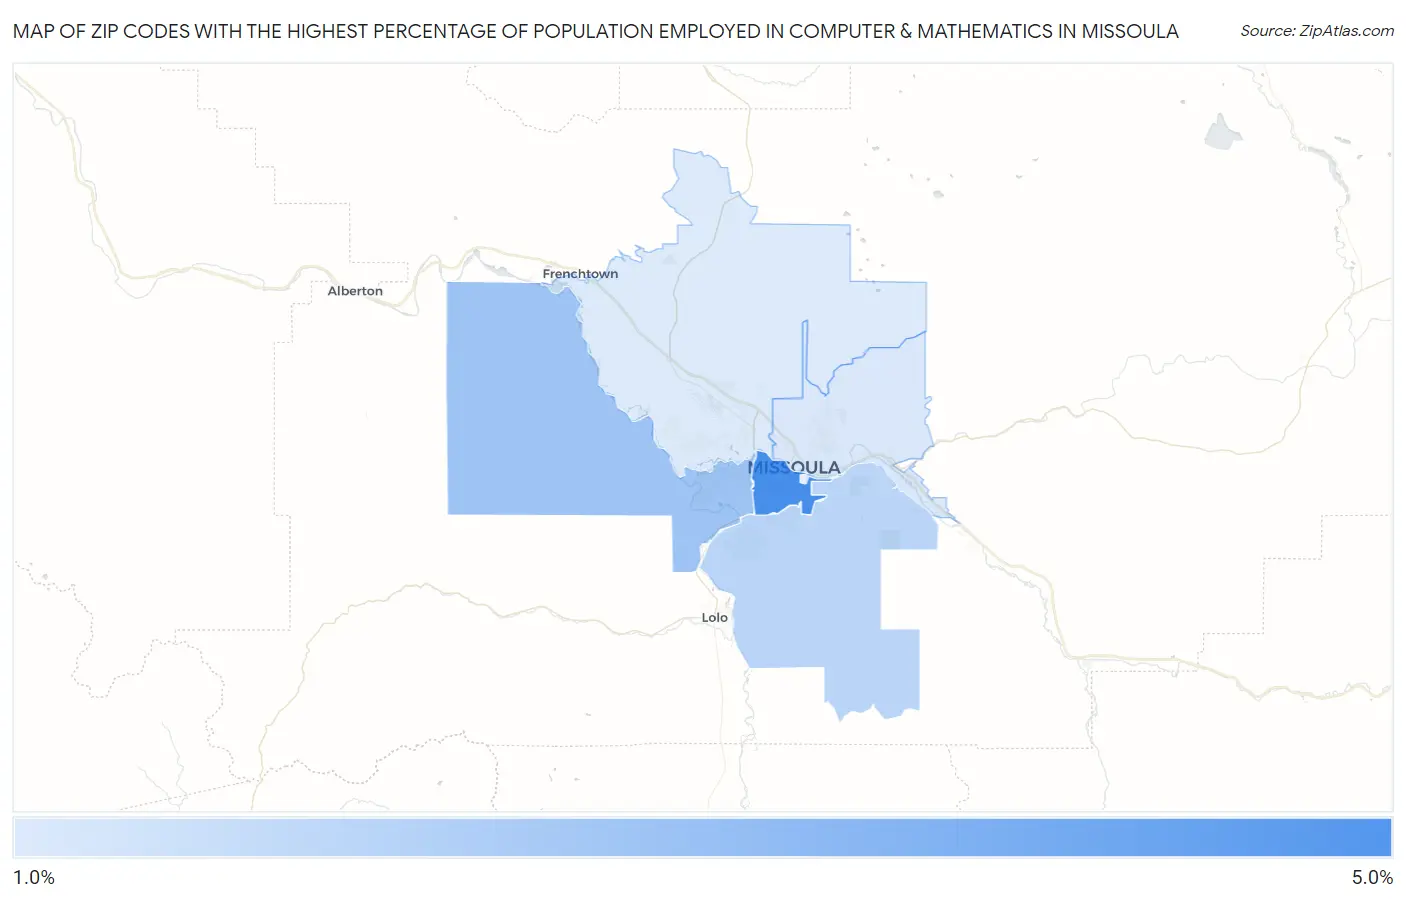
Map of Zip Codes with the Highest Percentage of Population Employed in Computer & Mathematics in Missoula
1.5%
4.3%
Zip Codes with the Highest Percentage of Population Employed in Computer & Mathematics in Missoula, MT
| Zip Code | % Employed | vs State | vs National | |
| 1. | 59801 | 4.3% | 2.2%(+2.16)#16 | 3.5%(+0.809)#4,371 |
| 2. | 59804 | 2.7% | 2.2%(+0.508)#43 | 3.5%(-0.841)#8,906 |
| 3. | 59803 | 2.1% | 2.2%(-0.035)#55 | 3.5%(-1.38)#11,167 |
| 4. | 59802 | 1.5% | 2.2%(-0.633)#74 | 3.5%(-1.98)#14,135 |
| 5. | 59808 | 1.5% | 2.2%(-0.667)#75 | 3.5%(-2.02)#14,324 |
1
Common Questions
What are the Top 5 Zip Codes with the Highest Percentage of Population Employed in Computer & Mathematics in Missoula, MT?
Top 5 Zip Codes with the Highest Percentage of Population Employed in Computer & Mathematics in Missoula, MT are:
What zip code has the Highest Percentage of Population Employed in Computer & Mathematics in Missoula, MT?
59801 has the Highest Percentage of Population Employed in Computer & Mathematics in Missoula, MT with 4.3%.
What is the Percentage of Population Employed in Computer & Mathematics in Missoula, MT?
Percentage of Population Employed in Computer & Mathematics in Missoula is 2.9%.
What is the Percentage of Population Employed in Computer & Mathematics in Montana?
Percentage of Population Employed in Computer & Mathematics in Montana is 2.2%.
What is the Percentage of Population Employed in Computer & Mathematics in the United States?
Percentage of Population Employed in Computer & Mathematics in the United States is 3.5%.