Zip Codes with the Highest Percentage of Population Employed in Computer & Mathematics in Billings, MT
RELATED REPORTS & OPTIONS
Computer & Mathematics
Billings
Compare Zip Codes
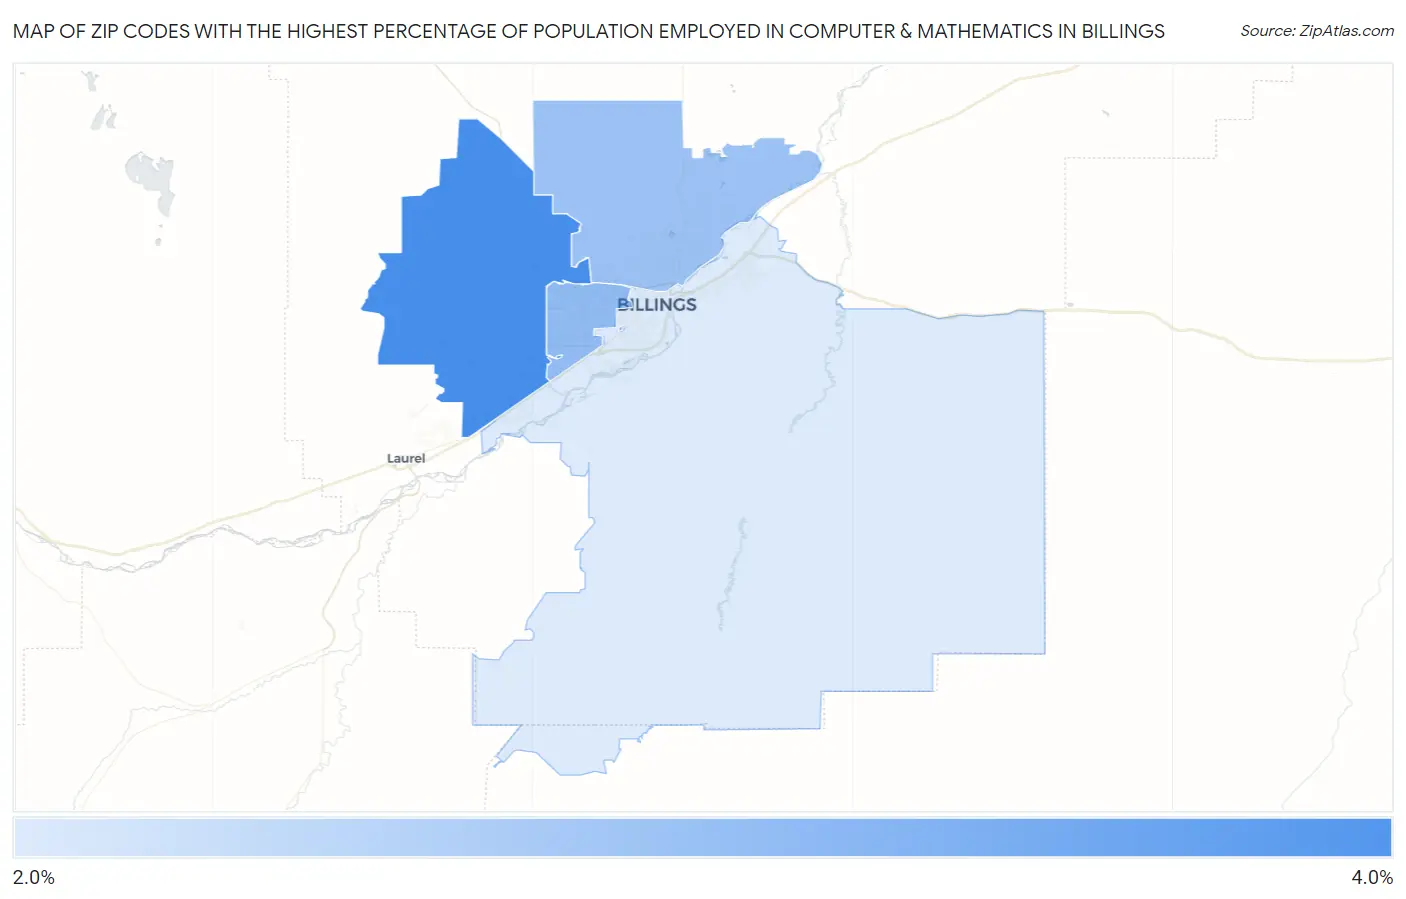
Map of Zip Codes with the Highest Percentage of Population Employed in Computer & Mathematics in Billings
2.1%
3.1%
Zip Codes with the Highest Percentage of Population Employed in Computer & Mathematics in Billings, MT
| Zip Code | % Employed | vs State | vs National | |
| 1. | 59106 | 3.1% | 2.2%(+0.960)#34 | 3.5%(-0.389)#7,309 |
| 2. | 59102 | 2.6% | 2.2%(+0.458)#45 | 3.5%(-0.892)#9,092 |
| 3. | 59105 | 2.6% | 2.2%(+0.401)#48 | 3.5%(-0.949)#9,309 |
| 4. | 59101 | 2.1% | 2.2%(-0.060)#57 | 3.5%(-1.41)#11,278 |
1
Common Questions
What are the Top 3 Zip Codes with the Highest Percentage of Population Employed in Computer & Mathematics in Billings, MT?
Top 3 Zip Codes with the Highest Percentage of Population Employed in Computer & Mathematics in Billings, MT are:
What zip code has the Highest Percentage of Population Employed in Computer & Mathematics in Billings, MT?
59106 has the Highest Percentage of Population Employed in Computer & Mathematics in Billings, MT with 3.1%.
What is the Percentage of Population Employed in Computer & Mathematics in Billings, MT?
Percentage of Population Employed in Computer & Mathematics in Billings is 2.5%.
What is the Percentage of Population Employed in Computer & Mathematics in Montana?
Percentage of Population Employed in Computer & Mathematics in Montana is 2.2%.
What is the Percentage of Population Employed in Computer & Mathematics in the United States?
Percentage of Population Employed in Computer & Mathematics in the United States is 3.5%.