Zip Codes with the Highest Percentage of Population Employed in Legal Services & Support in Saint Clair Shores, MI
RELATED REPORTS & OPTIONS
Legal Services & Support
Saint Clair Shores
Compare Zip Codes
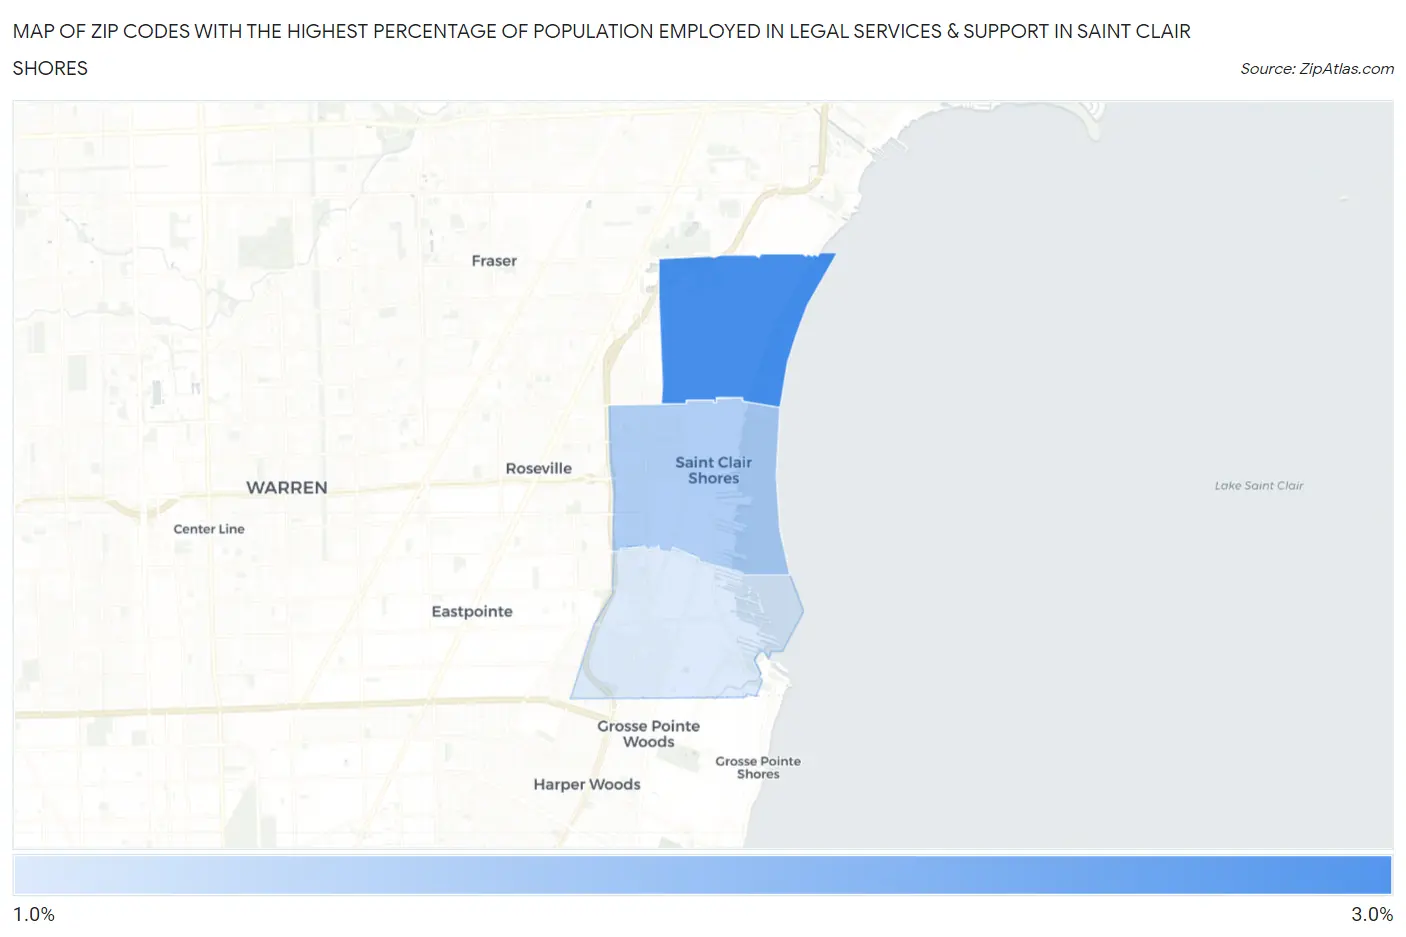
Map of Zip Codes with the Highest Percentage of Population Employed in Legal Services & Support in Saint Clair Shores
1.2%
2.7%
Zip Codes with the Highest Percentage of Population Employed in Legal Services & Support in Saint Clair Shores, MI
| Zip Code | % Employed | vs State | vs National | |
| 1. | 48082 | 2.7% | 0.89%(+1.81)#29 | 1.2%(+1.52)#2,204 |
| 2. | 48081 | 1.6% | 0.89%(+0.739)#94 | 1.2%(+0.441)#4,597 |
| 3. | 48080 | 1.2% | 0.89%(+0.305)#154 | 1.2%(+0.007)#6,559 |
1
Common Questions
What are the Top Zip Codes with the Highest Percentage of Population Employed in Legal Services & Support in Saint Clair Shores, MI?
Top Zip Codes with the Highest Percentage of Population Employed in Legal Services & Support in Saint Clair Shores, MI are:
What zip code has the Highest Percentage of Population Employed in Legal Services & Support in Saint Clair Shores, MI?
48082 has the Highest Percentage of Population Employed in Legal Services & Support in Saint Clair Shores, MI with 2.7%.
What is the Percentage of Population Employed in Legal Services & Support in Michigan?
Percentage of Population Employed in Legal Services & Support in Michigan is 0.89%.
What is the Percentage of Population Employed in Legal Services & Support in the United States?
Percentage of Population Employed in Legal Services & Support in the United States is 1.2%.