Zip Codes with the Highest Percentage of Population Employed in Administrative & Support Services in Howell, MI
RELATED REPORTS & OPTIONS
Administrative & Support Services
Howell
Compare Zip Codes
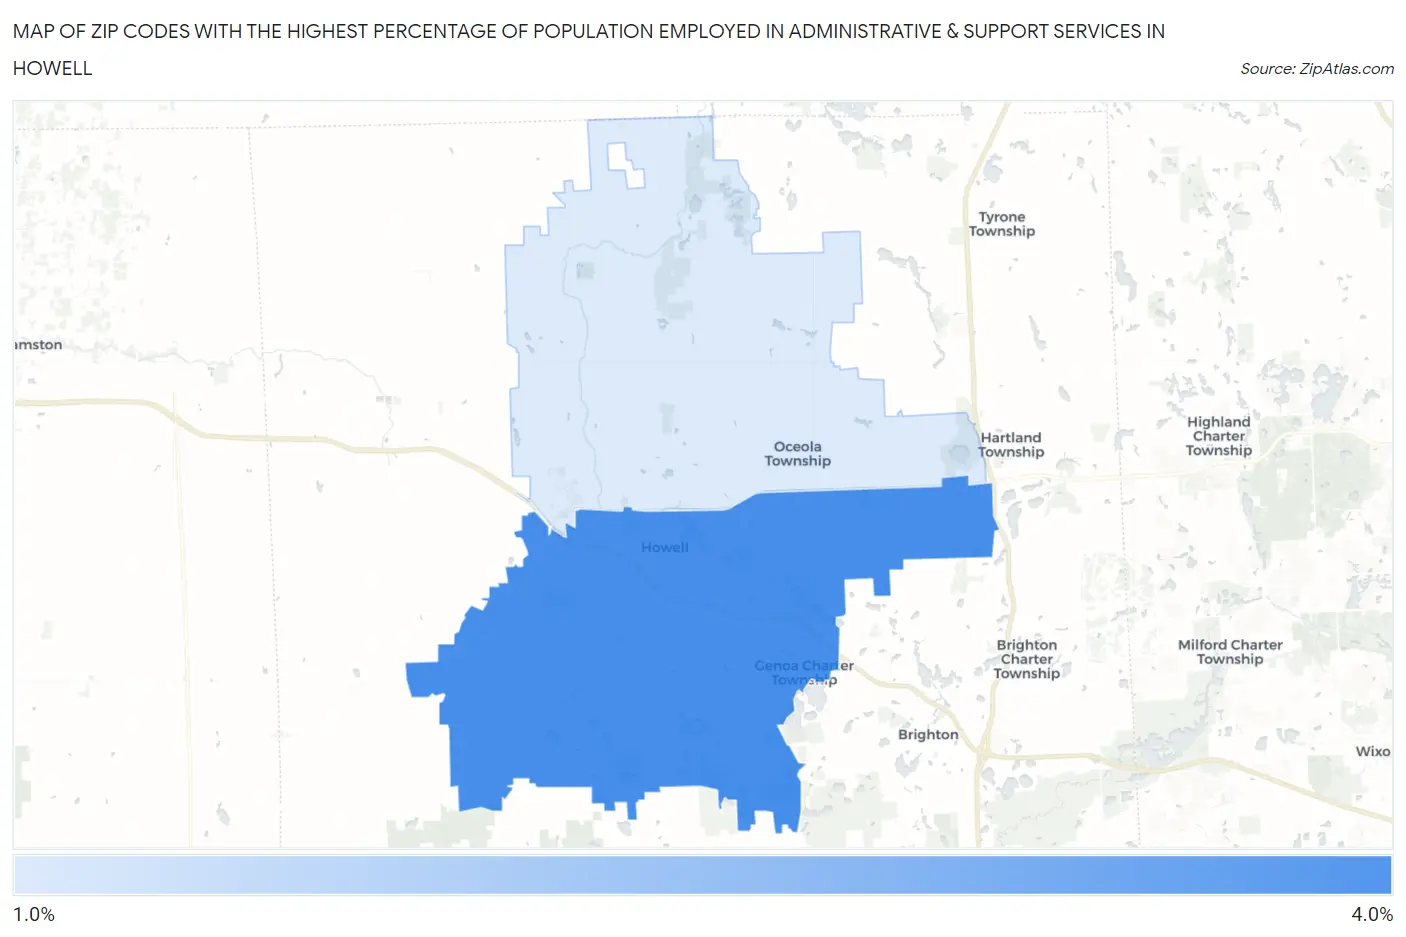
Map of Zip Codes with the Highest Percentage of Population Employed in Administrative & Support Services in Howell
1.8%
3.2%
Zip Codes with the Highest Percentage of Population Employed in Administrative & Support Services in Howell, MI
| Zip Code | % Employed | vs State | vs National | |
| 1. | 48843 | 3.2% | 3.7%(-0.509)#472 | 4.1%(-0.931)#14,381 |
| 2. | 48855 | 1.8% | 3.7%(-1.96)#765 | 4.1%(-2.38)#21,640 |
1
Common Questions
What are the Top Zip Codes with the Highest Percentage of Population Employed in Administrative & Support Services in Howell, MI?
Top Zip Codes with the Highest Percentage of Population Employed in Administrative & Support Services in Howell, MI are:
What zip code has the Highest Percentage of Population Employed in Administrative & Support Services in Howell, MI?
48843 has the Highest Percentage of Population Employed in Administrative & Support Services in Howell, MI with 3.2%.
What is the Percentage of Population Employed in Administrative & Support Services in Howell, MI?
Percentage of Population Employed in Administrative & Support Services in Howell is 1.4%.
What is the Percentage of Population Employed in Administrative & Support Services in Michigan?
Percentage of Population Employed in Administrative & Support Services in Michigan is 3.7%.
What is the Percentage of Population Employed in Administrative & Support Services in the United States?
Percentage of Population Employed in Administrative & Support Services in the United States is 4.1%.