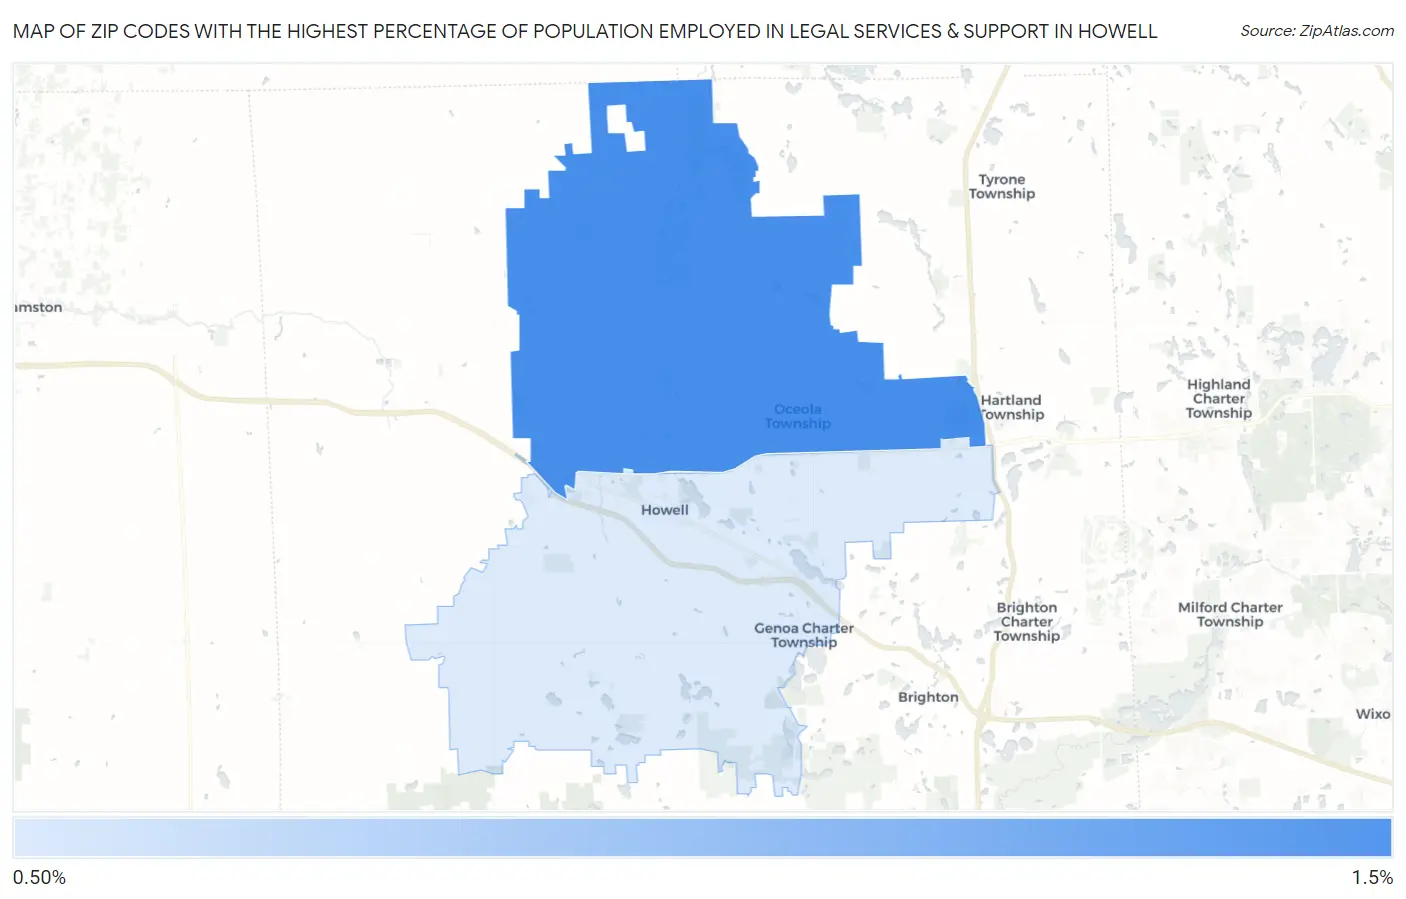
Zip Codes with the Highest Percentage of Population Employed in Legal Services & Support in Howell, MI
RELATED REPORTS & OPTIONS
Legal Services & Support
Howell
Compare Zip Codes
Map of Zip Codes with the Highest Percentage of Population Employed in Legal Services & Support in Howell
0.63%
1.1%
Zip Codes with the Highest Percentage of Population Employed in Legal Services & Support in Howell, MI
| Zip Code | % Employed | vs State | vs National | |
| 1. | 48855 | 1.1% | 0.89%(+0.210)#175 | 1.2%(-0.088)#7,202 |
| 2. | 48843 | 0.63% | 0.89%(-0.251)#324 | 1.2%(-0.549)#11,075 |
1
Common Questions
What are the Top Zip Codes with the Highest Percentage of Population Employed in Legal Services & Support in Howell, MI?
Top Zip Codes with the Highest Percentage of Population Employed in Legal Services & Support in Howell, MI are:
What zip code has the Highest Percentage of Population Employed in Legal Services & Support in Howell, MI?
48855 has the Highest Percentage of Population Employed in Legal Services & Support in Howell, MI with 1.1%.
What is the Percentage of Population Employed in Legal Services & Support in Howell, MI?
Percentage of Population Employed in Legal Services & Support in Howell is 1.1%.
What is the Percentage of Population Employed in Legal Services & Support in Michigan?
Percentage of Population Employed in Legal Services & Support in Michigan is 0.89%.
What is the Percentage of Population Employed in Legal Services & Support in the United States?
Percentage of Population Employed in Legal Services & Support in the United States is 1.2%.