Zip Codes with the Highest Percentage of Population Employed in Education Instruction & Library in North Carolina
RELATED REPORTS & OPTIONS
Education Instruction & Library
North Carolina
Compare Zip Codes
Map of Zip Codes with the Highest Percentage of Population Employed in Education Instruction & Library in North Carolina
0.0%
100.0%
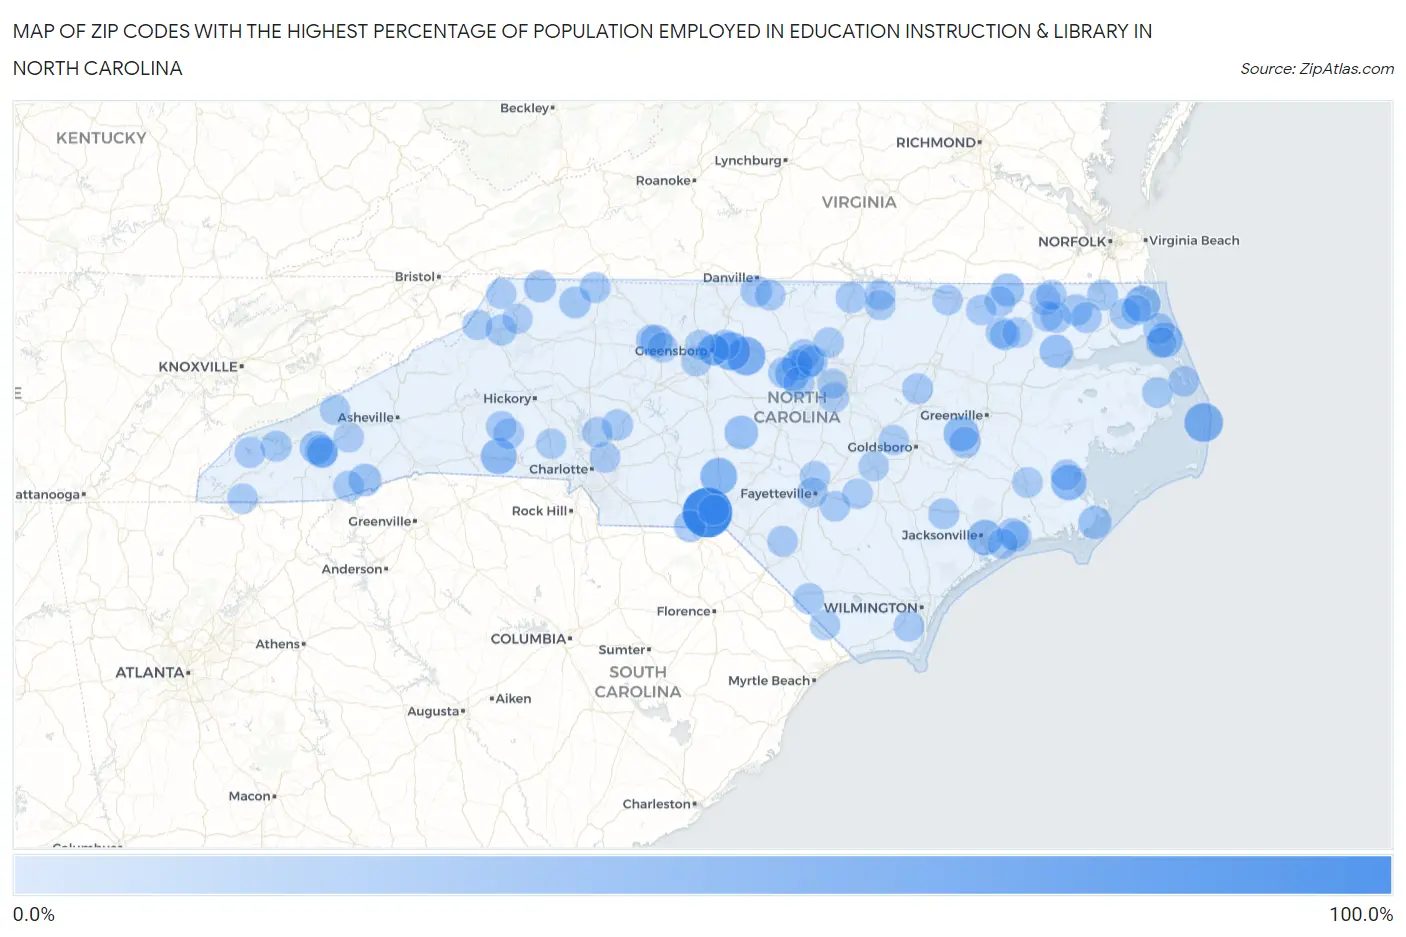
Zip Codes with the Highest Percentage of Population Employed in Education Instruction & Library in North Carolina
| Zip Code | % Employed | vs State | vs National | |
| 1. | 28330 | 100.0% | 6.2% (+93.8)#1 | 6.2% (+93.8)#1 |
| 2. | 27982 | 48.0% | 6.2% (+41.8)#2 | 6.2% (+41.8)#87 |
| 3. | 27201 | 46.3% | 6.2% (+40.1)#3 | 6.2% (+40.2)#93 |
| 4. | 27342 | 45.5% | 6.2% (+39.2)#4 | 6.2% (+39.3)#95 |
| 5. | 28367 | 38.9% | 6.2% (+32.7)#5 | 6.2% (+32.7)#138 |
| 6. | 27956 | 35.4% | 6.2% (+29.2)#6 | 6.2% (+29.2)#175 |
| 7. | 28089 | 35.0% | 6.2% (+28.8)#7 | 6.2% (+28.8)#183 |
| 8. | 28556 | 33.2% | 6.2% (+27.0)#8 | 6.2% (+27.0)#209 |
| 9. | 28543 | 32.4% | 6.2% (+26.2)#9 | 6.2% (+26.2)#219 |
| 10. | 28554 | 31.8% | 6.2% (+25.6)#10 | 6.2% (+25.6)#234 |
| 11. | 27964 | 31.0% | 6.2% (+24.7)#11 | 6.2% (+24.8)#252 |
| 12. | 27510 | 26.5% | 6.2% (+20.3)#12 | 6.2% (+20.3)#326 |
| 13. | 27259 | 24.4% | 6.2% (+18.2)#13 | 6.2% (+18.3)#390 |
| 14. | 27708 | 23.4% | 6.2% (+17.2)#14 | 6.2% (+17.2)#444 |
| 15. | 27957 | 23.1% | 6.2% (+16.9)#15 | 6.2% (+16.9)#459 |
| 16. | 28725 | 22.2% | 6.2% (+16.0)#16 | 6.2% (+16.0)#503 |
| 17. | 27862 | 22.1% | 6.2% (+15.9)#17 | 6.2% (+15.9)#510 |
| 18. | 28581 | 22.1% | 6.2% (+15.9)#18 | 6.2% (+15.9)#511 |
| 19. | 28788 | 21.6% | 6.2% (+15.4)#19 | 6.2% (+15.4)#533 |
| 20. | 28772 | 20.2% | 6.2% (+14.0)#20 | 6.2% (+14.1)#627 |
| 21. | 27109 | 19.4% | 6.2% (+13.2)#21 | 6.2% (+13.2)#704 |
| 22. | 28663 | 18.5% | 6.2% (+12.3)#22 | 6.2% (+12.3)#783 |
| 23. | 28102 | 16.3% | 6.2% (+10.1)#23 | 6.2% (+10.1)#1,055 |
| 24. | 28668 | 15.8% | 6.2% (+9.58)#24 | 6.2% (+9.61)#1,134 |
| 25. | 27705 | 15.2% | 6.2% (+9.02)#25 | 6.2% (+9.05)#1,246 |
| 26. | 27946 | 15.2% | 6.2% (+9.02)#26 | 6.2% (+9.04)#1,247 |
| 27. | 27411 | 14.8% | 6.2% (+8.60)#27 | 6.2% (+8.62)#1,320 |
| 28. | 27315 | 14.3% | 6.2% (+8.12)#28 | 6.2% (+8.15)#1,439 |
| 29. | 28538 | 14.2% | 6.2% (+8.04)#29 | 6.2% (+8.07)#1,470 |
| 30. | 27514 | 14.0% | 6.2% (+7.79)#30 | 6.2% (+7.82)#1,537 |
| 31. | 28582 | 13.8% | 6.2% (+7.59)#31 | 6.2% (+7.61)#1,609 |
| 32. | 27582 | 13.8% | 6.2% (+7.55)#32 | 6.2% (+7.57)#1,630 |
| 33. | 27947 | 13.4% | 6.2% (+7.18)#33 | 6.2% (+7.21)#1,754 |
| 34. | 28088 | 13.1% | 6.2% (+6.86)#34 | 6.2% (+6.89)#1,873 |
| 35. | 27516 | 13.0% | 6.2% (+6.81)#35 | 6.2% (+6.83)#1,896 |
| 36. | 27872 | 12.9% | 6.2% (+6.69)#36 | 6.2% (+6.72)#1,948 |
| 37. | 28702 | 12.9% | 6.2% (+6.65)#37 | 6.2% (+6.67)#1,958 |
| 38. | 28518 | 12.8% | 6.2% (+6.58)#38 | 6.2% (+6.61)#1,978 |
| 39. | 27976 | 12.8% | 6.2% (+6.56)#39 | 6.2% (+6.59)#1,985 |
| 40. | 27919 | 12.8% | 6.2% (+6.56)#40 | 6.2% (+6.59)#1,987 |
| 41. | 27024 | 12.8% | 6.2% (+6.55)#41 | 6.2% (+6.57)#1,990 |
| 42. | 28774 | 12.8% | 6.2% (+6.54)#42 | 6.2% (+6.57)#1,994 |
| 43. | 28430 | 12.7% | 6.2% (+6.50)#43 | 6.2% (+6.53)#2,016 |
| 44. | 27517 | 12.5% | 6.2% (+6.33)#44 | 6.2% (+6.36)#2,103 |
| 45. | 28607 | 12.5% | 6.2% (+6.32)#45 | 6.2% (+6.34)#2,107 |
| 46. | 27896 | 12.4% | 6.2% (+6.15)#46 | 6.2% (+6.17)#2,199 |
| 47. | 27921 | 12.3% | 6.2% (+6.12)#47 | 6.2% (+6.15)#2,220 |
| 48. | 27953 | 12.0% | 6.2% (+5.84)#48 | 6.2% (+5.86)#2,357 |
| 49. | 27212 | 11.8% | 6.2% (+5.64)#49 | 6.2% (+5.66)#2,479 |
| 50. | 28771 | 11.8% | 6.2% (+5.59)#50 | 6.2% (+5.62)#2,501 |
| 51. | 27942 | 11.8% | 6.2% (+5.56)#51 | 6.2% (+5.58)#2,520 |
| 52. | 28587 | 11.7% | 6.2% (+5.46)#52 | 6.2% (+5.48)#2,594 |
| 53. | 28090 | 11.5% | 6.2% (+5.28)#53 | 6.2% (+5.31)#2,703 |
| 54. | 28479 | 11.5% | 6.2% (+5.27)#54 | 6.2% (+5.30)#2,711 |
| 55. | 28372 | 11.4% | 6.2% (+5.22)#55 | 6.2% (+5.24)#2,765 |
| 56. | 28519 | 11.2% | 6.2% (+5.03)#56 | 6.2% (+5.06)#2,894 |
| 57. | 28379 | 11.2% | 6.2% (+4.97)#57 | 6.2% (+5.00)#2,927 |
| 58. | 28584 | 11.0% | 6.2% (+4.75)#58 | 6.2% (+4.77)#3,088 |
| 59. | 27701 | 10.9% | 6.2% (+4.73)#59 | 6.2% (+4.76)#3,105 |
| 60. | 28020 | 10.9% | 6.2% (+4.70)#60 | 6.2% (+4.73)#3,124 |
| 61. | 27106 | 10.8% | 6.2% (+4.62)#61 | 6.2% (+4.64)#3,190 |
| 62. | 27553 | 10.8% | 6.2% (+4.61)#62 | 6.2% (+4.63)#3,195 |
| 63. | 27935 | 10.8% | 6.2% (+4.57)#63 | 6.2% (+4.59)#3,226 |
| 64. | 28223 | 10.8% | 6.2% (+4.55)#64 | 6.2% (+4.58)#3,235 |
| 65. | 27847 | 10.6% | 6.2% (+4.43)#65 | 6.2% (+4.45)#3,327 |
| 66. | 27922 | 10.6% | 6.2% (+4.40)#66 | 6.2% (+4.43)#3,350 |
| 67. | 27820 | 10.6% | 6.2% (+4.39)#67 | 6.2% (+4.41)#3,366 |
| 68. | 27966 | 10.5% | 6.2% (+4.27)#68 | 6.2% (+4.30)#3,472 |
| 69. | 27981 | 10.5% | 6.2% (+4.26)#69 | 6.2% (+4.28)#3,482 |
| 70. | 28036 | 10.4% | 6.2% (+4.23)#70 | 6.2% (+4.26)#3,511 |
| 71. | 28385 | 10.4% | 6.2% (+4.17)#71 | 6.2% (+4.19)#3,570 |
| 72. | 28779 | 10.4% | 6.2% (+4.17)#72 | 6.2% (+4.19)#3,577 |
| 73. | 27509 | 10.3% | 6.2% (+4.14)#73 | 6.2% (+4.16)#3,597 |
| 74. | 28909 | 10.3% | 6.2% (+4.09)#74 | 6.2% (+4.12)#3,642 |
| 75. | 27845 | 10.3% | 6.2% (+4.07)#75 | 6.2% (+4.09)#3,668 |
| 76. | 28539 | 10.3% | 6.2% (+4.05)#76 | 6.2% (+4.07)#3,686 |
| 77. | 28077 | 10.2% | 6.2% (+4.00)#77 | 6.2% (+4.02)#3,735 |
| 78. | 27969 | 10.2% | 6.2% (+3.98)#78 | 6.2% (+4.00)#3,750 |
| 79. | 27870 | 10.2% | 6.2% (+3.96)#79 | 6.2% (+3.99)#3,758 |
| 80. | 28312 | 10.2% | 6.2% (+3.96)#80 | 6.2% (+3.99)#3,760 |
| 81. | 27805 | 10.1% | 6.2% (+3.94)#81 | 6.2% (+3.96)#3,782 |
| 82. | 28311 | 10.1% | 6.2% (+3.87)#82 | 6.2% (+3.90)#3,844 |
| 83. | 27401 | 10.1% | 6.2% (+3.86)#83 | 6.2% (+3.88)#3,862 |
| 84. | 28463 | 10.0% | 6.2% (+3.83)#84 | 6.2% (+3.85)#3,891 |
| 85. | 28366 | 10.0% | 6.2% (+3.77)#85 | 6.2% (+3.80)#3,956 |
| 86. | 27110 | 9.9% | 6.2% (+3.68)#86 | 6.2% (+3.70)#4,072 |
| 87. | 27973 | 9.9% | 6.2% (+3.67)#87 | 6.2% (+3.69)#4,079 |
| 88. | 28679 | 9.9% | 6.2% (+3.66)#88 | 6.2% (+3.69)#4,088 |
| 89. | 27301 | 9.7% | 6.2% (+3.51)#89 | 6.2% (+3.53)#4,268 |
| 90. | 27606 | 9.7% | 6.2% (+3.47)#90 | 6.2% (+3.50)#4,302 |
| 91. | 28305 | 9.7% | 6.2% (+3.47)#91 | 6.2% (+3.49)#4,312 |
| 92. | 27556 | 9.6% | 6.2% (+3.38)#92 | 6.2% (+3.41)#4,420 |
| 93. | 27282 | 9.5% | 6.2% (+3.27)#93 | 6.2% (+3.30)#4,544 |
| 94. | 27607 | 9.4% | 6.2% (+3.22)#94 | 6.2% (+3.24)#4,612 |
| 95. | 28615 | 9.4% | 6.2% (+3.18)#95 | 6.2% (+3.21)#4,657 |
| 96. | 28786 | 9.4% | 6.2% (+3.16)#96 | 6.2% (+3.19)#4,689 |
| 97. | 28785 | 9.3% | 6.2% (+3.14)#97 | 6.2% (+3.16)#4,716 |
| 98. | 27569 | 9.3% | 6.2% (+3.07)#98 | 6.2% (+3.09)#4,832 |
| 99. | 28626 | 9.2% | 6.2% (+3.04)#99 | 6.2% (+3.07)#4,873 |
| 100. | 27410 | 9.2% | 6.2% (+3.04)#100 | 6.2% (+3.06)#4,876 |
Common Questions
What are the Top 10 Zip Codes with the Highest Percentage of Population Employed in Education Instruction & Library in North Carolina?
Top 10 Zip Codes with the Highest Percentage of Population Employed in Education Instruction & Library in North Carolina are:
What zip code has the Highest Percentage of Population Employed in Education Instruction & Library in North Carolina?
28330 has the Highest Percentage of Population Employed in Education Instruction & Library in North Carolina with 100.0%.
What is the Percentage of Population Employed in Education Instruction & Library in the State of North Carolina?
Percentage of Population Employed in Education Instruction & Library in North Carolina is 6.2%.
What is the Percentage of Population Employed in Education Instruction & Library in the United States?
Percentage of Population Employed in Education Instruction & Library in the United States is 6.2%.