Zip Codes with the Highest Percentage of Population Employed in Education Instruction & Library in Missouri
RELATED REPORTS & OPTIONS
Education Instruction & Library
Missouri
Compare Zip Codes
Map of Zip Codes with the Highest Percentage of Population Employed in Education Instruction & Library in Missouri
0.0%
60.0%
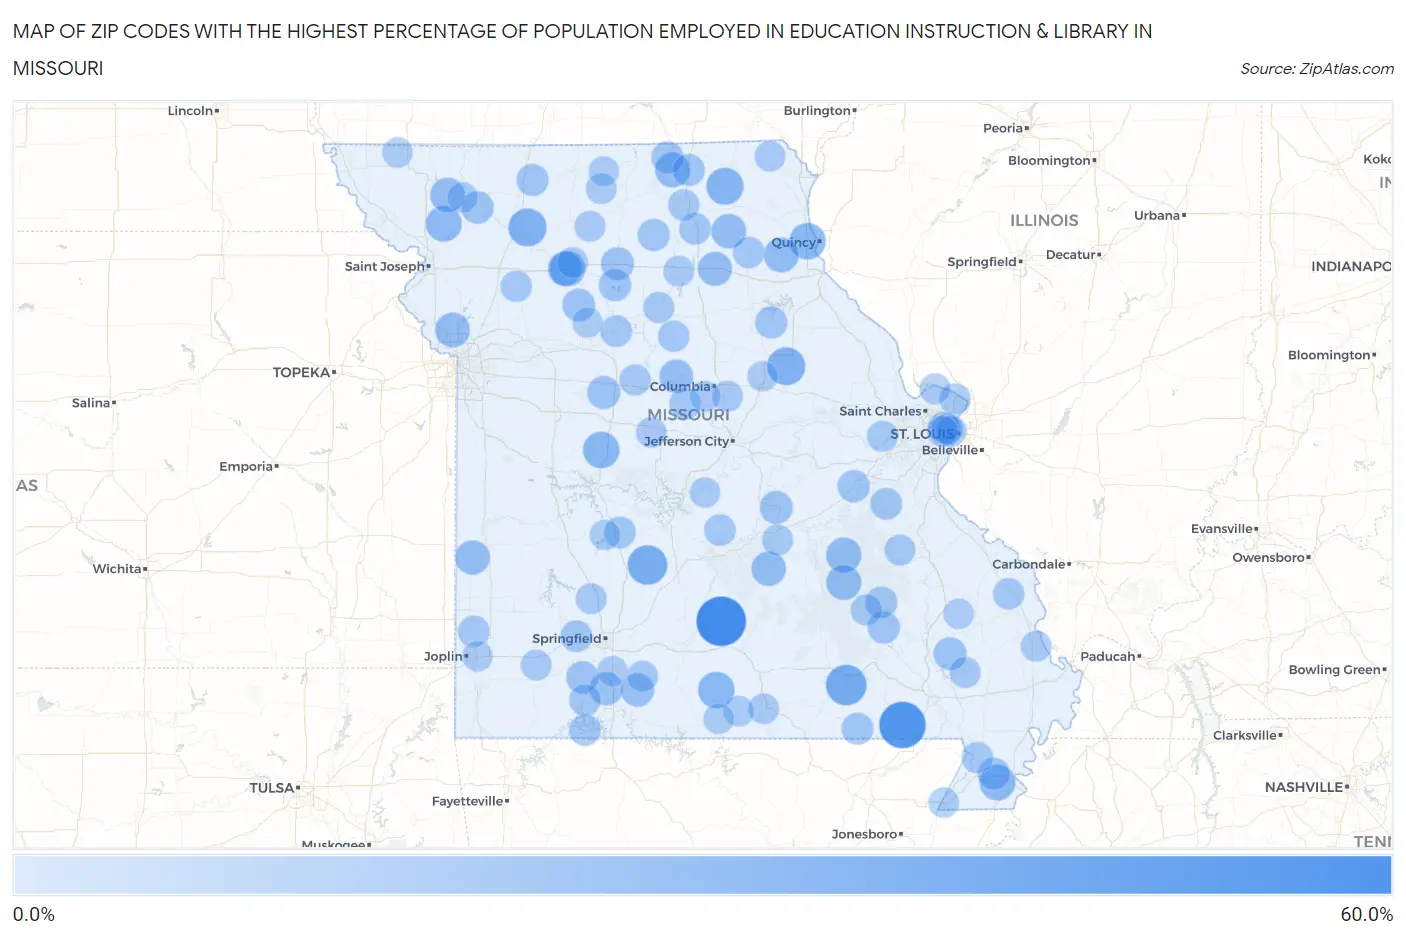
Zip Codes with the Highest Percentage of Population Employed in Education Instruction & Library in Missouri
| Zip Code | % Employed | vs State | vs National | |
| 1. | 65660 | 57.6% | 6.1% (+51.5)#1 | 6.2% (+51.4)#43 |
| 2. | 63955 | 50.0% | 6.1% (+43.9)#2 | 6.2% (+43.8)#72 |
| 3. | 63941 | 35.1% | 6.1% (+29.0)#3 | 6.2% (+28.9)#181 |
| 4. | 65783 | 32.8% | 6.1% (+26.7)#4 | 6.2% (+26.7)#215 |
| 5. | 65264 | 28.8% | 6.1% (+22.7)#5 | 6.2% (+22.6)#277 |
| 6. | 64647 | 28.8% | 6.1% (+22.7)#6 | 6.2% (+22.6)#278 |
| 7. | 63531 | 26.6% | 6.1% (+20.5)#7 | 6.2% (+20.4)#323 |
| 8. | 65335 | 25.2% | 6.1% (+19.1)#8 | 6.2% (+19.0)#355 |
| 9. | 63471 | 25.1% | 6.1% (+19.0)#9 | 6.2% (+18.9)#361 |
| 10. | 65638 | 25.0% | 6.1% (+18.9)#10 | 6.2% (+18.8)#362 |
| 11. | 64480 | 23.6% | 6.1% (+17.5)#11 | 6.2% (+17.4)#429 |
| 12. | 63826 | 23.5% | 6.1% (+17.4)#12 | 6.2% (+17.3)#435 |
| 13. | 64686 | 23.0% | 6.1% (+16.9)#13 | 6.2% (+16.8)#466 |
| 14. | 65456 | 21.8% | 6.1% (+15.7)#14 | 6.2% (+15.7)#521 |
| 15. | 65440 | 21.5% | 6.1% (+15.4)#15 | 6.2% (+15.3)#539 |
| 16. | 63463 | 21.3% | 6.1% (+15.1)#16 | 6.2% (+15.1)#554 |
| 17. | 63567 | 21.2% | 6.1% (+15.1)#17 | 6.2% (+15.0)#560 |
| 18. | 64164 | 21.1% | 6.1% (+14.9)#18 | 6.2% (+14.9)#569 |
| 19. | 63460 | 20.8% | 6.1% (+14.7)#19 | 6.2% (+14.6)#581 |
| 20. | 64433 | 20.7% | 6.1% (+14.6)#20 | 6.2% (+14.5)#594 |
| 21. | 64771 | 20.3% | 6.1% (+14.2)#21 | 6.2% (+14.2)#618 |
| 22. | 65462 | 20.3% | 6.1% (+14.1)#22 | 6.2% (+14.1)#626 |
| 23. | 64664 | 20.1% | 6.1% (+14.0)#23 | 6.2% (+14.0)#637 |
| 24. | 63431 | 19.4% | 6.1% (+13.3)#24 | 6.2% (+13.2)#703 |
| 25. | 65274 | 18.5% | 6.1% (+12.3)#25 | 6.2% (+12.3)#791 |
| 26. | 65754 | 17.6% | 6.1% (+11.5)#26 | 6.2% (+11.5)#881 |
| 27. | 65657 | 17.6% | 6.1% (+11.5)#27 | 6.2% (+11.4)#885 |
| 28. | 65333 | 17.0% | 6.1% (+10.9)#28 | 6.2% (+10.8)#945 |
| 29. | 64651 | 16.9% | 6.1% (+10.8)#29 | 6.2% (+10.7)#960 |
| 30. | 65580 | 16.8% | 6.1% (+10.7)#30 | 6.2% (+10.6)#975 |
| 31. | 63951 | 16.7% | 6.1% (+10.6)#31 | 6.2% (+10.5)#1,001 |
| 32. | 64622 | 16.0% | 6.1% (+9.91)#32 | 6.2% (+9.84)#1,095 |
| 33. | 65675 | 15.8% | 6.1% (+9.68)#33 | 6.2% (+9.61)#1,136 |
| 34. | 64438 | 15.7% | 6.1% (+9.57)#34 | 6.2% (+9.50)#1,152 |
| 35. | 64681 | 15.3% | 6.1% (+9.16)#35 | 6.2% (+9.09)#1,236 |
| 36. | 63079 | 15.2% | 6.1% (+9.10)#36 | 6.2% (+9.03)#1,249 |
| 37. | 63665 | 15.0% | 6.1% (+8.89)#37 | 6.2% (+8.82)#1,280 |
| 38. | 63557 | 14.9% | 6.1% (+8.78)#38 | 6.2% (+8.71)#1,298 |
| 39. | 65282 | 14.9% | 6.1% (+8.78)#39 | 6.2% (+8.71)#1,301 |
| 40. | 63551 | 14.9% | 6.1% (+8.76)#40 | 6.2% (+8.69)#1,305 |
| 41. | 64481 | 14.7% | 6.1% (+8.60)#41 | 6.2% (+8.53)#1,341 |
| 42. | 63827 | 14.6% | 6.1% (+8.44)#42 | 6.2% (+8.37)#1,376 |
| 43. | 63561 | 14.5% | 6.1% (+8.42)#43 | 6.2% (+8.35)#1,380 |
| 44. | 63654 | 14.3% | 6.1% (+8.17)#44 | 6.2% (+8.10)#1,449 |
| 45. | 63942 | 14.1% | 6.1% (+7.99)#45 | 6.2% (+7.92)#1,517 |
| 46. | 65732 | 13.9% | 6.1% (+7.77)#46 | 6.2% (+7.70)#1,577 |
| 47. | 63549 | 13.8% | 6.1% (+7.72)#47 | 6.2% (+7.65)#1,589 |
| 48. | 63071 | 13.7% | 6.1% (+7.62)#48 | 6.2% (+7.55)#1,637 |
| 49. | 65612 | 13.7% | 6.1% (+7.56)#49 | 6.2% (+7.49)#1,651 |
| 50. | 65344 | 13.4% | 6.1% (+7.30)#50 | 6.2% (+7.23)#1,742 |
| 51. | 65452 | 13.4% | 6.1% (+7.30)#51 | 6.2% (+7.23)#1,743 |
| 52. | 63469 | 13.3% | 6.1% (+7.19)#52 | 6.2% (+7.12)#1,788 |
| 53. | 65656 | 13.2% | 6.1% (+7.04)#53 | 6.2% (+6.97)#1,846 |
| 54. | 65681 | 13.1% | 6.1% (+7.00)#54 | 6.2% (+6.93)#1,858 |
| 55. | 63130 | 13.0% | 6.1% (+6.92)#55 | 6.2% (+6.85)#1,890 |
| 56. | 64650 | 13.0% | 6.1% (+6.86)#56 | 6.2% (+6.79)#1,909 |
| 57. | 63769 | 13.0% | 6.1% (+6.84)#57 | 6.2% (+6.77)#1,918 |
| 58. | 65068 | 12.9% | 6.1% (+6.79)#58 | 6.2% (+6.72)#1,947 |
| 59. | 65230 | 12.9% | 6.1% (+6.74)#59 | 6.2% (+6.67)#1,959 |
| 60. | 64849 | 12.7% | 6.1% (+6.56)#60 | 6.2% (+6.49)#2,035 |
| 61. | 63852 | 12.5% | 6.1% (+6.39)#61 | 6.2% (+6.32)#2,112 |
| 62. | 63501 | 12.5% | 6.1% (+6.38)#62 | 6.2% (+6.31)#2,137 |
| 63. | 65347 | 12.4% | 6.1% (+6.31)#63 | 6.2% (+6.24)#2,162 |
| 64. | 63633 | 12.3% | 6.1% (+6.24)#64 | 6.2% (+6.17)#2,205 |
| 65. | 65281 | 12.2% | 6.1% (+6.10)#65 | 6.2% (+6.03)#2,279 |
| 66. | 63386 | 12.1% | 6.1% (+6.03)#66 | 6.2% (+5.96)#2,313 |
| 67. | 63960 | 12.0% | 6.1% (+5.89)#67 | 6.2% (+5.82)#2,386 |
| 68. | 63112 | 12.0% | 6.1% (+5.85)#68 | 6.2% (+5.78)#2,408 |
| 69. | 63332 | 11.8% | 6.1% (+5.73)#69 | 6.2% (+5.66)#2,478 |
| 70. | 65710 | 11.8% | 6.1% (+5.65)#70 | 6.2% (+5.58)#2,518 |
| 71. | 65720 | 11.8% | 6.1% (+5.65)#71 | 6.2% (+5.58)#2,519 |
| 72. | 63648 | 11.7% | 6.1% (+5.63)#72 | 6.2% (+5.56)#2,542 |
| 73. | 65401 | 11.7% | 6.1% (+5.61)#73 | 6.2% (+5.54)#2,556 |
| 74. | 63108 | 11.7% | 6.1% (+5.57)#74 | 6.2% (+5.50)#2,583 |
| 75. | 63780 | 11.6% | 6.1% (+5.48)#75 | 6.2% (+5.41)#2,635 |
| 76. | 64652 | 11.6% | 6.1% (+5.47)#76 | 6.2% (+5.40)#2,644 |
| 77. | 65201 | 11.5% | 6.1% (+5.39)#77 | 6.2% (+5.32)#2,696 |
| 78. | 63105 | 11.5% | 6.1% (+5.34)#78 | 6.2% (+5.27)#2,735 |
| 79. | 65654 | 11.4% | 6.1% (+5.32)#79 | 6.2% (+5.25)#2,760 |
| 80. | 64645 | 11.3% | 6.1% (+5.18)#80 | 6.2% (+5.11)#2,857 |
| 81. | 63534 | 11.3% | 6.1% (+5.17)#81 | 6.2% (+5.10)#2,861 |
| 82. | 64601 | 11.2% | 6.1% (+5.11)#82 | 6.2% (+5.04)#2,901 |
| 83. | 65775 | 11.1% | 6.1% (+4.99)#83 | 6.2% (+4.92)#2,996 |
| 84. | 65203 | 11.1% | 6.1% (+4.97)#84 | 6.2% (+4.90)#3,005 |
| 85. | 63453 | 11.0% | 6.1% (+4.86)#85 | 6.2% (+4.79)#3,074 |
| 86. | 63373 | 10.9% | 6.1% (+4.76)#86 | 6.2% (+4.69)#3,148 |
| 87. | 65354 | 10.8% | 6.1% (+4.66)#87 | 6.2% (+4.59)#3,224 |
| 88. | 65790 | 10.7% | 6.1% (+4.62)#88 | 6.2% (+4.55)#3,250 |
| 89. | 64489 | 10.6% | 6.1% (+4.50)#89 | 6.2% (+4.43)#3,345 |
| 90. | 63655 | 10.6% | 6.1% (+4.49)#90 | 6.2% (+4.41)#3,364 |
| 91. | 65721 | 10.6% | 6.1% (+4.48)#91 | 6.2% (+4.41)#3,372 |
| 92. | 64445 | 10.6% | 6.1% (+4.45)#92 | 6.2% (+4.38)#3,398 |
| 93. | 65760 | 10.5% | 6.1% (+4.41)#93 | 6.2% (+4.34)#3,437 |
| 94. | 63829 | 10.5% | 6.1% (+4.35)#94 | 6.2% (+4.28)#3,487 |
| 95. | 64841 | 10.4% | 6.1% (+4.32)#95 | 6.2% (+4.25)#3,524 |
| 96. | 65082 | 10.4% | 6.1% (+4.29)#96 | 6.2% (+4.22)#3,548 |
| 97. | 64633 | 10.3% | 6.1% (+4.23)#97 | 6.2% (+4.15)#3,607 |
| 98. | 65231 | 10.3% | 6.1% (+4.16)#98 | 6.2% (+4.09)#3,674 |
| 99. | 65668 | 10.2% | 6.1% (+4.14)#99 | 6.2% (+4.07)#3,693 |
| 100. | 64667 | 10.2% | 6.1% (+4.12)#100 | 6.2% (+4.05)#3,700 |
Common Questions
What are the Top 10 Zip Codes with the Highest Percentage of Population Employed in Education Instruction & Library in Missouri?
Top 10 Zip Codes with the Highest Percentage of Population Employed in Education Instruction & Library in Missouri are:
What zip code has the Highest Percentage of Population Employed in Education Instruction & Library in Missouri?
65660 has the Highest Percentage of Population Employed in Education Instruction & Library in Missouri with 57.6%.
What is the Percentage of Population Employed in Education Instruction & Library in the State of Missouri?
Percentage of Population Employed in Education Instruction & Library in Missouri is 6.1%.
What is the Percentage of Population Employed in Education Instruction & Library in the United States?
Percentage of Population Employed in Education Instruction & Library in the United States is 6.2%.