Wilson County, KS Map & Demographics
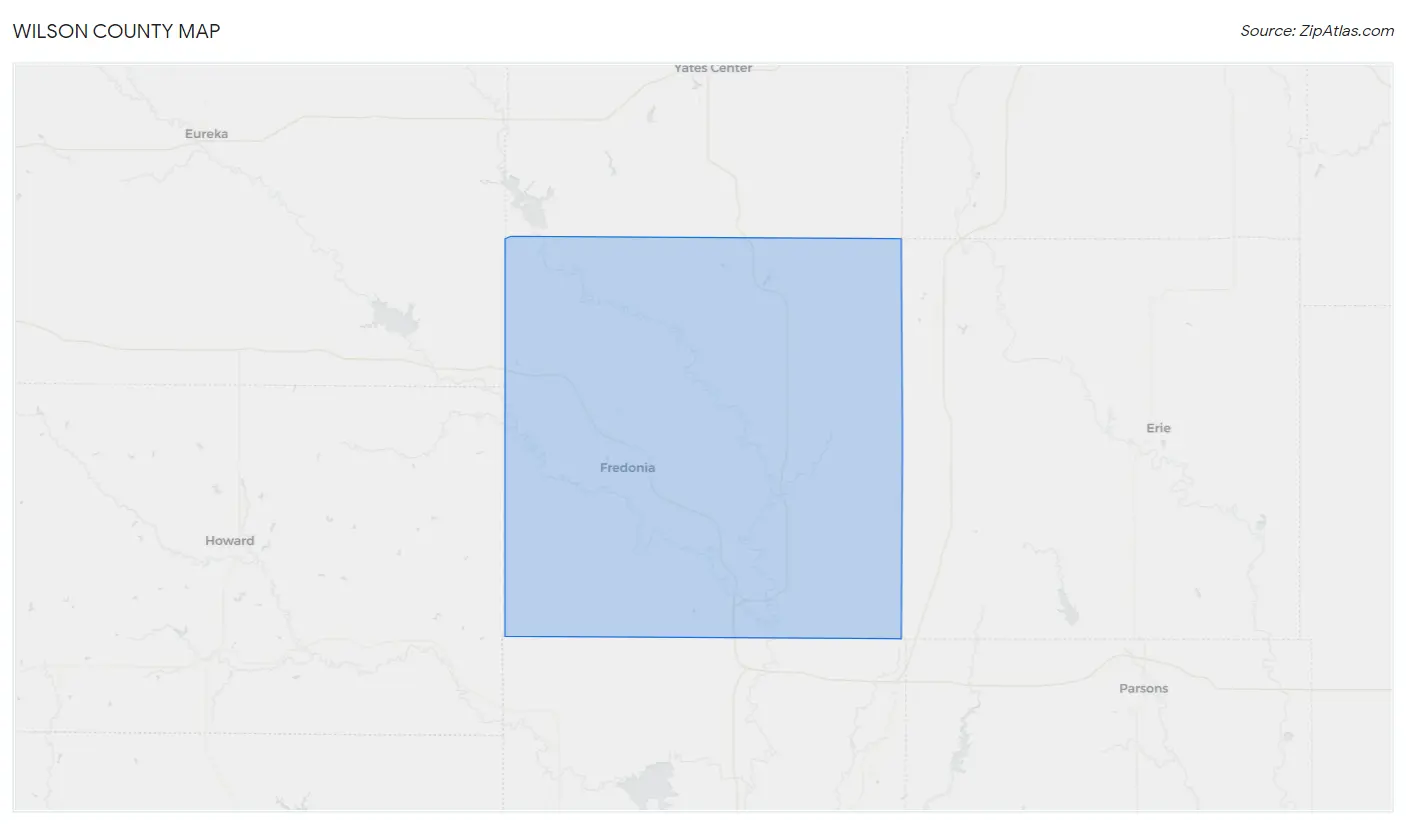
Wilson County Map
Wilson County Overview
$32,008
PER CAPITA INCOME
$69,964
AVG FAMILY INCOME
$55,439
AVG HOUSEHOLD INCOME
36.9%
WAGE / INCOME GAP [ % ]
63.1¢/ $1
WAGE / INCOME GAP [ $ ]
0.48
INEQUALITY / GINI INDEX
8,667
TOTAL POPULATION
4,329
MALE POPULATION
4,338
FEMALE POPULATION
99.79
MALES / 100 FEMALES
100.21
FEMALES / 100 MALES
42.4
MEDIAN AGE
2.9
AVG FAMILY SIZE
2.4
AVG HOUSEHOLD SIZE
4,045
LABOR FORCE [ PEOPLE ]
58.6%
PERCENT IN LABOR FORCE
3.7%
UNEMPLOYMENT RATE
Wilson County Area Codes
Income in Wilson County
Income Overview in Wilson County
Per Capita Income in Wilson County is $32,008, while median incomes of families and households are $69,964 and $55,439 respectively.
| Characteristic | Number | Measure |
| Per Capita Income | 8,667 | $32,008 |
| Median Family Income | 2,334 | $69,964 |
| Mean Family Income | 2,334 | $86,272 |
| Median Household Income | 3,492 | $55,439 |
| Mean Household Income | 3,492 | $75,208 |
| Income Deficit | 2,334 | $0 |
| Wage / Income Gap (%) | 8,667 | 36.88% |
| Wage / Income Gap ($) | 8,667 | 63.12¢ per $1 |
| Gini / Inequality Index | 8,667 | 0.48 |
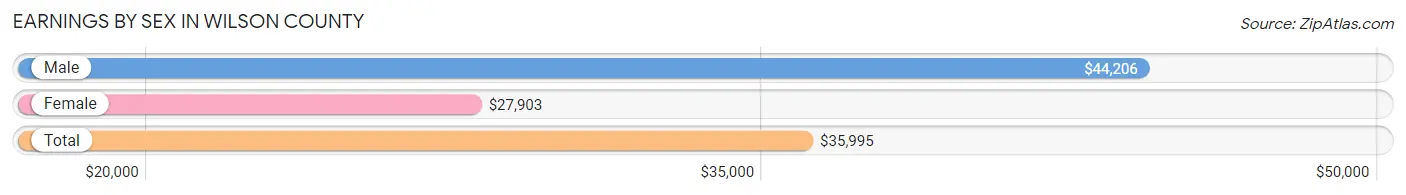
Earnings by Sex in Wilson County
Average Earnings in Wilson County are $35,995, $44,206 for men and $27,903 for women, a difference of 36.9%.
| Sex | Number | Average Earnings |
| Male | 2,258 (53.2%) | $44,206 |
| Female | 1,985 (46.8%) | $27,903 |
| Total | 4,243 (100.0%) | $35,995 |
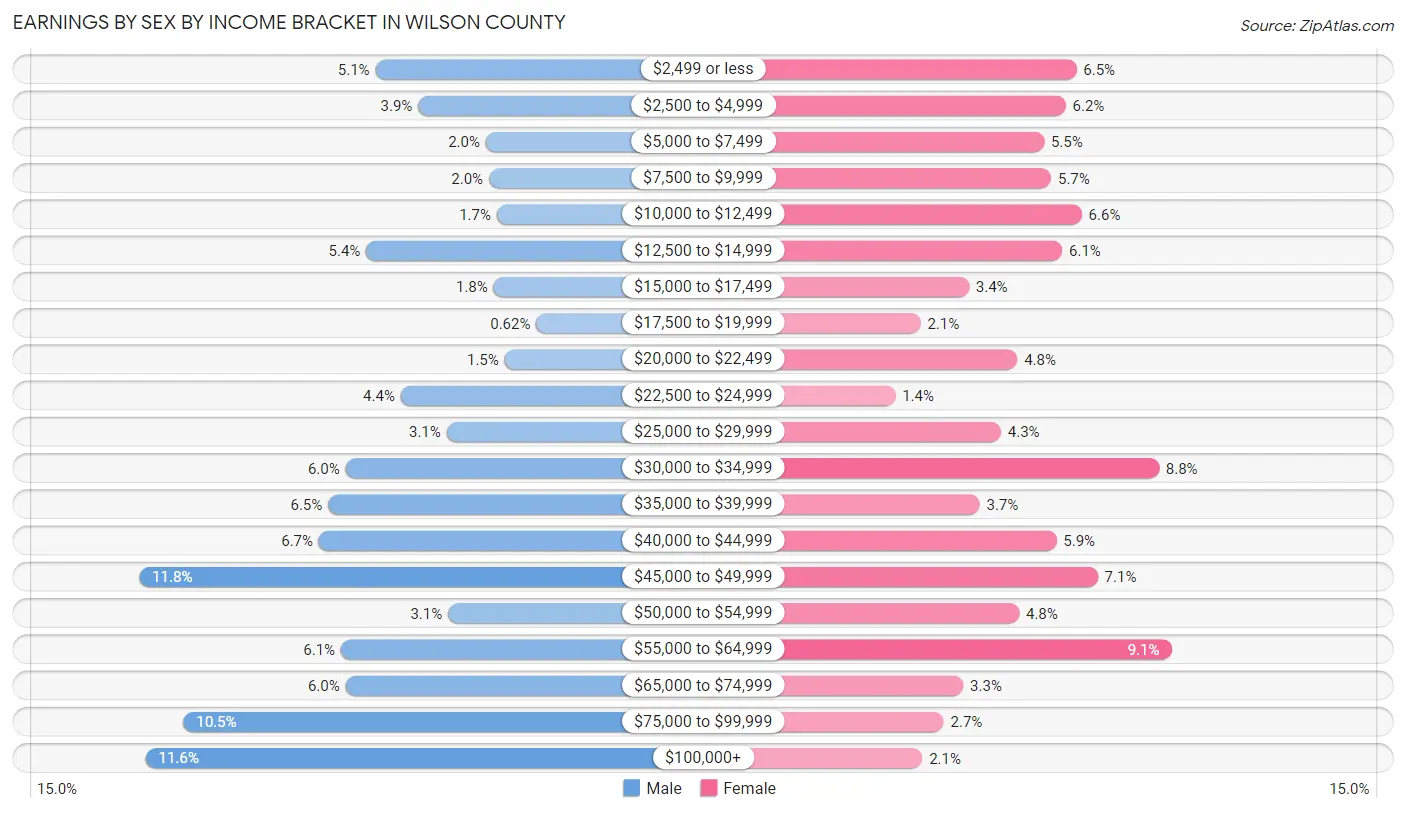
Earnings by Sex by Income Bracket in Wilson County
The most common earnings brackets in Wilson County are $45,000 to $49,999 for men (266 | 11.8%) and $55,000 to $64,999 for women (181 | 9.1%).
| Income | Male | Female |
| $2,499 or less | 116 (5.1%) | 128 (6.5%) |
| $2,500 to $4,999 | 89 (3.9%) | 122 (6.1%) |
| $5,000 to $7,499 | 46 (2.0%) | 110 (5.5%) |
| $7,500 to $9,999 | 44 (1.9%) | 114 (5.7%) |
| $10,000 to $12,499 | 39 (1.7%) | 131 (6.6%) |
| $12,500 to $14,999 | 122 (5.4%) | 120 (6.0%) |
| $15,000 to $17,499 | 41 (1.8%) | 68 (3.4%) |
| $17,500 to $19,999 | 14 (0.6%) | 41 (2.1%) |
| $20,000 to $22,499 | 34 (1.5%) | 95 (4.8%) |
| $22,500 to $24,999 | 100 (4.4%) | 27 (1.4%) |
| $25,000 to $29,999 | 71 (3.1%) | 86 (4.3%) |
| $30,000 to $34,999 | 135 (6.0%) | 174 (8.8%) |
| $35,000 to $39,999 | 146 (6.5%) | 74 (3.7%) |
| $40,000 to $44,999 | 152 (6.7%) | 117 (5.9%) |
| $45,000 to $49,999 | 266 (11.8%) | 140 (7.0%) |
| $50,000 to $54,999 | 70 (3.1%) | 96 (4.8%) |
| $55,000 to $64,999 | 138 (6.1%) | 181 (9.1%) |
| $65,000 to $74,999 | 135 (6.0%) | 65 (3.3%) |
| $75,000 to $99,999 | 238 (10.5%) | 54 (2.7%) |
| $100,000+ | 262 (11.6%) | 42 (2.1%) |
| Total | 2,258 (100.0%) | 1,985 (100.0%) |
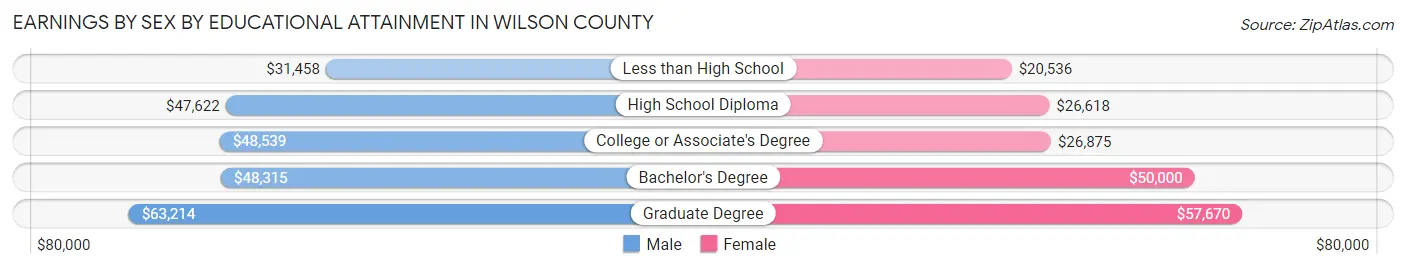
Earnings by Sex by Educational Attainment in Wilson County
Average earnings in Wilson County are $46,760 for men and $31,685 for women, a difference of 32.2%. Men with an educational attainment of graduate degree enjoy the highest average annual earnings of $63,214, while those with less than high school education earn the least with $31,458. Women with an educational attainment of graduate degree earn the most with the average annual earnings of $57,670, while those with less than high school education have the smallest earnings of $20,536.
| Educational Attainment | Male Income | Female Income |
| Less than High School | $31,458 | $20,536 |
| High School Diploma | $47,622 | $26,618 |
| College or Associate's Degree | $48,539 | $26,875 |
| Bachelor's Degree | $48,315 | $50,000 |
| Graduate Degree | $63,214 | $57,670 |
| Total | $46,760 | $31,685 |
Family Income in Wilson County
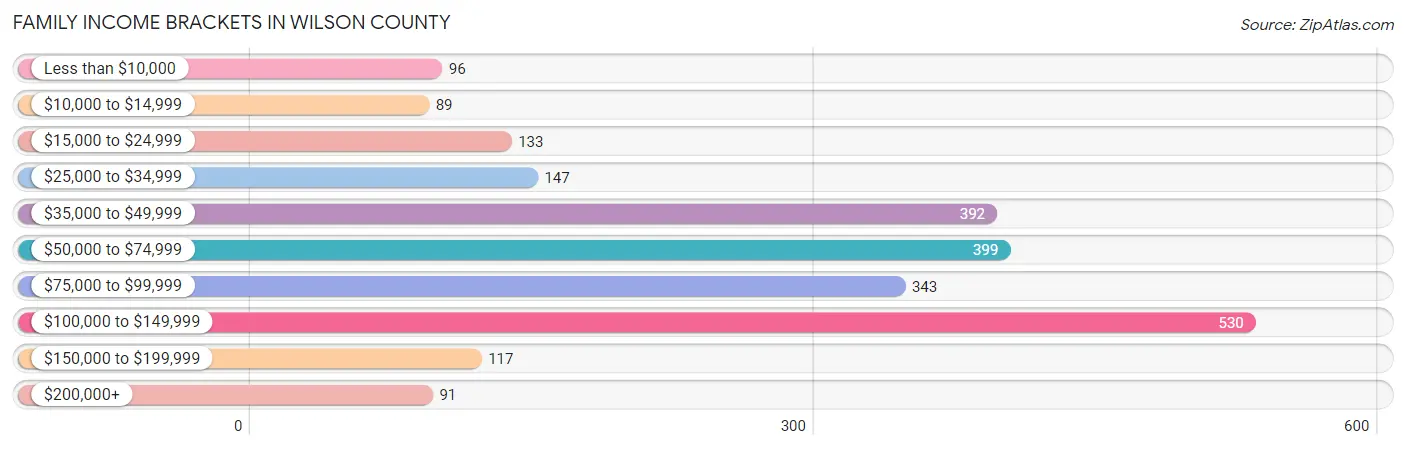
Family Income Brackets in Wilson County
According to the Wilson County family income data, there are 530 families falling into the $100,000 to $149,999 income range, which is the most common income bracket and makes up 22.7% of all families. Conversely, the $10,000 to $14,999 income bracket is the least frequent group with only 89 families (3.8%) belonging to this category.
| Income Bracket | # Families | % Families |
| Less than $10,000 | 96 | 4.1% |
| $10,000 to $14,999 | 89 | 3.8% |
| $15,000 to $24,999 | 133 | 5.7% |
| $25,000 to $34,999 | 147 | 6.3% |
| $35,000 to $49,999 | 392 | 16.8% |
| $50,000 to $74,999 | 399 | 17.1% |
| $75,000 to $99,999 | 343 | 14.7% |
| $100,000 to $149,999 | 530 | 22.7% |
| $150,000 to $199,999 | 117 | 5.0% |
| $200,000+ | 91 | 3.9% |
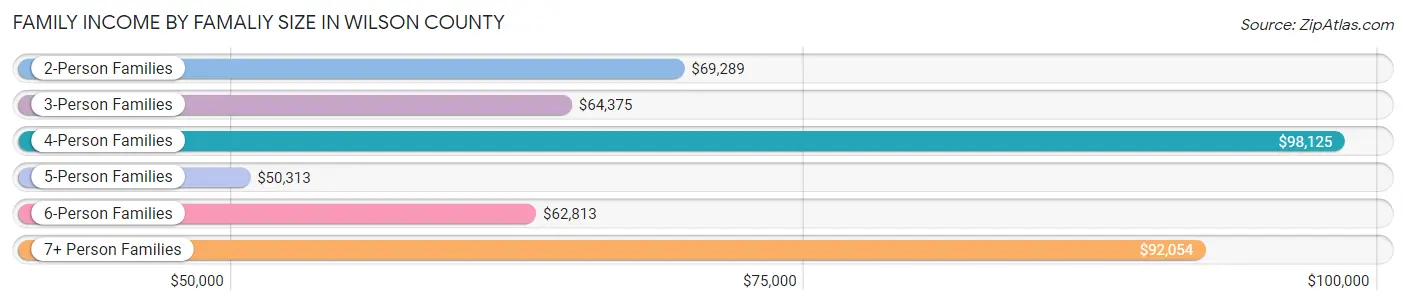
Family Income by Famaliy Size in Wilson County
4-person families (432 | 18.5%) account for the highest median family income in Wilson County with $98,125 per family, while 2-person families (1,201 | 51.5%) have the highest median income of $34,644 per family member.
| Income Bracket | # Families | Median Income |
| 2-Person Families | 1,201 (51.5%) | $69,289 |
| 3-Person Families | 430 (18.4%) | $64,375 |
| 4-Person Families | 432 (18.5%) | $98,125 |
| 5-Person Families | 128 (5.5%) | $50,313 |
| 6-Person Families | 56 (2.4%) | $62,813 |
| 7+ Person Families | 87 (3.7%) | $92,054 |
| Total | 2,334 (100.0%) | $69,964 |
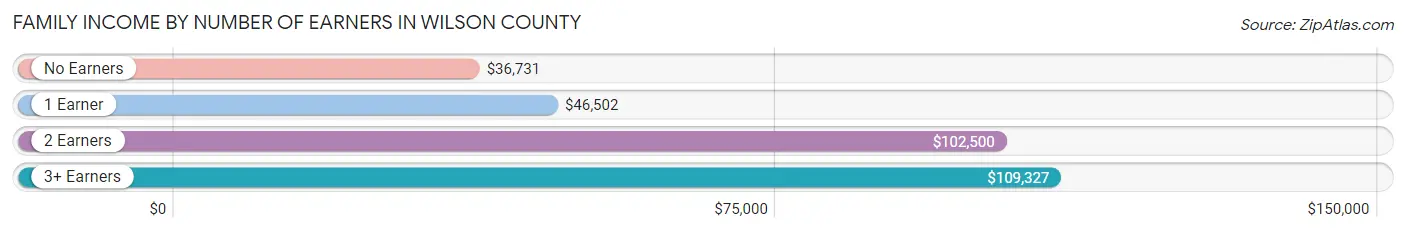
Family Income by Number of Earners in Wilson County
The median family income in Wilson County is $69,964, with families comprising 3+ earners (203) having the highest median family income of $109,327, while families with no earners (368) have the lowest median family income of $36,731, accounting for 8.7% and 15.8% of families, respectively.
| Number of Earners | # Families | Median Income |
| No Earners | 368 (15.8%) | $36,731 |
| 1 Earner | 797 (34.2%) | $46,502 |
| 2 Earners | 966 (41.4%) | $102,500 |
| 3+ Earners | 203 (8.7%) | $109,327 |
| Total | 2,334 (100.0%) | $69,964 |
Household Income in Wilson County
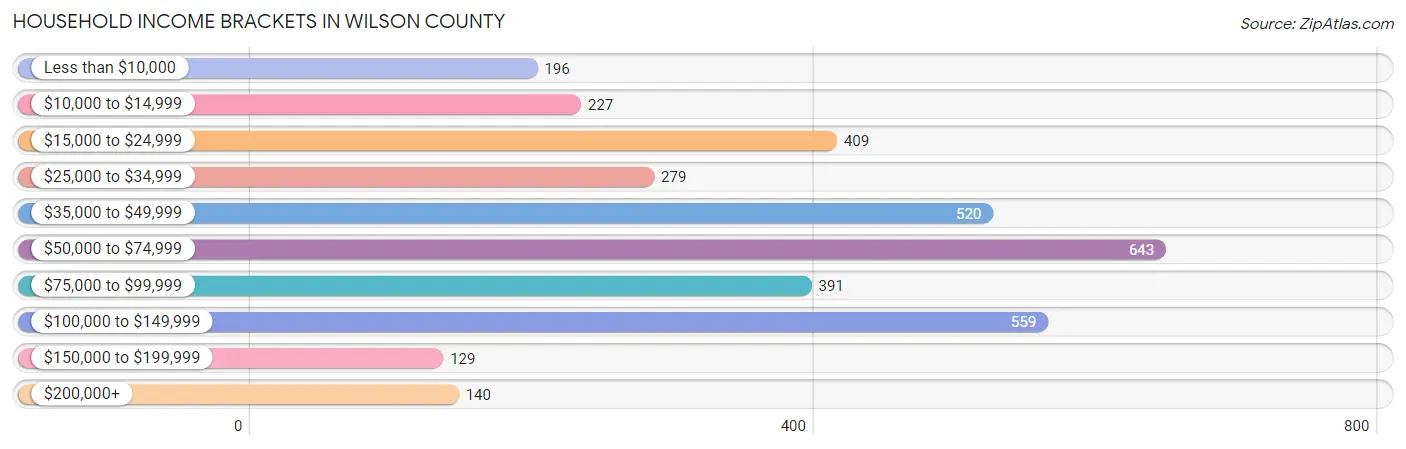
Household Income Brackets in Wilson County
With 643 households falling in the category, the $50,000 to $74,999 income range is the most frequent in Wilson County, accounting for 18.4% of all households. In contrast, only 129 households (3.7%) fall into the $150,000 to $199,999 income bracket, making it the least populous group.
| Income Bracket | # Households | % Households |
| Less than $10,000 | 196 | 5.6% |
| $10,000 to $14,999 | 227 | 6.5% |
| $15,000 to $24,999 | 409 | 11.7% |
| $25,000 to $34,999 | 279 | 8.0% |
| $35,000 to $49,999 | 520 | 14.9% |
| $50,000 to $74,999 | 643 | 18.4% |
| $75,000 to $99,999 | 391 | 11.2% |
| $100,000 to $149,999 | 559 | 16.0% |
| $150,000 to $199,999 | 129 | 3.7% |
| $200,000+ | 140 | 4.0% |
Household Income by Householder Age in Wilson County
The median household income in Wilson County is $55,439, with the highest median household income of $68,854 found in the 45 to 64 years age bracket for the primary householder. A total of 1,291 households (37.0%) fall into this category. Meanwhile, the 15 to 24 years age bracket for the primary householder has the lowest median household income of $0, with 112 households (3.2%) in this group.
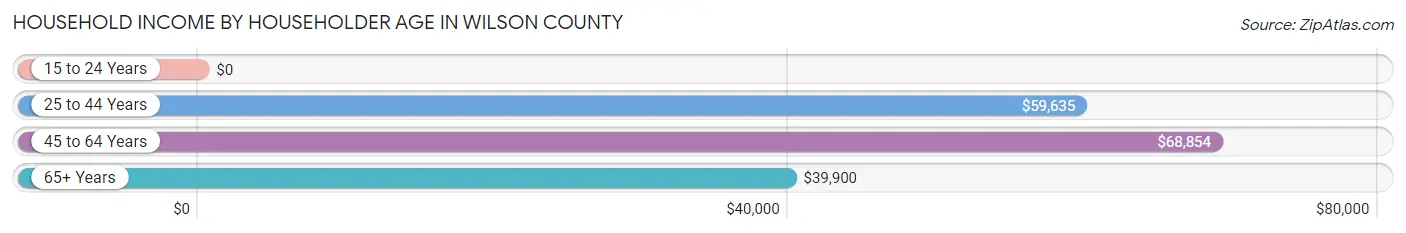
| Income Bracket | # Households | Median Income |
| 15 to 24 Years | 112 (3.2%) | $0 |
| 25 to 44 Years | 933 (26.7%) | $59,635 |
| 45 to 64 Years | 1,291 (37.0%) | $68,854 |
| 65+ Years | 1,156 (33.1%) | $39,900 |
| Total | 3,492 (100.0%) | $55,439 |
Poverty in Wilson County
Income Below Poverty by Sex and Age in Wilson County
With 13.6% poverty level for males and 19.0% for females among the residents of Wilson County, 75 year old and over males and 18 to 24 year old females are the most vulnerable to poverty, with 87 males (26.9%) and 86 females (28.9%) in their respective age groups living below the poverty level.
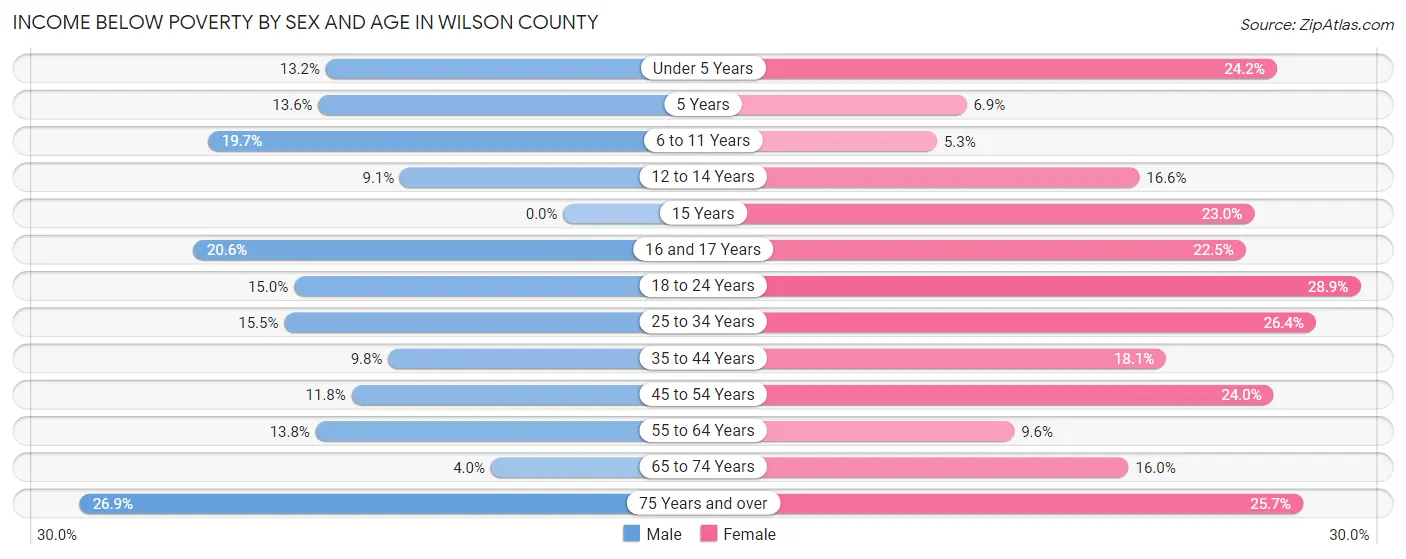
| Age Bracket | Male | Female |
| Under 5 Years | 34 (13.2%) | 61 (24.2%) |
| 5 Years | 9 (13.6%) | 5 (6.9%) |
| 6 to 11 Years | 77 (19.7%) | 16 (5.3%) |
| 12 to 14 Years | 14 (9.1%) | 28 (16.6%) |
| 15 Years | 0 (0.0%) | 14 (23.0%) |
| 16 and 17 Years | 36 (20.6%) | 29 (22.5%) |
| 18 to 24 Years | 45 (15.0%) | 86 (28.9%) |
| 25 to 34 Years | 62 (15.5%) | 109 (26.4%) |
| 35 to 44 Years | 50 (9.8%) | 82 (18.1%) |
| 45 to 54 Years | 58 (11.8%) | 119 (24.0%) |
| 55 to 64 Years | 88 (13.8%) | 60 (9.6%) |
| 65 to 74 Years | 22 (4.0%) | 88 (16.0%) |
| 75 Years and over | 87 (26.9%) | 108 (25.7%) |
| Total | 582 (13.6%) | 805 (19.0%) |
Income Above Poverty by Sex and Age in Wilson County
According to the poverty statistics in Wilson County, males aged 15 years and females aged 6 to 11 years are the age groups that are most secure financially, with 100.0% of males and 94.7% of females in these age groups living above the poverty line.
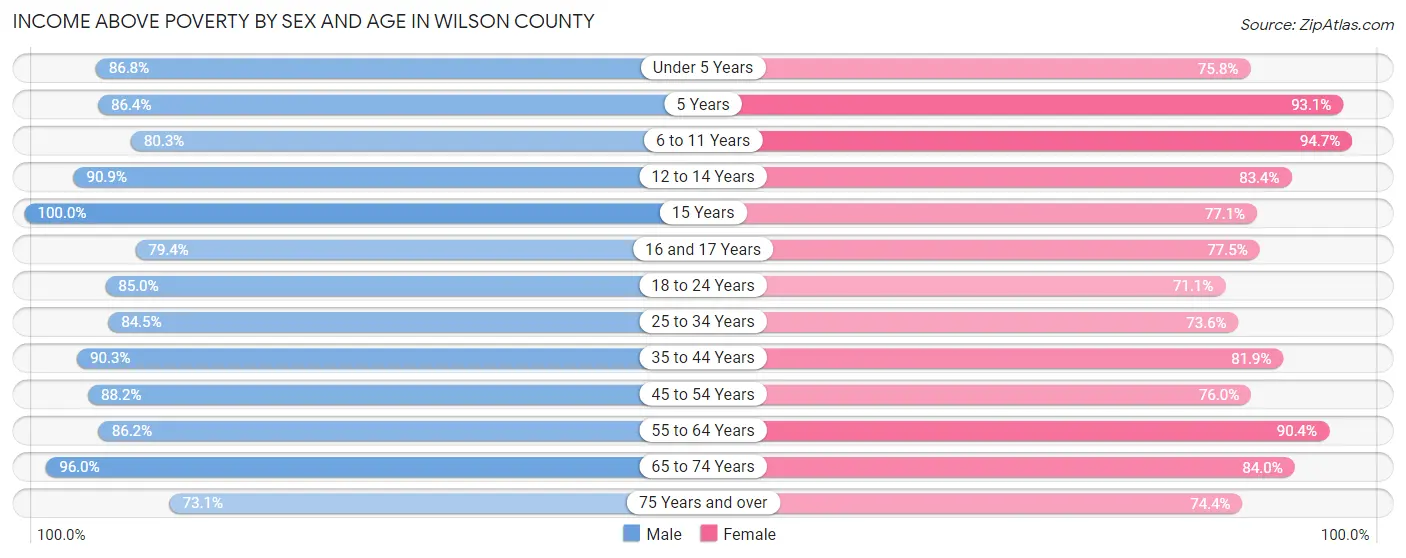
| Age Bracket | Male | Female |
| Under 5 Years | 223 (86.8%) | 191 (75.8%) |
| 5 Years | 57 (86.4%) | 67 (93.1%) |
| 6 to 11 Years | 313 (80.3%) | 286 (94.7%) |
| 12 to 14 Years | 140 (90.9%) | 141 (83.4%) |
| 15 Years | 22 (100.0%) | 47 (77.0%) |
| 16 and 17 Years | 139 (79.4%) | 100 (77.5%) |
| 18 to 24 Years | 255 (85.0%) | 212 (71.1%) |
| 25 to 34 Years | 337 (84.5%) | 304 (73.6%) |
| 35 to 44 Years | 463 (90.2%) | 372 (81.9%) |
| 45 to 54 Years | 434 (88.2%) | 376 (76.0%) |
| 55 to 64 Years | 550 (86.2%) | 565 (90.4%) |
| 65 to 74 Years | 523 (96.0%) | 463 (84.0%) |
| 75 Years and over | 236 (73.1%) | 313 (74.4%) |
| Total | 3,692 (86.4%) | 3,437 (81.0%) |
Income Below Poverty Among Married-Couple Families in Wilson County
The poverty statistics for married-couple families in Wilson County show that 7.2% or 125 of the total 1,738 families live below the poverty line. Families with 1 or 2 children have the highest poverty rate of 13.4%, comprising of 58 families. On the other hand, families with no children have the lowest poverty rate of 4.7%, which includes 53 families.
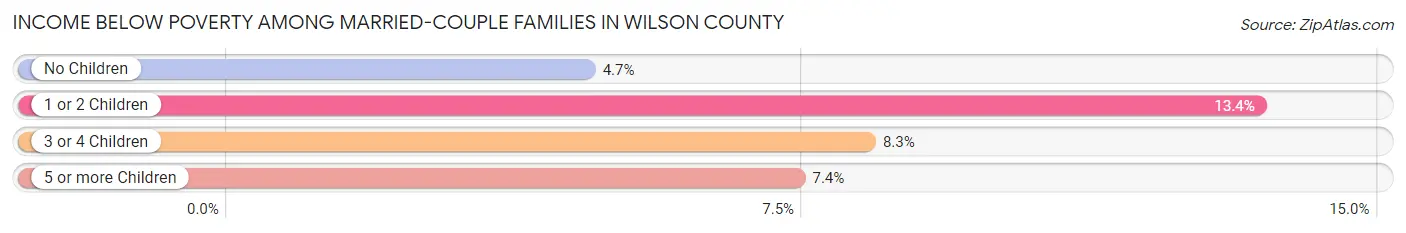
| Children | Above Poverty | Below Poverty |
| No Children | 1,082 (95.3%) | 53 (4.7%) |
| 1 or 2 Children | 374 (86.6%) | 58 (13.4%) |
| 3 or 4 Children | 132 (91.7%) | 12 (8.3%) |
| 5 or more Children | 25 (92.6%) | 2 (7.4%) |
| Total | 1,613 (92.8%) | 125 (7.2%) |
Income Below Poverty Among Single-Parent Households in Wilson County
According to the poverty data in Wilson County, 5.1% or 8 single-father households and 36.1% or 159 single-mother households are living below the poverty line. Among single-father households, those with 1 or 2 children have the highest poverty rate, with 8 households (6.8%) experiencing poverty. Likewise, among single-mother households, those with no children have the highest poverty rate, with 41 households (46.1%) falling below the poverty line.
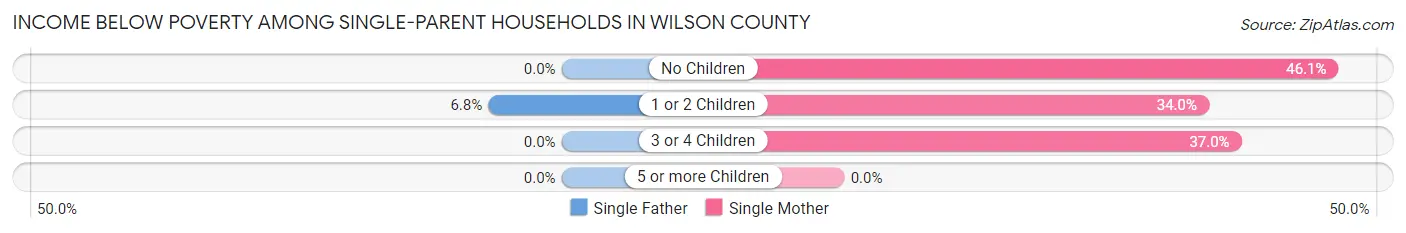
| Children | Single Father | Single Mother |
| No Children | 0 (0.0%) | 41 (46.1%) |
| 1 or 2 Children | 8 (6.8%) | 68 (34.0%) |
| 3 or 4 Children | 0 (0.0%) | 50 (37.0%) |
| 5 or more Children | 0 (0.0%) | 0 (0.0%) |
| Total | 8 (5.1%) | 159 (36.1%) |
Income Below Poverty Among Married-Couple vs Single-Parent Households in Wilson County
The poverty data for Wilson County shows that 125 of the married-couple family households (7.2%) and 167 of the single-parent households (28.0%) are living below the poverty level. Within the married-couple family households, those with 1 or 2 children have the highest poverty rate, with 58 households (13.4%) falling below the poverty line. Among the single-parent households, those with 3 or 4 children have the highest poverty rate, with 50 household (36.5%) living below poverty.
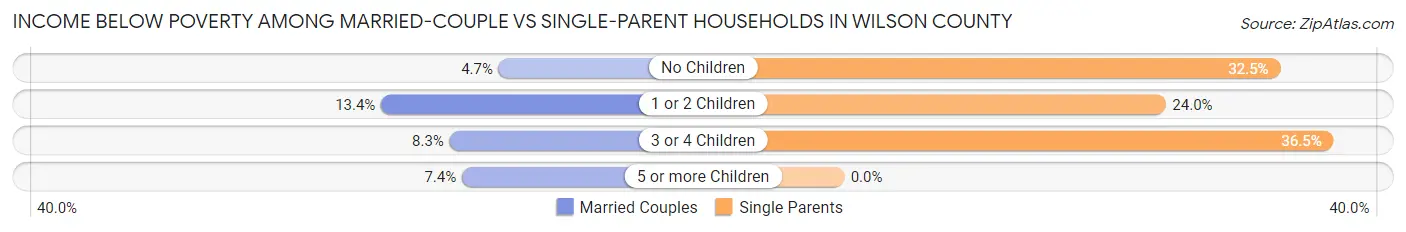
| Children | Married-Couple Families | Single-Parent Households |
| No Children | 53 (4.7%) | 41 (32.5%) |
| 1 or 2 Children | 58 (13.4%) | 76 (24.0%) |
| 3 or 4 Children | 12 (8.3%) | 50 (36.5%) |
| 5 or more Children | 2 (7.4%) | 0 (0.0%) |
| Total | 125 (7.2%) | 167 (28.0%) |
Race in Wilson County
The most populous races in Wilson County are White / Caucasian (8,153 | 94.1%), Two or more Races (436 | 5.0%), and Hispanic or Latino (326 | 3.8%).
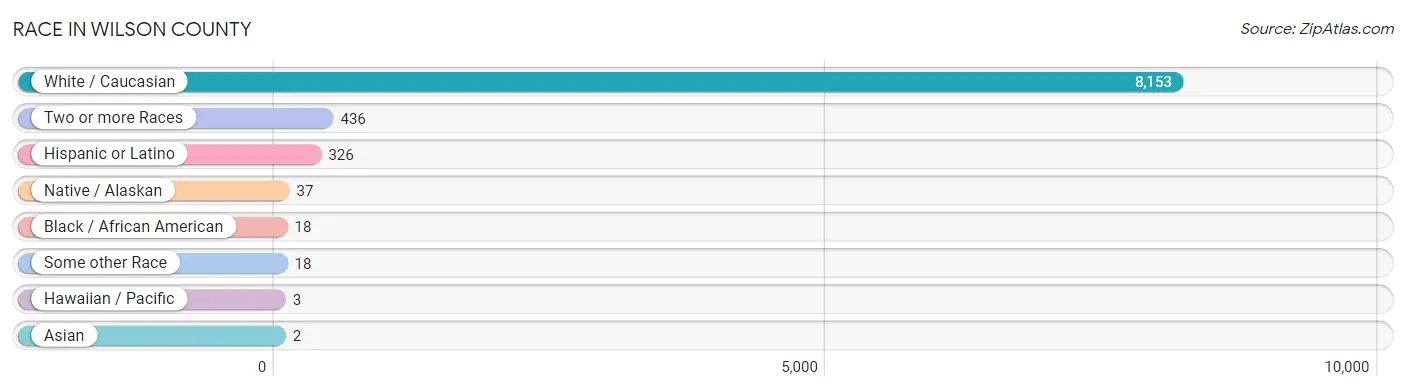
| Race | # Population | % Population |
| Asian | 2 | 0.0% |
| Black / African American | 18 | 0.2% |
| Hawaiian / Pacific | 3 | 0.0% |
| Hispanic or Latino | 326 | 3.8% |
| Native / Alaskan | 37 | 0.4% |
| White / Caucasian | 8,153 | 94.1% |
| Two or more Races | 436 | 5.0% |
| Some other Race | 18 | 0.2% |
| Total | 8,667 | 100.0% |
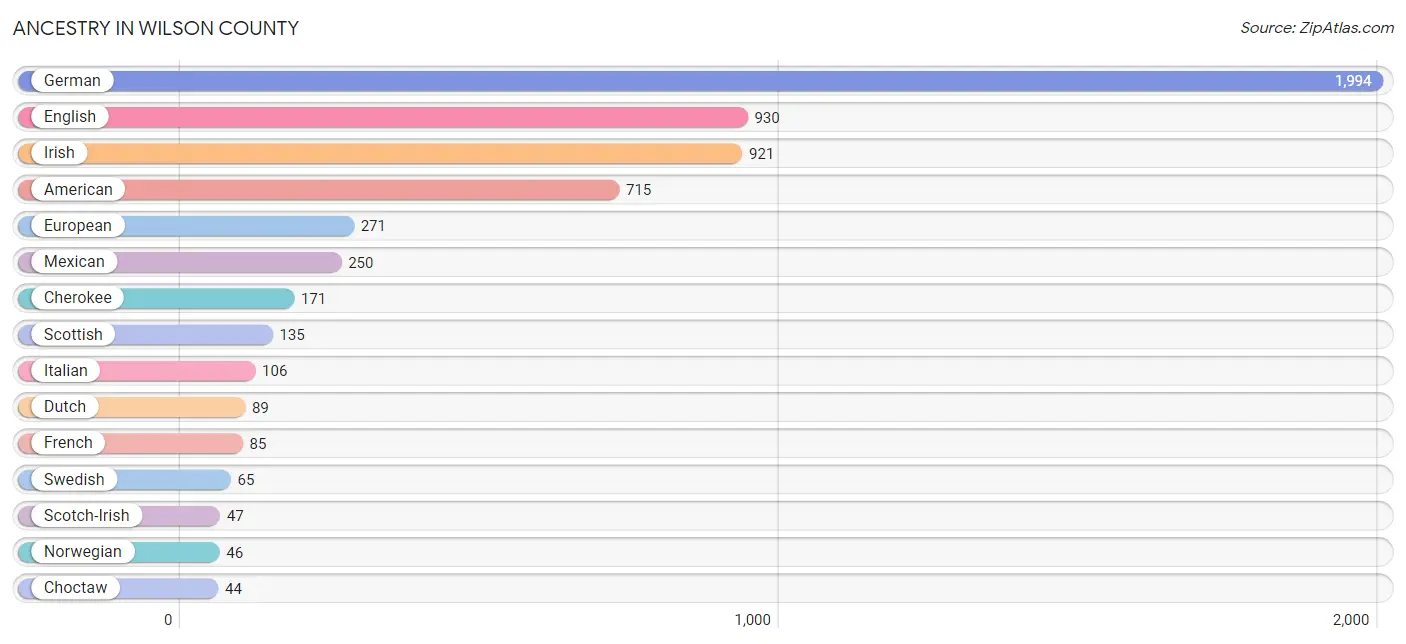
Ancestry in Wilson County
The most populous ancestries reported in Wilson County are German (1,994 | 23.0%), English (930 | 10.7%), Irish (921 | 10.6%), American (715 | 8.3%), and European (271 | 3.1%), together accounting for 55.7% of all Wilson County residents.
| Ancestry | # Population | % Population |
| American | 715 | 8.3% |
| Apache | 16 | 0.2% |
| Arab | 20 | 0.2% |
| Austrian | 4 | 0.1% |
| Belgian | 4 | 0.1% |
| Bhutanese | 15 | 0.2% |
| British | 16 | 0.2% |
| Burmese | 2 | 0.0% |
| Canadian | 32 | 0.4% |
| Central American | 17 | 0.2% |
| Central American Indian | 12 | 0.1% |
| Cherokee | 171 | 2.0% |
| Cheyenne | 5 | 0.1% |
| Chickasaw | 10 | 0.1% |
| Choctaw | 44 | 0.5% |
| Creek | 23 | 0.3% |
| Danish | 25 | 0.3% |
| Delaware | 4 | 0.1% |
| Dutch | 89 | 1.0% |
| Dutch West Indian | 2 | 0.0% |
| Eastern European | 17 | 0.2% |
| English | 930 | 10.7% |
| European | 271 | 3.1% |
| French | 85 | 1.0% |
| French Canadian | 16 | 0.2% |
| German | 1,994 | 23.0% |
| Greek | 3 | 0.0% |
| Haitian | 1 | 0.0% |
| Indian (Asian) | 4 | 0.1% |
| Irish | 921 | 10.6% |
| Italian | 106 | 1.2% |
| Korean | 8 | 0.1% |
| Lebanese | 15 | 0.2% |
| Lithuanian | 10 | 0.1% |
| Mexican | 250 | 2.9% |
| Native Hawaiian | 5 | 0.1% |
| Navajo | 2 | 0.0% |
| Nicaraguan | 17 | 0.2% |
| Norwegian | 46 | 0.5% |
| Pennsylvania German | 5 | 0.1% |
| Polish | 32 | 0.4% |
| Potawatomi | 27 | 0.3% |
| Puerto Rican | 12 | 0.1% |
| Puget Sound Salish | 4 | 0.1% |
| Russian | 12 | 0.1% |
| Scandinavian | 21 | 0.2% |
| Scotch-Irish | 47 | 0.5% |
| Scottish | 135 | 1.6% |
| Seminole | 8 | 0.1% |
| Sioux | 17 | 0.2% |
| Slovene | 22 | 0.3% |
| South African | 4 | 0.1% |
| Subsaharan African | 4 | 0.1% |
| Swedish | 65 | 0.7% |
| Swiss | 14 | 0.2% |
| Syrian | 5 | 0.1% |
| Thai | 2 | 0.0% |
| Ukrainian | 8 | 0.1% |
| Welsh | 21 | 0.2% | View All 59 Rows |
Immigrants in Wilson County
The most numerous immigrant groups reported in Wilson County came from Central America (47 | 0.5%), Latin America (47 | 0.5%), Mexico (47 | 0.5%), Canada (32 | 0.4%), and Europe (14 | 0.2%), together accounting for 2.2% of all Wilson County residents.
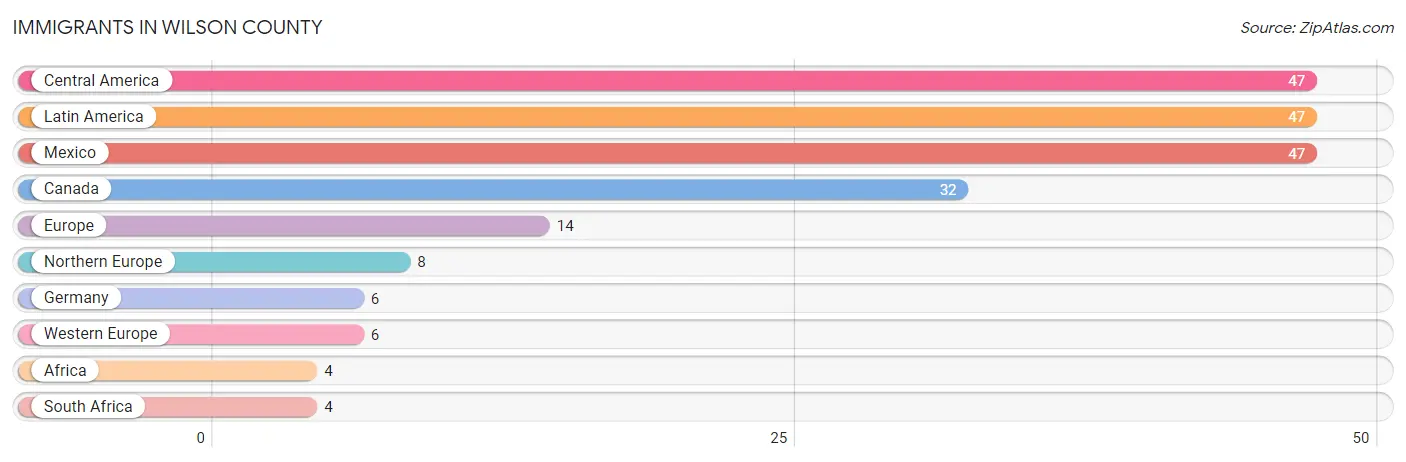
| Immigration Origin | # Population | % Population |
| Africa | 4 | 0.1% |
| Canada | 32 | 0.4% |
| Central America | 47 | 0.5% |
| Europe | 14 | 0.2% |
| Germany | 6 | 0.1% |
| Latin America | 47 | 0.5% |
| Mexico | 47 | 0.5% |
| Northern Europe | 8 | 0.1% |
| South Africa | 4 | 0.1% |
| Western Europe | 6 | 0.1% | View All 10 Rows |
Sex and Age in Wilson County
Sex and Age in Wilson County
The most populous age groups in Wilson County are 5 to 9 Years (417 | 9.6%) for men and 60 to 64 Years (359 | 8.3%) for women.
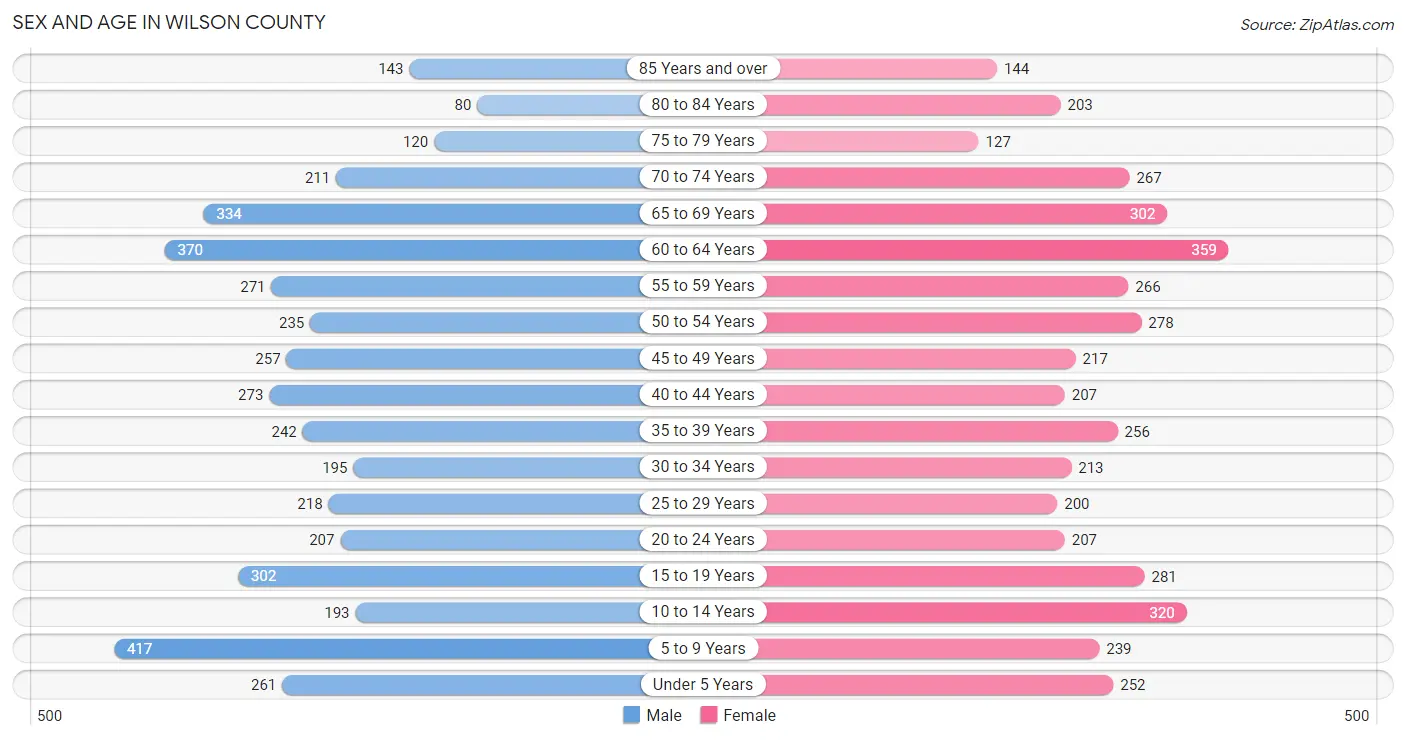
| Age Bracket | Male | Female |
| Under 5 Years | 261 (6.0%) | 252 (5.8%) |
| 5 to 9 Years | 417 (9.6%) | 239 (5.5%) |
| 10 to 14 Years | 193 (4.5%) | 320 (7.4%) |
| 15 to 19 Years | 302 (7.0%) | 281 (6.5%) |
| 20 to 24 Years | 207 (4.8%) | 207 (4.8%) |
| 25 to 29 Years | 218 (5.0%) | 200 (4.6%) |
| 30 to 34 Years | 195 (4.5%) | 213 (4.9%) |
| 35 to 39 Years | 242 (5.6%) | 256 (5.9%) |
| 40 to 44 Years | 273 (6.3%) | 207 (4.8%) |
| 45 to 49 Years | 257 (5.9%) | 217 (5.0%) |
| 50 to 54 Years | 235 (5.4%) | 278 (6.4%) |
| 55 to 59 Years | 271 (6.3%) | 266 (6.1%) |
| 60 to 64 Years | 370 (8.6%) | 359 (8.3%) |
| 65 to 69 Years | 334 (7.7%) | 302 (7.0%) |
| 70 to 74 Years | 211 (4.9%) | 267 (6.1%) |
| 75 to 79 Years | 120 (2.8%) | 127 (2.9%) |
| 80 to 84 Years | 80 (1.8%) | 203 (4.7%) |
| 85 Years and over | 143 (3.3%) | 144 (3.3%) |
| Total | 4,329 (100.0%) | 4,338 (100.0%) |
Families and Households in Wilson County
Median Family Size in Wilson County
The median family size in Wilson County is 2.91 persons per family, with single female/mother families (440 | 18.9%) accounting for the largest median family size of 3.39 persons per family. On the other hand, single male/father families (156 | 6.7%) represent the smallest median family size with 2.45 persons per family.
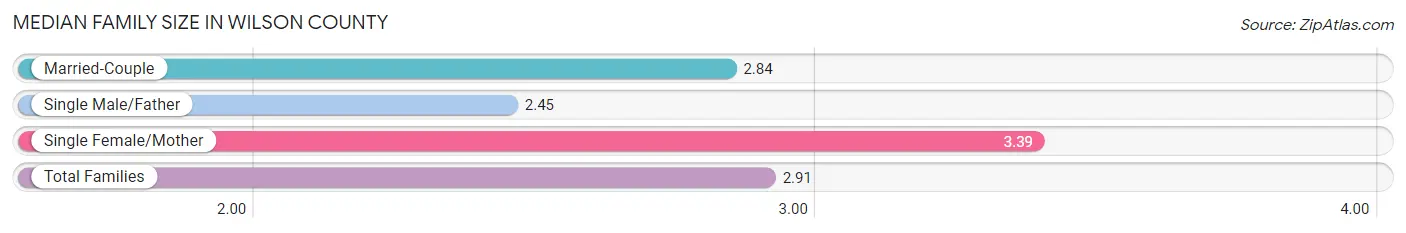
| Family Type | # Families | Family Size |
| Married-Couple | 1,738 (74.5%) | 2.84 |
| Single Male/Father | 156 (6.7%) | 2.45 |
| Single Female/Mother | 440 (18.9%) | 3.39 |
| Total Families | 2,334 (100.0%) | 2.91 |
Median Household Size in Wilson County
The median household size in Wilson County is 2.44 persons per household, with single female/mother households (440 | 12.6%) accounting for the largest median household size of 3.68 persons per household. non-family households (1,158 | 33.2%) represent the smallest median household size with 1.23 persons per household.
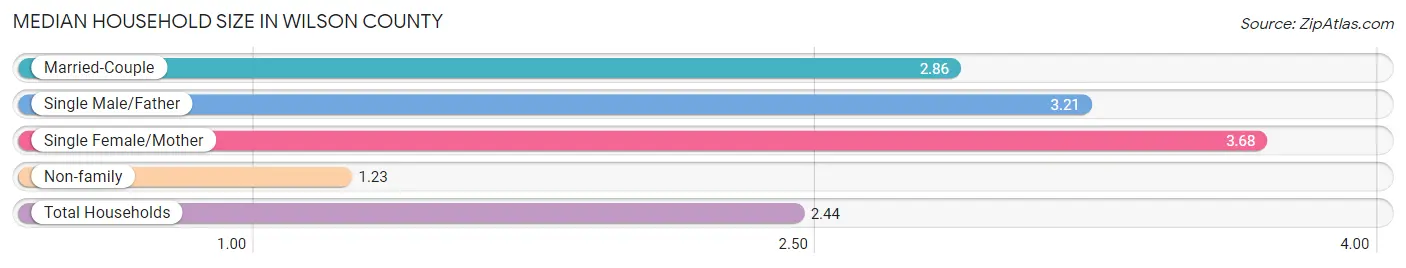
| Household Type | # Households | Household Size |
| Married-Couple | 1,738 (49.8%) | 2.86 |
| Single Male/Father | 156 (4.5%) | 3.21 |
| Single Female/Mother | 440 (12.6%) | 3.68 |
| Non-family | 1,158 (33.2%) | 1.23 |
| Total Households | 3,492 (100.0%) | 2.44 |
Household Size by Marriage Status in Wilson County
Out of a total of 3,492 households in Wilson County, 2,334 (66.8%) are family households, while 1,158 (33.2%) are nonfamily households. The most numerous type of family households are 2-person households, comprising 1,109, and the most common type of nonfamily households are 1-person households, comprising 1,044.
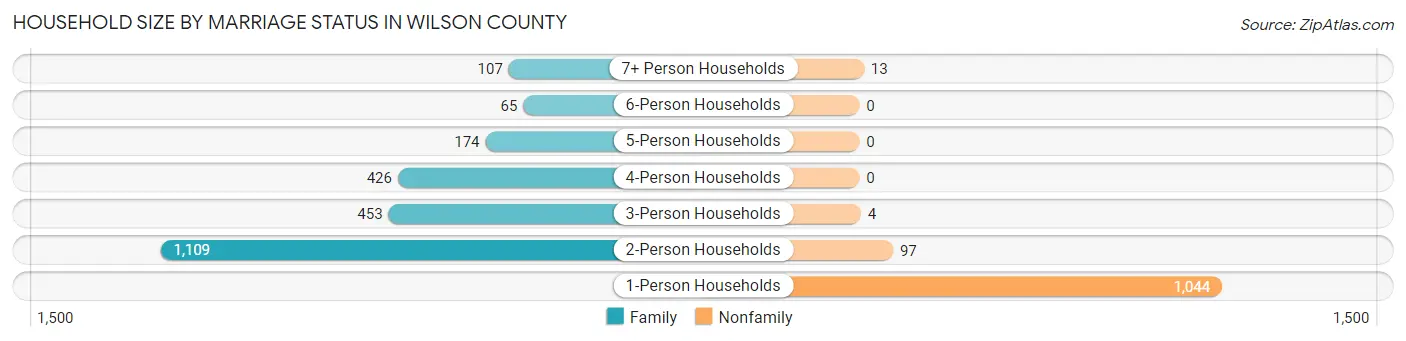
| Household Size | Family Households | Nonfamily Households |
| 1-Person Households | - | 1,044 (29.9%) |
| 2-Person Households | 1,109 (31.8%) | 97 (2.8%) |
| 3-Person Households | 453 (13.0%) | 4 (0.1%) |
| 4-Person Households | 426 (12.2%) | 0 (0.0%) |
| 5-Person Households | 174 (5.0%) | 0 (0.0%) |
| 6-Person Households | 65 (1.9%) | 0 (0.0%) |
| 7+ Person Households | 107 (3.1%) | 13 (0.4%) |
| Total | 2,334 (66.8%) | 1,158 (33.2%) |
Female Fertility in Wilson County
Fertility by Age in Wilson County
Average fertility rate in Wilson County is 63.0 births per 1,000 women. Women in the age bracket of 20 to 34 years have the highest fertility rate with 123.0 births per 1,000 women. Women in the age bracket of 20 to 34 years acount for 74.5% of all women with births.
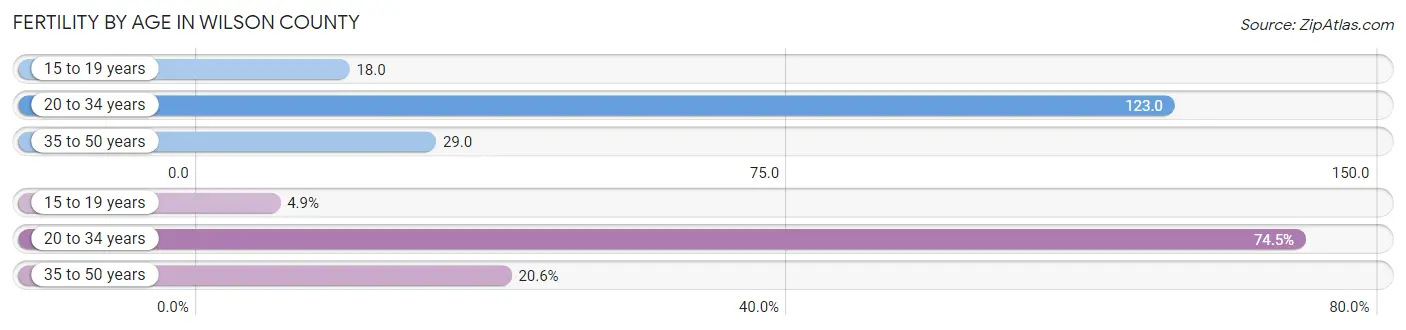
| Age Bracket | Women with Births | Births / 1,000 Women |
| 15 to 19 years | 5 (4.9%) | 18.0 |
| 20 to 34 years | 76 (74.5%) | 123.0 |
| 35 to 50 years | 21 (20.6%) | 29.0 |
| Total | 102 (100.0%) | 63.0 |
Fertility by Age by Marriage Status in Wilson County
78.4% of women with births (102) in Wilson County are married. The highest percentage of unmarried women with births falls into 20 to 34 years age bracket with 23.7% of them unmarried at the time of birth, while the lowest percentage of unmarried women with births belong to 15 to 19 years age bracket with 0.0% of them unmarried.
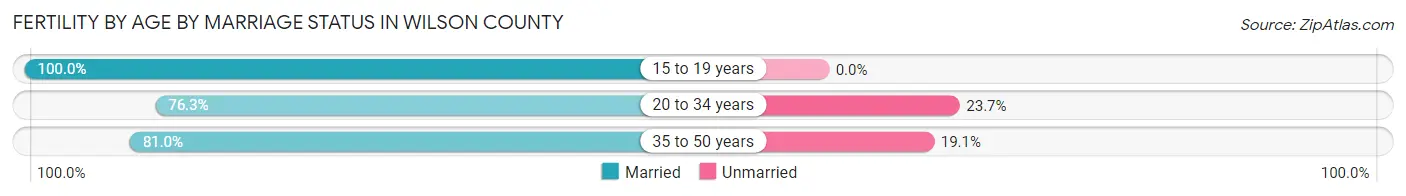
| Age Bracket | Married | Unmarried |
| 15 to 19 years | 5 (100.0%) | 0 (0.0%) |
| 20 to 34 years | 58 (76.3%) | 18 (23.7%) |
| 35 to 50 years | 17 (80.9%) | 4 (19.1%) |
| Total | 80 (78.4%) | 22 (21.6%) |
Fertility by Education in Wilson County
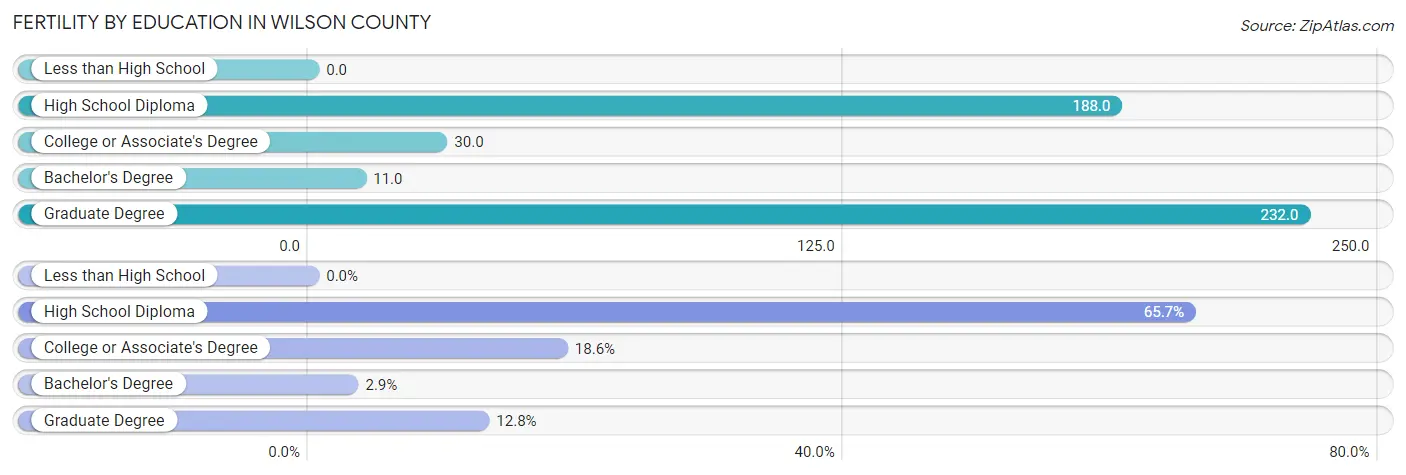
| Educational Attainment | Women with Births | Births / 1,000 Women |
| Less than High School | 0 (0.0%) | 0.0 |
| High School Diploma | 67 (65.7%) | 188.0 |
| College or Associate's Degree | 19 (18.6%) | 30.0 |
| Bachelor's Degree | 3 (2.9%) | 11.0 |
| Graduate Degree | 13 (12.8%) | 232.0 |
| Total | 102 (100.0%) | 63.0 |
Fertility by Education by Marriage Status in Wilson County
21.6% of women with births in Wilson County are unmarried. Women with the educational attainment of bachelor's degree are most likely to be married with 100.0% of them married at childbirth, while women with the educational attainment of high school diploma are least likely to be married with 26.9% of them unmarried at childbirth.
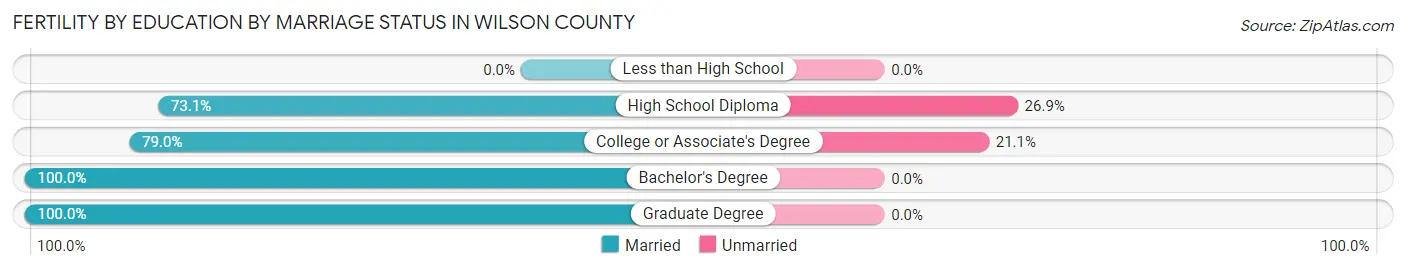
| Educational Attainment | Married | Unmarried |
| Less than High School | 0 (0.0%) | 0 (0.0%) |
| High School Diploma | 49 (73.1%) | 18 (26.9%) |
| College or Associate's Degree | 15 (78.9%) | 4 (21.0%) |
| Bachelor's Degree | 3 (100.0%) | 0 (0.0%) |
| Graduate Degree | 13 (100.0%) | 0 (0.0%) |
| Total | 80 (78.4%) | 22 (21.6%) |
Employment Characteristics in Wilson County
Employment by Class of Employer in Wilson County
Among the 3,860 employed individuals in Wilson County, private company employees (2,162 | 56.0%), local government employees (636 | 16.5%), and self-employed (not incorporated) (304 | 7.9%) make up the most common classes of employment.
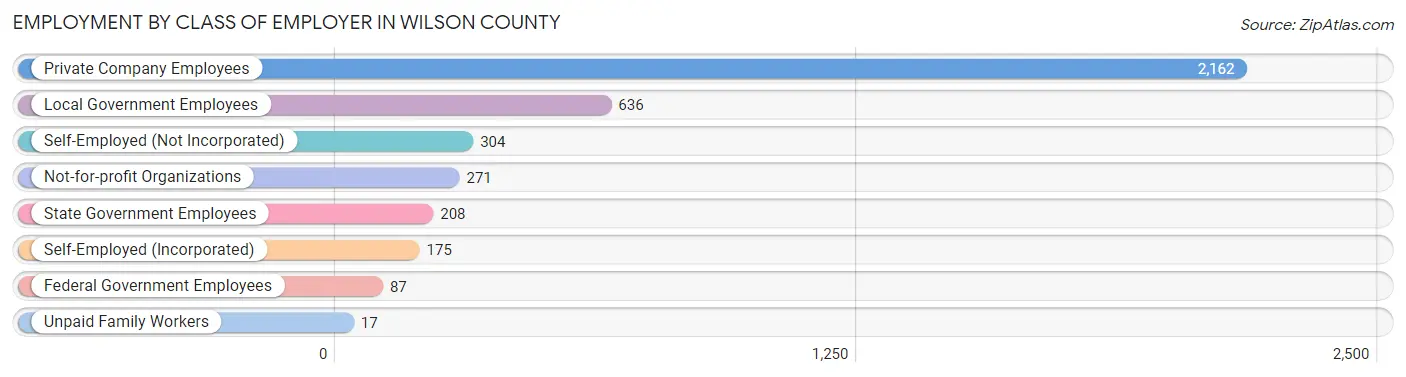
| Employer Class | # Employees | % Employees |
| Private Company Employees | 2,162 | 56.0% |
| Self-Employed (Incorporated) | 175 | 4.5% |
| Self-Employed (Not Incorporated) | 304 | 7.9% |
| Not-for-profit Organizations | 271 | 7.0% |
| Local Government Employees | 636 | 16.5% |
| State Government Employees | 208 | 5.4% |
| Federal Government Employees | 87 | 2.2% |
| Unpaid Family Workers | 17 | 0.4% |
| Total | 3,860 | 100.0% |
Employment Status by Age in Wilson County
According to the labor force statistics for Wilson County, out of the total population over 16 years of age (6,902), 58.6% or 4,045 individuals are in the labor force, with 3.7% or 150 of them unemployed. The age group with the highest labor force participation rate is 55 to 59 years, with 81.9% or 440 individuals in the labor force. Within the labor force, the 35 to 44 years age range has the highest percentage of unemployed individuals, with 7.0% or 56 of them being unemployed.
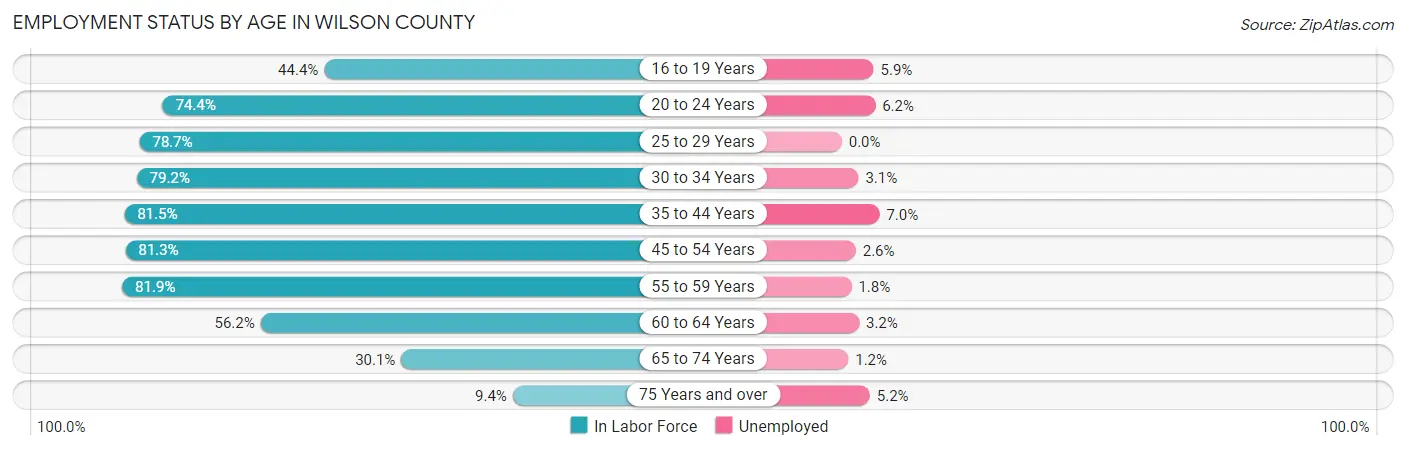
| Age Bracket | In Labor Force | Unemployed |
| 16 to 19 Years | 222 (44.4%) | 13 (5.9%) |
| 20 to 24 Years | 308 (74.4%) | 19 (6.2%) |
| 25 to 29 Years | 329 (78.7%) | 0 (0.0%) |
| 30 to 34 Years | 323 (79.2%) | 10 (3.1%) |
| 35 to 44 Years | 797 (81.5%) | 56 (7.0%) |
| 45 to 54 Years | 802 (81.3%) | 21 (2.6%) |
| 55 to 59 Years | 440 (81.9%) | 8 (1.8%) |
| 60 to 64 Years | 410 (56.2%) | 13 (3.2%) |
| 65 to 74 Years | 335 (30.1%) | 4 (1.2%) |
| 75 Years and over | 77 (9.4%) | 4 (5.2%) |
| Total | 4,045 (58.6%) | 150 (3.7%) |
Employment Status by Educational Attainment in Wilson County
According to labor force statistics for Wilson County, 76.4% of individuals (3,100) out of the total population between 25 and 64 years of age (4,057) are in the labor force, with 3.5% or 109 of them being unemployed. The group with the highest labor force participation rate are those with the educational attainment of bachelor's degree or higher, with 91.3% or 749 individuals in the labor force. Within the labor force, individuals with less than high school education have the highest percentage of unemployment, with 7.8% or 19 of them being unemployed.
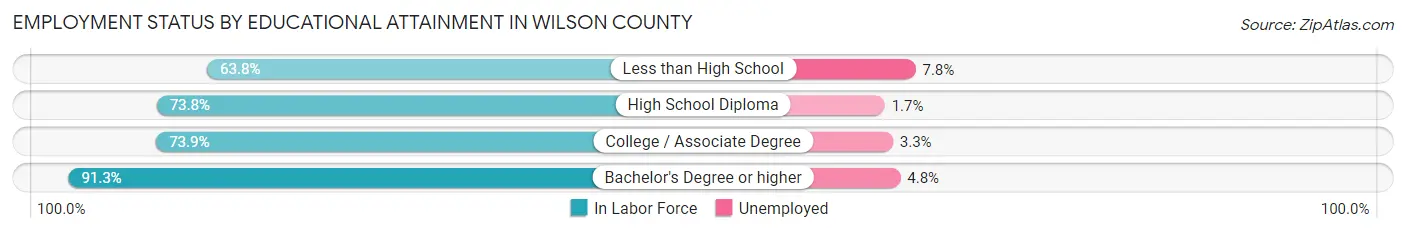
| Educational Attainment | In Labor Force | Unemployed |
| Less than High School | 243 (63.8%) | 30 (7.8%) |
| High School Diploma | 1,030 (73.8%) | 24 (1.7%) |
| College / Associate Degree | 1,080 (73.9%) | 48 (3.3%) |
| Bachelor's Degree or higher | 749 (91.3%) | 39 (4.8%) |
| Total | 3,100 (76.4%) | 142 (3.5%) |
Employment Occupations by Sex in Wilson County
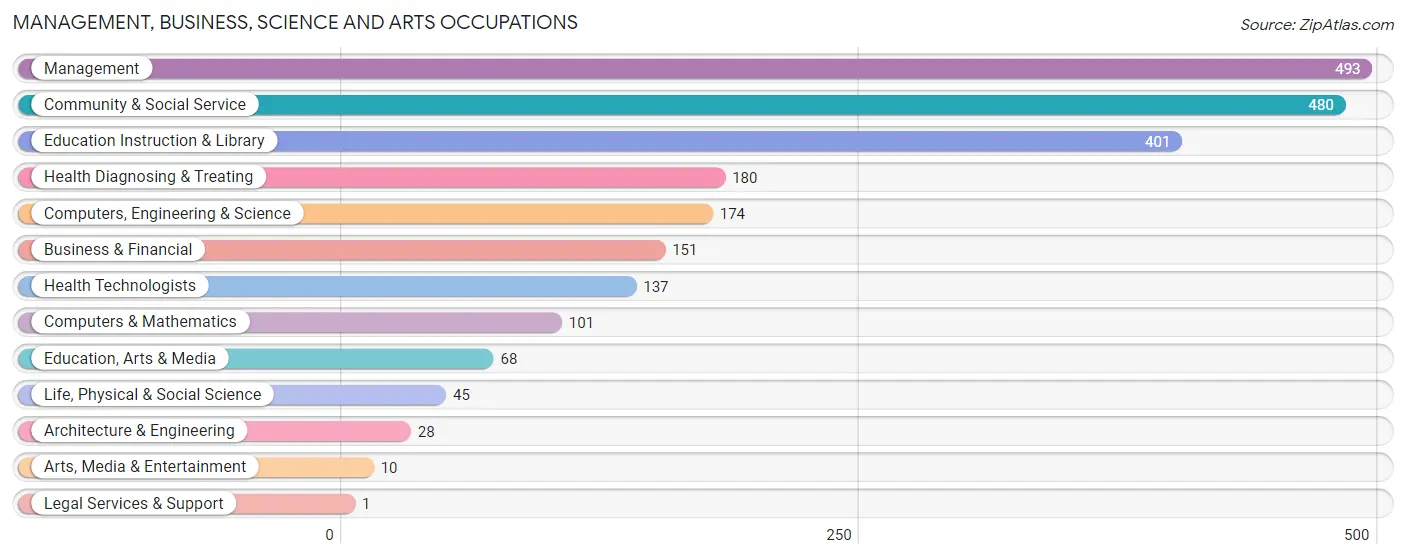
Management, Business, Science and Arts Occupations
The most common Management, Business, Science and Arts occupations in Wilson County are Management (493 | 12.7%), Community & Social Service (480 | 12.3%), Education Instruction & Library (401 | 10.3%), Health Diagnosing & Treating (180 | 4.6%), and Computers, Engineering & Science (174 | 4.5%).
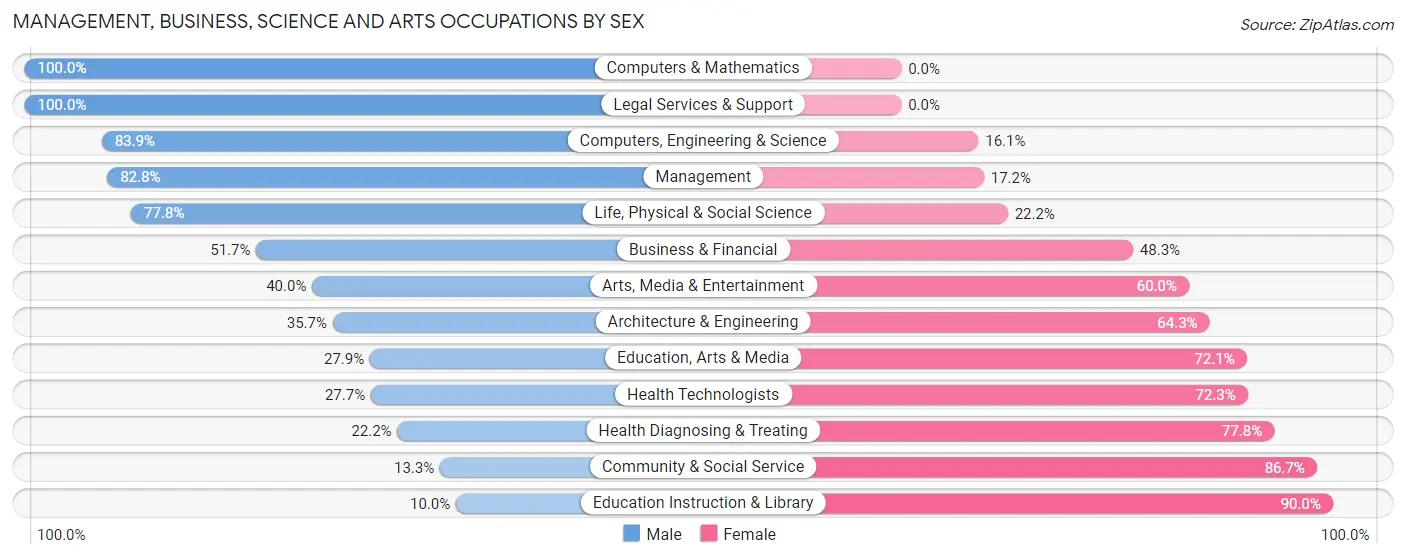
Management, Business, Science and Arts Occupations by Sex
Within the Management, Business, Science and Arts occupations in Wilson County, the most male-oriented occupations are Computers & Mathematics (100.0%), Legal Services & Support (100.0%), and Computers, Engineering & Science (83.9%), while the most female-oriented occupations are Education Instruction & Library (90.0%), Community & Social Service (86.7%), and Health Diagnosing & Treating (77.8%).
| Occupation | Male | Female |
| Management | 408 (82.8%) | 85 (17.2%) |
| Business & Financial | 78 (51.7%) | 73 (48.3%) |
| Computers, Engineering & Science | 146 (83.9%) | 28 (16.1%) |
| Computers & Mathematics | 101 (100.0%) | 0 (0.0%) |
| Architecture & Engineering | 10 (35.7%) | 18 (64.3%) |
| Life, Physical & Social Science | 35 (77.8%) | 10 (22.2%) |
| Community & Social Service | 64 (13.3%) | 416 (86.7%) |
| Education, Arts & Media | 19 (27.9%) | 49 (72.1%) |
| Legal Services & Support | 1 (100.0%) | 0 (0.0%) |
| Education Instruction & Library | 40 (10.0%) | 361 (90.0%) |
| Arts, Media & Entertainment | 4 (40.0%) | 6 (60.0%) |
| Health Diagnosing & Treating | 40 (22.2%) | 140 (77.8%) |
| Health Technologists | 38 (27.7%) | 99 (72.3%) |
| Total (Category) | 736 (49.8%) | 742 (50.2%) |
| Total (Overall) | 2,079 (53.4%) | 1,816 (46.6%) |
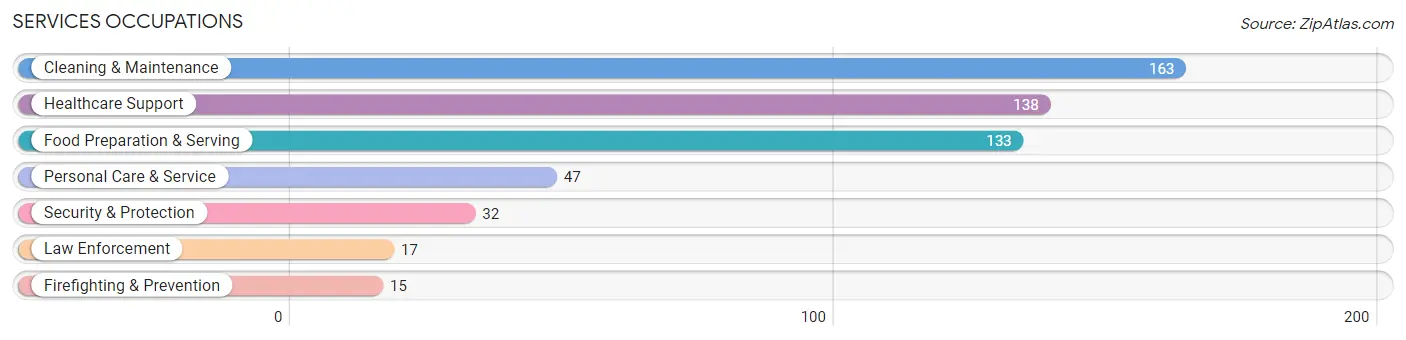
Services Occupations
The most common Services occupations in Wilson County are Cleaning & Maintenance (163 | 4.2%), Healthcare Support (138 | 3.5%), Food Preparation & Serving (133 | 3.4%), Personal Care & Service (47 | 1.2%), and Security & Protection (32 | 0.8%).
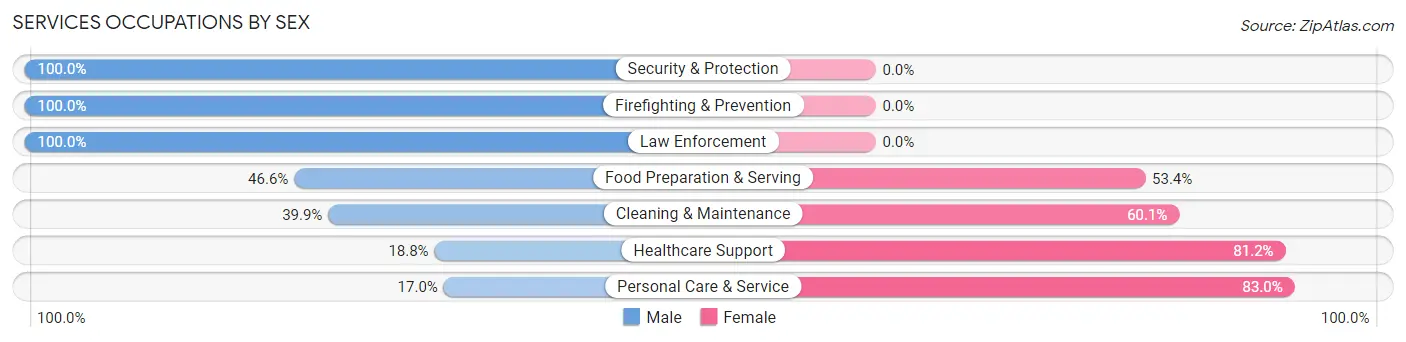
Services Occupations by Sex
Within the Services occupations in Wilson County, the most male-oriented occupations are Security & Protection (100.0%), Firefighting & Prevention (100.0%), and Law Enforcement (100.0%), while the most female-oriented occupations are Personal Care & Service (83.0%), Healthcare Support (81.2%), and Cleaning & Maintenance (60.1%).
| Occupation | Male | Female |
| Healthcare Support | 26 (18.8%) | 112 (81.2%) |
| Security & Protection | 32 (100.0%) | 0 (0.0%) |
| Firefighting & Prevention | 15 (100.0%) | 0 (0.0%) |
| Law Enforcement | 17 (100.0%) | 0 (0.0%) |
| Food Preparation & Serving | 62 (46.6%) | 71 (53.4%) |
| Cleaning & Maintenance | 65 (39.9%) | 98 (60.1%) |
| Personal Care & Service | 8 (17.0%) | 39 (83.0%) |
| Total (Category) | 193 (37.6%) | 320 (62.4%) |
| Total (Overall) | 2,079 (53.4%) | 1,816 (46.6%) |
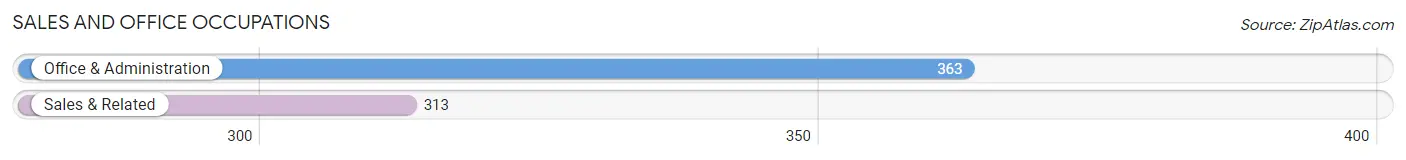
Sales and Office Occupations
The most common Sales and Office occupations in Wilson County are Office & Administration (363 | 9.3%), and Sales & Related (313 | 8.0%).
Sales and Office Occupations by Sex
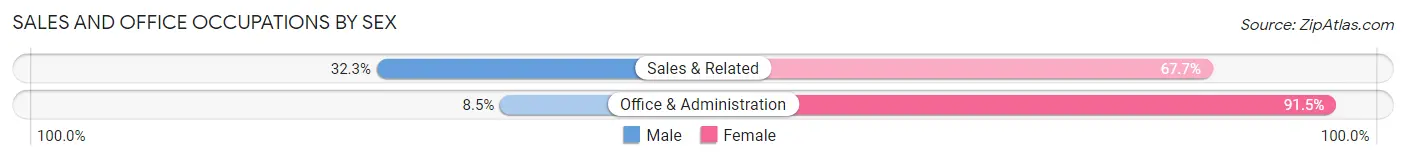
| Occupation | Male | Female |
| Sales & Related | 101 (32.3%) | 212 (67.7%) |
| Office & Administration | 31 (8.5%) | 332 (91.5%) |
| Total (Category) | 132 (19.5%) | 544 (80.5%) |
| Total (Overall) | 2,079 (53.4%) | 1,816 (46.6%) |
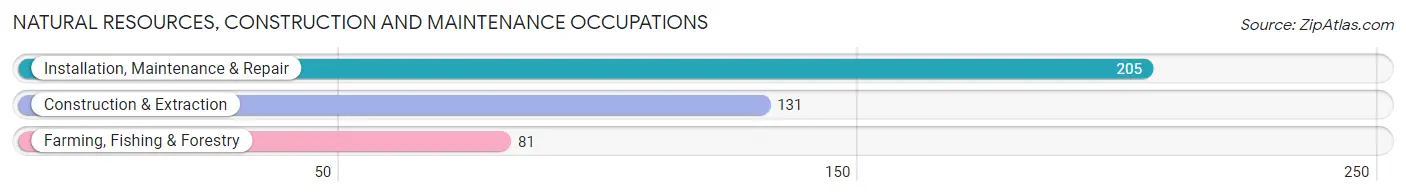
Natural Resources, Construction and Maintenance Occupations
The most common Natural Resources, Construction and Maintenance occupations in Wilson County are Installation, Maintenance & Repair (205 | 5.3%), Construction & Extraction (131 | 3.4%), and Farming, Fishing & Forestry (81 | 2.1%).
Natural Resources, Construction and Maintenance Occupations by Sex
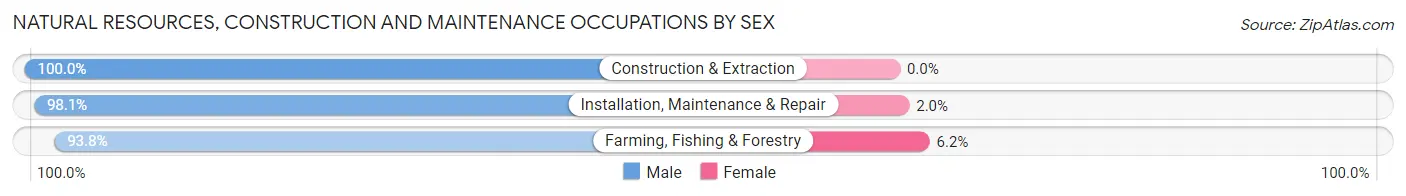
| Occupation | Male | Female |
| Farming, Fishing & Forestry | 76 (93.8%) | 5 (6.2%) |
| Construction & Extraction | 131 (100.0%) | 0 (0.0%) |
| Installation, Maintenance & Repair | 201 (98.1%) | 4 (1.9%) |
| Total (Category) | 408 (97.8%) | 9 (2.2%) |
| Total (Overall) | 2,079 (53.4%) | 1,816 (46.6%) |
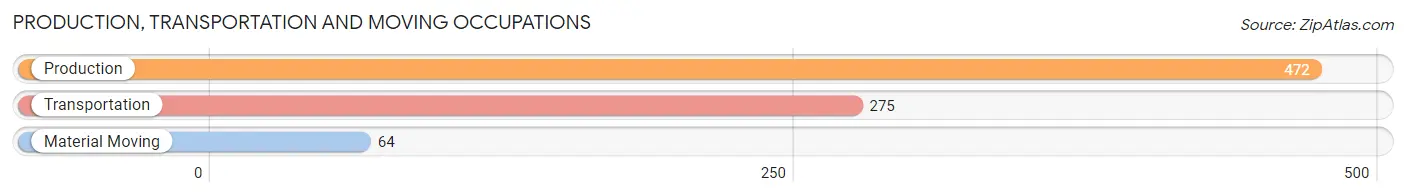
Production, Transportation and Moving Occupations
The most common Production, Transportation and Moving occupations in Wilson County are Production (472 | 12.1%), Transportation (275 | 7.1%), and Material Moving (64 | 1.6%).
Production, Transportation and Moving Occupations by Sex
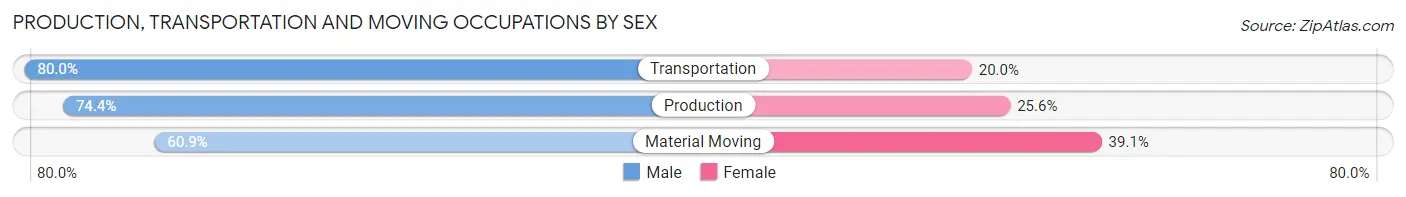
| Occupation | Male | Female |
| Production | 351 (74.4%) | 121 (25.6%) |
| Transportation | 220 (80.0%) | 55 (20.0%) |
| Material Moving | 39 (60.9%) | 25 (39.1%) |
| Total (Category) | 610 (75.2%) | 201 (24.8%) |
| Total (Overall) | 2,079 (53.4%) | 1,816 (46.6%) |
Employment Industries by Sex in Wilson County
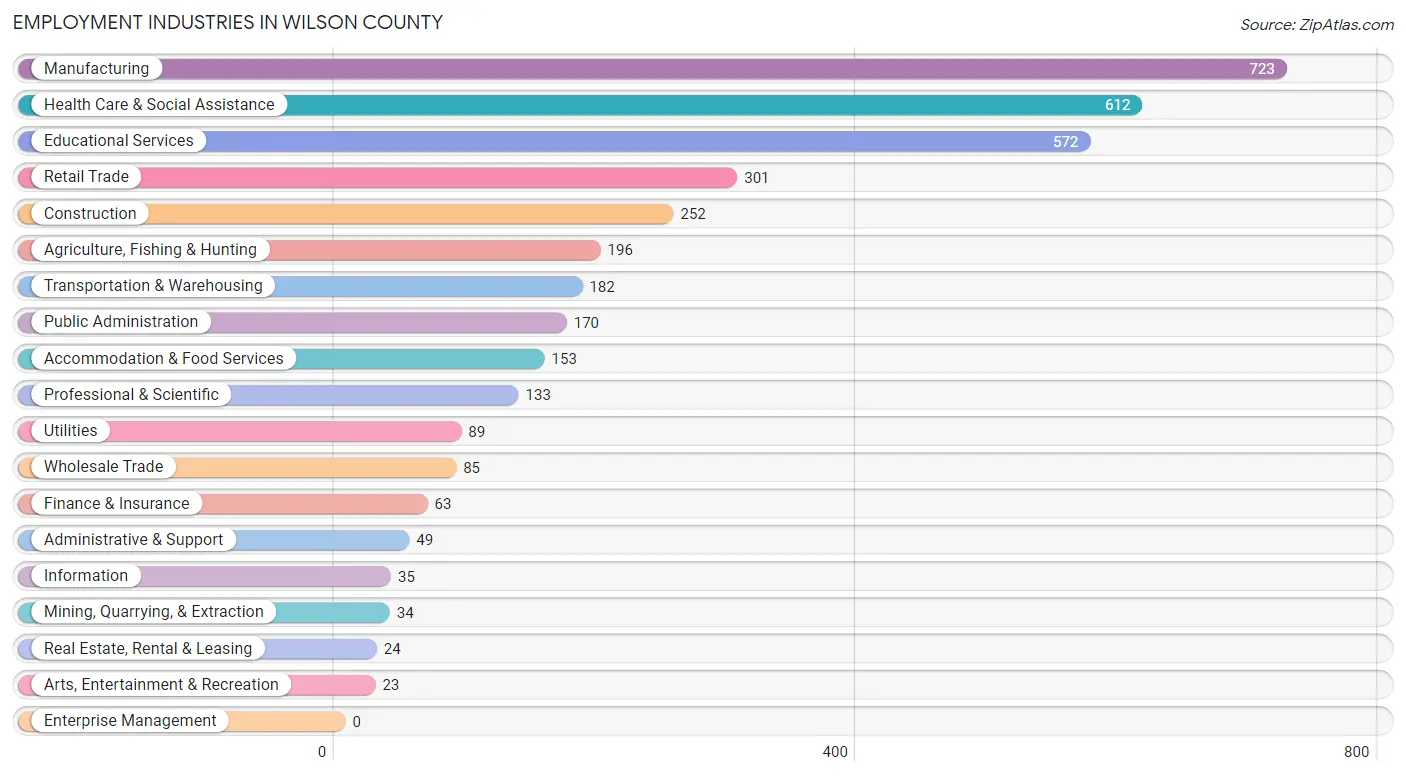
Employment Industries in Wilson County
The major employment industries in Wilson County include Manufacturing (723 | 18.6%), Health Care & Social Assistance (612 | 15.7%), Educational Services (572 | 14.7%), Retail Trade (301 | 7.7%), and Construction (252 | 6.5%).
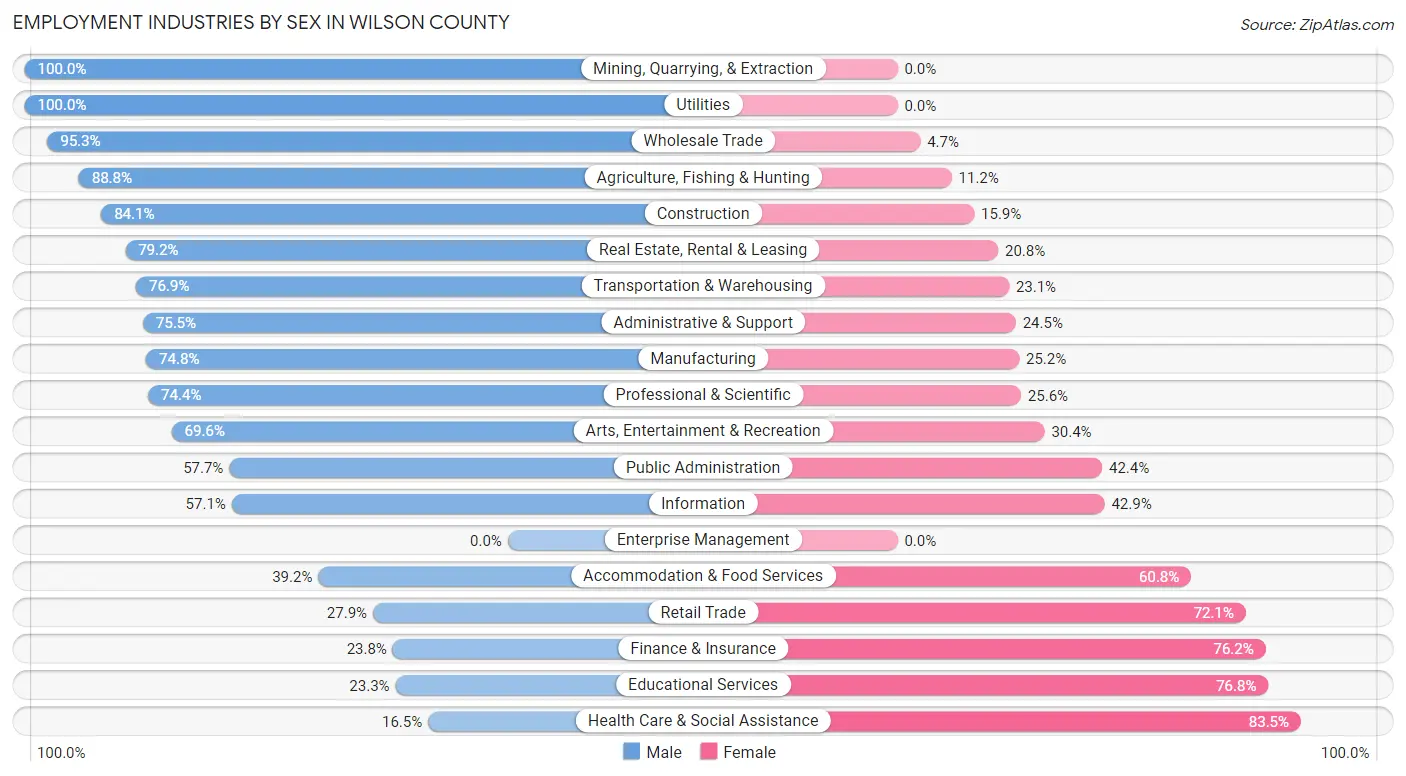
Employment Industries by Sex in Wilson County
The Wilson County industries that see more men than women are Mining, Quarrying, & Extraction (100.0%), Utilities (100.0%), and Wholesale Trade (95.3%), whereas the industries that tend to have a higher number of women are Health Care & Social Assistance (83.5%), Educational Services (76.7%), and Finance & Insurance (76.2%).
| Industry | Male | Female |
| Agriculture, Fishing & Hunting | 174 (88.8%) | 22 (11.2%) |
| Mining, Quarrying, & Extraction | 34 (100.0%) | 0 (0.0%) |
| Construction | 212 (84.1%) | 40 (15.9%) |
| Manufacturing | 541 (74.8%) | 182 (25.2%) |
| Wholesale Trade | 81 (95.3%) | 4 (4.7%) |
| Retail Trade | 84 (27.9%) | 217 (72.1%) |
| Transportation & Warehousing | 140 (76.9%) | 42 (23.1%) |
| Utilities | 89 (100.0%) | 0 (0.0%) |
| Information | 20 (57.1%) | 15 (42.9%) |
| Finance & Insurance | 15 (23.8%) | 48 (76.2%) |
| Real Estate, Rental & Leasing | 19 (79.2%) | 5 (20.8%) |
| Professional & Scientific | 99 (74.4%) | 34 (25.6%) |
| Enterprise Management | 0 (0.0%) | 0 (0.0%) |
| Administrative & Support | 37 (75.5%) | 12 (24.5%) |
| Educational Services | 133 (23.3%) | 439 (76.7%) |
| Health Care & Social Assistance | 101 (16.5%) | 511 (83.5%) |
| Arts, Entertainment & Recreation | 16 (69.6%) | 7 (30.4%) |
| Accommodation & Food Services | 60 (39.2%) | 93 (60.8%) |
| Public Administration | 98 (57.7%) | 72 (42.3%) |
| Total | 2,079 (53.4%) | 1,816 (46.6%) |
Education in Wilson County
School Enrollment in Wilson County
The most common levels of schooling among the 1,855 students in Wilson County are high school (570 | 30.7%), elementary school (494 | 26.6%), and middle school (377 | 20.3%).
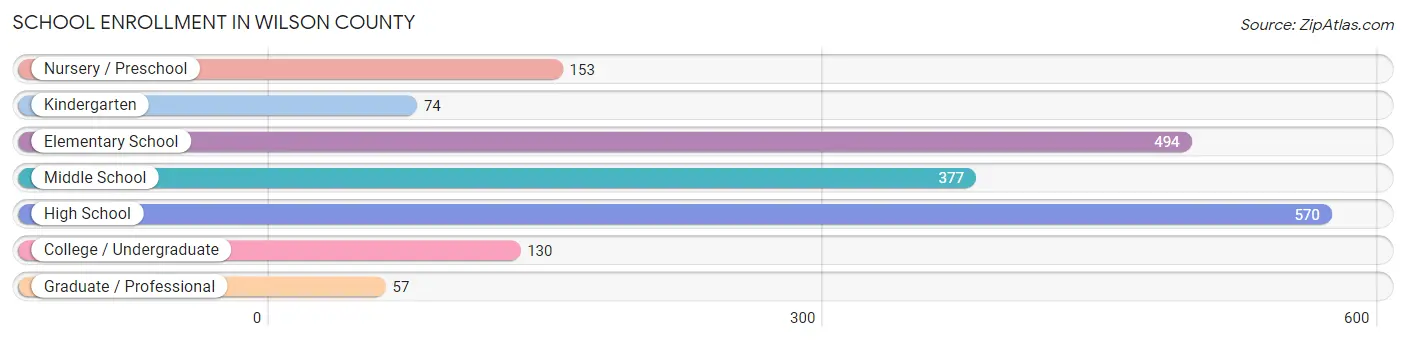
| School Level | # Students | % Students |
| Nursery / Preschool | 153 | 8.3% |
| Kindergarten | 74 | 4.0% |
| Elementary School | 494 | 26.6% |
| Middle School | 377 | 20.3% |
| High School | 570 | 30.7% |
| College / Undergraduate | 130 | 7.0% |
| Graduate / Professional | 57 | 3.1% |
| Total | 1,855 | 100.0% |
School Enrollment by Age by Funding Source in Wilson County
Out of a total of 1,855 students who are enrolled in schools in Wilson County, 210 (11.3%) attend a private institution, while the remaining 1,645 (88.7%) are enrolled in public schools. The age group of 3 to 4 year olds has the highest likelihood of being enrolled in private schools, with 21 (42.0% in the age bracket) enrolled. Conversely, the age group of 18 to 19 year olds has the lowest likelihood of being enrolled in a private school, with 114 (100.0% in the age bracket) attending a public institution.
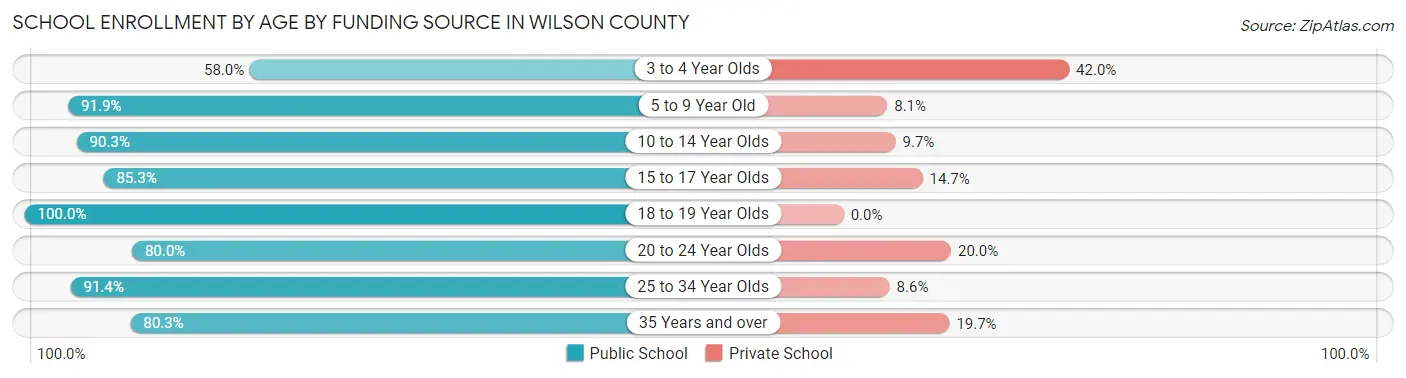
| Age Bracket | Public School | Private School |
| 3 to 4 Year Olds | 29 (58.0%) | 21 (42.0%) |
| 5 to 9 Year Old | 577 (91.9%) | 51 (8.1%) |
| 10 to 14 Year Olds | 439 (90.3%) | 47 (9.7%) |
| 15 to 17 Year Olds | 325 (85.3%) | 56 (14.7%) |
| 18 to 19 Year Olds | 114 (100.0%) | 0 (0.0%) |
| 20 to 24 Year Olds | 76 (80.0%) | 19 (20.0%) |
| 25 to 34 Year Olds | 32 (91.4%) | 3 (8.6%) |
| 35 Years and over | 53 (80.3%) | 13 (19.7%) |
| Total | 1,645 (88.7%) | 210 (11.3%) |
Educational Attainment by Field of Study in Wilson County
Education (258 | 20.9%), business (236 | 19.1%), bio, nature & agricultural (234 | 19.0%), science & technology (151 | 12.2%), and arts & humanities (143 | 11.6%) are the most common fields of study among 1,234 individuals in Wilson County who have obtained a bachelor's degree or higher.
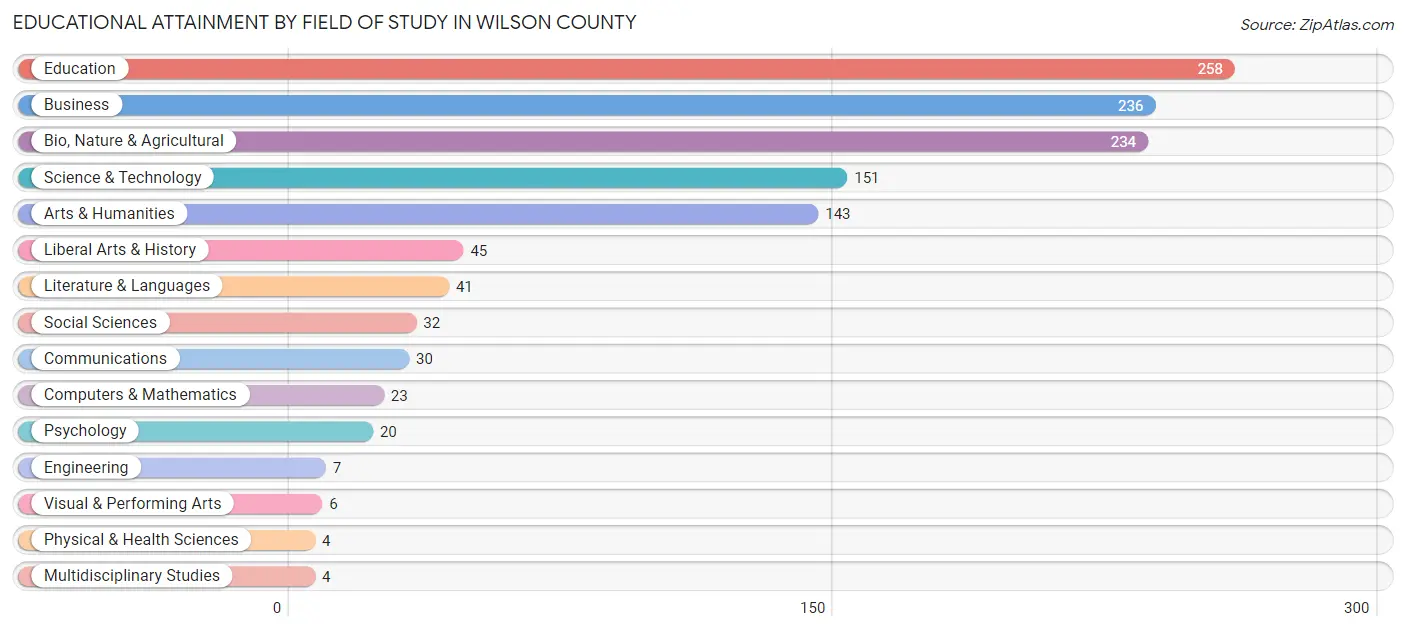
| Field of Study | # Graduates | % Graduates |
| Computers & Mathematics | 23 | 1.9% |
| Bio, Nature & Agricultural | 234 | 19.0% |
| Physical & Health Sciences | 4 | 0.3% |
| Psychology | 20 | 1.6% |
| Social Sciences | 32 | 2.6% |
| Engineering | 7 | 0.6% |
| Multidisciplinary Studies | 4 | 0.3% |
| Science & Technology | 151 | 12.2% |
| Business | 236 | 19.1% |
| Education | 258 | 20.9% |
| Literature & Languages | 41 | 3.3% |
| Liberal Arts & History | 45 | 3.6% |
| Visual & Performing Arts | 6 | 0.5% |
| Communications | 30 | 2.4% |
| Arts & Humanities | 143 | 11.6% |
| Total | 1,234 | 100.0% |
Transportation & Commute in Wilson County
Vehicle Availability by Sex in Wilson County
The most prevalent vehicle ownership categories in Wilson County are males with 2 vehicles (748, accounting for 36.0%) and females with 2 vehicles (473, making up 42.4%).
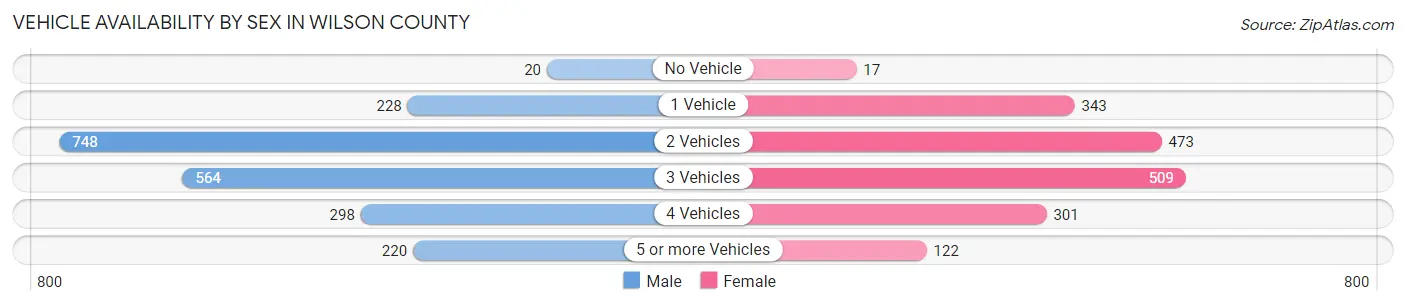
| Vehicles Available | Male | Female |
| No Vehicle | 20 (1.0%) | 17 (1.0%) |
| 1 Vehicle | 228 (11.0%) | 343 (19.4%) |
| 2 Vehicles | 748 (36.0%) | 473 (26.8%) |
| 3 Vehicles | 564 (27.1%) | 509 (28.8%) |
| 4 Vehicles | 298 (14.3%) | 301 (17.1%) |
| 5 or more Vehicles | 220 (10.6%) | 122 (6.9%) |
| Total | 2,078 (100.0%) | 1,765 (100.0%) |
Commute Time in Wilson County
The most frequently occuring commute durations in Wilson County are 5 to 9 minutes (819 commuters, 22.1%), 10 to 14 minutes (574 commuters, 15.5%), and 20 to 24 minutes (573 commuters, 15.5%).
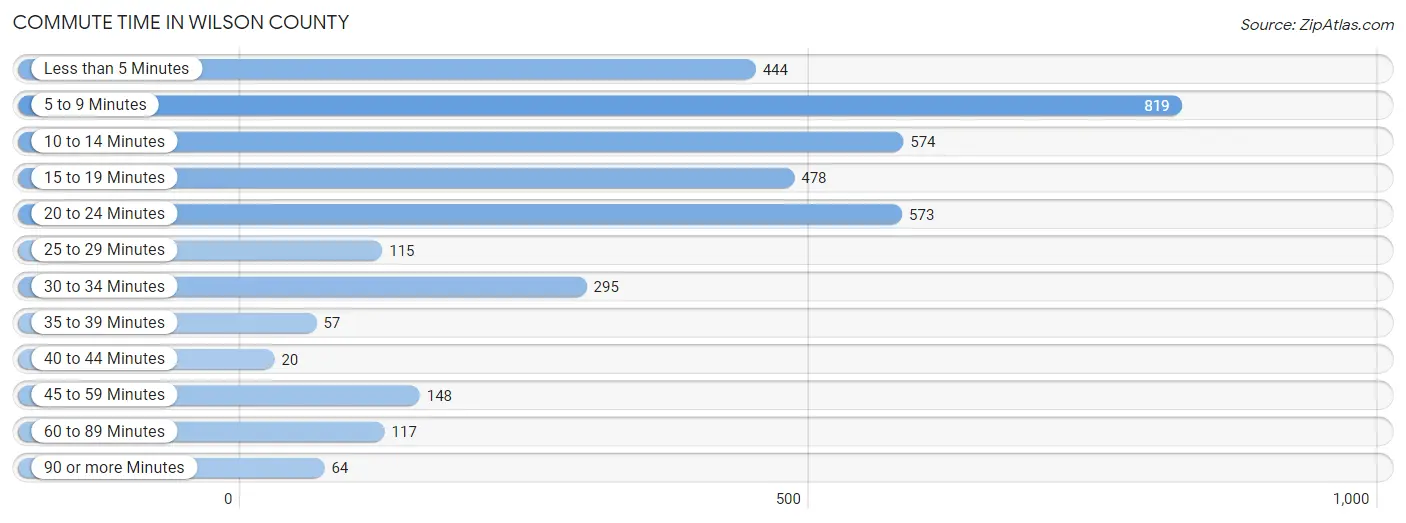
| Commute Time | # Commuters | % Commuters |
| Less than 5 Minutes | 444 | 12.0% |
| 5 to 9 Minutes | 819 | 22.1% |
| 10 to 14 Minutes | 574 | 15.5% |
| 15 to 19 Minutes | 478 | 12.9% |
| 20 to 24 Minutes | 573 | 15.5% |
| 25 to 29 Minutes | 115 | 3.1% |
| 30 to 34 Minutes | 295 | 8.0% |
| 35 to 39 Minutes | 57 | 1.5% |
| 40 to 44 Minutes | 20 | 0.5% |
| 45 to 59 Minutes | 148 | 4.0% |
| 60 to 89 Minutes | 117 | 3.2% |
| 90 or more Minutes | 64 | 1.7% |
Commute Time by Sex in Wilson County
The most common commute times in Wilson County are 5 to 9 minutes (397 commuters, 19.7%) for males and 5 to 9 minutes (422 commuters, 25.0%) for females.
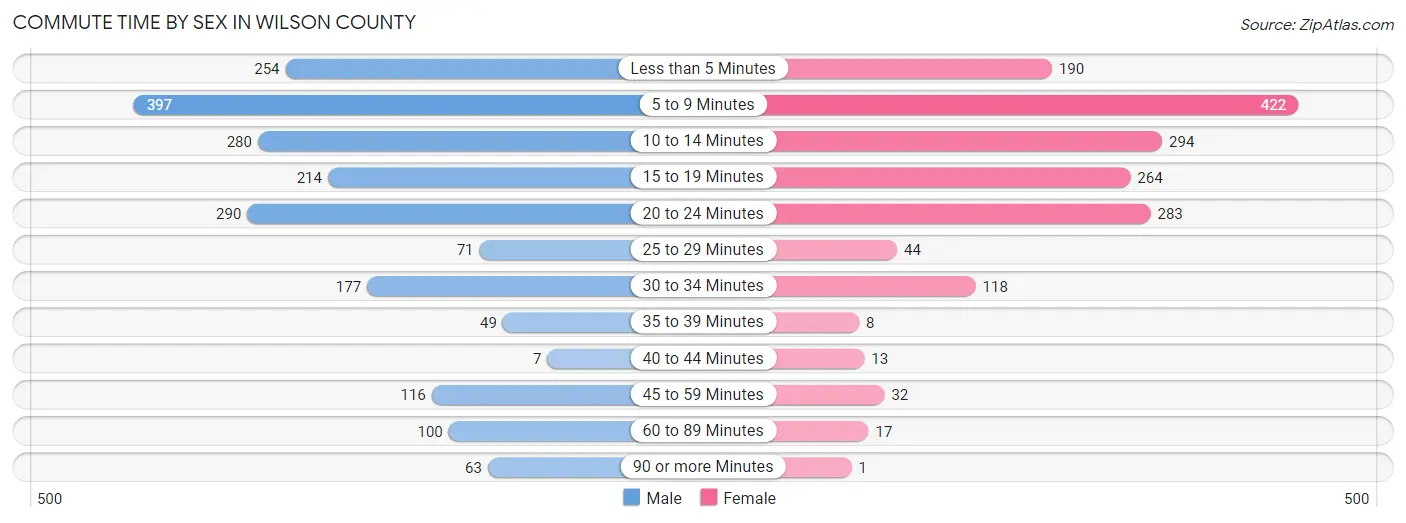
| Commute Time | Male | Female |
| Less than 5 Minutes | 254 (12.6%) | 190 (11.3%) |
| 5 to 9 Minutes | 397 (19.7%) | 422 (25.0%) |
| 10 to 14 Minutes | 280 (13.9%) | 294 (17.4%) |
| 15 to 19 Minutes | 214 (10.6%) | 264 (15.7%) |
| 20 to 24 Minutes | 290 (14.4%) | 283 (16.8%) |
| 25 to 29 Minutes | 71 (3.5%) | 44 (2.6%) |
| 30 to 34 Minutes | 177 (8.8%) | 118 (7.0%) |
| 35 to 39 Minutes | 49 (2.4%) | 8 (0.5%) |
| 40 to 44 Minutes | 7 (0.4%) | 13 (0.8%) |
| 45 to 59 Minutes | 116 (5.8%) | 32 (1.9%) |
| 60 to 89 Minutes | 100 (5.0%) | 17 (1.0%) |
| 90 or more Minutes | 63 (3.1%) | 1 (0.1%) |
Time of Departure to Work by Sex in Wilson County
The most frequent times of departure to work in Wilson County are 5:30 AM to 5:59 AM (317, 15.7%) for males and 7:30 AM to 7:59 AM (334, 19.8%) for females.
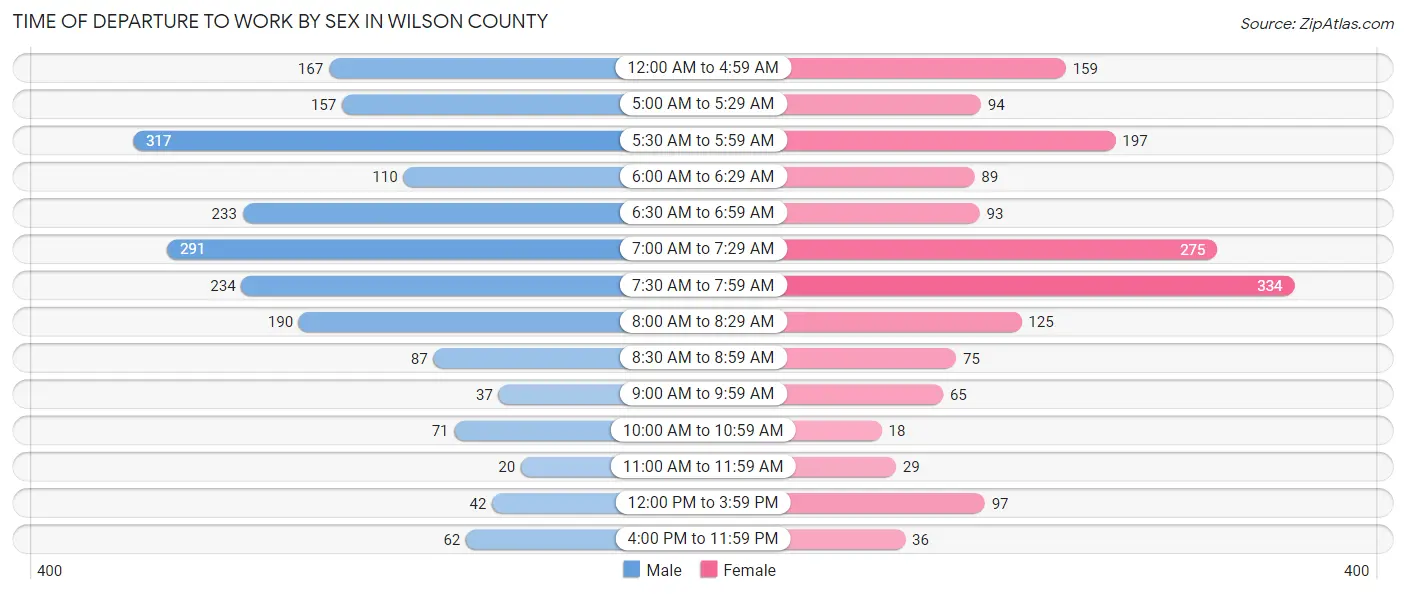
| Time of Departure | Male | Female |
| 12:00 AM to 4:59 AM | 167 (8.3%) | 159 (9.4%) |
| 5:00 AM to 5:29 AM | 157 (7.8%) | 94 (5.6%) |
| 5:30 AM to 5:59 AM | 317 (15.7%) | 197 (11.7%) |
| 6:00 AM to 6:29 AM | 110 (5.4%) | 89 (5.3%) |
| 6:30 AM to 6:59 AM | 233 (11.6%) | 93 (5.5%) |
| 7:00 AM to 7:29 AM | 291 (14.4%) | 275 (16.3%) |
| 7:30 AM to 7:59 AM | 234 (11.6%) | 334 (19.8%) |
| 8:00 AM to 8:29 AM | 190 (9.4%) | 125 (7.4%) |
| 8:30 AM to 8:59 AM | 87 (4.3%) | 75 (4.4%) |
| 9:00 AM to 9:59 AM | 37 (1.8%) | 65 (3.9%) |
| 10:00 AM to 10:59 AM | 71 (3.5%) | 18 (1.1%) |
| 11:00 AM to 11:59 AM | 20 (1.0%) | 29 (1.7%) |
| 12:00 PM to 3:59 PM | 42 (2.1%) | 97 (5.8%) |
| 4:00 PM to 11:59 PM | 62 (3.1%) | 36 (2.1%) |
| Total | 2,018 (100.0%) | 1,686 (100.0%) |
Housing Occupancy in Wilson County
Occupancy by Ownership in Wilson County
Of the total 3,492 dwellings in Wilson County, owner-occupied units account for 2,534 (72.6%), while renter-occupied units make up 958 (27.4%).
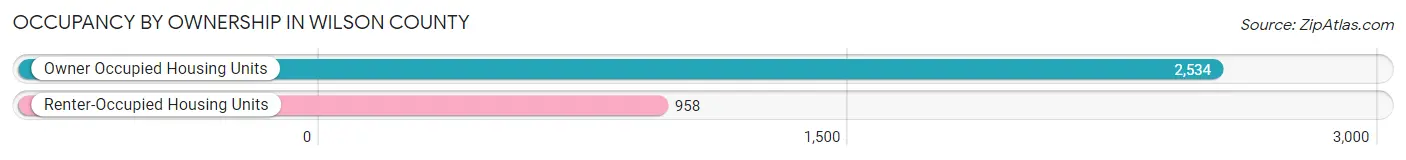
| Occupancy | # Housing Units | % Housing Units |
| Owner Occupied Housing Units | 2,534 | 72.6% |
| Renter-Occupied Housing Units | 958 | 27.4% |
| Total Occupied Housing Units | 3,492 | 100.0% |
Occupancy by Household Size in Wilson County
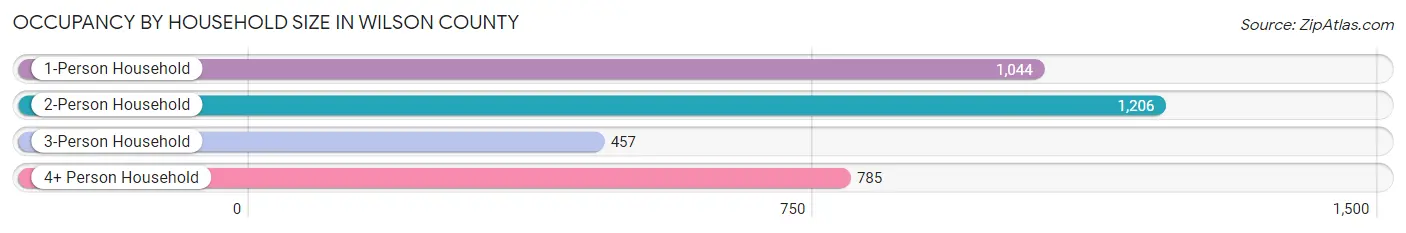
| Household Size | # Housing Units | % Housing Units |
| 1-Person Household | 1,044 | 29.9% |
| 2-Person Household | 1,206 | 34.5% |
| 3-Person Household | 457 | 13.1% |
| 4+ Person Household | 785 | 22.5% |
| Total Housing Units | 3,492 | 100.0% |
Occupancy by Ownership by Household Size in Wilson County
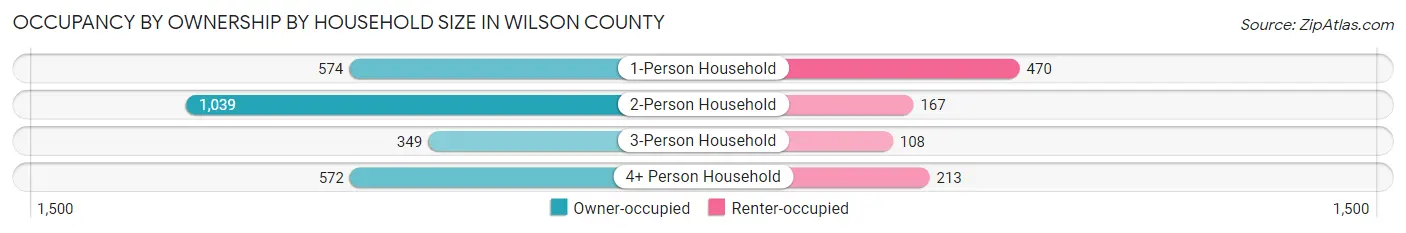
| Household Size | Owner-occupied | Renter-occupied |
| 1-Person Household | 574 (55.0%) | 470 (45.0%) |
| 2-Person Household | 1,039 (86.2%) | 167 (13.9%) |
| 3-Person Household | 349 (76.4%) | 108 (23.6%) |
| 4+ Person Household | 572 (72.9%) | 213 (27.1%) |
| Total Housing Units | 2,534 (72.6%) | 958 (27.4%) |
Occupancy by Educational Attainment in Wilson County
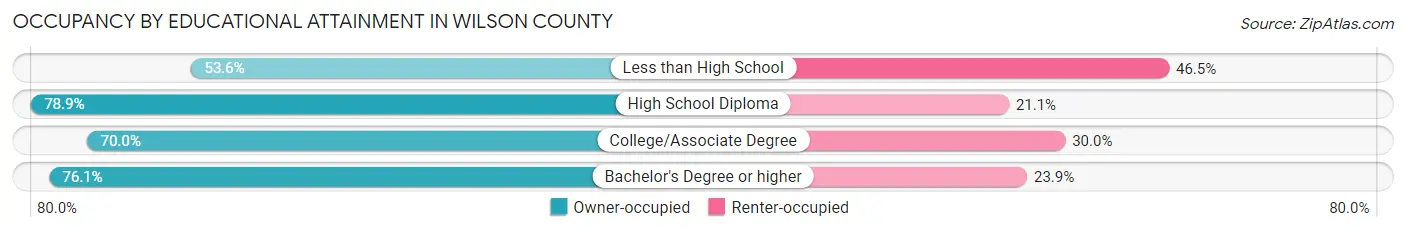
| Household Size | Owner-occupied | Renter-occupied |
| Less than High School | 151 (53.5%) | 131 (46.5%) |
| High School Diploma | 862 (78.9%) | 230 (21.1%) |
| College/Associate Degree | 1,041 (70.0%) | 446 (30.0%) |
| Bachelor's Degree or higher | 480 (76.1%) | 151 (23.9%) |
Occupancy by Age of Householder in Wilson County
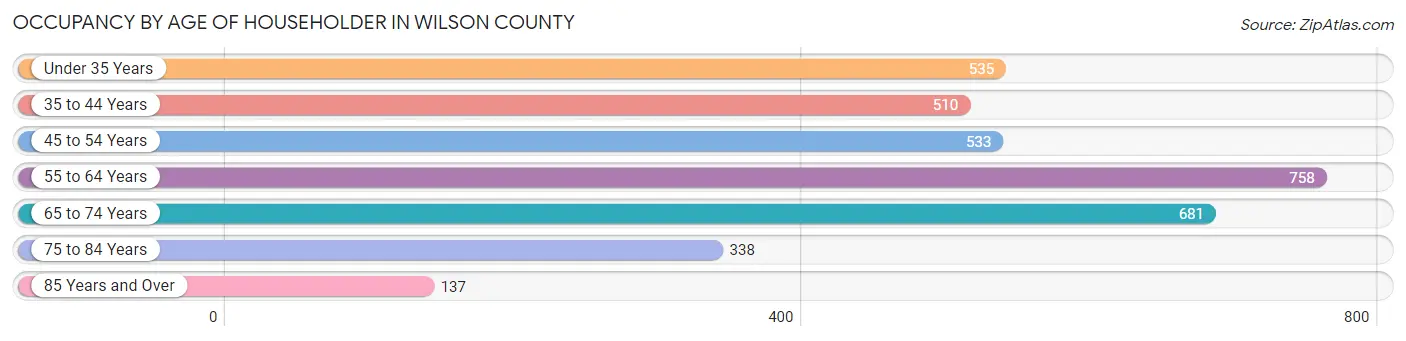
| Age Bracket | # Households | % Households |
| Under 35 Years | 535 | 15.3% |
| 35 to 44 Years | 510 | 14.6% |
| 45 to 54 Years | 533 | 15.3% |
| 55 to 64 Years | 758 | 21.7% |
| 65 to 74 Years | 681 | 19.5% |
| 75 to 84 Years | 338 | 9.7% |
| 85 Years and Over | 137 | 3.9% |
| Total | 3,492 | 100.0% |
Housing Finances in Wilson County
Median Income by Occupancy in Wilson County
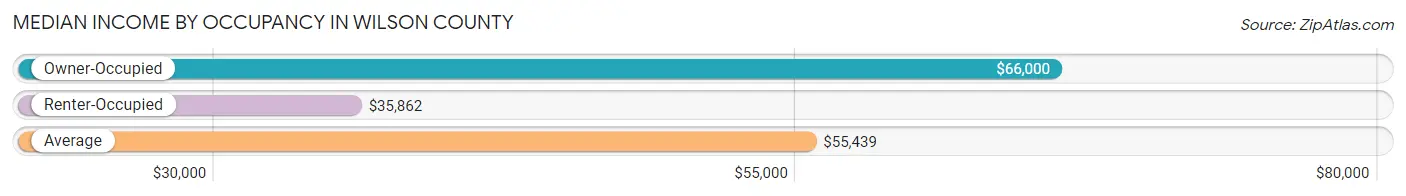
| Occupancy Type | # Households | Median Income |
| Owner-Occupied | 2,534 (72.6%) | $66,000 |
| Renter-Occupied | 958 (27.4%) | $35,862 |
| Average | 3,492 (100.0%) | $55,439 |
Occupancy by Householder Income Bracket in Wilson County
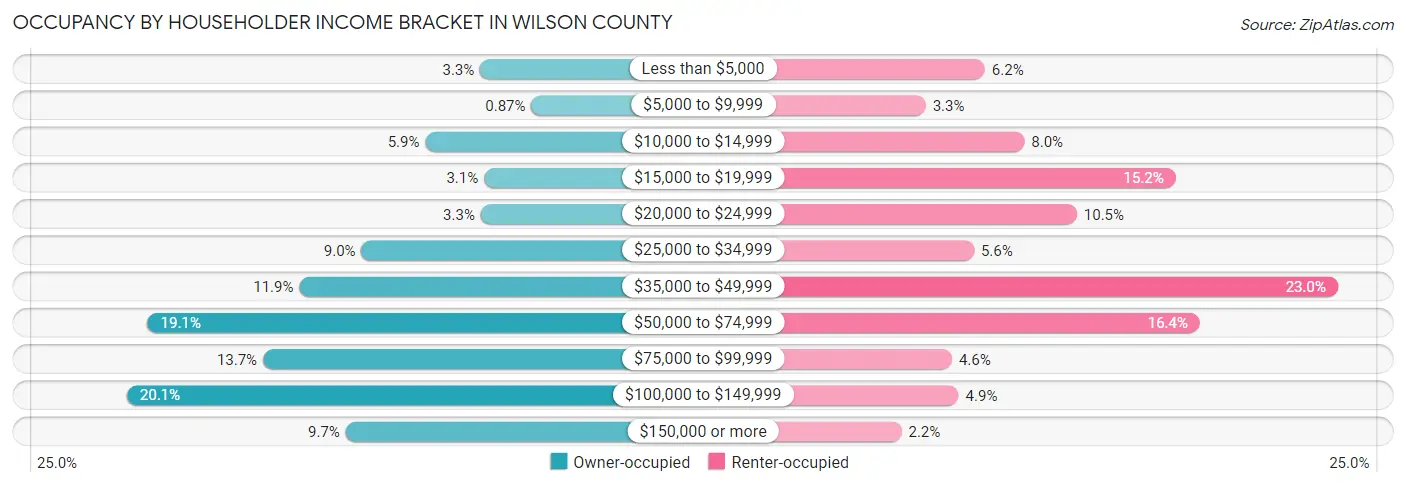
| Income Bracket | Owner-occupied | Renter-occupied |
| Less than $5,000 | 84 (3.3%) | 59 (6.2%) |
| $5,000 to $9,999 | 22 (0.9%) | 32 (3.3%) |
| $10,000 to $14,999 | 150 (5.9%) | 77 (8.0%) |
| $15,000 to $19,999 | 79 (3.1%) | 146 (15.2%) |
| $20,000 to $24,999 | 83 (3.3%) | 101 (10.5%) |
| $25,000 to $34,999 | 227 (9.0%) | 54 (5.6%) |
| $35,000 to $49,999 | 302 (11.9%) | 220 (23.0%) |
| $50,000 to $74,999 | 485 (19.1%) | 157 (16.4%) |
| $75,000 to $99,999 | 346 (13.7%) | 44 (4.6%) |
| $100,000 to $149,999 | 510 (20.1%) | 47 (4.9%) |
| $150,000 or more | 246 (9.7%) | 21 (2.2%) |
| Total | 2,534 (100.0%) | 958 (100.0%) |
Monthly Housing Cost Tiers in Wilson County
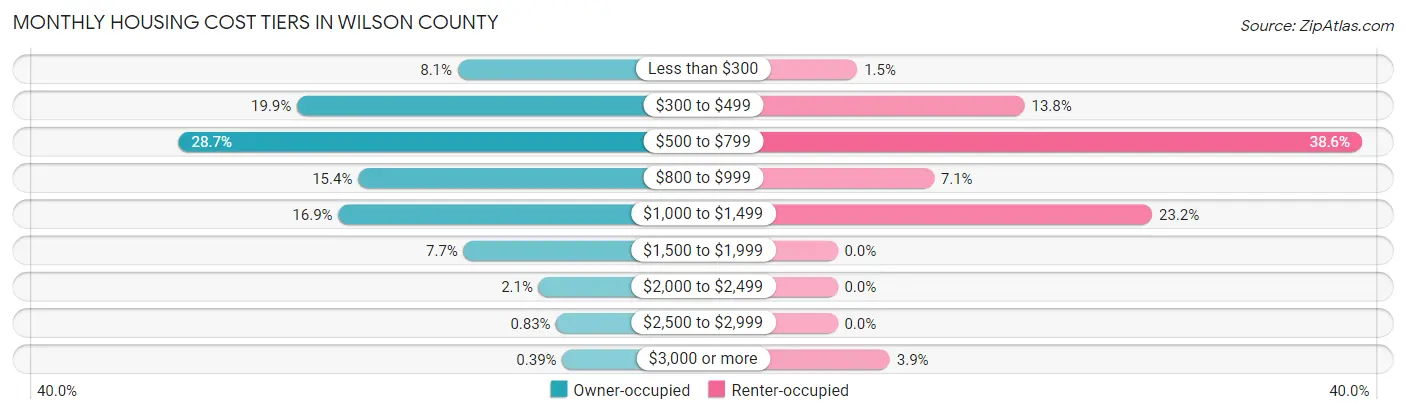
| Monthly Cost | Owner-occupied | Renter-occupied |
| Less than $300 | 205 (8.1%) | 14 (1.5%) |
| $300 to $499 | 505 (19.9%) | 132 (13.8%) |
| $500 to $799 | 726 (28.6%) | 370 (38.6%) |
| $800 to $999 | 391 (15.4%) | 68 (7.1%) |
| $1,000 to $1,499 | 428 (16.9%) | 222 (23.2%) |
| $1,500 to $1,999 | 194 (7.7%) | 0 (0.0%) |
| $2,000 to $2,499 | 54 (2.1%) | 0 (0.0%) |
| $2,500 to $2,999 | 21 (0.8%) | 0 (0.0%) |
| $3,000 or more | 10 (0.4%) | 37 (3.9%) |
| Total | 2,534 (100.0%) | 958 (100.0%) |
Physical Housing Characteristics in Wilson County
Housing Structures in Wilson County
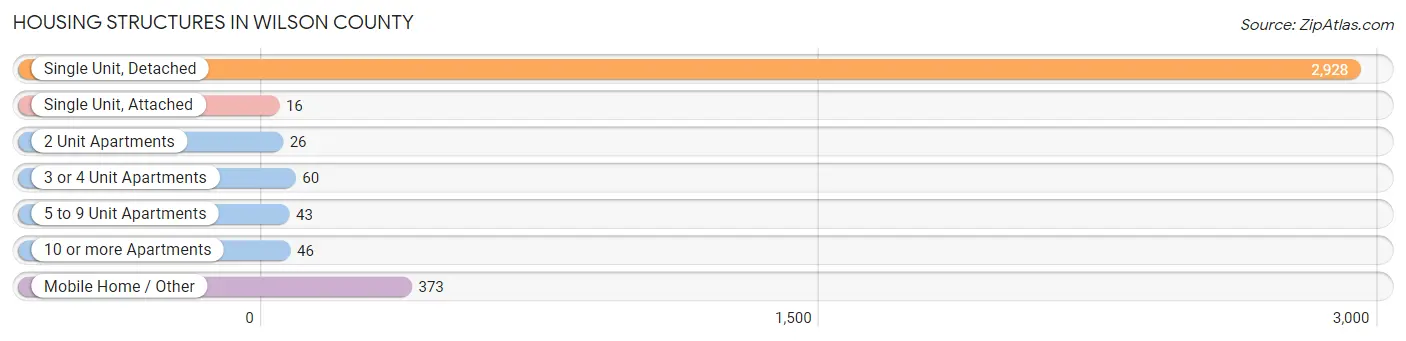
| Structure Type | # Housing Units | % Housing Units |
| Single Unit, Detached | 2,928 | 83.9% |
| Single Unit, Attached | 16 | 0.5% |
| 2 Unit Apartments | 26 | 0.7% |
| 3 or 4 Unit Apartments | 60 | 1.7% |
| 5 to 9 Unit Apartments | 43 | 1.2% |
| 10 or more Apartments | 46 | 1.3% |
| Mobile Home / Other | 373 | 10.7% |
| Total | 3,492 | 100.0% |
Housing Structures by Occupancy in Wilson County
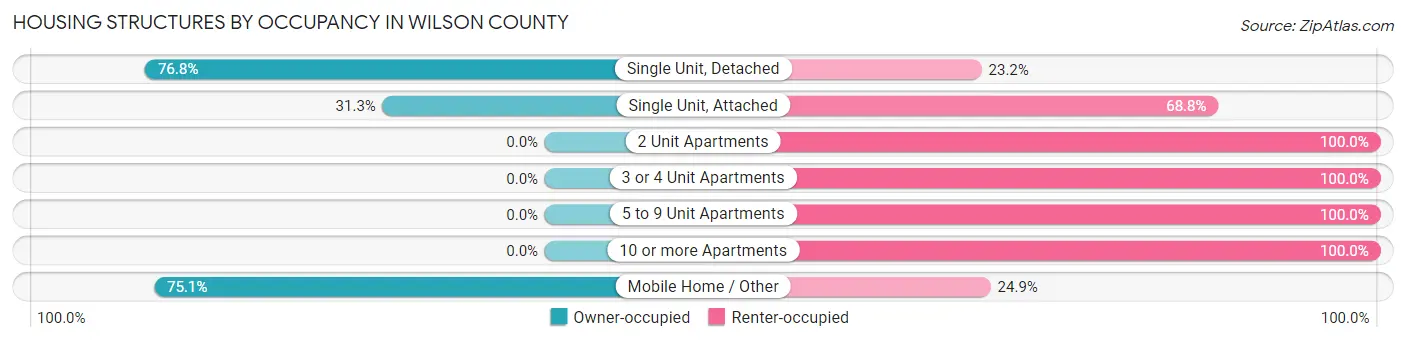
| Structure Type | Owner-occupied | Renter-occupied |
| Single Unit, Detached | 2,249 (76.8%) | 679 (23.2%) |
| Single Unit, Attached | 5 (31.2%) | 11 (68.8%) |
| 2 Unit Apartments | 0 (0.0%) | 26 (100.0%) |
| 3 or 4 Unit Apartments | 0 (0.0%) | 60 (100.0%) |
| 5 to 9 Unit Apartments | 0 (0.0%) | 43 (100.0%) |
| 10 or more Apartments | 0 (0.0%) | 46 (100.0%) |
| Mobile Home / Other | 280 (75.1%) | 93 (24.9%) |
| Total | 2,534 (72.6%) | 958 (27.4%) |
Housing Structures by Number of Rooms in Wilson County
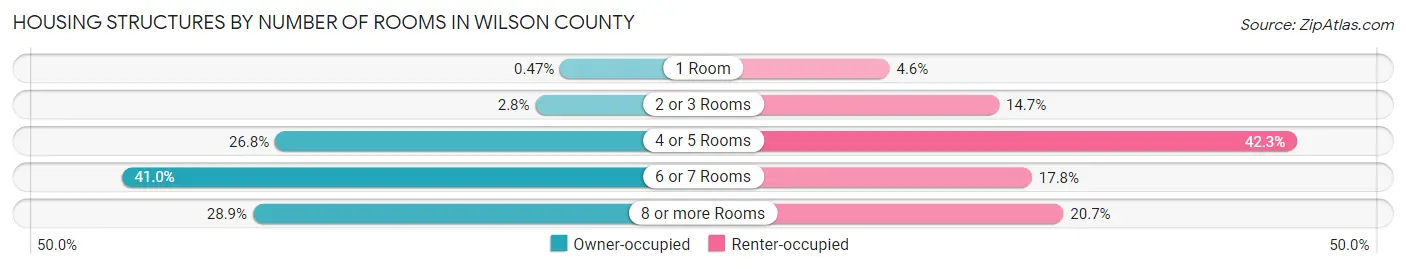
| Number of Rooms | Owner-occupied | Renter-occupied |
| 1 Room | 12 (0.5%) | 44 (4.6%) |
| 2 or 3 Rooms | 70 (2.8%) | 141 (14.7%) |
| 4 or 5 Rooms | 680 (26.8%) | 405 (42.3%) |
| 6 or 7 Rooms | 1,040 (41.0%) | 170 (17.7%) |
| 8 or more Rooms | 732 (28.9%) | 198 (20.7%) |
| Total | 2,534 (100.0%) | 958 (100.0%) |
Housing Structure by Heating Type in Wilson County
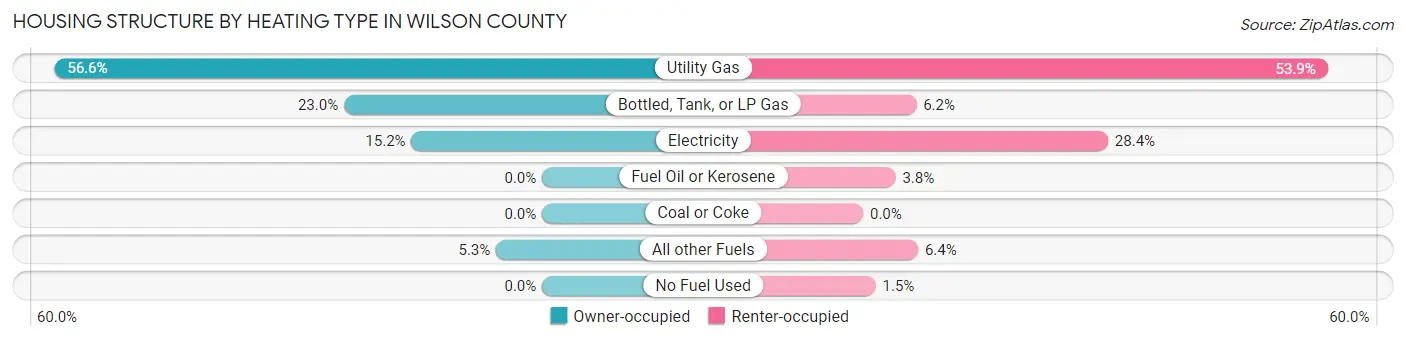
| Heating Type | Owner-occupied | Renter-occupied |
| Utility Gas | 1,433 (56.6%) | 516 (53.9%) |
| Bottled, Tank, or LP Gas | 582 (23.0%) | 59 (6.2%) |
| Electricity | 384 (15.1%) | 272 (28.4%) |
| Fuel Oil or Kerosene | 0 (0.0%) | 36 (3.8%) |
| Coal or Coke | 0 (0.0%) | 0 (0.0%) |
| All other Fuels | 135 (5.3%) | 61 (6.4%) |
| No Fuel Used | 0 (0.0%) | 14 (1.5%) |
| Total | 2,534 (100.0%) | 958 (100.0%) |
Household Vehicle Usage in Wilson County
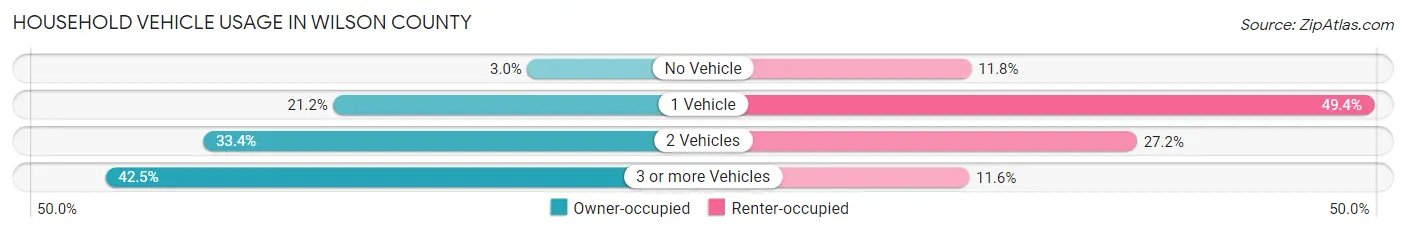
| Vehicles per Household | Owner-occupied | Renter-occupied |
| No Vehicle | 77 (3.0%) | 113 (11.8%) |
| 1 Vehicle | 536 (21.1%) | 473 (49.4%) |
| 2 Vehicles | 845 (33.4%) | 261 (27.2%) |
| 3 or more Vehicles | 1,076 (42.5%) | 111 (11.6%) |
| Total | 2,534 (100.0%) | 958 (100.0%) |
Real Estate & Mortgages in Wilson County
Real Estate and Mortgage Overview in Wilson County
| Characteristic | Without Mortgage | With Mortgage |
| Housing Units | 1,417 | 1,117 |
| Median Property Value | $93,100 | $89,400 |
| Median Household Income | $52,396 | $173 |
| Monthly Housing Costs | $519 | $10 |
| Real Estate Taxes | $1,236 | $20 |
Property Value by Mortgage Status in Wilson County
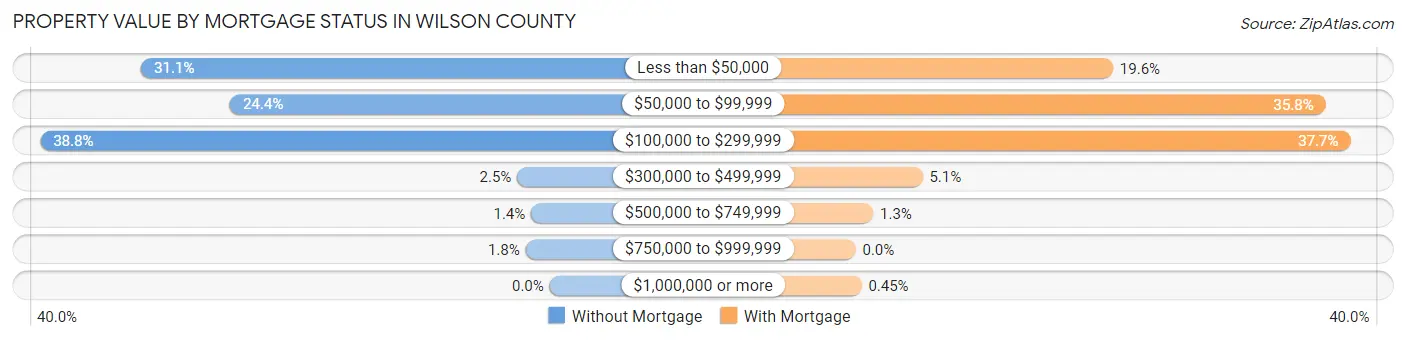
| Property Value | Without Mortgage | With Mortgage |
| Less than $50,000 | 441 (31.1%) | 219 (19.6%) |
| $50,000 to $99,999 | 345 (24.3%) | 400 (35.8%) |
| $100,000 to $299,999 | 550 (38.8%) | 421 (37.7%) |
| $300,000 to $499,999 | 35 (2.5%) | 57 (5.1%) |
| $500,000 to $749,999 | 20 (1.4%) | 15 (1.3%) |
| $750,000 to $999,999 | 26 (1.8%) | 0 (0.0%) |
| $1,000,000 or more | 0 (0.0%) | 5 (0.4%) |
| Total | 1,417 (100.0%) | 1,117 (100.0%) |
Household Income by Mortgage Status in Wilson County
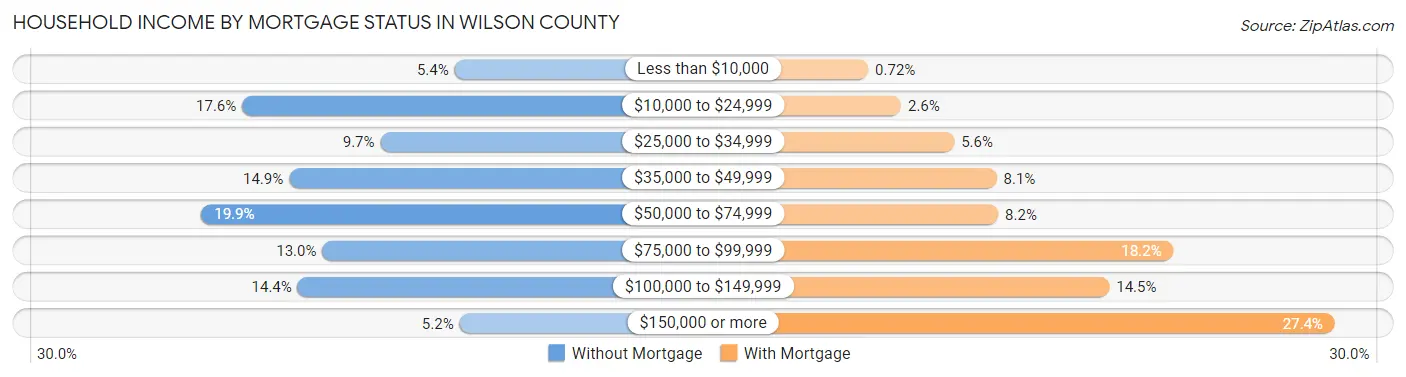
| Household Income | Without Mortgage | With Mortgage |
| Less than $10,000 | 77 (5.4%) | 8 (0.7%) |
| $10,000 to $24,999 | 249 (17.6%) | 29 (2.6%) |
| $25,000 to $34,999 | 137 (9.7%) | 63 (5.6%) |
| $35,000 to $49,999 | 211 (14.9%) | 90 (8.1%) |
| $50,000 to $74,999 | 282 (19.9%) | 91 (8.2%) |
| $75,000 to $99,999 | 184 (13.0%) | 203 (18.2%) |
| $100,000 to $149,999 | 204 (14.4%) | 162 (14.5%) |
| $150,000 or more | 73 (5.1%) | 306 (27.4%) |
| Total | 1,417 (100.0%) | 1,117 (100.0%) |
Property Value to Household Income Ratio in Wilson County
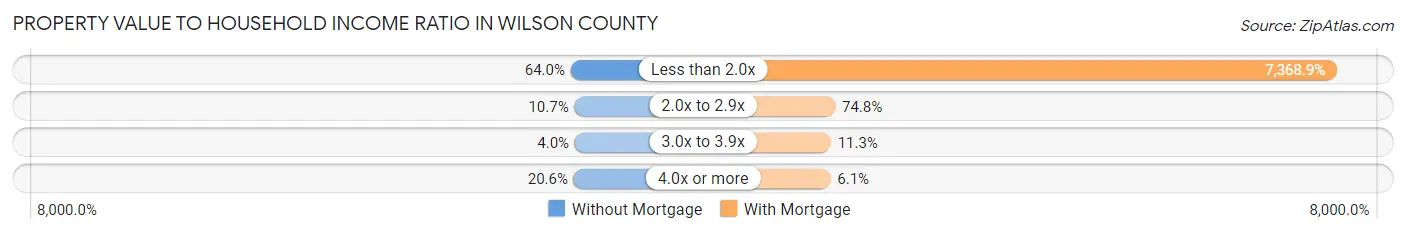
| Value-to-Income Ratio | Without Mortgage | With Mortgage |
| Less than 2.0x | 907 (64.0%) | 82,311 (7,368.9%) |
| 2.0x to 2.9x | 151 (10.7%) | 836 (74.8%) |
| 3.0x to 3.9x | 56 (4.0%) | 126 (11.3%) |
| 4.0x or more | 292 (20.6%) | 68 (6.1%) |
| Total | 1,417 (100.0%) | 1,117 (100.0%) |
Real Estate Taxes by Mortgage Status in Wilson County
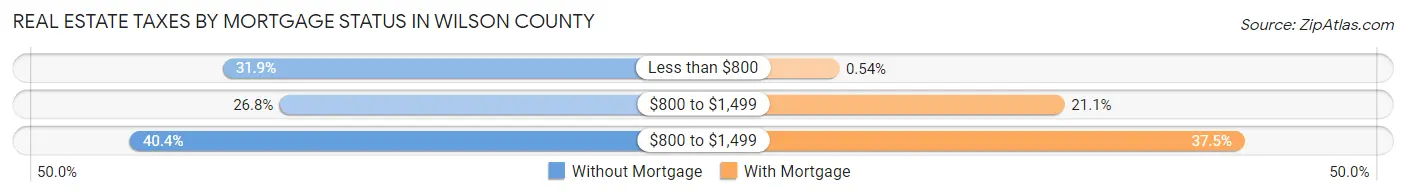
| Property Taxes | Without Mortgage | With Mortgage |
| Less than $800 | 452 (31.9%) | 6 (0.5%) |
| $800 to $1,499 | 379 (26.8%) | 236 (21.1%) |
| $800 to $1,499 | 572 (40.4%) | 419 (37.5%) |
| Total | 1,417 (100.0%) | 1,117 (100.0%) |
Health & Disability in Wilson County
Health Insurance Coverage by Age in Wilson County
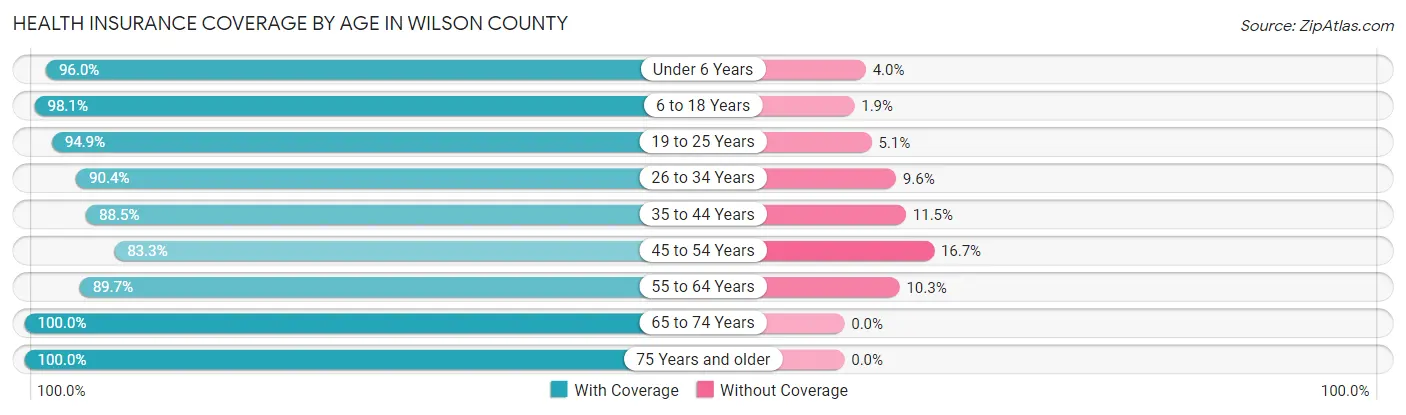
| Age Bracket | With Coverage | Without Coverage |
| Under 6 Years | 625 (96.0%) | 26 (4.0%) |
| 6 to 18 Years | 1,528 (98.1%) | 29 (1.9%) |
| 19 to 25 Years | 486 (94.9%) | 26 (5.1%) |
| 26 to 34 Years | 686 (90.4%) | 73 (9.6%) |
| 35 to 44 Years | 856 (88.5%) | 111 (11.5%) |
| 45 to 54 Years | 822 (83.3%) | 165 (16.7%) |
| 55 to 64 Years | 1,133 (89.7%) | 130 (10.3%) |
| 65 to 74 Years | 1,096 (100.0%) | 0 (0.0%) |
| 75 Years and older | 744 (100.0%) | 0 (0.0%) |
| Total | 7,976 (93.4%) | 560 (6.6%) |
Health Insurance Coverage by Citizenship Status in Wilson County
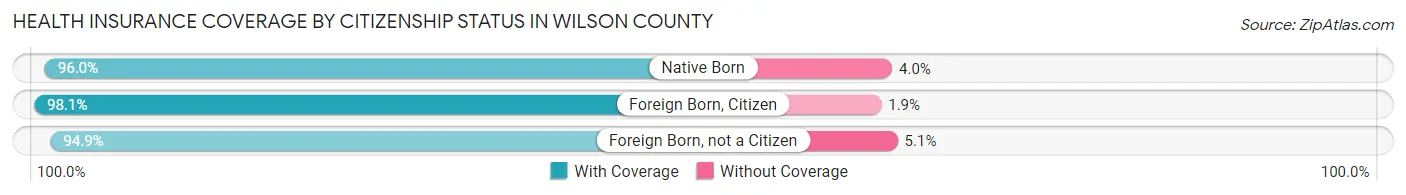
| Citizenship Status | With Coverage | Without Coverage |
| Native Born | 625 (96.0%) | 26 (4.0%) |
| Foreign Born, Citizen | 1,528 (98.1%) | 29 (1.9%) |
| Foreign Born, not a Citizen | 486 (94.9%) | 26 (5.1%) |
Health Insurance Coverage by Household Income in Wilson County
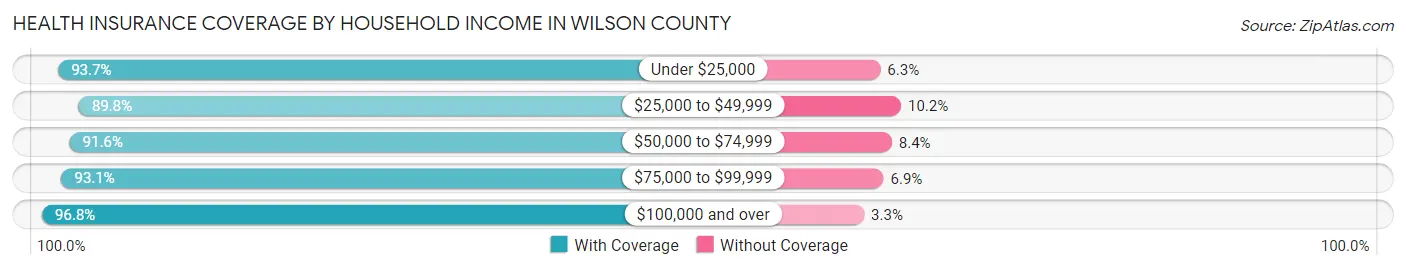
| Household Income | With Coverage | Without Coverage |
| Under $25,000 | 1,249 (93.7%) | 84 (6.3%) |
| $25,000 to $49,999 | 1,556 (89.8%) | 176 (10.2%) |
| $50,000 to $74,999 | 1,541 (91.6%) | 142 (8.4%) |
| $75,000 to $99,999 | 918 (93.1%) | 68 (6.9%) |
| $100,000 and over | 2,681 (96.8%) | 90 (3.3%) |
Public vs Private Health Insurance Coverage by Age in Wilson County
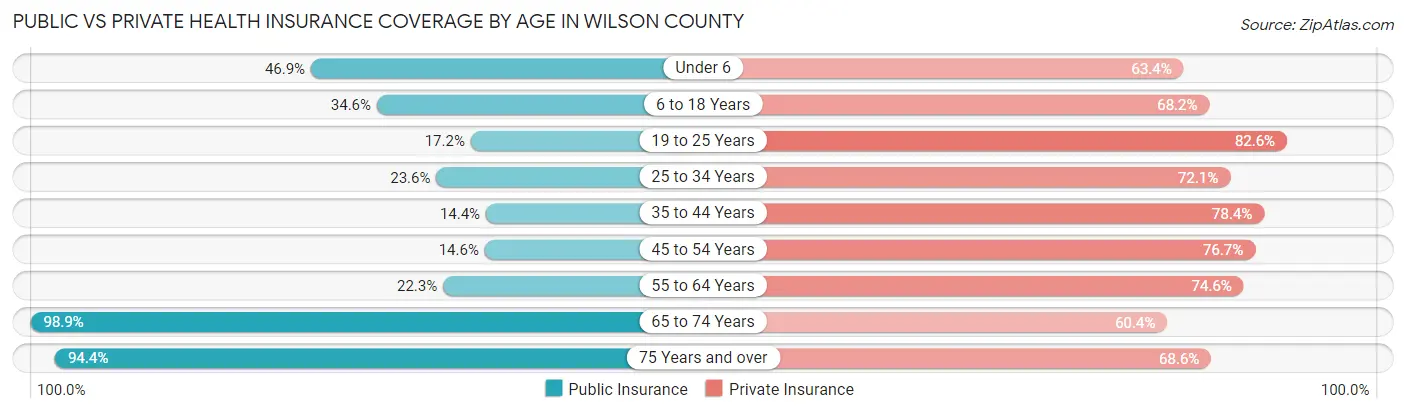
| Age Bracket | Public Insurance | Private Insurance |
| Under 6 | 305 (46.9%) | 413 (63.4%) |
| 6 to 18 Years | 539 (34.6%) | 1,062 (68.2%) |
| 19 to 25 Years | 88 (17.2%) | 423 (82.6%) |
| 25 to 34 Years | 179 (23.6%) | 547 (72.1%) |
| 35 to 44 Years | 139 (14.4%) | 758 (78.4%) |
| 45 to 54 Years | 144 (14.6%) | 757 (76.7%) |
| 55 to 64 Years | 282 (22.3%) | 942 (74.6%) |
| 65 to 74 Years | 1,084 (98.9%) | 662 (60.4%) |
| 75 Years and over | 702 (94.4%) | 510 (68.5%) |
| Total | 3,462 (40.6%) | 6,074 (71.2%) |
Disability Status by Sex by Age in Wilson County
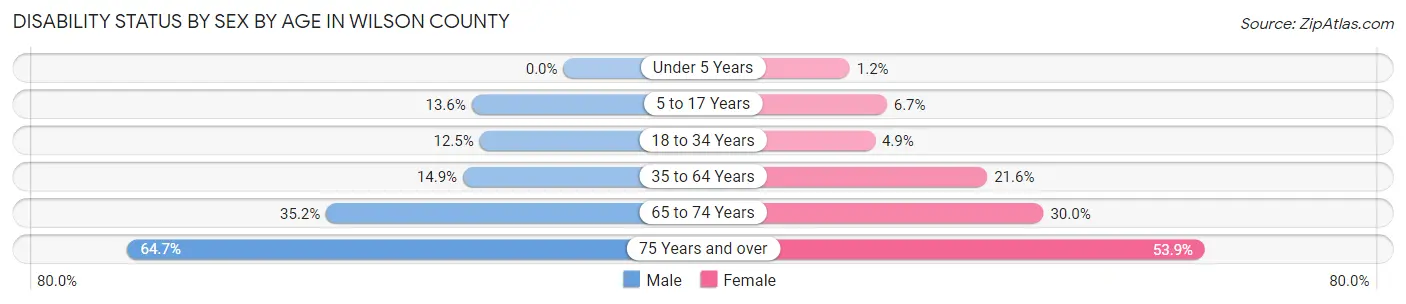
| Age Bracket | Male | Female |
| Under 5 Years | 0 (0.0%) | 3 (1.2%) |
| 5 to 17 Years | 110 (13.6%) | 50 (6.7%) |
| 18 to 34 Years | 87 (12.4%) | 35 (4.9%) |
| 35 to 64 Years | 245 (14.9%) | 340 (21.6%) |
| 65 to 74 Years | 192 (35.2%) | 165 (29.9%) |
| 75 Years and over | 209 (64.7%) | 227 (53.9%) |
Disability Class by Sex by Age in Wilson County
Disability Class: Hearing Difficulty
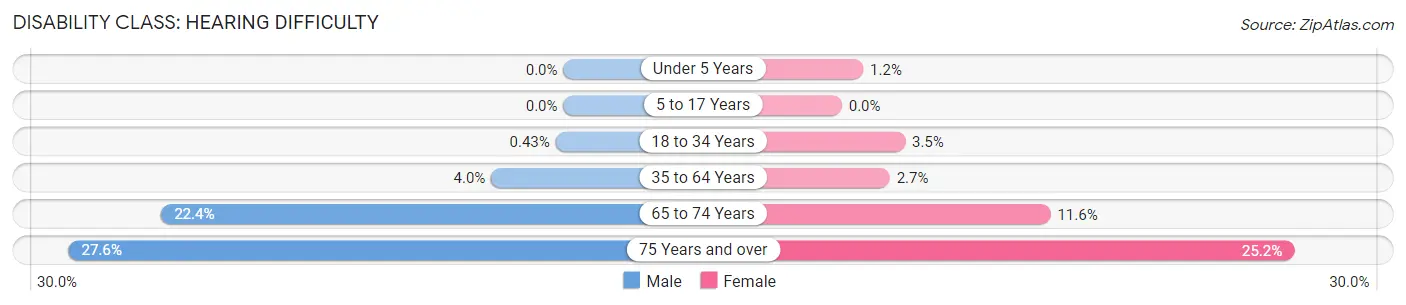
| Age Bracket | Male | Female |
| Under 5 Years | 0 (0.0%) | 3 (1.2%) |
| 5 to 17 Years | 0 (0.0%) | 0 (0.0%) |
| 18 to 34 Years | 3 (0.4%) | 25 (3.5%) |
| 35 to 64 Years | 66 (4.0%) | 42 (2.7%) |
| 65 to 74 Years | 122 (22.4%) | 64 (11.6%) |
| 75 Years and over | 89 (27.6%) | 106 (25.2%) |
Disability Class: Vision Difficulty
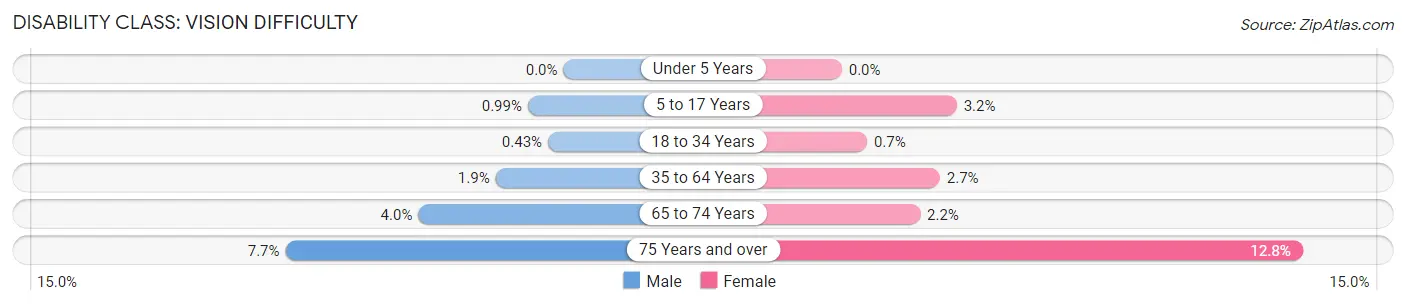
| Age Bracket | Male | Female |
| Under 5 Years | 0 (0.0%) | 0 (0.0%) |
| 5 to 17 Years | 8 (1.0%) | 24 (3.2%) |
| 18 to 34 Years | 3 (0.4%) | 5 (0.7%) |
| 35 to 64 Years | 31 (1.9%) | 43 (2.7%) |
| 65 to 74 Years | 22 (4.0%) | 12 (2.2%) |
| 75 Years and over | 25 (7.7%) | 54 (12.8%) |
Disability Class: Cognitive Difficulty
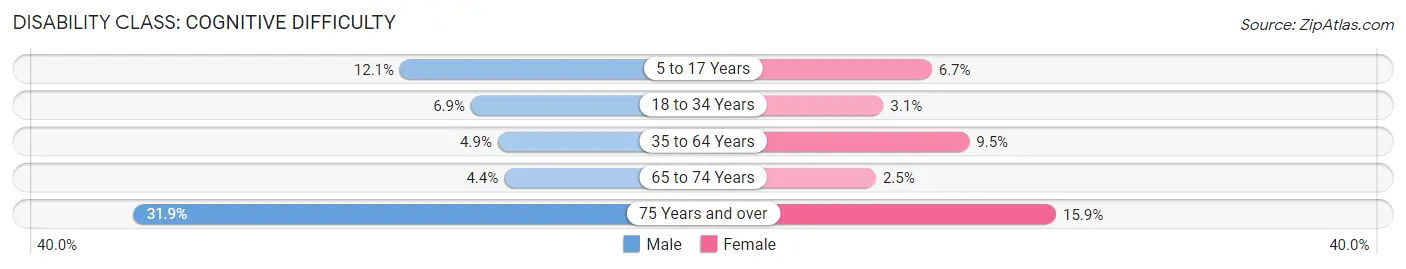
| Age Bracket | Male | Female |
| 5 to 17 Years | 98 (12.1%) | 50 (6.7%) |
| 18 to 34 Years | 48 (6.9%) | 22 (3.1%) |
| 35 to 64 Years | 80 (4.9%) | 149 (9.5%) |
| 65 to 74 Years | 24 (4.4%) | 14 (2.5%) |
| 75 Years and over | 103 (31.9%) | 67 (15.9%) |
Disability Class: Ambulatory Difficulty
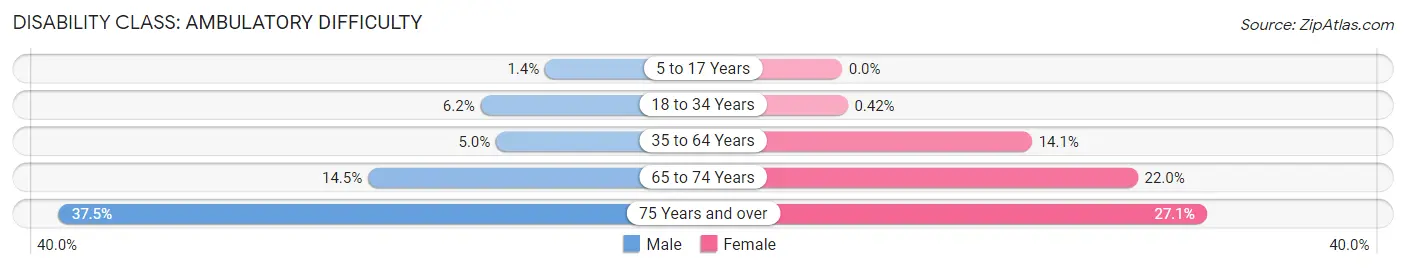
| Age Bracket | Male | Female |
| 5 to 17 Years | 11 (1.4%) | 0 (0.0%) |
| 18 to 34 Years | 43 (6.1%) | 3 (0.4%) |
| 35 to 64 Years | 82 (5.0%) | 222 (14.1%) |
| 65 to 74 Years | 79 (14.5%) | 121 (22.0%) |
| 75 Years and over | 121 (37.5%) | 114 (27.1%) |
Disability Class: Self-Care Difficulty
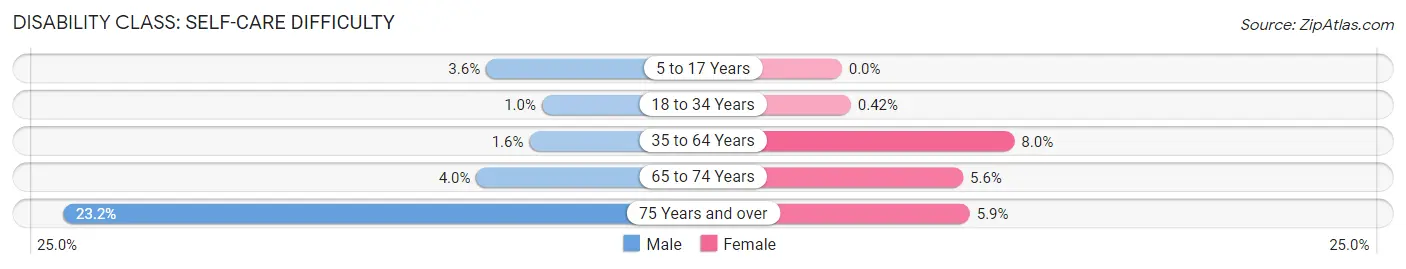
| Age Bracket | Male | Female |
| 5 to 17 Years | 29 (3.6%) | 0 (0.0%) |
| 18 to 34 Years | 7 (1.0%) | 3 (0.4%) |
| 35 to 64 Years | 26 (1.6%) | 126 (8.0%) |
| 65 to 74 Years | 22 (4.0%) | 31 (5.6%) |
| 75 Years and over | 75 (23.2%) | 25 (5.9%) |
Technology Access in Wilson County
Computing Device Access in Wilson County
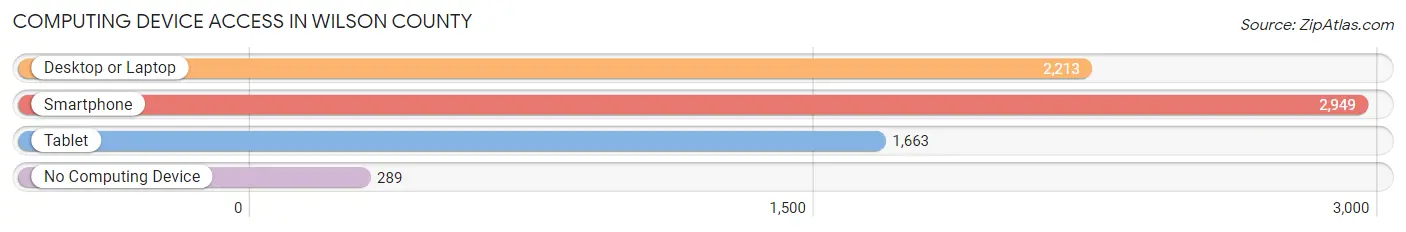
| Device Type | # Households | % Households |
| Desktop or Laptop | 2,213 | 63.4% |
| Smartphone | 2,949 | 84.5% |
| Tablet | 1,663 | 47.6% |
| No Computing Device | 289 | 8.3% |
| Total | 3,492 | 100.0% |
Internet Access in Wilson County
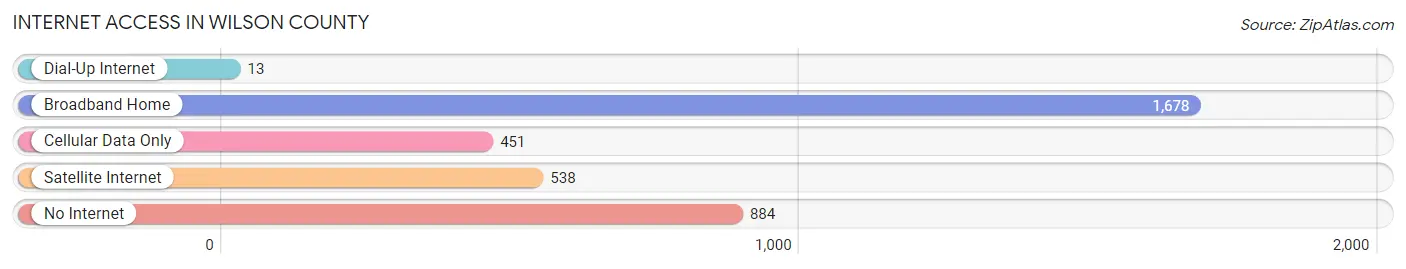
| Internet Type | # Households | % Households |
| Dial-Up Internet | 13 | 0.4% |
| Broadband Home | 1,678 | 48.0% |
| Cellular Data Only | 451 | 12.9% |
| Satellite Internet | 538 | 15.4% |
| No Internet | 884 | 25.3% |
| Total | 3,492 | 100.0% |
Wilson County Summary
Wilson County is located in the southeastern corner of Kansas, and is bordered by the states of Missouri and Oklahoma. The county seat is Fredonia, and the county was named after Colonel William Wilson, a veteran of the War of 1812. The county has a total area of 576 square miles, and a population of 8,845 as of the 2010 census.
History
Wilson County was established in 1855, and was originally part of Bourbon County. The county was named after Colonel William Wilson, a veteran of the War of 1812. The first settlers in the area were mostly of German and English descent, and the county was primarily an agricultural area.
In the late 19th century, the county experienced a period of growth and development, with the construction of the Missouri Pacific Railroad in 1887. This allowed for the transportation of goods and services to and from the county, and helped to spur economic growth.
In the early 20th century, the county experienced a period of decline, as the Great Depression and the Dust Bowl caused many people to leave the area in search of work. However, the county experienced a resurgence in the 1950s and 1960s, as the oil and gas industry began to develop in the area.
Geography
Wilson County is located in the southeastern corner of Kansas, and is bordered by the states of Missouri and Oklahoma. The county has a total area of 576 square miles, and is mostly flat, with some rolling hills in the northern part of the county. The county is drained by the Neosho River, which flows through the county from north to south.
The county is home to several state parks, including the Wilson State Park, which is located in the northern part of the county. The park features a lake, camping sites, and hiking trails.
Economy
The economy of Wilson County is largely based on agriculture, with the county being home to several large farms. The county is also home to several oil and gas companies, which have been operating in the area since the 1950s.
The county also has a growing tourism industry, with several attractions, such as the Wilson State Park, the Fredonia Opera House, and the Wilson County Historical Museum.
Demographics
As of the 2010 census, the population of Wilson County was 8,845. The racial makeup of the county was 95.3% White, 0.7% African American, 0.7% Native American, 0.3% Asian, 0.1% Pacific Islander, 1.3% from other races, and 1.6% from two or more races. Hispanic or Latino of any race were 3.2% of the population.
The median income for a household in the county was $37,945, and the median income for a family was $45,938. The per capita income for the county was $18,945. About 11.2% of families and 14.2% of the population were below the poverty line, including 19.2% of those under age 18 and 8.2% of those age 65 or over.
Common Questions
What is Per Capita Income in Wilson County?
Per Capita income in Wilson County is $32,008.
What is the Median Family Income in Wilson County?
Median Family Income in Wilson County is $69,964.
What is the Median Household income in Wilson County?
Median Household Income in Wilson County is $55,439.
What is Income or Wage Gap in Wilson County?
Income or Wage Gap in Wilson County is 36.9%.
Women in Wilson County earn 63.1 cents for every dollar earned by a man.
What is Inequality or Gini Index in Wilson County?
Inequality or Gini Index in Wilson County is 0.48.
What is the Total Population of Wilson County?
Total Population of Wilson County is 8,667.
What is the Total Male Population of Wilson County?
Total Male Population of Wilson County is 4,329.
What is the Total Female Population of Wilson County?
Total Female Population of Wilson County is 4,338.
What is the Ratio of Males per 100 Females in Wilson County?
There are 99.79 Males per 100 Females in Wilson County.
What is the Ratio of Females per 100 Males in Wilson County?
There are 100.21 Females per 100 Males in Wilson County.
What is the Median Population Age in Wilson County?
Median Population Age in Wilson County is 42.4 Years.
What is the Average Family Size in Wilson County
Average Family Size in Wilson County is 2.9 People.
What is the Average Household Size in Wilson County
Average Household Size in Wilson County is 2.4 People.
How Large is the Labor Force in Wilson County?
There are 4,045 People in the Labor Forcein in Wilson County.
What is the Percentage of People in the Labor Force in Wilson County?
58.6% of People are in the Labor Force in Wilson County.
What is the Unemployment Rate in Wilson County?
Unemployment Rate in Wilson County is 3.7%.