Wabaunsee County, KS Map & Demographics
Wabaunsee County Overview
$34,243
PER CAPITA INCOME
$84,776
AVG FAMILY INCOME
$70,000
AVG HOUSEHOLD INCOME
21.4%
WAGE / INCOME GAP [ % ]
78.6¢/ $1
WAGE / INCOME GAP [ $ ]
$10,443
FAMILY INCOME DEFICIT
0.39
INEQUALITY / GINI INDEX
6,922
TOTAL POPULATION
3,527
MALE POPULATION
3,395
FEMALE POPULATION
103.89
MALES / 100 FEMALES
96.26
FEMALES / 100 MALES
43.7
MEDIAN AGE
3.3
AVG FAMILY SIZE
2.6
AVG HOUSEHOLD SIZE
3,406
LABOR FORCE [ PEOPLE ]
61.6%
PERCENT IN LABOR FORCE
3.0%
UNEMPLOYMENT RATE
Wabaunsee County Area Codes
Income in Wabaunsee County
Income Overview in Wabaunsee County
Per Capita Income in Wabaunsee County is $34,243, while median incomes of families and households are $84,776 and $70,000 respectively.
| Characteristic | Number | Measure |
| Per Capita Income | 6,922 | $34,243 |
| Median Family Income | 1,763 | $84,776 |
| Mean Family Income | 1,763 | $104,033 |
| Median Household Income | 2,570 | $70,000 |
| Mean Household Income | 2,570 | $87,718 |
| Income Deficit | 1,763 | $10,443 |
| Wage / Income Gap (%) | 6,922 | 21.42% |
| Wage / Income Gap ($) | 6,922 | 78.58¢ per $1 |
| Gini / Inequality Index | 6,922 | 0.39 |
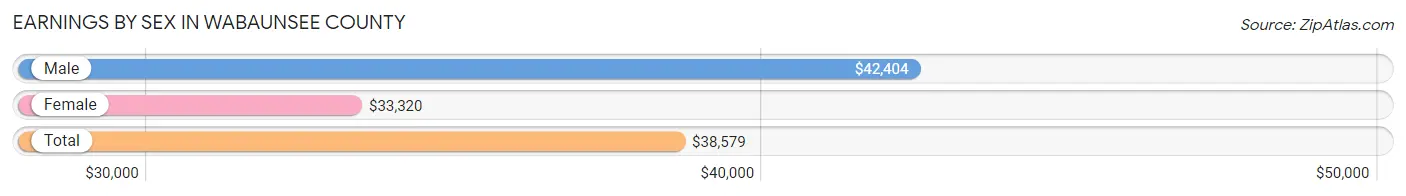
Earnings by Sex in Wabaunsee County
Average Earnings in Wabaunsee County are $38,579, $42,404 for men and $33,320 for women, a difference of 21.4%.
| Sex | Number | Average Earnings |
| Male | 2,065 (54.8%) | $42,404 |
| Female | 1,703 (45.2%) | $33,320 |
| Total | 3,768 (100.0%) | $38,579 |
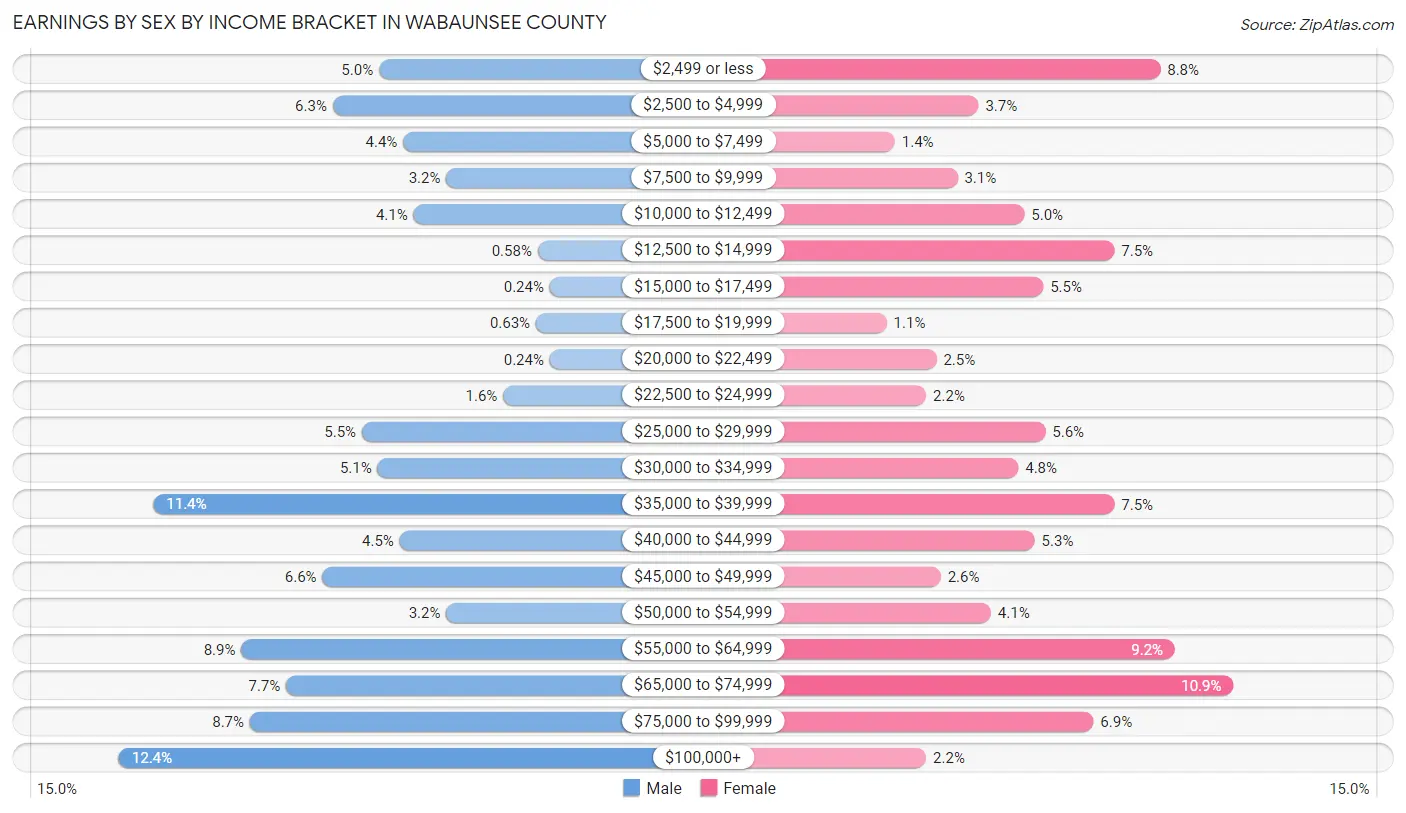
Earnings by Sex by Income Bracket in Wabaunsee County
The most common earnings brackets in Wabaunsee County are $100,000+ for men (255 | 12.3%) and $65,000 to $74,999 for women (185 | 10.9%).
| Income | Male | Female |
| $2,499 or less | 104 (5.0%) | 150 (8.8%) |
| $2,500 to $4,999 | 131 (6.3%) | 63 (3.7%) |
| $5,000 to $7,499 | 90 (4.4%) | 23 (1.3%) |
| $7,500 to $9,999 | 65 (3.2%) | 53 (3.1%) |
| $10,000 to $12,499 | 84 (4.1%) | 85 (5.0%) |
| $12,500 to $14,999 | 12 (0.6%) | 128 (7.5%) |
| $15,000 to $17,499 | 5 (0.2%) | 94 (5.5%) |
| $17,500 to $19,999 | 13 (0.6%) | 19 (1.1%) |
| $20,000 to $22,499 | 5 (0.2%) | 43 (2.5%) |
| $22,500 to $24,999 | 32 (1.5%) | 38 (2.2%) |
| $25,000 to $29,999 | 114 (5.5%) | 95 (5.6%) |
| $30,000 to $34,999 | 105 (5.1%) | 82 (4.8%) |
| $35,000 to $39,999 | 235 (11.4%) | 128 (7.5%) |
| $40,000 to $44,999 | 92 (4.5%) | 90 (5.3%) |
| $45,000 to $49,999 | 137 (6.6%) | 45 (2.6%) |
| $50,000 to $54,999 | 65 (3.2%) | 69 (4.1%) |
| $55,000 to $64,999 | 184 (8.9%) | 157 (9.2%) |
| $65,000 to $74,999 | 158 (7.6%) | 185 (10.9%) |
| $75,000 to $99,999 | 179 (8.7%) | 118 (6.9%) |
| $100,000+ | 255 (12.3%) | 38 (2.2%) |
| Total | 2,065 (100.0%) | 1,703 (100.0%) |
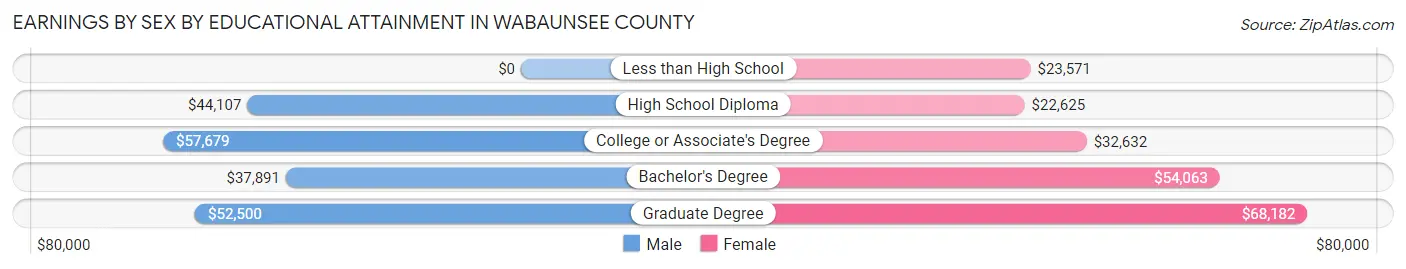
Earnings by Sex by Educational Attainment in Wabaunsee County
Average earnings in Wabaunsee County are $46,706 for men and $39,415 for women, a difference of 15.6%. Men with an educational attainment of college or associate's degree enjoy the highest average annual earnings of $57,679, while those with bachelor's degree education earn the least with $37,891. Women with an educational attainment of graduate degree earn the most with the average annual earnings of $68,182, while those with high school diploma education have the smallest earnings of $22,625.
| Educational Attainment | Male Income | Female Income |
| Less than High School | - | - |
| High School Diploma | $44,107 | $22,625 |
| College or Associate's Degree | $57,679 | $32,632 |
| Bachelor's Degree | $37,891 | $54,063 |
| Graduate Degree | $52,500 | $68,182 |
| Total | $46,706 | $39,415 |
Family Income in Wabaunsee County
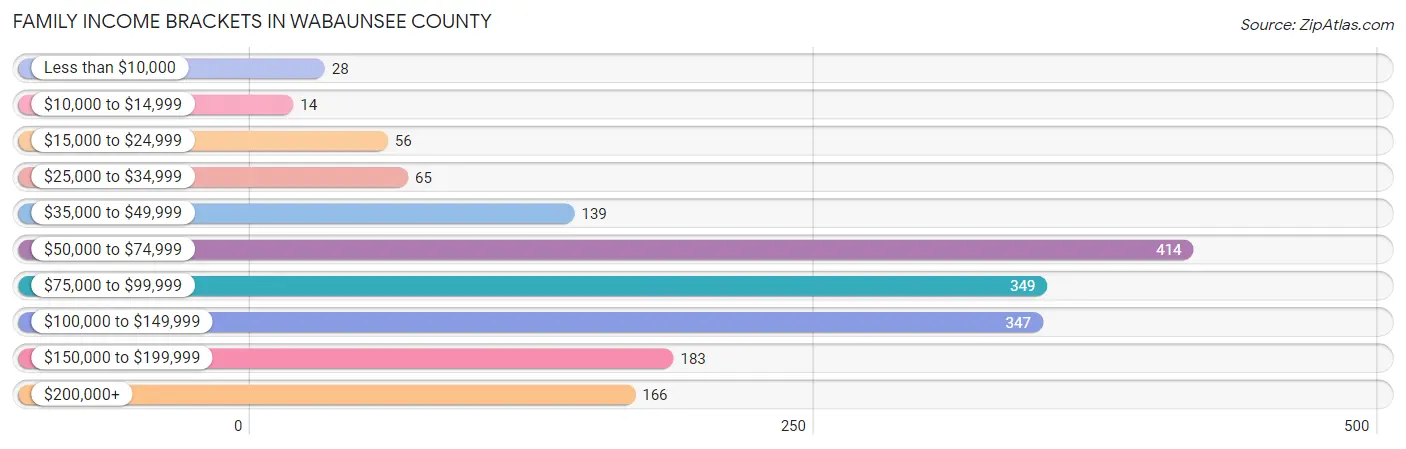
Family Income Brackets in Wabaunsee County
According to the Wabaunsee County family income data, there are 414 families falling into the $50,000 to $74,999 income range, which is the most common income bracket and makes up 23.5% of all families. Conversely, the $10,000 to $14,999 income bracket is the least frequent group with only 14 families (0.8%) belonging to this category.
| Income Bracket | # Families | % Families |
| Less than $10,000 | 28 | 1.6% |
| $10,000 to $14,999 | 14 | 0.8% |
| $15,000 to $24,999 | 56 | 3.2% |
| $25,000 to $34,999 | 65 | 3.7% |
| $35,000 to $49,999 | 139 | 7.9% |
| $50,000 to $74,999 | 414 | 23.5% |
| $75,000 to $99,999 | 349 | 19.8% |
| $100,000 to $149,999 | 347 | 19.7% |
| $150,000 to $199,999 | 183 | 10.4% |
| $200,000+ | 166 | 9.4% |
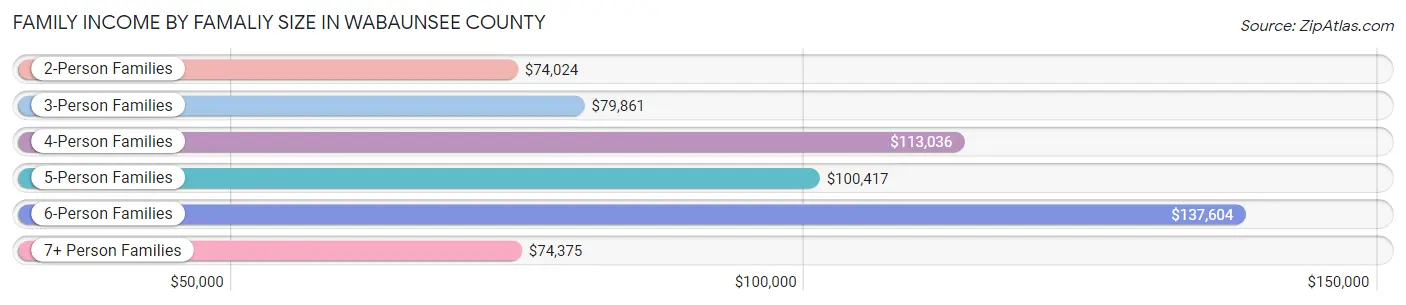
Family Income by Famaliy Size in Wabaunsee County
6-person families (45 | 2.5%) account for the highest median family income in Wabaunsee County with $137,604 per family, while 2-person families (906 | 51.4%) have the highest median income of $37,012 per family member.
| Income Bracket | # Families | Median Income |
| 2-Person Families | 906 (51.4%) | $74,024 |
| 3-Person Families | 267 (15.1%) | $79,861 |
| 4-Person Families | 357 (20.3%) | $113,036 |
| 5-Person Families | 145 (8.2%) | $100,417 |
| 6-Person Families | 45 (2.5%) | $137,604 |
| 7+ Person Families | 43 (2.4%) | $74,375 |
| Total | 1,763 (100.0%) | $84,776 |
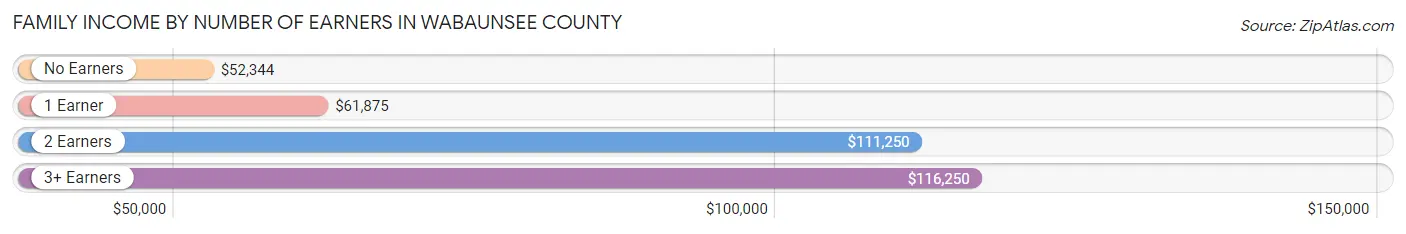
Family Income by Number of Earners in Wabaunsee County
The median family income in Wabaunsee County is $84,776, with families comprising 3+ earners (236) having the highest median family income of $116,250, while families with no earners (206) have the lowest median family income of $52,344, accounting for 13.4% and 11.7% of families, respectively.
| Number of Earners | # Families | Median Income |
| No Earners | 206 (11.7%) | $52,344 |
| 1 Earner | 435 (24.7%) | $61,875 |
| 2 Earners | 886 (50.3%) | $111,250 |
| 3+ Earners | 236 (13.4%) | $116,250 |
| Total | 1,763 (100.0%) | $84,776 |
Household Income in Wabaunsee County
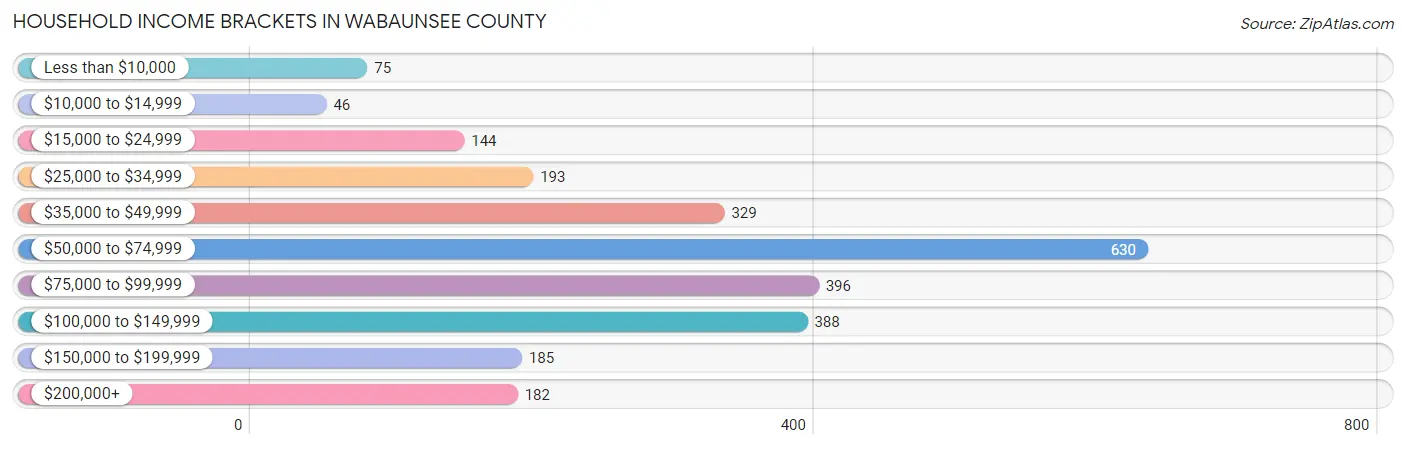
Household Income Brackets in Wabaunsee County
With 630 households falling in the category, the $50,000 to $74,999 income range is the most frequent in Wabaunsee County, accounting for 24.5% of all households. In contrast, only 46 households (1.8%) fall into the $10,000 to $14,999 income bracket, making it the least populous group.
| Income Bracket | # Households | % Households |
| Less than $10,000 | 75 | 2.9% |
| $10,000 to $14,999 | 46 | 1.8% |
| $15,000 to $24,999 | 144 | 5.6% |
| $25,000 to $34,999 | 193 | 7.5% |
| $35,000 to $49,999 | 329 | 12.8% |
| $50,000 to $74,999 | 630 | 24.5% |
| $75,000 to $99,999 | 396 | 15.4% |
| $100,000 to $149,999 | 388 | 15.1% |
| $150,000 to $199,999 | 185 | 7.2% |
| $200,000+ | 182 | 7.1% |
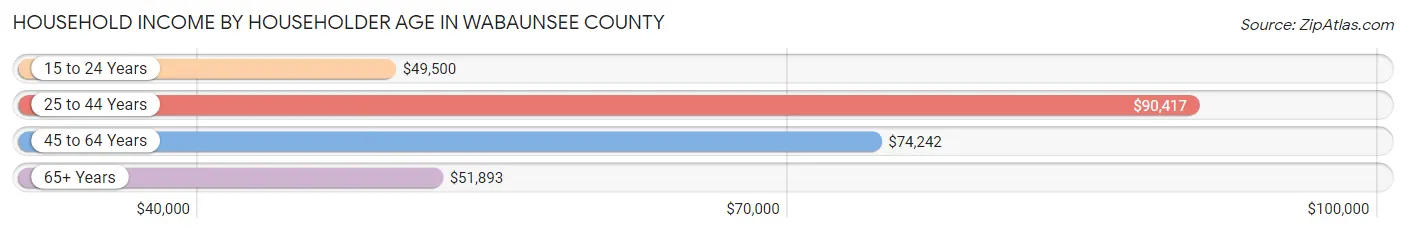
Household Income by Householder Age in Wabaunsee County
The median household income in Wabaunsee County is $70,000, with the highest median household income of $90,417 found in the 25 to 44 years age bracket for the primary householder. A total of 590 households (23.0%) fall into this category. Meanwhile, the 15 to 24 years age bracket for the primary householder has the lowest median household income of $49,500, with 32 households (1.3%) in this group.
| Income Bracket | # Households | Median Income |
| 15 to 24 Years | 32 (1.3%) | $49,500 |
| 25 to 44 Years | 590 (23.0%) | $90,417 |
| 45 to 64 Years | 1,024 (39.8%) | $74,242 |
| 65+ Years | 924 (35.9%) | $51,893 |
| Total | 2,570 (100.0%) | $70,000 |
Poverty in Wabaunsee County
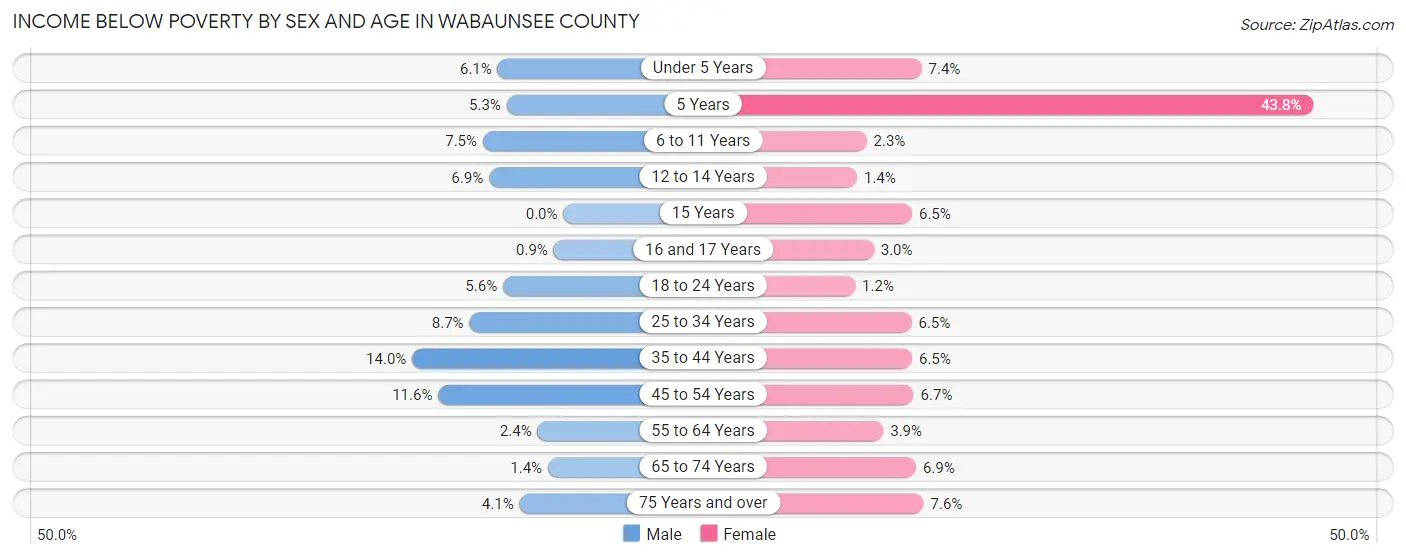
Income Below Poverty by Sex and Age in Wabaunsee County
With 6.4% poverty level for males and 5.4% for females among the residents of Wabaunsee County, 35 to 44 year old males and 5 year old females are the most vulnerable to poverty, with 54 males (14.0%) and 7 females (43.8%) in their respective age groups living below the poverty level.
| Age Bracket | Male | Female |
| Under 5 Years | 13 (6.1%) | 12 (7.4%) |
| 5 Years | 3 (5.3%) | 7 (43.8%) |
| 6 to 11 Years | 21 (7.5%) | 6 (2.3%) |
| 12 to 14 Years | 12 (6.9%) | 2 (1.4%) |
| 15 Years | 0 (0.0%) | 3 (6.5%) |
| 16 and 17 Years | 1 (0.9%) | 3 (3.0%) |
| 18 to 24 Years | 15 (5.6%) | 3 (1.2%) |
| 25 to 34 Years | 28 (8.7%) | 22 (6.5%) |
| 35 to 44 Years | 54 (14.0%) | 24 (6.5%) |
| 45 to 54 Years | 44 (11.6%) | 26 (6.7%) |
| 55 to 64 Years | 14 (2.4%) | 20 (3.8%) |
| 65 to 74 Years | 6 (1.4%) | 29 (6.9%) |
| 75 Years and over | 10 (4.1%) | 24 (7.6%) |
| Total | 221 (6.4%) | 181 (5.4%) |
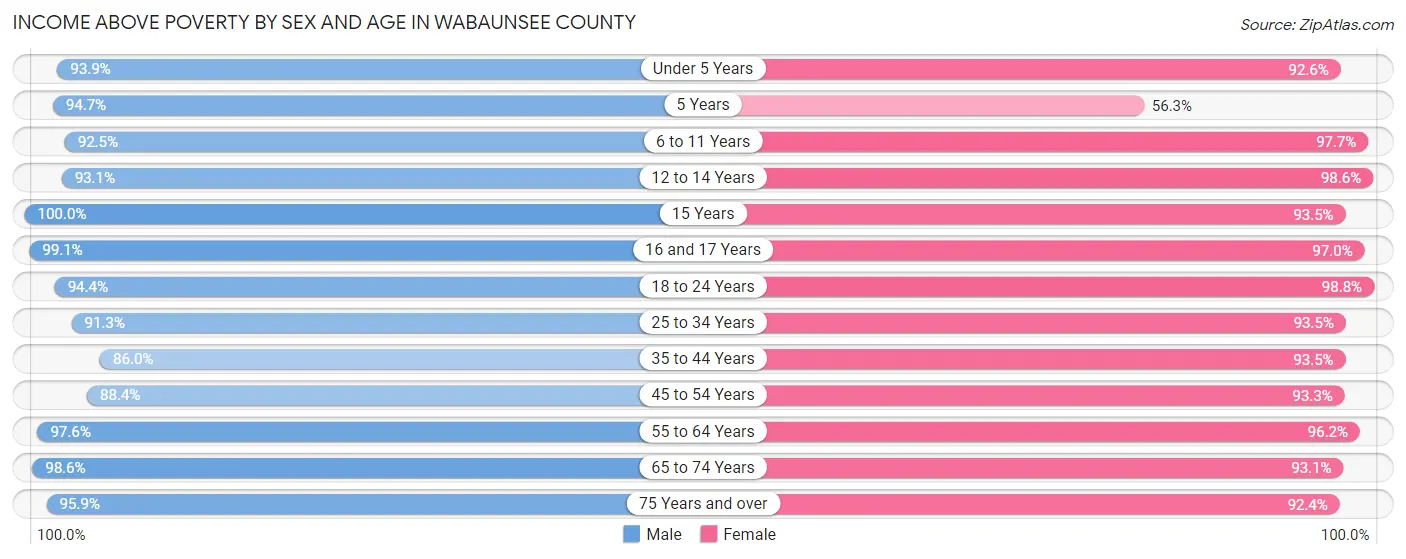
Income Above Poverty by Sex and Age in Wabaunsee County
According to the poverty statistics in Wabaunsee County, males aged 15 years and females aged 18 to 24 years are the age groups that are most secure financially, with 100.0% of males and 98.8% of females in these age groups living above the poverty line.
| Age Bracket | Male | Female |
| Under 5 Years | 200 (93.9%) | 150 (92.6%) |
| 5 Years | 54 (94.7%) | 9 (56.2%) |
| 6 to 11 Years | 260 (92.5%) | 255 (97.7%) |
| 12 to 14 Years | 162 (93.1%) | 140 (98.6%) |
| 15 Years | 21 (100.0%) | 43 (93.5%) |
| 16 and 17 Years | 110 (99.1%) | 98 (97.0%) |
| 18 to 24 Years | 253 (94.4%) | 239 (98.8%) |
| 25 to 34 Years | 293 (91.3%) | 318 (93.5%) |
| 35 to 44 Years | 331 (86.0%) | 344 (93.5%) |
| 45 to 54 Years | 335 (88.4%) | 364 (93.3%) |
| 55 to 64 Years | 570 (97.6%) | 499 (96.2%) |
| 65 to 74 Years | 413 (98.6%) | 392 (93.1%) |
| 75 Years and over | 236 (95.9%) | 292 (92.4%) |
| Total | 3,238 (93.6%) | 3,143 (94.6%) |
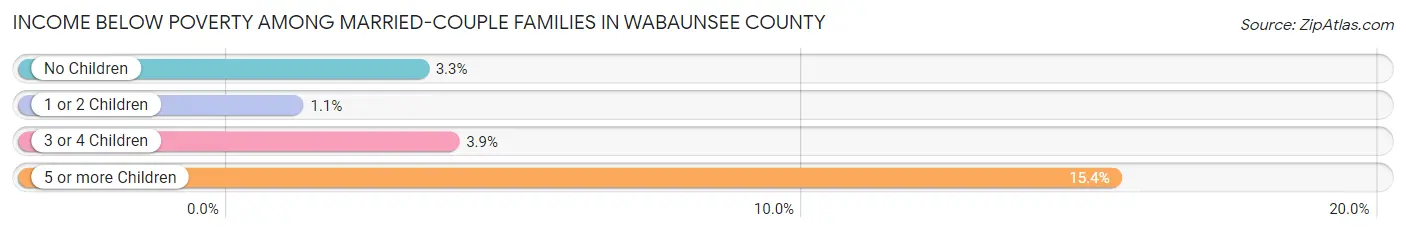
Income Below Poverty Among Married-Couple Families in Wabaunsee County
The poverty statistics for married-couple families in Wabaunsee County show that 3.0% or 45 of the total 1,478 families live below the poverty line. Families with 5 or more children have the highest poverty rate of 15.4%, comprising of 6 families. On the other hand, families with 1 or 2 children have the lowest poverty rate of 1.1%, which includes 5 families.
| Children | Above Poverty | Below Poverty |
| No Children | 816 (96.7%) | 28 (3.3%) |
| 1 or 2 Children | 434 (98.9%) | 5 (1.1%) |
| 3 or 4 Children | 150 (96.2%) | 6 (3.8%) |
| 5 or more Children | 33 (84.6%) | 6 (15.4%) |
| Total | 1,433 (97.0%) | 45 (3.0%) |
Income Below Poverty Among Single-Parent Households in Wabaunsee County
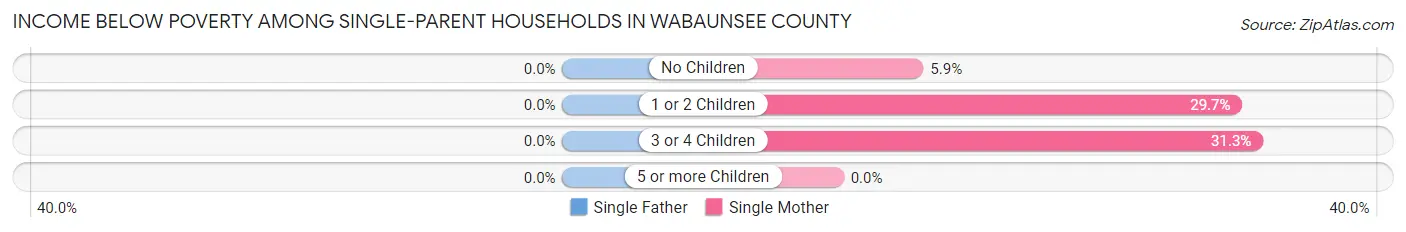
| Children | Single Father | Single Mother |
| No Children | 0 (0.0%) | 6 (5.9%) |
| 1 or 2 Children | 0 (0.0%) | 30 (29.7%) |
| 3 or 4 Children | 0 (0.0%) | 5 (31.2%) |
| 5 or more Children | 0 (0.0%) | 0 (0.0%) |
| Total | 0 (0.0%) | 41 (18.8%) |
Income Below Poverty Among Married-Couple vs Single-Parent Households in Wabaunsee County
The poverty data for Wabaunsee County shows that 45 of the married-couple family households (3.0%) and 41 of the single-parent households (14.4%) are living below the poverty level. Within the married-couple family households, those with 5 or more children have the highest poverty rate, with 6 households (15.4%) falling below the poverty line. Among the single-parent households, those with 3 or 4 children have the highest poverty rate, with 5 household (31.2%) living below poverty.
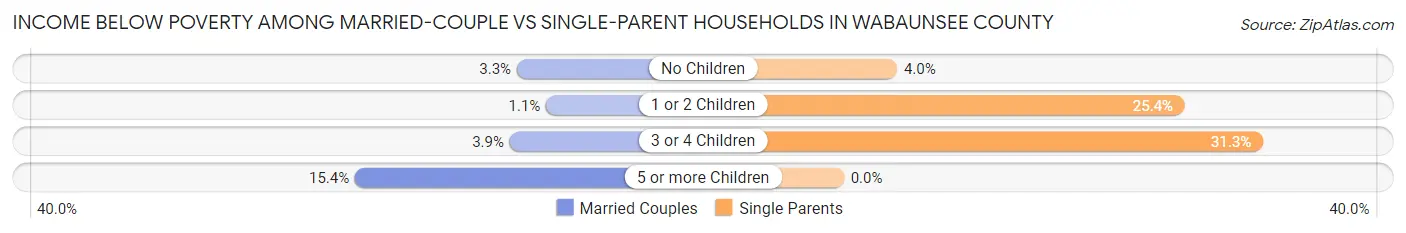
| Children | Married-Couple Families | Single-Parent Households |
| No Children | 28 (3.3%) | 6 (4.0%) |
| 1 or 2 Children | 5 (1.1%) | 30 (25.4%) |
| 3 or 4 Children | 6 (3.8%) | 5 (31.2%) |
| 5 or more Children | 6 (15.4%) | 0 (0.0%) |
| Total | 45 (3.0%) | 41 (14.4%) |
Race in Wabaunsee County
The most populous races in Wabaunsee County are White / Caucasian (6,425 | 92.8%), Hispanic or Latino (342 | 4.9%), and Two or more Races (272 | 3.9%).
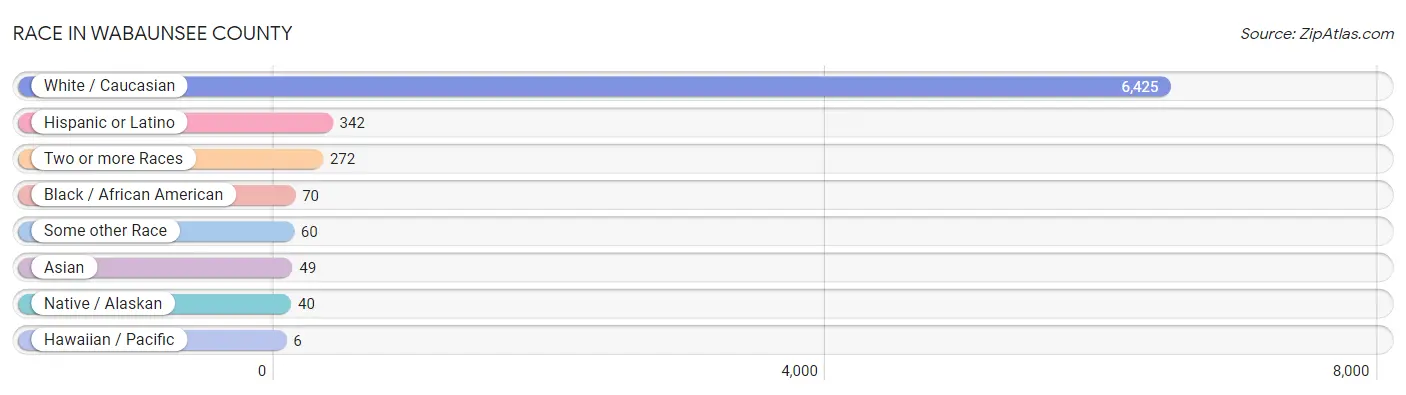
| Race | # Population | % Population |
| Asian | 49 | 0.7% |
| Black / African American | 70 | 1.0% |
| Hawaiian / Pacific | 6 | 0.1% |
| Hispanic or Latino | 342 | 4.9% |
| Native / Alaskan | 40 | 0.6% |
| White / Caucasian | 6,425 | 92.8% |
| Two or more Races | 272 | 3.9% |
| Some other Race | 60 | 0.9% |
| Total | 6,922 | 100.0% |
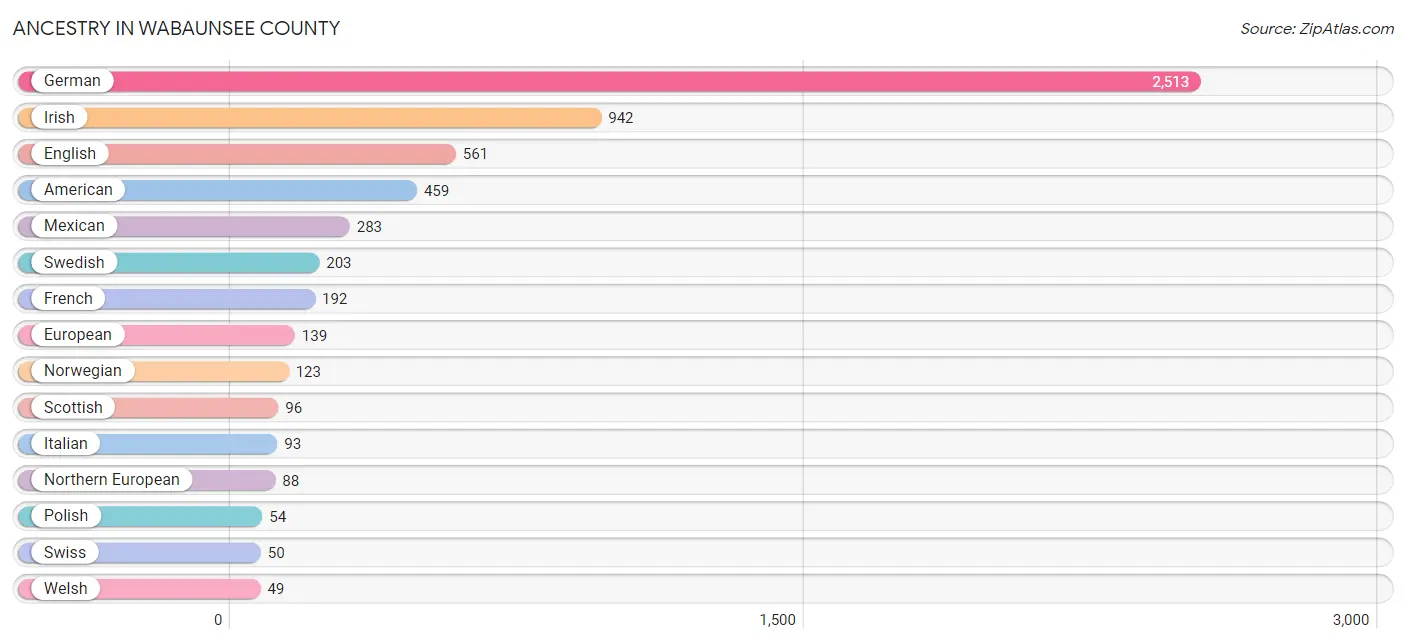
Ancestry in Wabaunsee County
The most populous ancestries reported in Wabaunsee County are German (2,513 | 36.3%), Irish (942 | 13.6%), English (561 | 8.1%), American (459 | 6.6%), and Mexican (283 | 4.1%), together accounting for 68.7% of all Wabaunsee County residents.
| Ancestry | # Population | % Population |
| American | 459 | 6.6% |
| Apache | 10 | 0.1% |
| Belgian | 14 | 0.2% |
| Bhutanese | 8 | 0.1% |
| Blackfeet | 2 | 0.0% |
| Brazilian | 21 | 0.3% |
| British | 32 | 0.5% |
| Canadian | 8 | 0.1% |
| Central American Indian | 8 | 0.1% |
| Cherokee | 12 | 0.2% |
| Choctaw | 4 | 0.1% |
| Cuban | 3 | 0.0% |
| Czech | 22 | 0.3% |
| Czechoslovakian | 3 | 0.0% |
| Danish | 24 | 0.4% |
| Dutch | 38 | 0.5% |
| Eastern European | 3 | 0.0% |
| English | 561 | 8.1% |
| European | 139 | 2.0% |
| French | 192 | 2.8% |
| French Canadian | 9 | 0.1% |
| German | 2,513 | 36.3% |
| Guamanian / Chamorro | 1 | 0.0% |
| Indian (Asian) | 14 | 0.2% |
| Irish | 942 | 13.6% |
| Italian | 93 | 1.3% |
| Korean | 34 | 0.5% |
| Lithuanian | 12 | 0.2% |
| Luxembourger | 1 | 0.0% |
| Mexican | 283 | 4.1% |
| Navajo | 13 | 0.2% |
| Northern European | 88 | 1.3% |
| Norwegian | 123 | 1.8% |
| Osage | 6 | 0.1% |
| Pakistani | 3 | 0.0% |
| Polish | 54 | 0.8% |
| Potawatomi | 46 | 0.7% |
| Puerto Rican | 46 | 0.7% |
| Romanian | 6 | 0.1% |
| Russian | 15 | 0.2% |
| Samoan | 17 | 0.3% |
| Scandinavian | 8 | 0.1% |
| Scotch-Irish | 19 | 0.3% |
| Scottish | 96 | 1.4% |
| Slavic | 2 | 0.0% |
| Swedish | 203 | 2.9% |
| Swiss | 50 | 0.7% |
| Welsh | 49 | 0.7% |
| Yugoslavian | 1 | 0.0% | View All 49 Rows |
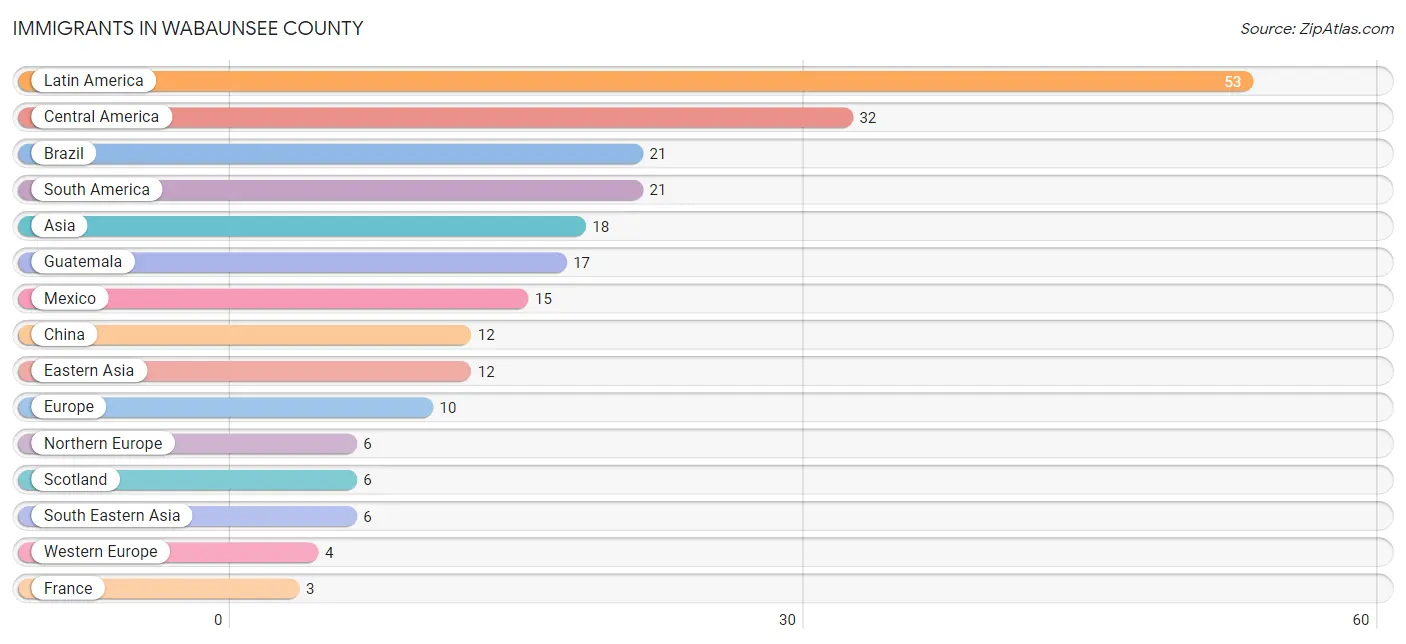
Immigrants in Wabaunsee County
The most numerous immigrant groups reported in Wabaunsee County came from Latin America (53 | 0.8%), Central America (32 | 0.5%), Brazil (21 | 0.3%), South America (21 | 0.3%), and Asia (18 | 0.3%), together accounting for 2.1% of all Wabaunsee County residents.
| Immigration Origin | # Population | % Population |
| Asia | 18 | 0.3% |
| Brazil | 21 | 0.3% |
| Central America | 32 | 0.5% |
| China | 12 | 0.2% |
| Eastern Asia | 12 | 0.2% |
| Europe | 10 | 0.1% |
| France | 3 | 0.0% |
| Germany | 1 | 0.0% |
| Guatemala | 17 | 0.3% |
| Latin America | 53 | 0.8% |
| Mexico | 15 | 0.2% |
| Northern Europe | 6 | 0.1% |
| Philippines | 3 | 0.0% |
| Scotland | 6 | 0.1% |
| South America | 21 | 0.3% |
| South Eastern Asia | 6 | 0.1% |
| Thailand | 3 | 0.0% |
| Western Europe | 4 | 0.1% | View All 18 Rows |
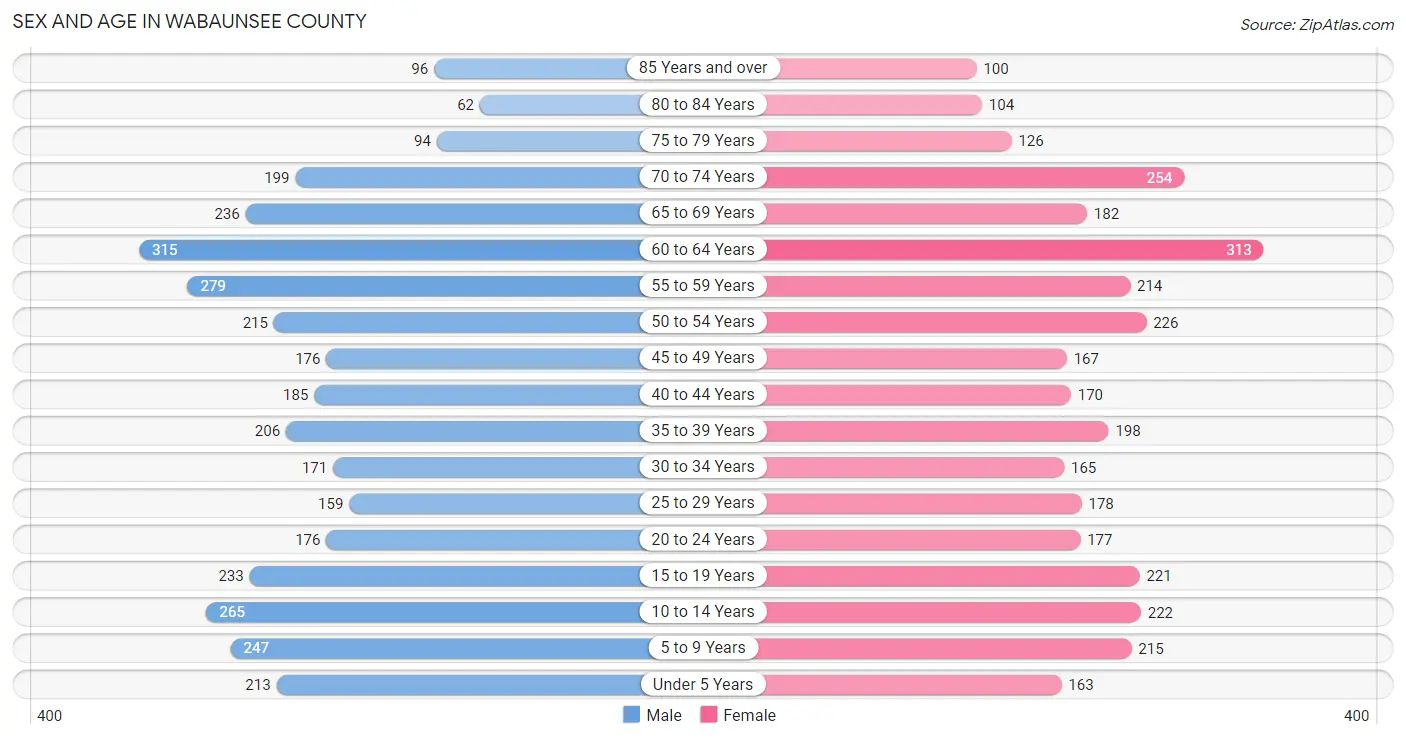
Sex and Age in Wabaunsee County
Sex and Age in Wabaunsee County
The most populous age groups in Wabaunsee County are 60 to 64 Years (315 | 8.9%) for men and 60 to 64 Years (313 | 9.2%) for women.
| Age Bracket | Male | Female |
| Under 5 Years | 213 (6.0%) | 163 (4.8%) |
| 5 to 9 Years | 247 (7.0%) | 215 (6.3%) |
| 10 to 14 Years | 265 (7.5%) | 222 (6.5%) |
| 15 to 19 Years | 233 (6.6%) | 221 (6.5%) |
| 20 to 24 Years | 176 (5.0%) | 177 (5.2%) |
| 25 to 29 Years | 159 (4.5%) | 178 (5.2%) |
| 30 to 34 Years | 171 (4.9%) | 165 (4.9%) |
| 35 to 39 Years | 206 (5.8%) | 198 (5.8%) |
| 40 to 44 Years | 185 (5.2%) | 170 (5.0%) |
| 45 to 49 Years | 176 (5.0%) | 167 (4.9%) |
| 50 to 54 Years | 215 (6.1%) | 226 (6.7%) |
| 55 to 59 Years | 279 (7.9%) | 214 (6.3%) |
| 60 to 64 Years | 315 (8.9%) | 313 (9.2%) |
| 65 to 69 Years | 236 (6.7%) | 182 (5.4%) |
| 70 to 74 Years | 199 (5.6%) | 254 (7.5%) |
| 75 to 79 Years | 94 (2.7%) | 126 (3.7%) |
| 80 to 84 Years | 62 (1.8%) | 104 (3.1%) |
| 85 Years and over | 96 (2.7%) | 100 (2.9%) |
| Total | 3,527 (100.0%) | 3,395 (100.0%) |
Families and Households in Wabaunsee County
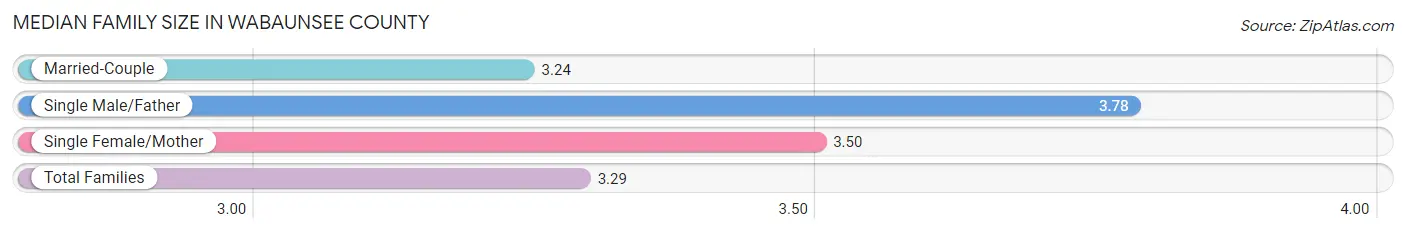
Median Family Size in Wabaunsee County
The median family size in Wabaunsee County is 3.29 persons per family, with single male/father families (67 | 3.8%) accounting for the largest median family size of 3.78 persons per family. On the other hand, married-couple families (1,478 | 83.8%) represent the smallest median family size with 3.24 persons per family.
| Family Type | # Families | Family Size |
| Married-Couple | 1,478 (83.8%) | 3.24 |
| Single Male/Father | 67 (3.8%) | 3.78 |
| Single Female/Mother | 218 (12.4%) | 3.50 |
| Total Families | 1,763 (100.0%) | 3.29 |
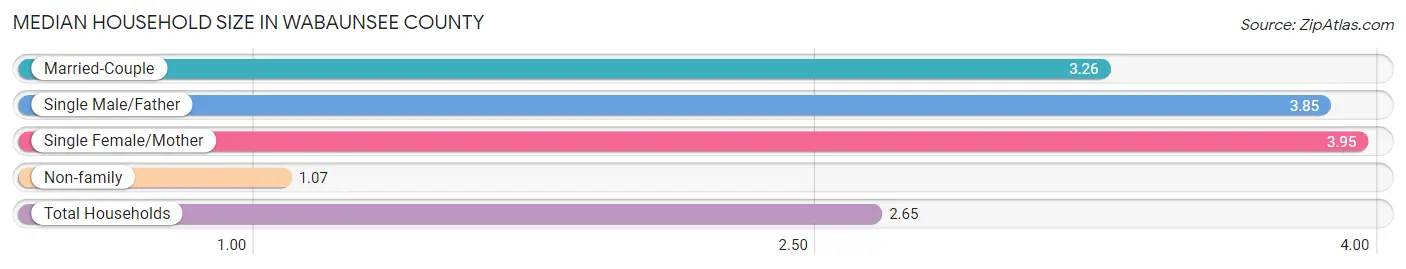
Median Household Size in Wabaunsee County
The median household size in Wabaunsee County is 2.65 persons per household, with single female/mother households (218 | 8.5%) accounting for the largest median household size of 3.95 persons per household. non-family households (807 | 31.4%) represent the smallest median household size with 1.07 persons per household.
| Household Type | # Households | Household Size |
| Married-Couple | 1,478 (57.5%) | 3.26 |
| Single Male/Father | 67 (2.6%) | 3.85 |
| Single Female/Mother | 218 (8.5%) | 3.95 |
| Non-family | 807 (31.4%) | 1.07 |
| Total Households | 2,570 (100.0%) | 2.65 |
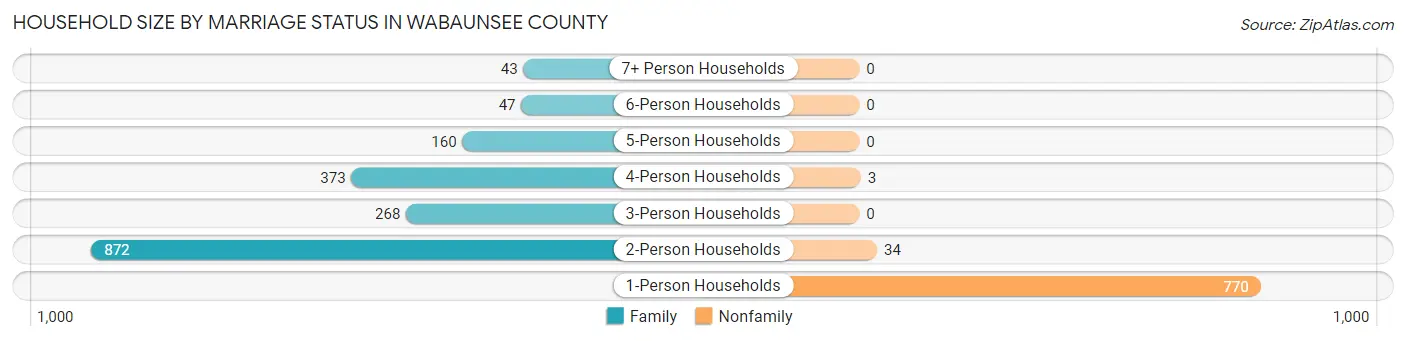
Household Size by Marriage Status in Wabaunsee County
Out of a total of 2,570 households in Wabaunsee County, 1,763 (68.6%) are family households, while 807 (31.4%) are nonfamily households. The most numerous type of family households are 2-person households, comprising 872, and the most common type of nonfamily households are 1-person households, comprising 770.
| Household Size | Family Households | Nonfamily Households |
| 1-Person Households | - | 770 (30.0%) |
| 2-Person Households | 872 (33.9%) | 34 (1.3%) |
| 3-Person Households | 268 (10.4%) | 0 (0.0%) |
| 4-Person Households | 373 (14.5%) | 3 (0.1%) |
| 5-Person Households | 160 (6.2%) | 0 (0.0%) |
| 6-Person Households | 47 (1.8%) | 0 (0.0%) |
| 7+ Person Households | 43 (1.7%) | 0 (0.0%) |
| Total | 1,763 (68.6%) | 807 (31.4%) |
Female Fertility in Wabaunsee County
Fertility by Age in Wabaunsee County
Average fertility rate in Wabaunsee County is 82.0 births per 1,000 women. Women in the age bracket of 20 to 34 years have the highest fertility rate with 177.0 births per 1,000 women. Women in the age bracket of 20 to 34 years acount for 85.2% of all women with births.
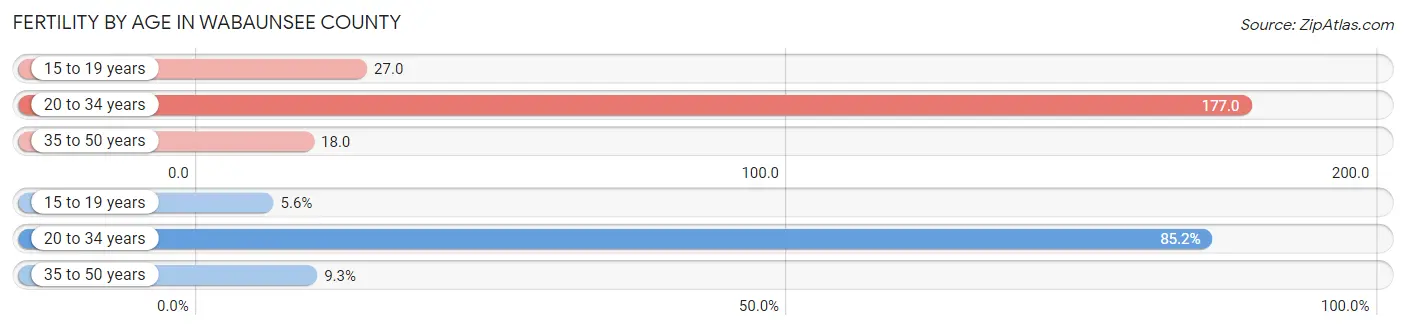
| Age Bracket | Women with Births | Births / 1,000 Women |
| 15 to 19 years | 6 (5.6%) | 27.0 |
| 20 to 34 years | 92 (85.2%) | 177.0 |
| 35 to 50 years | 10 (9.3%) | 18.0 |
| Total | 108 (100.0%) | 82.0 |
Fertility by Age by Marriage Status in Wabaunsee County
75.9% of women with births (108) in Wabaunsee County are married. The highest percentage of unmarried women with births falls into 15 to 19 years age bracket with 100.0% of them unmarried at the time of birth, while the lowest percentage of unmarried women with births belong to 35 to 50 years age bracket with 0.0% of them unmarried.
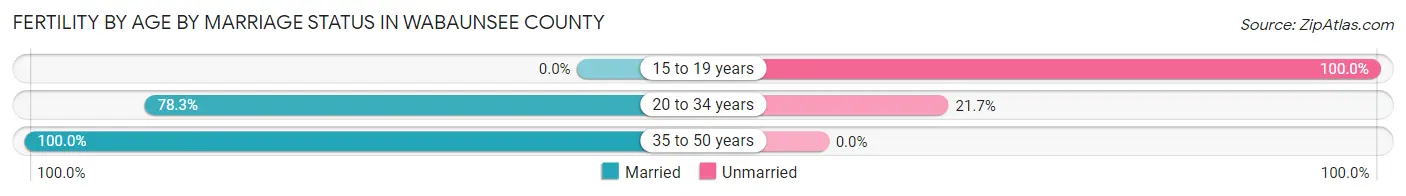
| Age Bracket | Married | Unmarried |
| 15 to 19 years | 0 (0.0%) | 6 (100.0%) |
| 20 to 34 years | 72 (78.3%) | 20 (21.7%) |
| 35 to 50 years | 10 (100.0%) | 0 (0.0%) |
| Total | 82 (75.9%) | 26 (24.1%) |
Fertility by Education in Wabaunsee County
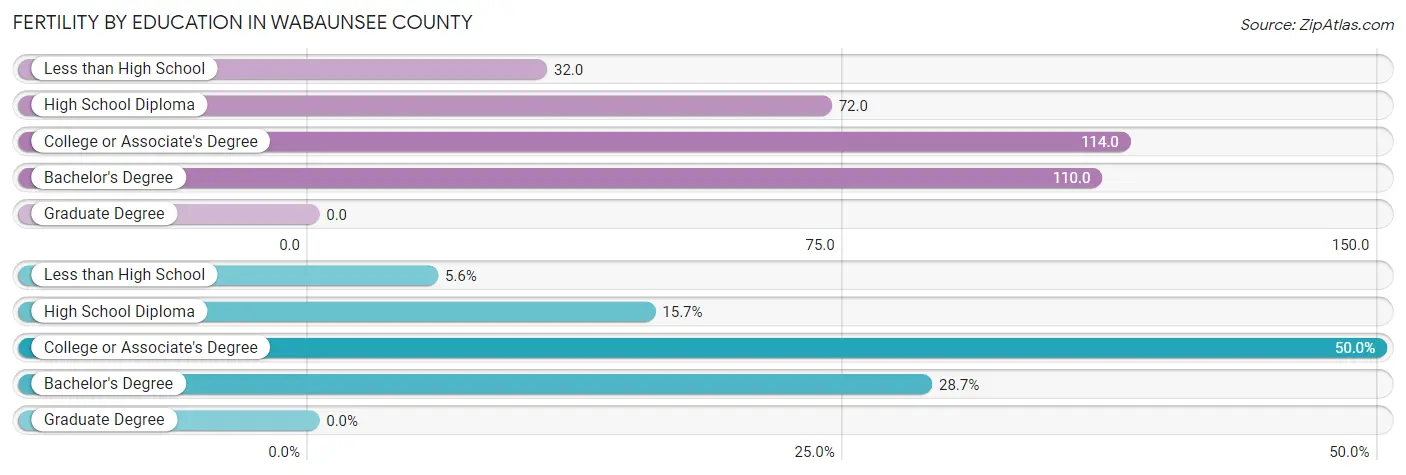
| Educational Attainment | Women with Births | Births / 1,000 Women |
| Less than High School | 6 (5.6%) | 32.0 |
| High School Diploma | 17 (15.7%) | 72.0 |
| College or Associate's Degree | 54 (50.0%) | 114.0 |
| Bachelor's Degree | 31 (28.7%) | 110.0 |
| Graduate Degree | 0 (0.0%) | 0.0 |
| Total | 108 (100.0%) | 82.0 |
Fertility by Education by Marriage Status in Wabaunsee County
24.1% of women with births in Wabaunsee County are unmarried. Women with the educational attainment of bachelor's degree are most likely to be married with 100.0% of them married at childbirth, while women with the educational attainment of less than high school are least likely to be married with 100.0% of them unmarried at childbirth.
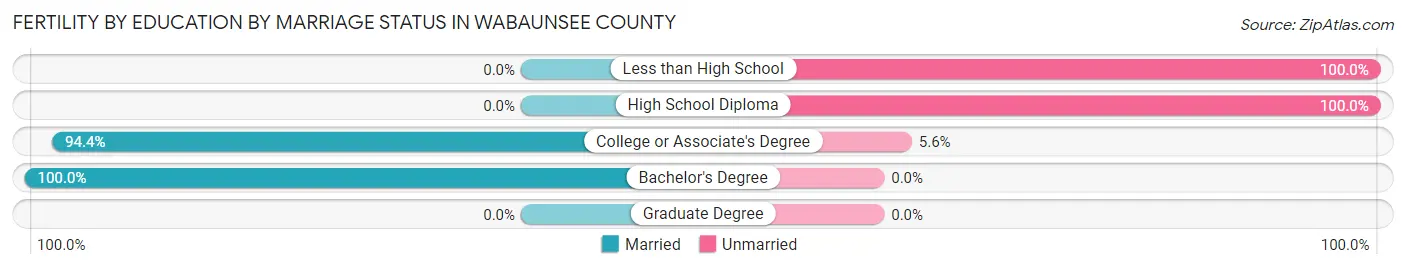
| Educational Attainment | Married | Unmarried |
| Less than High School | 0 (0.0%) | 6 (100.0%) |
| High School Diploma | 0 (0.0%) | 17 (100.0%) |
| College or Associate's Degree | 51 (94.4%) | 3 (5.6%) |
| Bachelor's Degree | 31 (100.0%) | 0 (0.0%) |
| Graduate Degree | 0 (0.0%) | 0 (0.0%) |
| Total | 82 (75.9%) | 26 (24.1%) |
Employment Characteristics in Wabaunsee County
Employment by Class of Employer in Wabaunsee County
Among the 3,246 employed individuals in Wabaunsee County, private company employees (1,785 | 55.0%), local government employees (408 | 12.6%), and self-employed (not incorporated) (376 | 11.6%) make up the most common classes of employment.
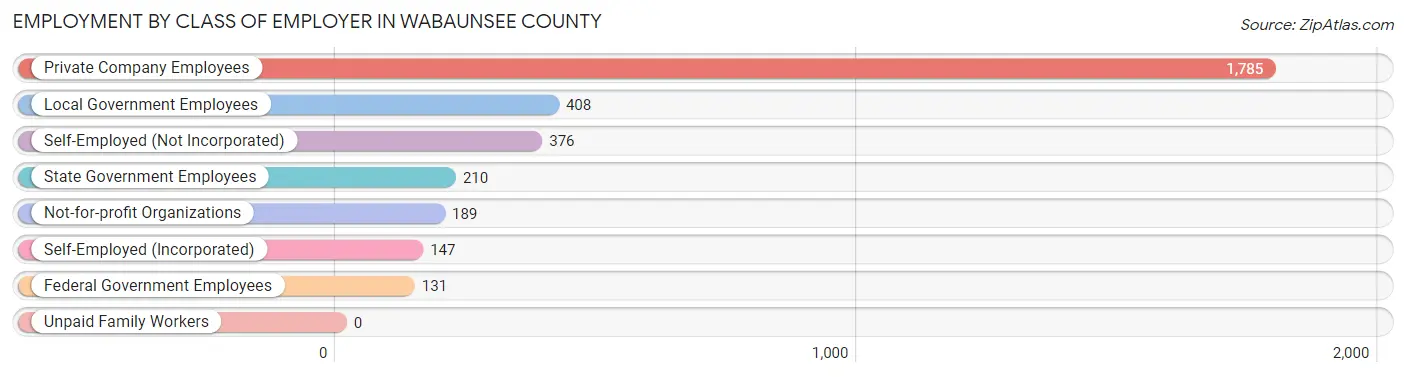
| Employer Class | # Employees | % Employees |
| Private Company Employees | 1,785 | 55.0% |
| Self-Employed (Incorporated) | 147 | 4.5% |
| Self-Employed (Not Incorporated) | 376 | 11.6% |
| Not-for-profit Organizations | 189 | 5.8% |
| Local Government Employees | 408 | 12.6% |
| State Government Employees | 210 | 6.5% |
| Federal Government Employees | 131 | 4.0% |
| Unpaid Family Workers | 0 | 0.0% |
| Total | 3,246 | 100.0% |
Employment Status by Age in Wabaunsee County
According to the labor force statistics for Wabaunsee County, out of the total population over 16 years of age (5,530), 61.6% or 3,406 individuals are in the labor force, with 3.0% or 102 of them unemployed. The age group with the highest labor force participation rate is 35 to 44 years, with 90.8% or 689 individuals in the labor force. Within the labor force, the 30 to 34 years age range has the highest percentage of unemployed individuals, with 11.4% or 31 of them being unemployed.
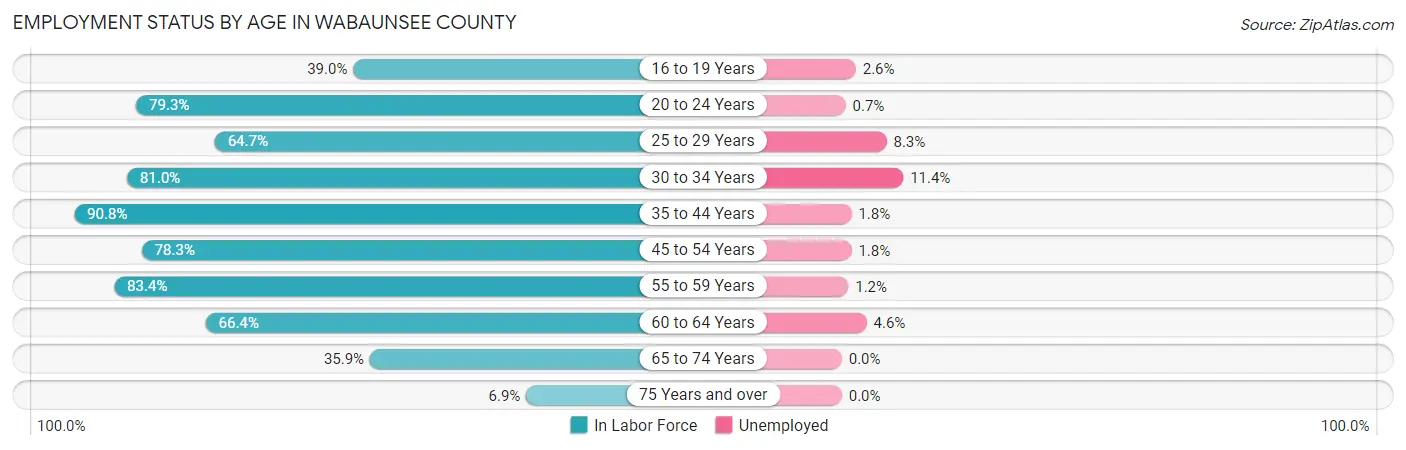
| Age Bracket | In Labor Force | Unemployed |
| 16 to 19 Years | 151 (39.0%) | 4 (2.6%) |
| 20 to 24 Years | 280 (79.3%) | 2 (0.7%) |
| 25 to 29 Years | 218 (64.7%) | 18 (8.3%) |
| 30 to 34 Years | 272 (81.0%) | 31 (11.4%) |
| 35 to 44 Years | 689 (90.8%) | 12 (1.8%) |
| 45 to 54 Years | 614 (78.3%) | 11 (1.8%) |
| 55 to 59 Years | 411 (83.4%) | 5 (1.2%) |
| 60 to 64 Years | 417 (66.4%) | 19 (4.6%) |
| 65 to 74 Years | 313 (35.9%) | 0 (0.0%) |
| 75 Years and over | 40 (6.9%) | 0 (0.0%) |
| Total | 3,406 (61.6%) | 102 (3.0%) |
Employment Status by Educational Attainment in Wabaunsee County
According to labor force statistics for Wabaunsee County, 78.5% of individuals (2,620) out of the total population between 25 and 64 years of age (3,337) are in the labor force, with 3.7% or 97 of them being unemployed. The group with the highest labor force participation rate are those with the educational attainment of bachelor's degree or higher, with 90.5% or 882 individuals in the labor force. Within the labor force, individuals with college / associate degree education have the highest percentage of unemployment, with 5.8% or 55 of them being unemployed.
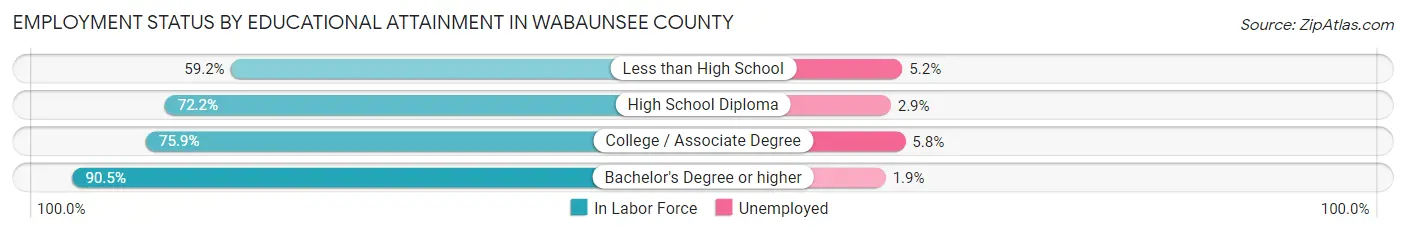
| Educational Attainment | In Labor Force | Unemployed |
| Less than High School | 58 (59.2%) | 5 (5.2%) |
| High School Diploma | 731 (72.2%) | 29 (2.9%) |
| College / Associate Degree | 950 (75.9%) | 73 (5.8%) |
| Bachelor's Degree or higher | 882 (90.5%) | 19 (1.9%) |
| Total | 2,620 (78.5%) | 123 (3.7%) |
Employment Occupations by Sex in Wabaunsee County
Management, Business, Science and Arts Occupations
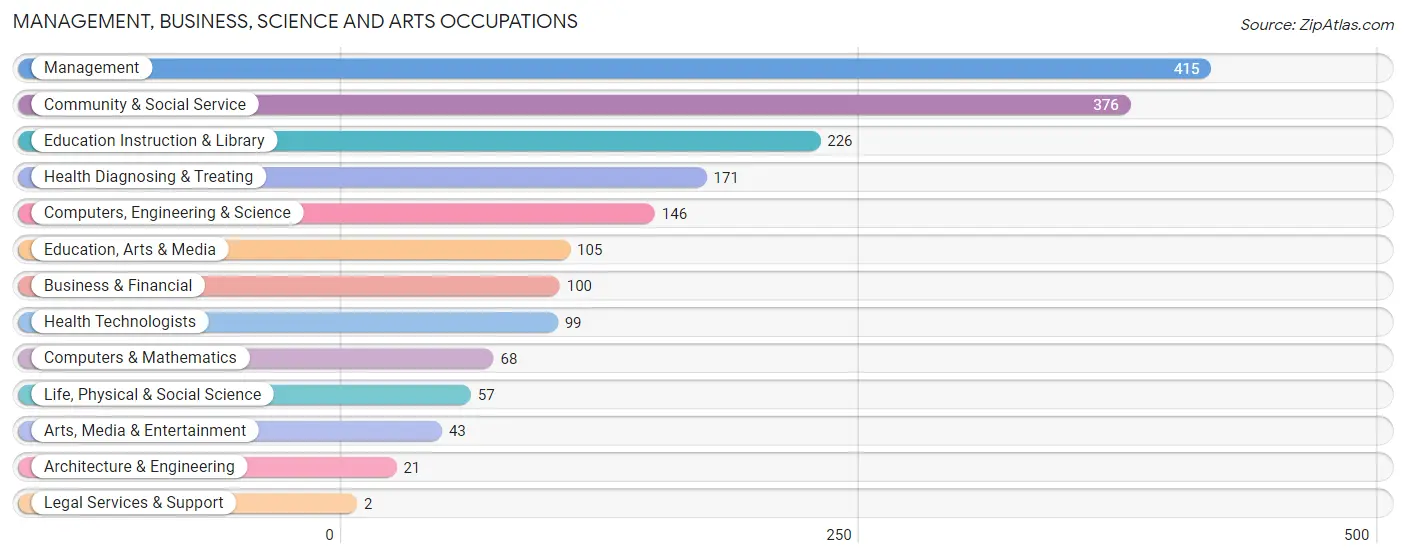
The most common Management, Business, Science and Arts occupations in Wabaunsee County are Management (415 | 12.6%), Community & Social Service (376 | 11.4%), Education Instruction & Library (226 | 6.9%), Health Diagnosing & Treating (171 | 5.2%), and Computers, Engineering & Science (146 | 4.4%).
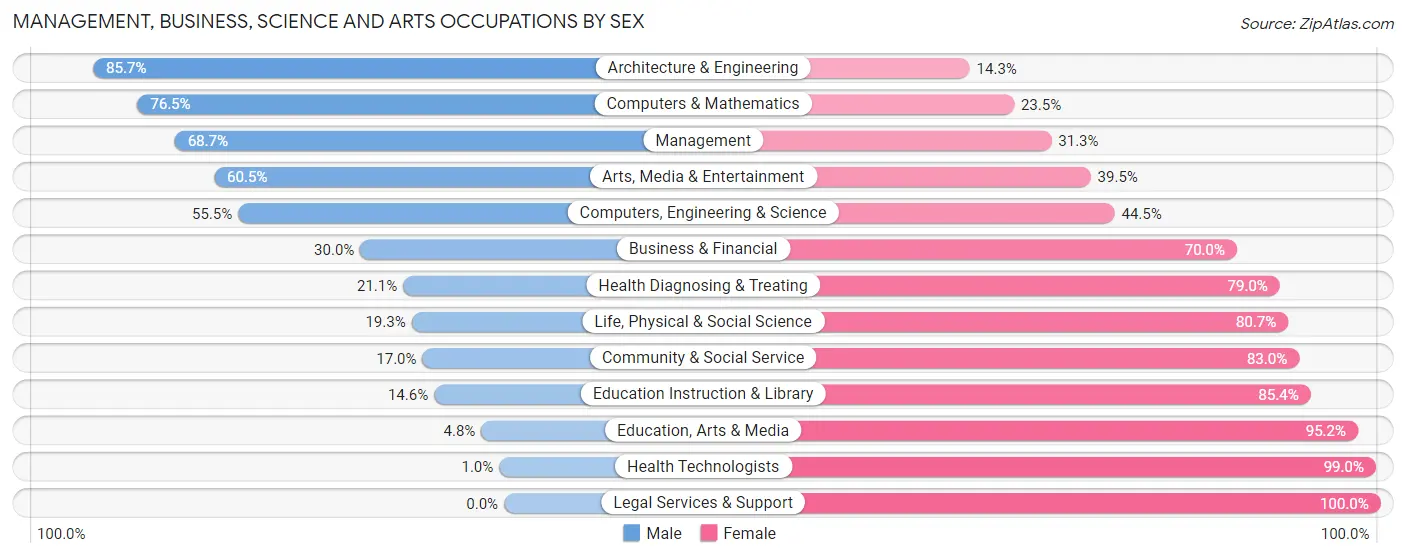
Management, Business, Science and Arts Occupations by Sex
Within the Management, Business, Science and Arts occupations in Wabaunsee County, the most male-oriented occupations are Architecture & Engineering (85.7%), Computers & Mathematics (76.5%), and Management (68.7%), while the most female-oriented occupations are Legal Services & Support (100.0%), Health Technologists (99.0%), and Education, Arts & Media (95.2%).
| Occupation | Male | Female |
| Management | 285 (68.7%) | 130 (31.3%) |
| Business & Financial | 30 (30.0%) | 70 (70.0%) |
| Computers, Engineering & Science | 81 (55.5%) | 65 (44.5%) |
| Computers & Mathematics | 52 (76.5%) | 16 (23.5%) |
| Architecture & Engineering | 18 (85.7%) | 3 (14.3%) |
| Life, Physical & Social Science | 11 (19.3%) | 46 (80.7%) |
| Community & Social Service | 64 (17.0%) | 312 (83.0%) |
| Education, Arts & Media | 5 (4.8%) | 100 (95.2%) |
| Legal Services & Support | 0 (0.0%) | 2 (100.0%) |
| Education Instruction & Library | 33 (14.6%) | 193 (85.4%) |
| Arts, Media & Entertainment | 26 (60.5%) | 17 (39.5%) |
| Health Diagnosing & Treating | 36 (21.0%) | 135 (78.9%) |
| Health Technologists | 1 (1.0%) | 98 (99.0%) |
| Total (Category) | 496 (41.1%) | 712 (58.9%) |
| Total (Overall) | 1,758 (53.3%) | 1,539 (46.7%) |
Services Occupations
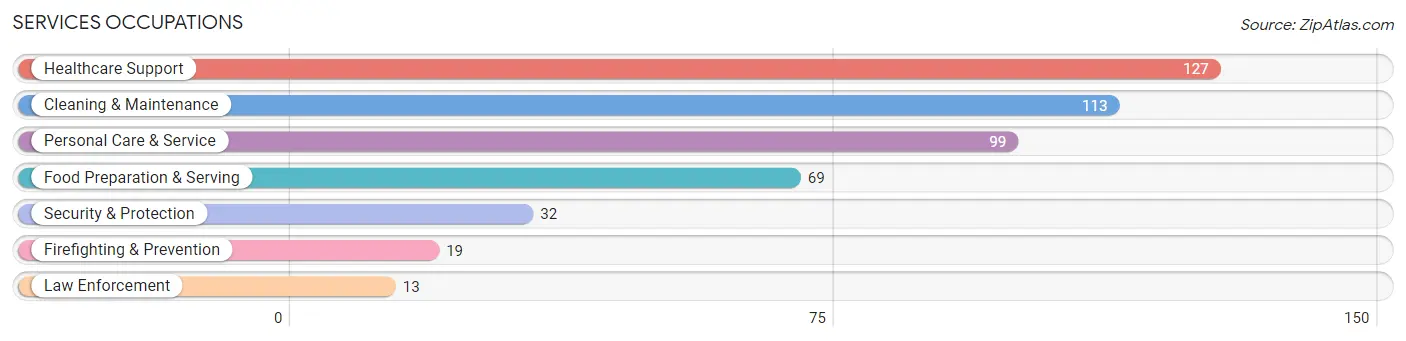
The most common Services occupations in Wabaunsee County are Healthcare Support (127 | 3.8%), Cleaning & Maintenance (113 | 3.4%), Personal Care & Service (99 | 3.0%), Food Preparation & Serving (69 | 2.1%), and Security & Protection (32 | 1.0%).
Services Occupations by Sex
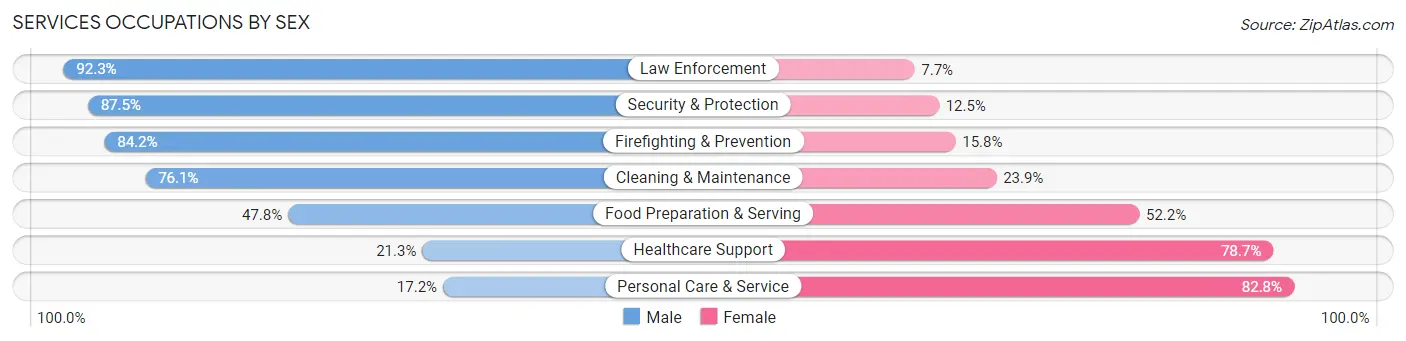
Within the Services occupations in Wabaunsee County, the most male-oriented occupations are Law Enforcement (92.3%), Security & Protection (87.5%), and Firefighting & Prevention (84.2%), while the most female-oriented occupations are Personal Care & Service (82.8%), Healthcare Support (78.7%), and Food Preparation & Serving (52.2%).
| Occupation | Male | Female |
| Healthcare Support | 27 (21.3%) | 100 (78.7%) |
| Security & Protection | 28 (87.5%) | 4 (12.5%) |
| Firefighting & Prevention | 16 (84.2%) | 3 (15.8%) |
| Law Enforcement | 12 (92.3%) | 1 (7.7%) |
| Food Preparation & Serving | 33 (47.8%) | 36 (52.2%) |
| Cleaning & Maintenance | 86 (76.1%) | 27 (23.9%) |
| Personal Care & Service | 17 (17.2%) | 82 (82.8%) |
| Total (Category) | 191 (43.4%) | 249 (56.6%) |
| Total (Overall) | 1,758 (53.3%) | 1,539 (46.7%) |
Sales and Office Occupations
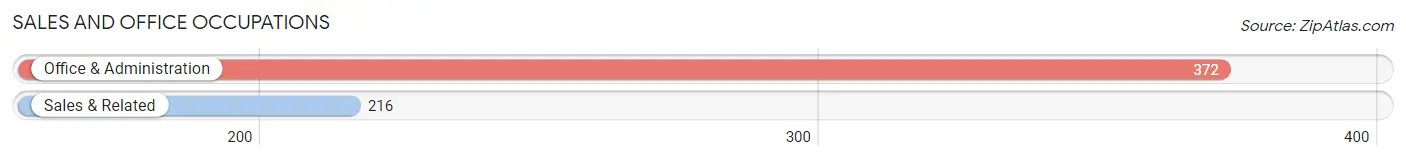
The most common Sales and Office occupations in Wabaunsee County are Office & Administration (372 | 11.3%), and Sales & Related (216 | 6.6%).
Sales and Office Occupations by Sex
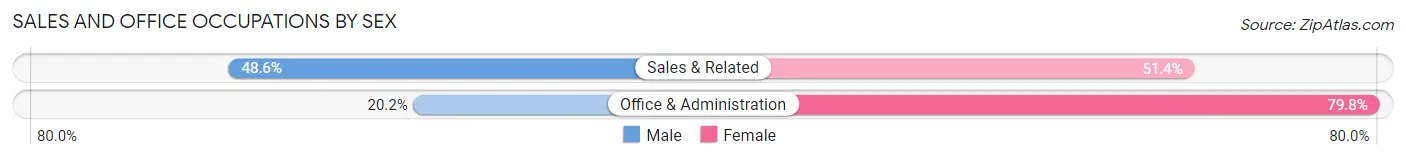
| Occupation | Male | Female |
| Sales & Related | 105 (48.6%) | 111 (51.4%) |
| Office & Administration | 75 (20.2%) | 297 (79.8%) |
| Total (Category) | 180 (30.6%) | 408 (69.4%) |
| Total (Overall) | 1,758 (53.3%) | 1,539 (46.7%) |
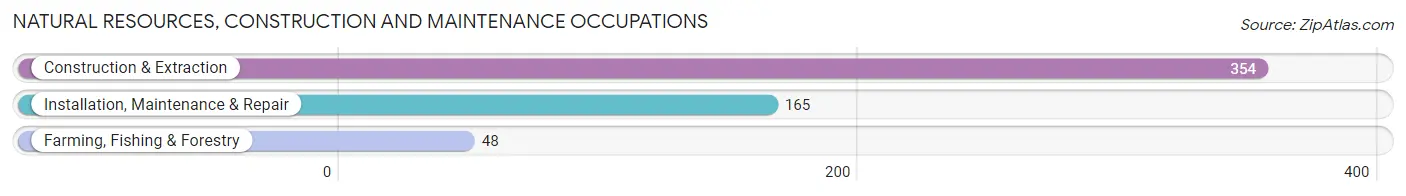
Natural Resources, Construction and Maintenance Occupations
The most common Natural Resources, Construction and Maintenance occupations in Wabaunsee County are Construction & Extraction (354 | 10.7%), Installation, Maintenance & Repair (165 | 5.0%), and Farming, Fishing & Forestry (48 | 1.5%).
Natural Resources, Construction and Maintenance Occupations by Sex
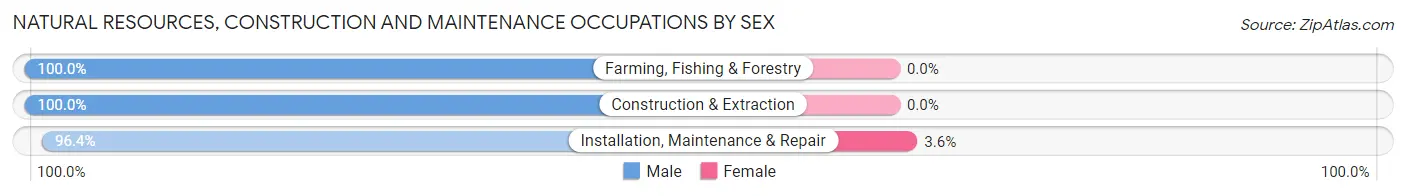
| Occupation | Male | Female |
| Farming, Fishing & Forestry | 48 (100.0%) | 0 (0.0%) |
| Construction & Extraction | 354 (100.0%) | 0 (0.0%) |
| Installation, Maintenance & Repair | 159 (96.4%) | 6 (3.6%) |
| Total (Category) | 561 (98.9%) | 6 (1.1%) |
| Total (Overall) | 1,758 (53.3%) | 1,539 (46.7%) |
Production, Transportation and Moving Occupations
The most common Production, Transportation and Moving occupations in Wabaunsee County are Production (256 | 7.8%), Material Moving (149 | 4.5%), and Transportation (89 | 2.7%).
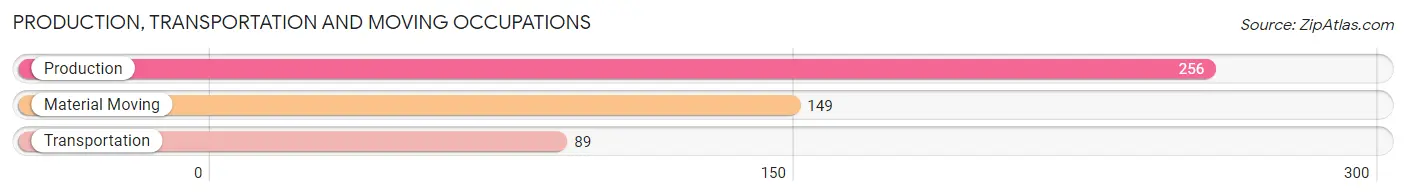
Production, Transportation and Moving Occupations by Sex
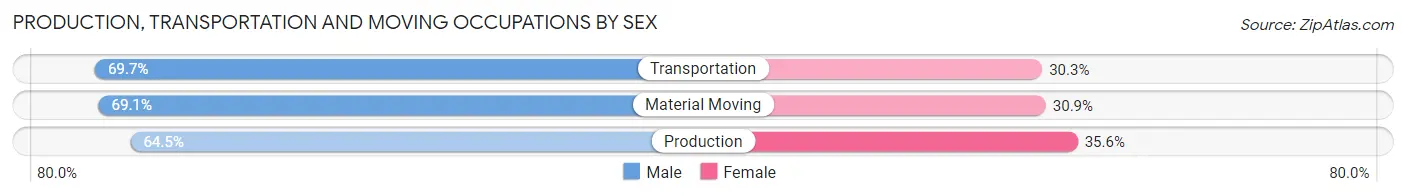
| Occupation | Male | Female |
| Production | 165 (64.4%) | 91 (35.5%) |
| Transportation | 62 (69.7%) | 27 (30.3%) |
| Material Moving | 103 (69.1%) | 46 (30.9%) |
| Total (Category) | 330 (66.8%) | 164 (33.2%) |
| Total (Overall) | 1,758 (53.3%) | 1,539 (46.7%) |
Employment Industries by Sex in Wabaunsee County
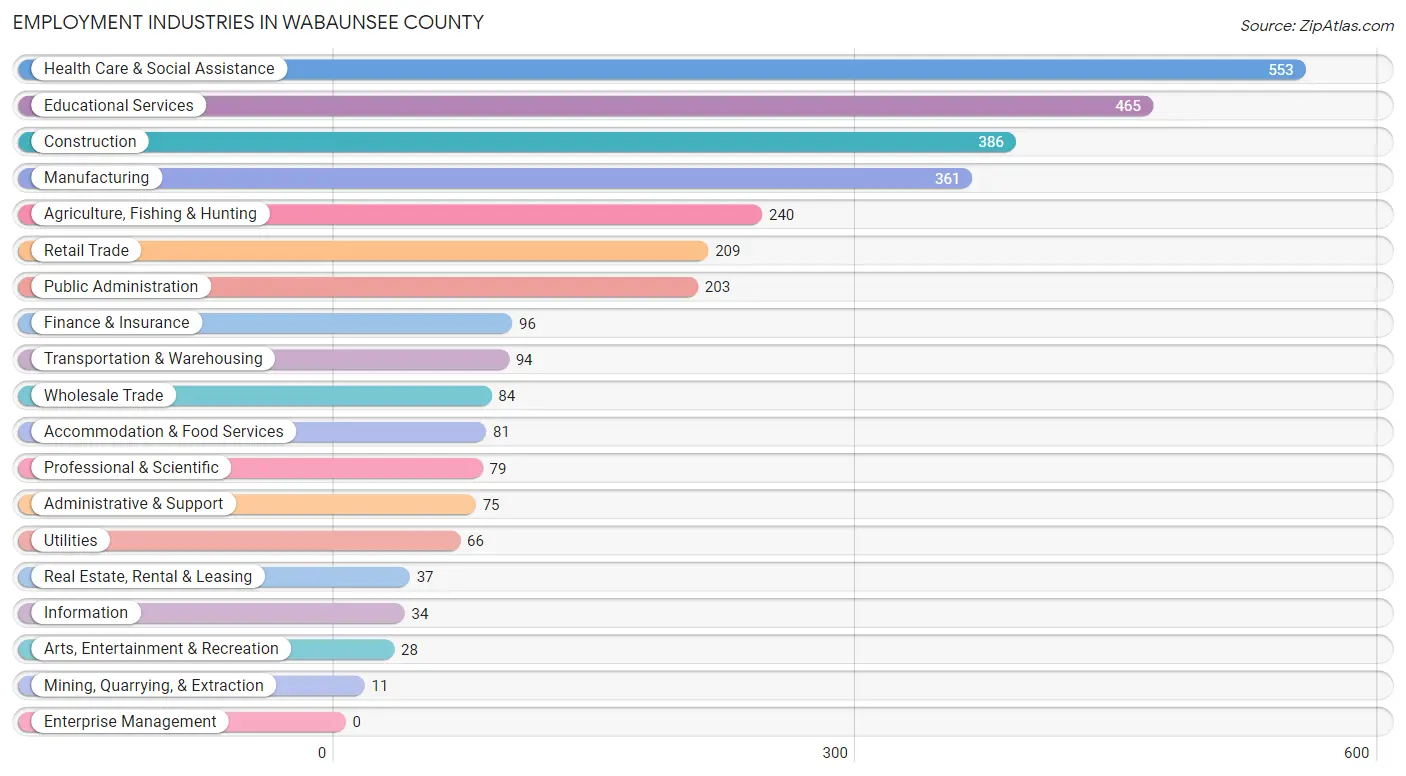
Employment Industries in Wabaunsee County
The major employment industries in Wabaunsee County include Health Care & Social Assistance (553 | 16.8%), Educational Services (465 | 14.1%), Construction (386 | 11.7%), Manufacturing (361 | 11.0%), and Agriculture, Fishing & Hunting (240 | 7.3%).
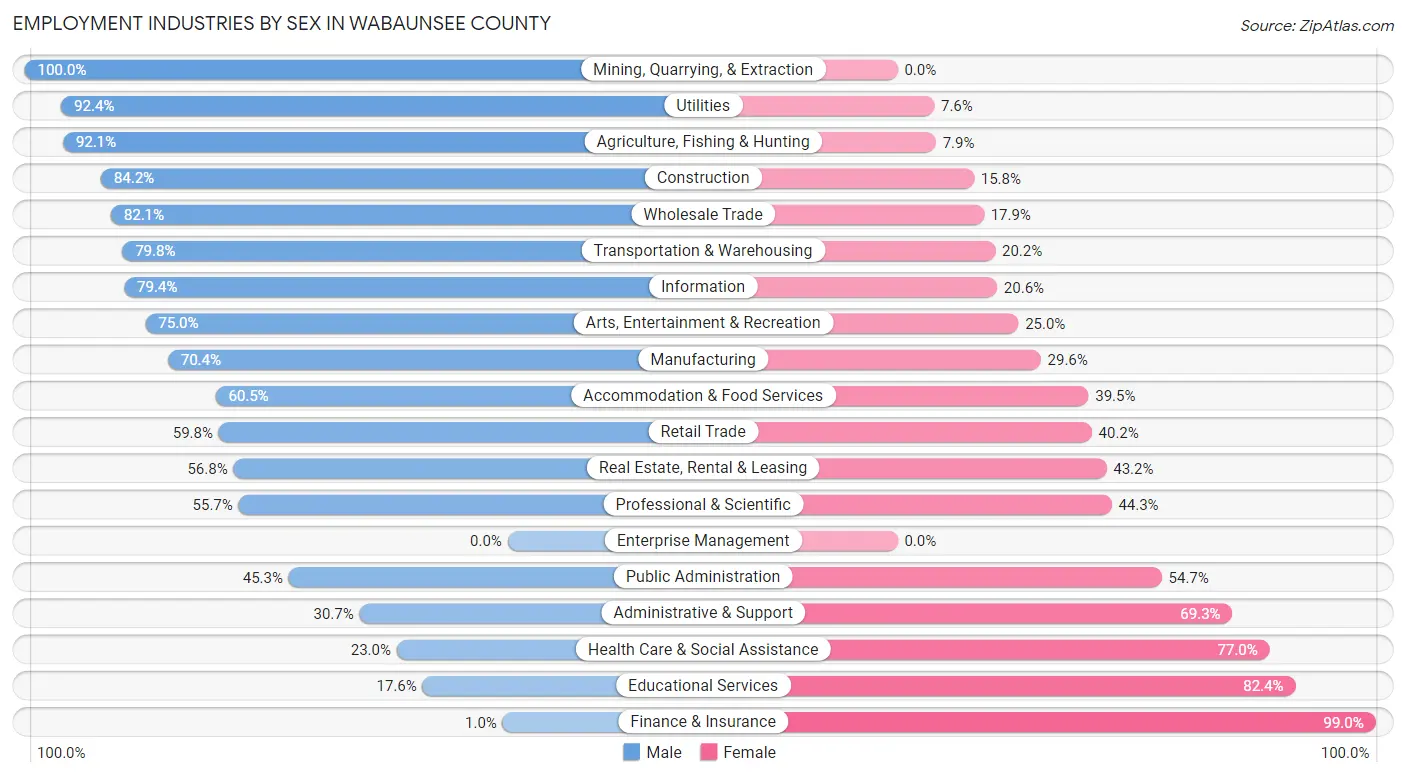
Employment Industries by Sex in Wabaunsee County
The Wabaunsee County industries that see more men than women are Mining, Quarrying, & Extraction (100.0%), Utilities (92.4%), and Agriculture, Fishing & Hunting (92.1%), whereas the industries that tend to have a higher number of women are Finance & Insurance (99.0%), Educational Services (82.4%), and Health Care & Social Assistance (77.0%).
| Industry | Male | Female |
| Agriculture, Fishing & Hunting | 221 (92.1%) | 19 (7.9%) |
| Mining, Quarrying, & Extraction | 11 (100.0%) | 0 (0.0%) |
| Construction | 325 (84.2%) | 61 (15.8%) |
| Manufacturing | 254 (70.4%) | 107 (29.6%) |
| Wholesale Trade | 69 (82.1%) | 15 (17.9%) |
| Retail Trade | 125 (59.8%) | 84 (40.2%) |
| Transportation & Warehousing | 75 (79.8%) | 19 (20.2%) |
| Utilities | 61 (92.4%) | 5 (7.6%) |
| Information | 27 (79.4%) | 7 (20.6%) |
| Finance & Insurance | 1 (1.0%) | 95 (99.0%) |
| Real Estate, Rental & Leasing | 21 (56.8%) | 16 (43.2%) |
| Professional & Scientific | 44 (55.7%) | 35 (44.3%) |
| Enterprise Management | 0 (0.0%) | 0 (0.0%) |
| Administrative & Support | 23 (30.7%) | 52 (69.3%) |
| Educational Services | 82 (17.6%) | 383 (82.4%) |
| Health Care & Social Assistance | 127 (23.0%) | 426 (77.0%) |
| Arts, Entertainment & Recreation | 21 (75.0%) | 7 (25.0%) |
| Accommodation & Food Services | 49 (60.5%) | 32 (39.5%) |
| Public Administration | 92 (45.3%) | 111 (54.7%) |
| Total | 1,758 (53.3%) | 1,539 (46.7%) |
Education in Wabaunsee County
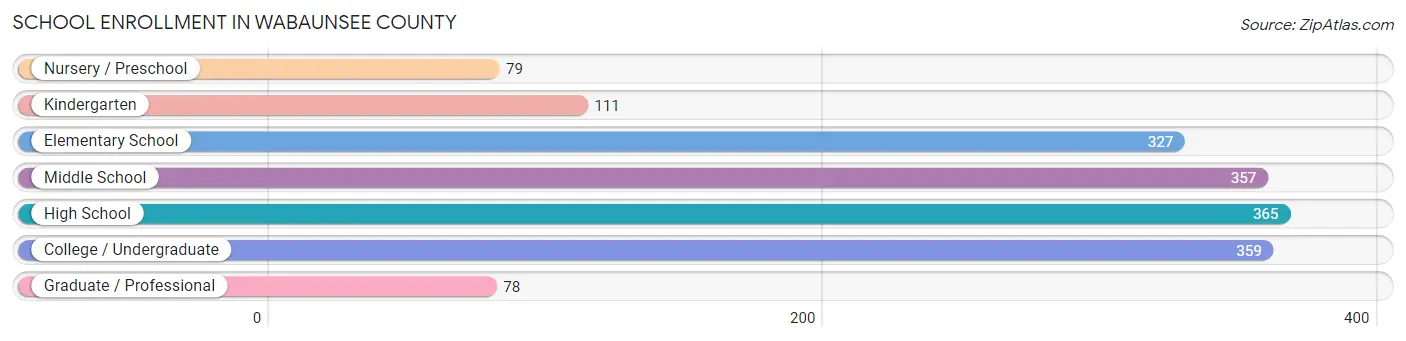
School Enrollment in Wabaunsee County
The most common levels of schooling among the 1,676 students in Wabaunsee County are high school (365 | 21.8%), college / undergraduate (359 | 21.4%), and middle school (357 | 21.3%).
| School Level | # Students | % Students |
| Nursery / Preschool | 79 | 4.7% |
| Kindergarten | 111 | 6.6% |
| Elementary School | 327 | 19.5% |
| Middle School | 357 | 21.3% |
| High School | 365 | 21.8% |
| College / Undergraduate | 359 | 21.4% |
| Graduate / Professional | 78 | 4.6% |
| Total | 1,676 | 100.0% |
School Enrollment by Age by Funding Source in Wabaunsee County
Out of a total of 1,676 students who are enrolled in schools in Wabaunsee County, 256 (15.3%) attend a private institution, while the remaining 1,420 (84.7%) are enrolled in public schools. The age group of 5 to 9 year old has the highest likelihood of being enrolled in private schools, with 129 (30.5% in the age bracket) enrolled. Conversely, the age group of 20 to 24 year olds has the lowest likelihood of being enrolled in a private school, with 144 (100.0% in the age bracket) attending a public institution.
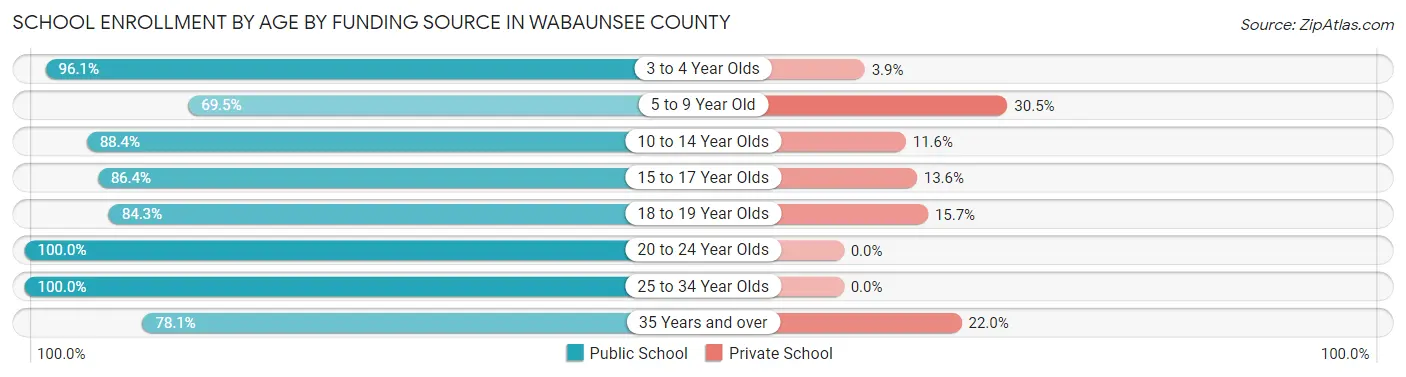
| Age Bracket | Public School | Private School |
| 3 to 4 Year Olds | 49 (96.1%) | 2 (3.9%) |
| 5 to 9 Year Old | 294 (69.5%) | 129 (30.5%) |
| 10 to 14 Year Olds | 382 (88.4%) | 50 (11.6%) |
| 15 to 17 Year Olds | 241 (86.4%) | 38 (13.6%) |
| 18 to 19 Year Olds | 102 (84.3%) | 19 (15.7%) |
| 20 to 24 Year Olds | 144 (100.0%) | 0 (0.0%) |
| 25 to 34 Year Olds | 144 (100.0%) | 0 (0.0%) |
| 35 Years and over | 64 (78.0%) | 18 (22.0%) |
| Total | 1,420 (84.7%) | 256 (15.3%) |
Educational Attainment by Field of Study in Wabaunsee County
Education (253 | 20.2%), bio, nature & agricultural (228 | 18.2%), business (203 | 16.2%), science & technology (150 | 12.0%), and arts & humanities (115 | 9.2%) are the most common fields of study among 1,250 individuals in Wabaunsee County who have obtained a bachelor's degree or higher.
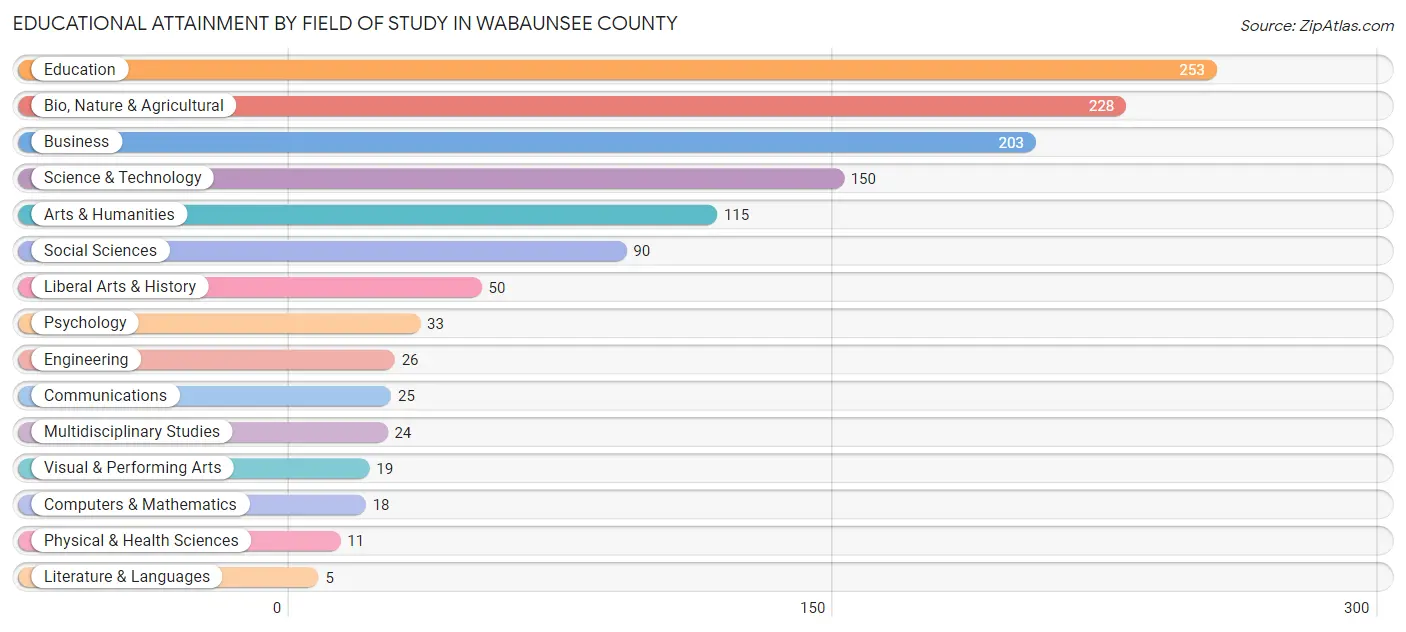
| Field of Study | # Graduates | % Graduates |
| Computers & Mathematics | 18 | 1.4% |
| Bio, Nature & Agricultural | 228 | 18.2% |
| Physical & Health Sciences | 11 | 0.9% |
| Psychology | 33 | 2.6% |
| Social Sciences | 90 | 7.2% |
| Engineering | 26 | 2.1% |
| Multidisciplinary Studies | 24 | 1.9% |
| Science & Technology | 150 | 12.0% |
| Business | 203 | 16.2% |
| Education | 253 | 20.2% |
| Literature & Languages | 5 | 0.4% |
| Liberal Arts & History | 50 | 4.0% |
| Visual & Performing Arts | 19 | 1.5% |
| Communications | 25 | 2.0% |
| Arts & Humanities | 115 | 9.2% |
| Total | 1,250 | 100.0% |
Transportation & Commute in Wabaunsee County
Vehicle Availability by Sex in Wabaunsee County
The most prevalent vehicle ownership categories in Wabaunsee County are males with 2 vehicles (654, accounting for 38.2%) and females with 2 vehicles (558, making up 42.6%).
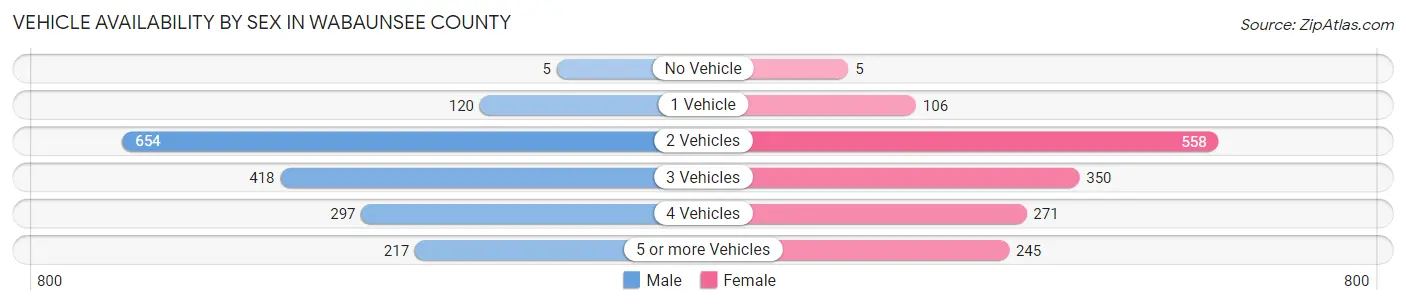
| Vehicles Available | Male | Female |
| No Vehicle | 5 (0.3%) | 5 (0.3%) |
| 1 Vehicle | 120 (7.0%) | 106 (6.9%) |
| 2 Vehicles | 654 (38.2%) | 558 (36.3%) |
| 3 Vehicles | 418 (24.4%) | 350 (22.8%) |
| 4 Vehicles | 297 (17.4%) | 271 (17.6%) |
| 5 or more Vehicles | 217 (12.7%) | 245 (16.0%) |
| Total | 1,711 (100.0%) | 1,535 (100.0%) |
Commute Time in Wabaunsee County
The most frequently occuring commute durations in Wabaunsee County are 45 to 59 minutes (407 commuters, 14.0%), 30 to 34 minutes (404 commuters, 13.9%), and 25 to 29 minutes (390 commuters, 13.4%).
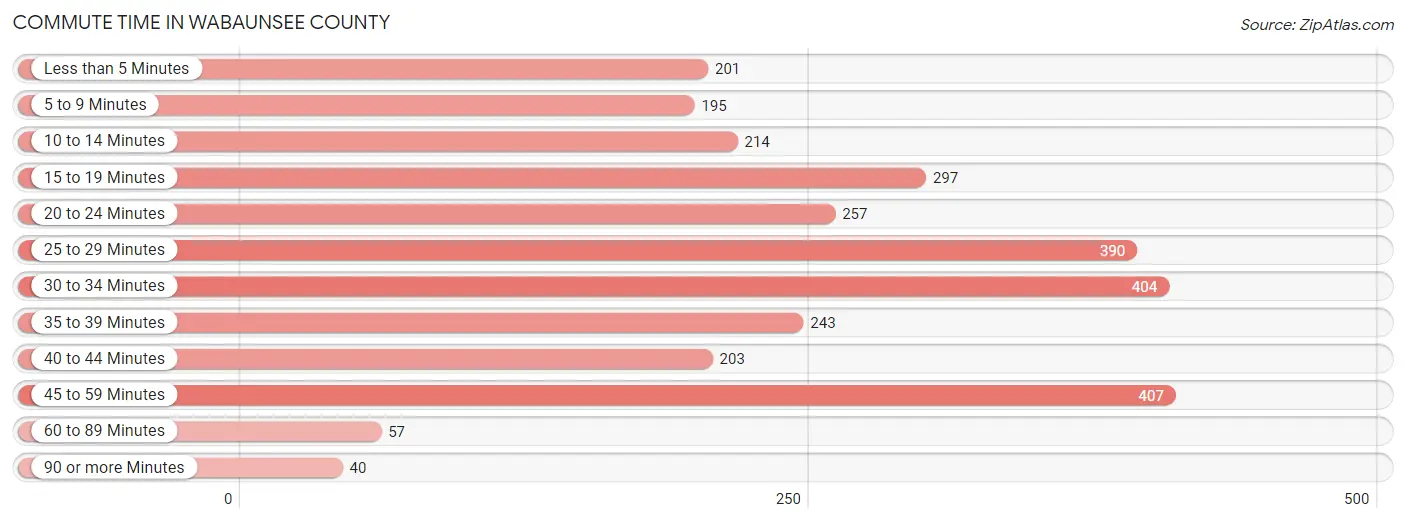
| Commute Time | # Commuters | % Commuters |
| Less than 5 Minutes | 201 | 6.9% |
| 5 to 9 Minutes | 195 | 6.7% |
| 10 to 14 Minutes | 214 | 7.4% |
| 15 to 19 Minutes | 297 | 10.2% |
| 20 to 24 Minutes | 257 | 8.8% |
| 25 to 29 Minutes | 390 | 13.4% |
| 30 to 34 Minutes | 404 | 13.9% |
| 35 to 39 Minutes | 243 | 8.4% |
| 40 to 44 Minutes | 203 | 7.0% |
| 45 to 59 Minutes | 407 | 14.0% |
| 60 to 89 Minutes | 57 | 2.0% |
| 90 or more Minutes | 40 | 1.4% |
Commute Time by Sex in Wabaunsee County
The most common commute times in Wabaunsee County are 25 to 29 minutes (283 commuters, 17.9%) for males and 30 to 34 minutes (210 commuters, 15.8%) for females.
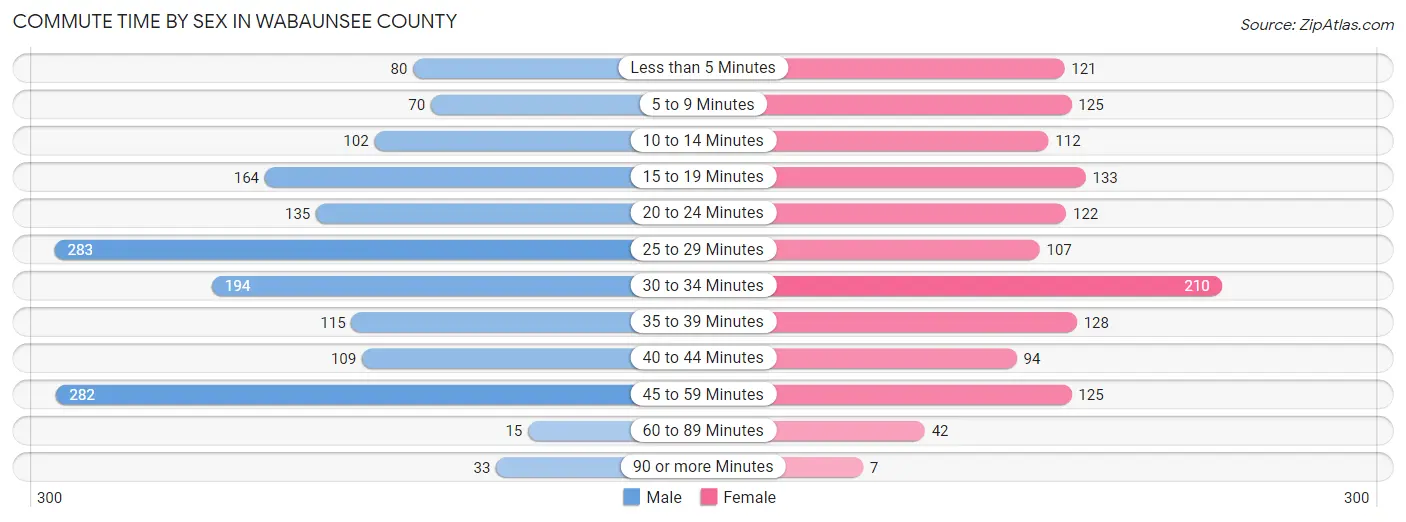
| Commute Time | Male | Female |
| Less than 5 Minutes | 80 (5.1%) | 121 (9.1%) |
| 5 to 9 Minutes | 70 (4.4%) | 125 (9.4%) |
| 10 to 14 Minutes | 102 (6.5%) | 112 (8.5%) |
| 15 to 19 Minutes | 164 (10.4%) | 133 (10.0%) |
| 20 to 24 Minutes | 135 (8.5%) | 122 (9.2%) |
| 25 to 29 Minutes | 283 (17.9%) | 107 (8.1%) |
| 30 to 34 Minutes | 194 (12.3%) | 210 (15.8%) |
| 35 to 39 Minutes | 115 (7.3%) | 128 (9.7%) |
| 40 to 44 Minutes | 109 (6.9%) | 94 (7.1%) |
| 45 to 59 Minutes | 282 (17.8%) | 125 (9.4%) |
| 60 to 89 Minutes | 15 (0.9%) | 42 (3.2%) |
| 90 or more Minutes | 33 (2.1%) | 7 (0.5%) |
Time of Departure to Work by Sex in Wabaunsee County
The most frequent times of departure to work in Wabaunsee County are 7:00 AM to 7:29 AM (254, 16.1%) for males and 7:00 AM to 7:29 AM (326, 24.6%) for females.
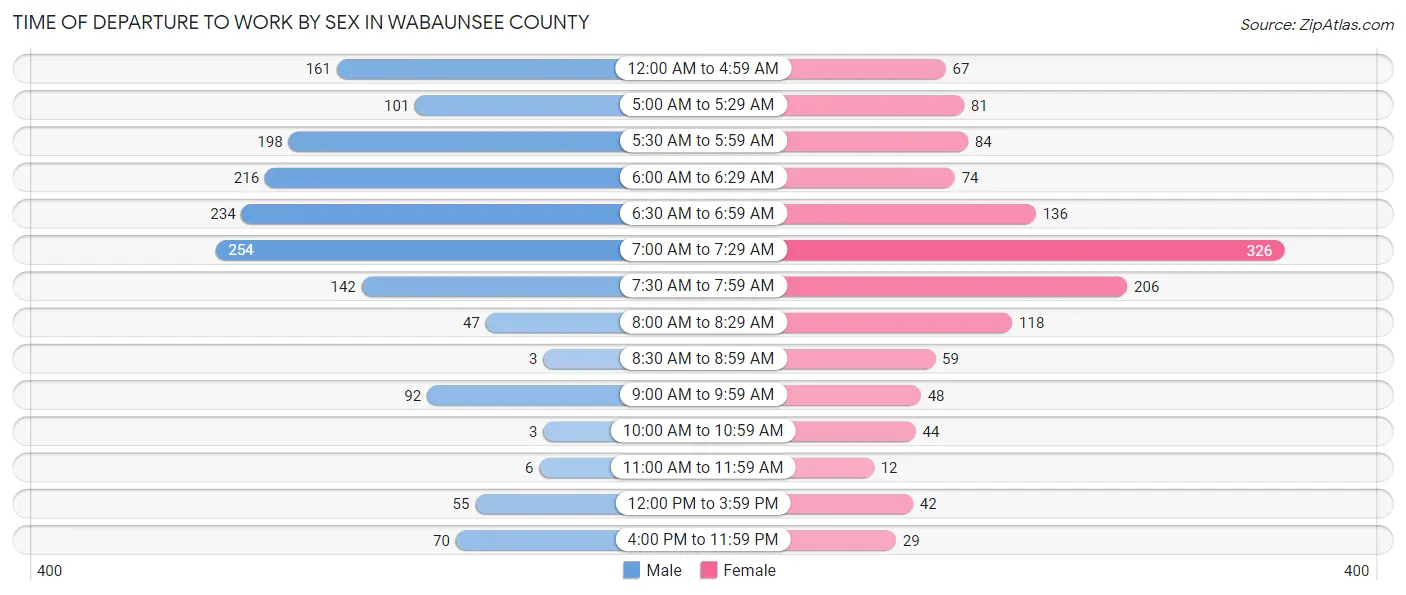
| Time of Departure | Male | Female |
| 12:00 AM to 4:59 AM | 161 (10.2%) | 67 (5.1%) |
| 5:00 AM to 5:29 AM | 101 (6.4%) | 81 (6.1%) |
| 5:30 AM to 5:59 AM | 198 (12.5%) | 84 (6.3%) |
| 6:00 AM to 6:29 AM | 216 (13.7%) | 74 (5.6%) |
| 6:30 AM to 6:59 AM | 234 (14.8%) | 136 (10.3%) |
| 7:00 AM to 7:29 AM | 254 (16.1%) | 326 (24.6%) |
| 7:30 AM to 7:59 AM | 142 (9.0%) | 206 (15.5%) |
| 8:00 AM to 8:29 AM | 47 (3.0%) | 118 (8.9%) |
| 8:30 AM to 8:59 AM | 3 (0.2%) | 59 (4.4%) |
| 9:00 AM to 9:59 AM | 92 (5.8%) | 48 (3.6%) |
| 10:00 AM to 10:59 AM | 3 (0.2%) | 44 (3.3%) |
| 11:00 AM to 11:59 AM | 6 (0.4%) | 12 (0.9%) |
| 12:00 PM to 3:59 PM | 55 (3.5%) | 42 (3.2%) |
| 4:00 PM to 11:59 PM | 70 (4.4%) | 29 (2.2%) |
| Total | 1,582 (100.0%) | 1,326 (100.0%) |
Housing Occupancy in Wabaunsee County
Occupancy by Ownership in Wabaunsee County
Of the total 2,570 dwellings in Wabaunsee County, owner-occupied units account for 2,105 (81.9%), while renter-occupied units make up 465 (18.1%).
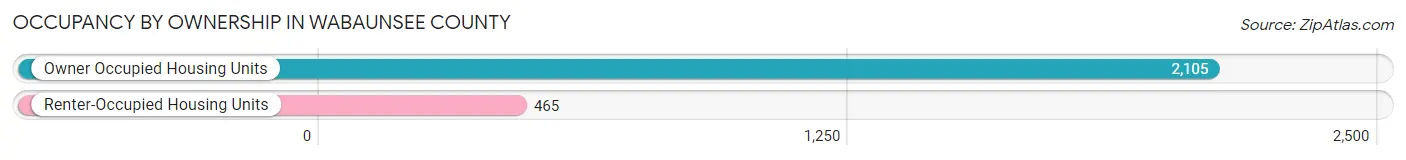
| Occupancy | # Housing Units | % Housing Units |
| Owner Occupied Housing Units | 2,105 | 81.9% |
| Renter-Occupied Housing Units | 465 | 18.1% |
| Total Occupied Housing Units | 2,570 | 100.0% |
Occupancy by Household Size in Wabaunsee County
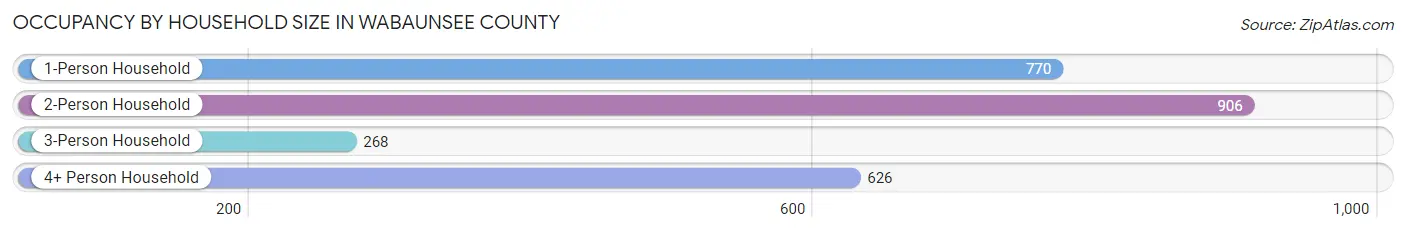
| Household Size | # Housing Units | % Housing Units |
| 1-Person Household | 770 | 30.0% |
| 2-Person Household | 906 | 35.2% |
| 3-Person Household | 268 | 10.4% |
| 4+ Person Household | 626 | 24.4% |
| Total Housing Units | 2,570 | 100.0% |
Occupancy by Ownership by Household Size in Wabaunsee County
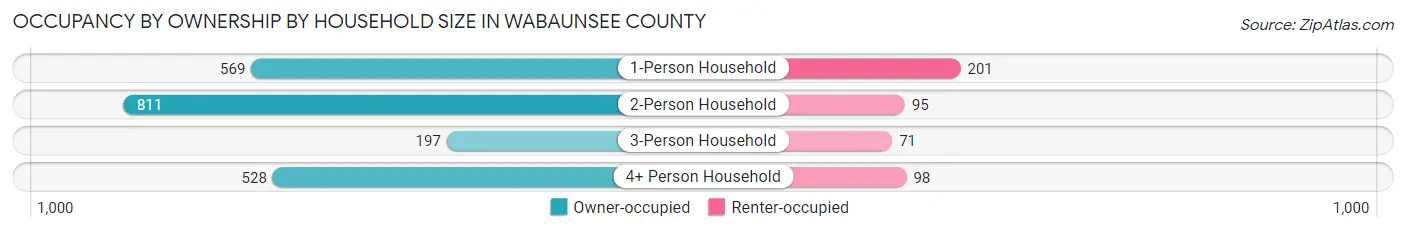
| Household Size | Owner-occupied | Renter-occupied |
| 1-Person Household | 569 (73.9%) | 201 (26.1%) |
| 2-Person Household | 811 (89.5%) | 95 (10.5%) |
| 3-Person Household | 197 (73.5%) | 71 (26.5%) |
| 4+ Person Household | 528 (84.4%) | 98 (15.7%) |
| Total Housing Units | 2,105 (81.9%) | 465 (18.1%) |
Occupancy by Educational Attainment in Wabaunsee County
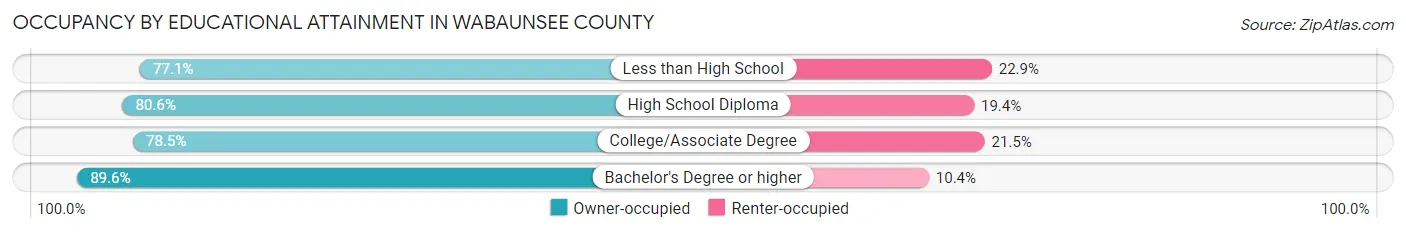
| Household Size | Owner-occupied | Renter-occupied |
| Less than High School | 37 (77.1%) | 11 (22.9%) |
| High School Diploma | 789 (80.6%) | 190 (19.4%) |
| College/Associate Degree | 730 (78.5%) | 200 (21.5%) |
| Bachelor's Degree or higher | 549 (89.6%) | 64 (10.4%) |
Occupancy by Age of Householder in Wabaunsee County
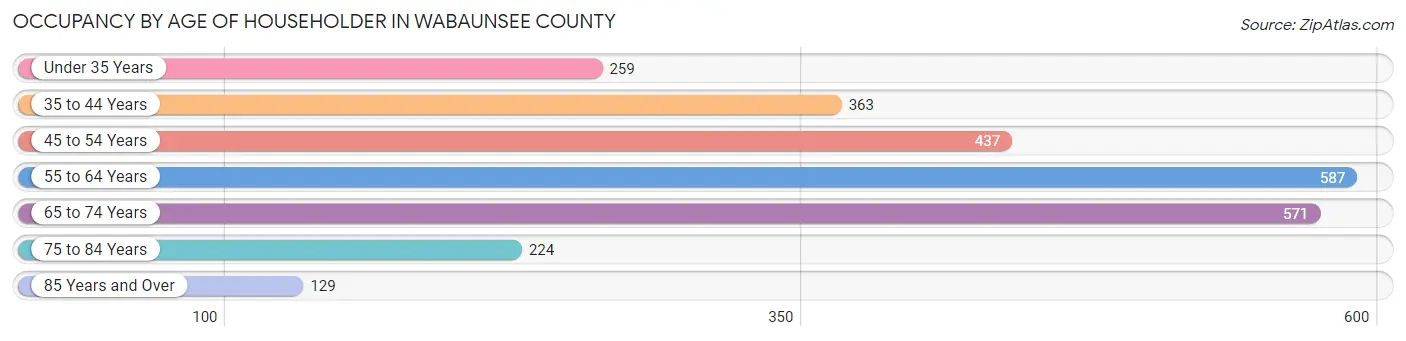
| Age Bracket | # Households | % Households |
| Under 35 Years | 259 | 10.1% |
| 35 to 44 Years | 363 | 14.1% |
| 45 to 54 Years | 437 | 17.0% |
| 55 to 64 Years | 587 | 22.8% |
| 65 to 74 Years | 571 | 22.2% |
| 75 to 84 Years | 224 | 8.7% |
| 85 Years and Over | 129 | 5.0% |
| Total | 2,570 | 100.0% |
Housing Finances in Wabaunsee County
Median Income by Occupancy in Wabaunsee County
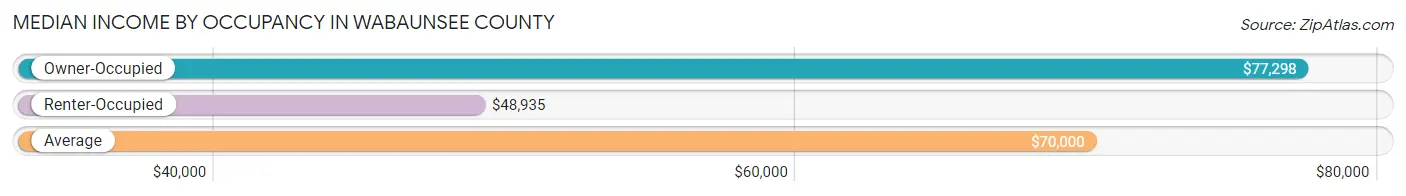
| Occupancy Type | # Households | Median Income |
| Owner-Occupied | 2,105 (81.9%) | $77,298 |
| Renter-Occupied | 465 (18.1%) | $48,935 |
| Average | 2,570 (100.0%) | $70,000 |
Occupancy by Householder Income Bracket in Wabaunsee County
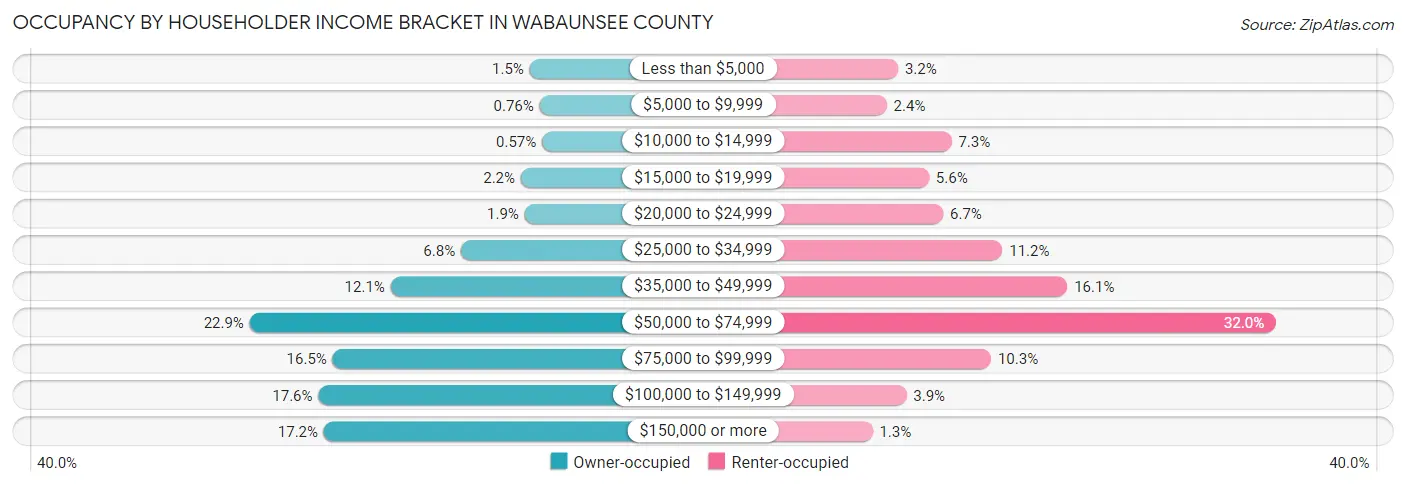
| Income Bracket | Owner-occupied | Renter-occupied |
| Less than $5,000 | 32 (1.5%) | 15 (3.2%) |
| $5,000 to $9,999 | 16 (0.8%) | 11 (2.4%) |
| $10,000 to $14,999 | 12 (0.6%) | 34 (7.3%) |
| $15,000 to $19,999 | 46 (2.2%) | 26 (5.6%) |
| $20,000 to $24,999 | 40 (1.9%) | 31 (6.7%) |
| $25,000 to $34,999 | 142 (6.8%) | 52 (11.2%) |
| $35,000 to $49,999 | 255 (12.1%) | 75 (16.1%) |
| $50,000 to $74,999 | 481 (22.9%) | 149 (32.0%) |
| $75,000 to $99,999 | 348 (16.5%) | 48 (10.3%) |
| $100,000 to $149,999 | 371 (17.6%) | 18 (3.9%) |
| $150,000 or more | 362 (17.2%) | 6 (1.3%) |
| Total | 2,105 (100.0%) | 465 (100.0%) |
Monthly Housing Cost Tiers in Wabaunsee County
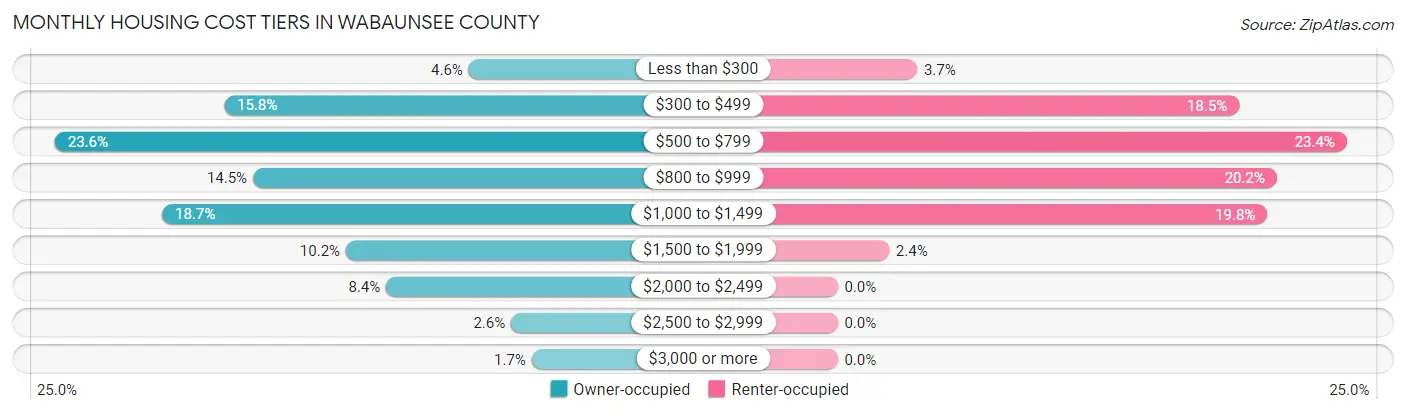
| Monthly Cost | Owner-occupied | Renter-occupied |
| Less than $300 | 96 (4.6%) | 17 (3.7%) |
| $300 to $499 | 333 (15.8%) | 86 (18.5%) |
| $500 to $799 | 497 (23.6%) | 109 (23.4%) |
| $800 to $999 | 305 (14.5%) | 94 (20.2%) |
| $1,000 to $1,499 | 393 (18.7%) | 92 (19.8%) |
| $1,500 to $1,999 | 215 (10.2%) | 11 (2.4%) |
| $2,000 to $2,499 | 176 (8.4%) | 0 (0.0%) |
| $2,500 to $2,999 | 55 (2.6%) | 0 (0.0%) |
| $3,000 or more | 35 (1.7%) | 0 (0.0%) |
| Total | 2,105 (100.0%) | 465 (100.0%) |
Physical Housing Characteristics in Wabaunsee County
Housing Structures in Wabaunsee County
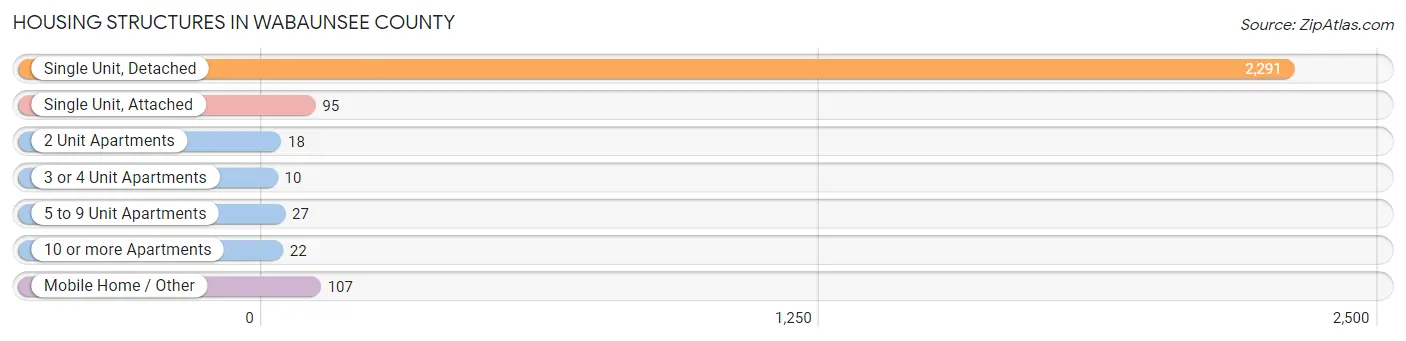
| Structure Type | # Housing Units | % Housing Units |
| Single Unit, Detached | 2,291 | 89.1% |
| Single Unit, Attached | 95 | 3.7% |
| 2 Unit Apartments | 18 | 0.7% |
| 3 or 4 Unit Apartments | 10 | 0.4% |
| 5 to 9 Unit Apartments | 27 | 1.1% |
| 10 or more Apartments | 22 | 0.9% |
| Mobile Home / Other | 107 | 4.2% |
| Total | 2,570 | 100.0% |
Housing Structures by Occupancy in Wabaunsee County
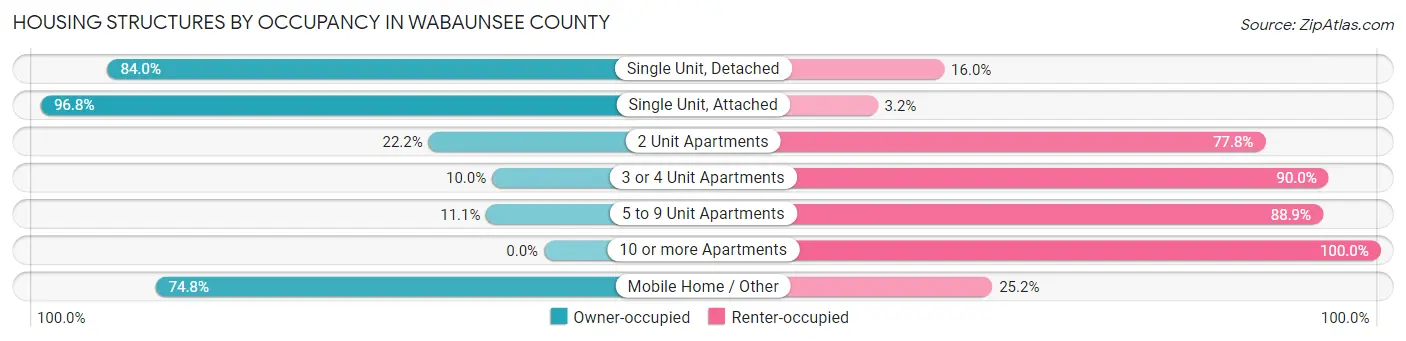
| Structure Type | Owner-occupied | Renter-occupied |
| Single Unit, Detached | 1,925 (84.0%) | 366 (16.0%) |
| Single Unit, Attached | 92 (96.8%) | 3 (3.2%) |
| 2 Unit Apartments | 4 (22.2%) | 14 (77.8%) |
| 3 or 4 Unit Apartments | 1 (10.0%) | 9 (90.0%) |
| 5 to 9 Unit Apartments | 3 (11.1%) | 24 (88.9%) |
| 10 or more Apartments | 0 (0.0%) | 22 (100.0%) |
| Mobile Home / Other | 80 (74.8%) | 27 (25.2%) |
| Total | 2,105 (81.9%) | 465 (18.1%) |
Housing Structures by Number of Rooms in Wabaunsee County
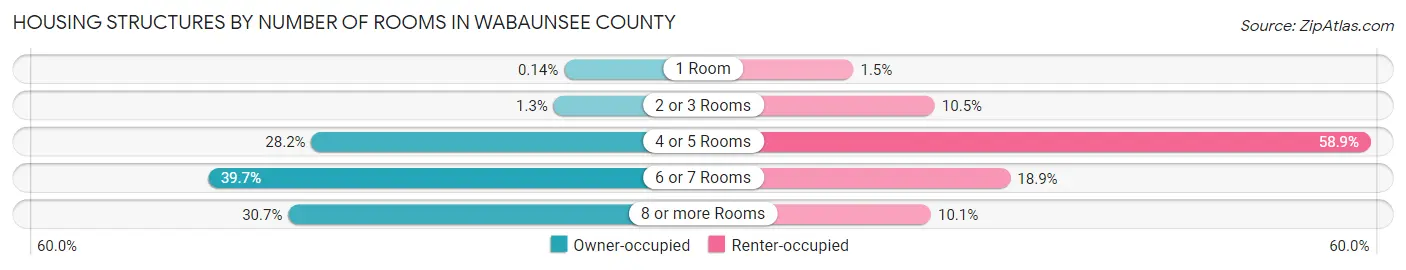
| Number of Rooms | Owner-occupied | Renter-occupied |
| 1 Room | 3 (0.1%) | 7 (1.5%) |
| 2 or 3 Rooms | 27 (1.3%) | 49 (10.5%) |
| 4 or 5 Rooms | 593 (28.2%) | 274 (58.9%) |
| 6 or 7 Rooms | 835 (39.7%) | 88 (18.9%) |
| 8 or more Rooms | 647 (30.7%) | 47 (10.1%) |
| Total | 2,105 (100.0%) | 465 (100.0%) |
Housing Structure by Heating Type in Wabaunsee County
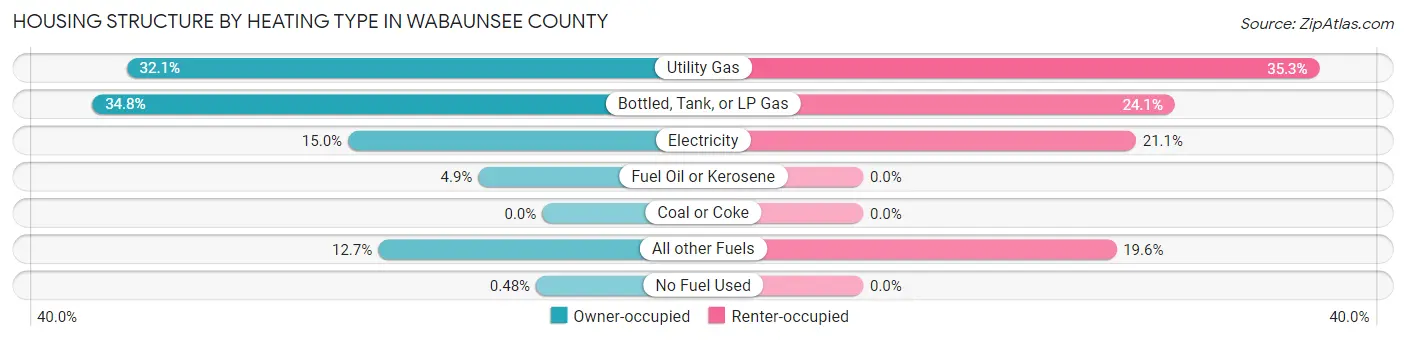
| Heating Type | Owner-occupied | Renter-occupied |
| Utility Gas | 676 (32.1%) | 164 (35.3%) |
| Bottled, Tank, or LP Gas | 732 (34.8%) | 112 (24.1%) |
| Electricity | 316 (15.0%) | 98 (21.1%) |
| Fuel Oil or Kerosene | 104 (4.9%) | 0 (0.0%) |
| Coal or Coke | 0 (0.0%) | 0 (0.0%) |
| All other Fuels | 267 (12.7%) | 91 (19.6%) |
| No Fuel Used | 10 (0.5%) | 0 (0.0%) |
| Total | 2,105 (100.0%) | 465 (100.0%) |
Household Vehicle Usage in Wabaunsee County
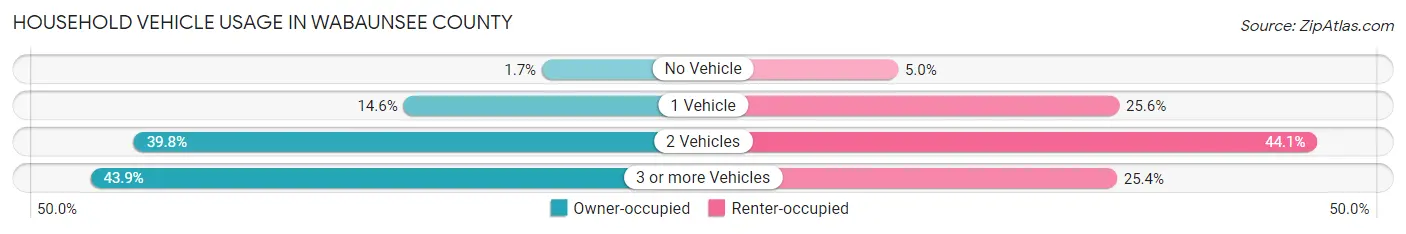
| Vehicles per Household | Owner-occupied | Renter-occupied |
| No Vehicle | 36 (1.7%) | 23 (5.0%) |
| 1 Vehicle | 308 (14.6%) | 119 (25.6%) |
| 2 Vehicles | 838 (39.8%) | 205 (44.1%) |
| 3 or more Vehicles | 923 (43.9%) | 118 (25.4%) |
| Total | 2,105 (100.0%) | 465 (100.0%) |
Real Estate & Mortgages in Wabaunsee County
Real Estate and Mortgage Overview in Wabaunsee County
| Characteristic | Without Mortgage | With Mortgage |
| Housing Units | 1,048 | 1,057 |
| Median Property Value | $158,900 | $180,500 |
| Median Household Income | $70,714 | $168 |
| Monthly Housing Costs | $565 | $28 |
| Real Estate Taxes | $2,098 | $23 |
Property Value by Mortgage Status in Wabaunsee County
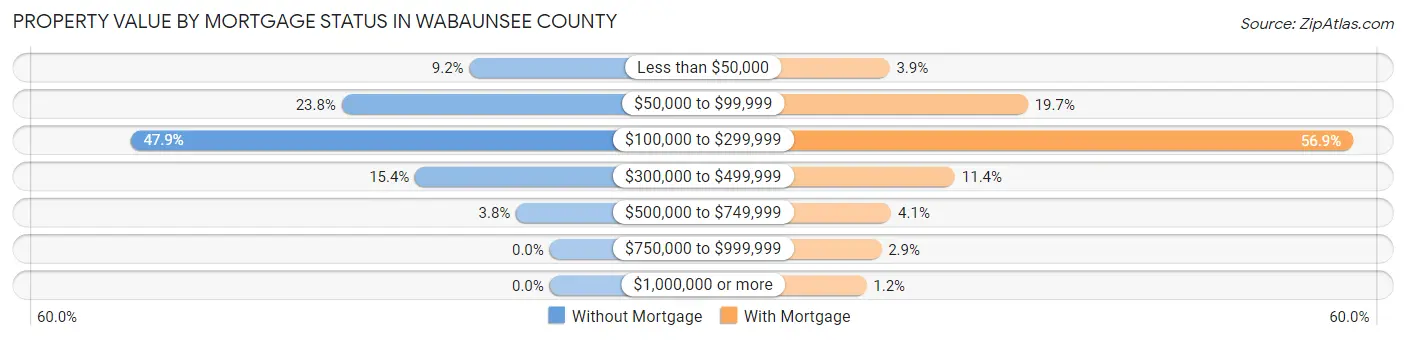
| Property Value | Without Mortgage | With Mortgage |
| Less than $50,000 | 96 (9.2%) | 41 (3.9%) |
| $50,000 to $99,999 | 249 (23.8%) | 208 (19.7%) |
| $100,000 to $299,999 | 502 (47.9%) | 601 (56.9%) |
| $300,000 to $499,999 | 161 (15.4%) | 120 (11.4%) |
| $500,000 to $749,999 | 40 (3.8%) | 43 (4.1%) |
| $750,000 to $999,999 | 0 (0.0%) | 31 (2.9%) |
| $1,000,000 or more | 0 (0.0%) | 13 (1.2%) |
| Total | 1,048 (100.0%) | 1,057 (100.0%) |
Household Income by Mortgage Status in Wabaunsee County
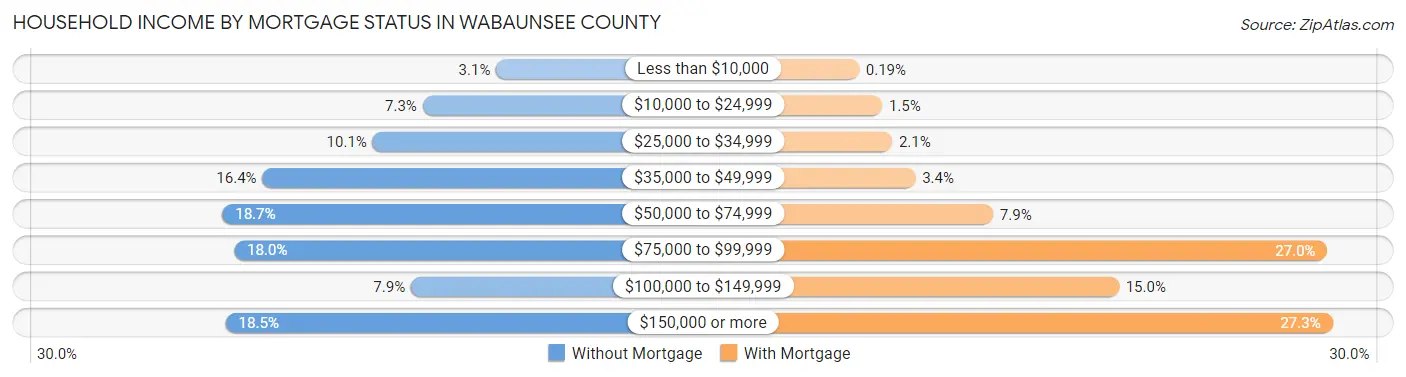
| Household Income | Without Mortgage | With Mortgage |
| Less than $10,000 | 32 (3.0%) | 2 (0.2%) |
| $10,000 to $24,999 | 76 (7.2%) | 16 (1.5%) |
| $25,000 to $34,999 | 106 (10.1%) | 22 (2.1%) |
| $35,000 to $49,999 | 172 (16.4%) | 36 (3.4%) |
| $50,000 to $74,999 | 196 (18.7%) | 83 (7.9%) |
| $75,000 to $99,999 | 189 (18.0%) | 285 (27.0%) |
| $100,000 to $149,999 | 83 (7.9%) | 159 (15.0%) |
| $150,000 or more | 194 (18.5%) | 288 (27.3%) |
| Total | 1,048 (100.0%) | 1,057 (100.0%) |
Property Value to Household Income Ratio in Wabaunsee County
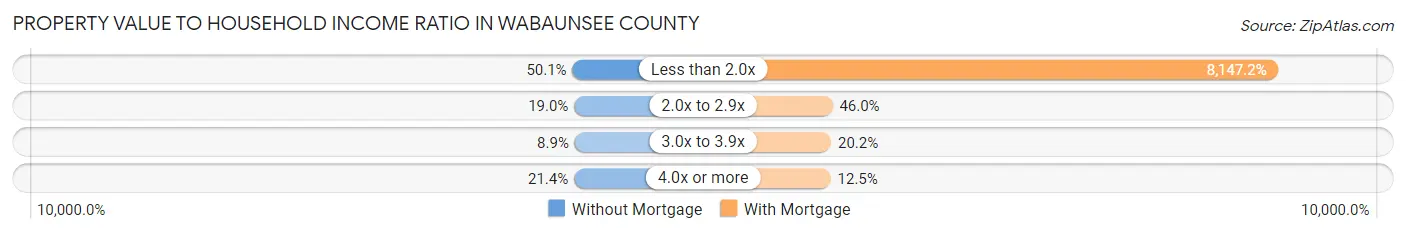
| Value-to-Income Ratio | Without Mortgage | With Mortgage |
| Less than 2.0x | 525 (50.1%) | 86,116 (8,147.2%) |
| 2.0x to 2.9x | 199 (19.0%) | 486 (46.0%) |
| 3.0x to 3.9x | 93 (8.9%) | 213 (20.2%) |
| 4.0x or more | 224 (21.4%) | 132 (12.5%) |
| Total | 1,048 (100.0%) | 1,057 (100.0%) |
Real Estate Taxes by Mortgage Status in Wabaunsee County

| Property Taxes | Without Mortgage | With Mortgage |
| Less than $800 | 123 (11.7%) | 1 (0.1%) |
| $800 to $1,499 | 205 (19.6%) | 81 (7.7%) |
| $800 to $1,499 | 694 (66.2%) | 182 (17.2%) |
| Total | 1,048 (100.0%) | 1,057 (100.0%) |
Health & Disability in Wabaunsee County
Health Insurance Coverage by Age in Wabaunsee County
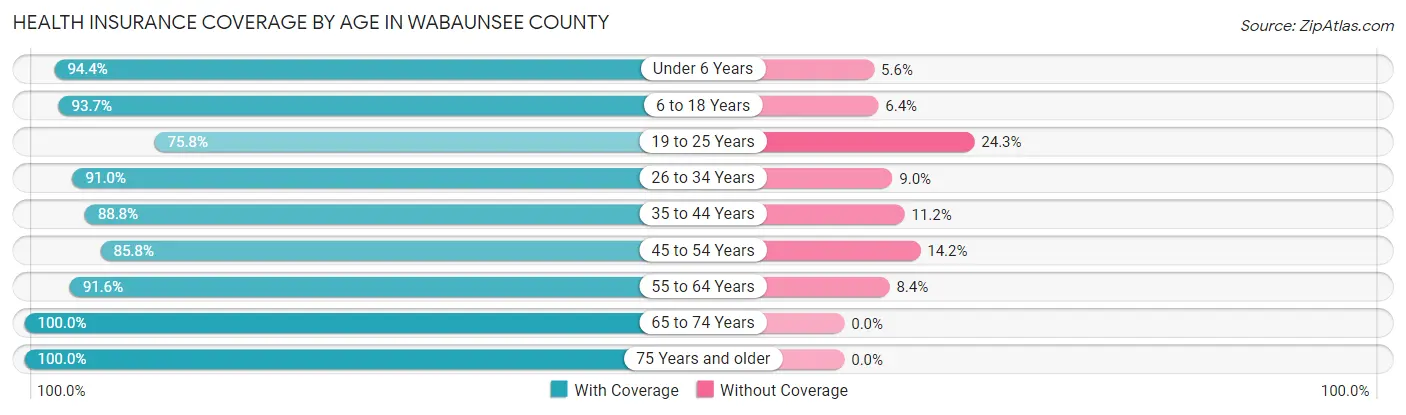
| Age Bracket | With Coverage | Without Coverage |
| Under 6 Years | 424 (94.4%) | 25 (5.6%) |
| 6 to 18 Years | 1,194 (93.6%) | 81 (6.4%) |
| 19 to 25 Years | 328 (75.7%) | 105 (24.2%) |
| 26 to 34 Years | 579 (91.0%) | 57 (9.0%) |
| 35 to 44 Years | 663 (88.8%) | 84 (11.2%) |
| 45 to 54 Years | 660 (85.8%) | 109 (14.2%) |
| 55 to 64 Years | 1,010 (91.6%) | 93 (8.4%) |
| 65 to 74 Years | 840 (100.0%) | 0 (0.0%) |
| 75 Years and older | 562 (100.0%) | 0 (0.0%) |
| Total | 6,260 (91.9%) | 554 (8.1%) |
Health Insurance Coverage by Citizenship Status in Wabaunsee County
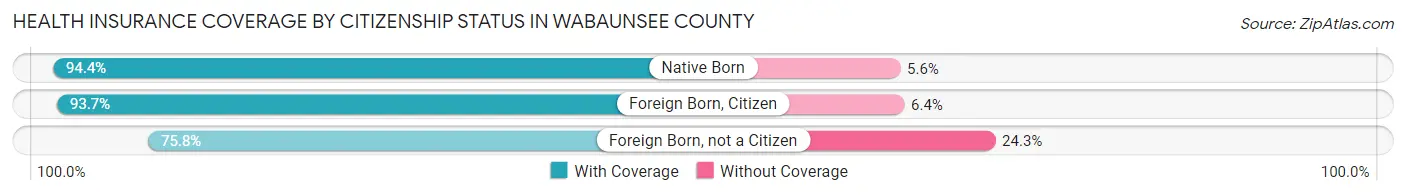
| Citizenship Status | With Coverage | Without Coverage |
| Native Born | 424 (94.4%) | 25 (5.6%) |
| Foreign Born, Citizen | 1,194 (93.6%) | 81 (6.4%) |
| Foreign Born, not a Citizen | 328 (75.7%) | 105 (24.2%) |
Health Insurance Coverage by Household Income in Wabaunsee County
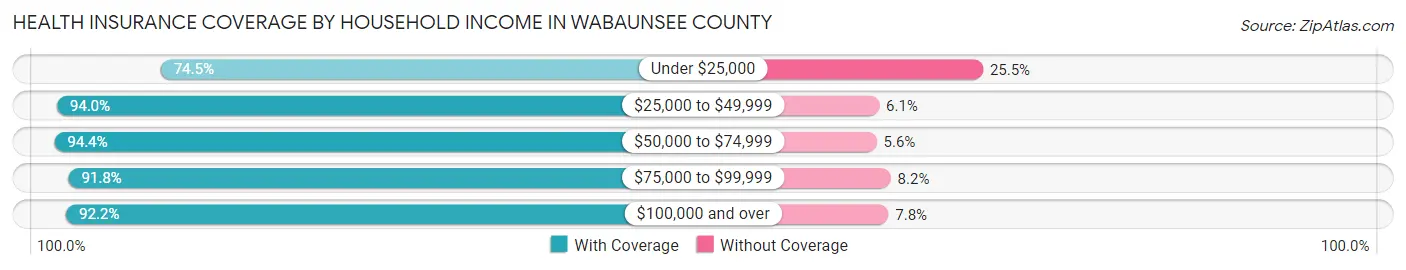
| Household Income | With Coverage | Without Coverage |
| Under $25,000 | 295 (74.5%) | 101 (25.5%) |
| $25,000 to $49,999 | 854 (94.0%) | 55 (6.0%) |
| $50,000 to $74,999 | 1,522 (94.4%) | 90 (5.6%) |
| $75,000 to $99,999 | 1,318 (91.8%) | 118 (8.2%) |
| $100,000 and over | 2,253 (92.2%) | 190 (7.8%) |
Public vs Private Health Insurance Coverage by Age in Wabaunsee County
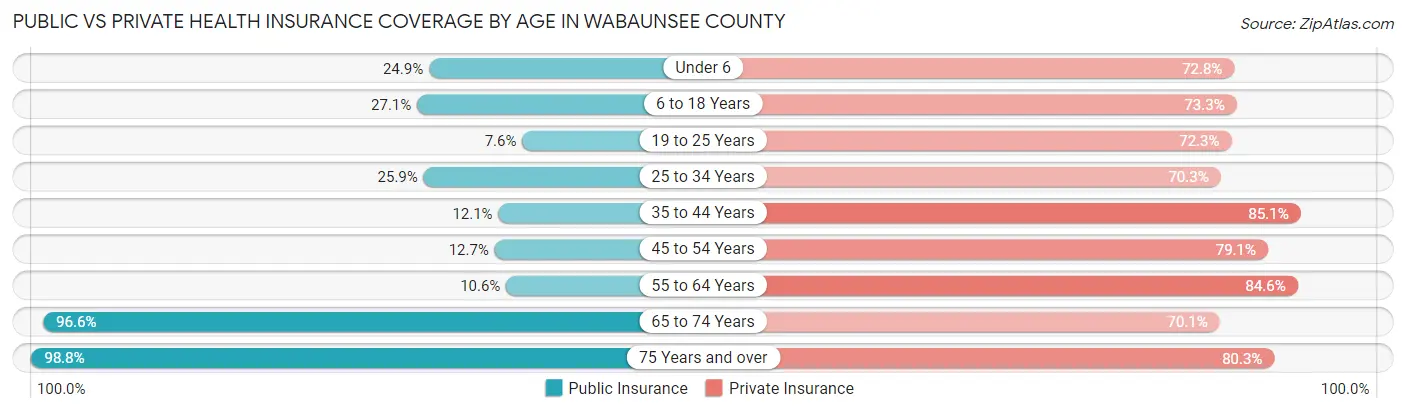
| Age Bracket | Public Insurance | Private Insurance |
| Under 6 | 112 (24.9%) | 327 (72.8%) |
| 6 to 18 Years | 346 (27.1%) | 934 (73.3%) |
| 19 to 25 Years | 33 (7.6%) | 313 (72.3%) |
| 25 to 34 Years | 165 (25.9%) | 447 (70.3%) |
| 35 to 44 Years | 90 (12.0%) | 636 (85.1%) |
| 45 to 54 Years | 98 (12.7%) | 608 (79.1%) |
| 55 to 64 Years | 117 (10.6%) | 933 (84.6%) |
| 65 to 74 Years | 811 (96.6%) | 589 (70.1%) |
| 75 Years and over | 555 (98.8%) | 451 (80.2%) |
| Total | 2,327 (34.2%) | 5,238 (76.9%) |
Disability Status by Sex by Age in Wabaunsee County
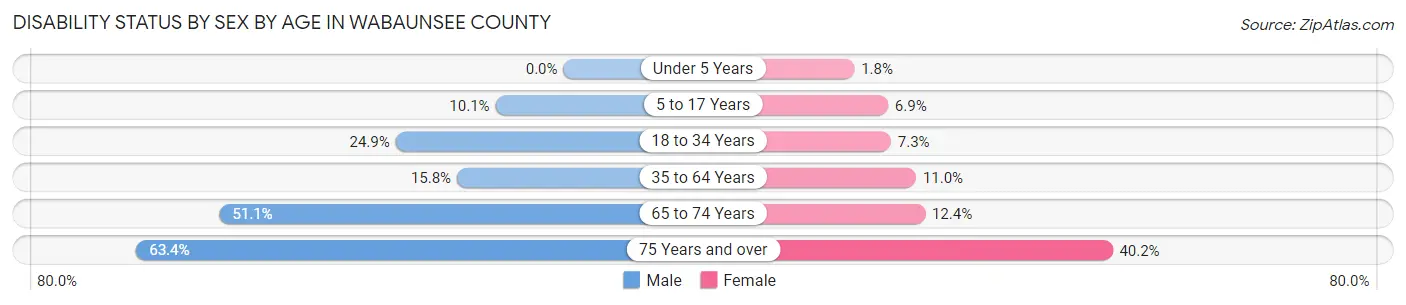
| Age Bracket | Male | Female |
| Under 5 Years | 0 (0.0%) | 3 (1.8%) |
| 5 to 17 Years | 65 (10.1%) | 40 (6.9%) |
| 18 to 34 Years | 149 (24.9%) | 43 (7.3%) |
| 35 to 64 Years | 213 (15.8%) | 140 (11.0%) |
| 65 to 74 Years | 214 (51.1%) | 52 (12.3%) |
| 75 Years and over | 156 (63.4%) | 127 (40.2%) |
Disability Class by Sex by Age in Wabaunsee County
Disability Class: Hearing Difficulty
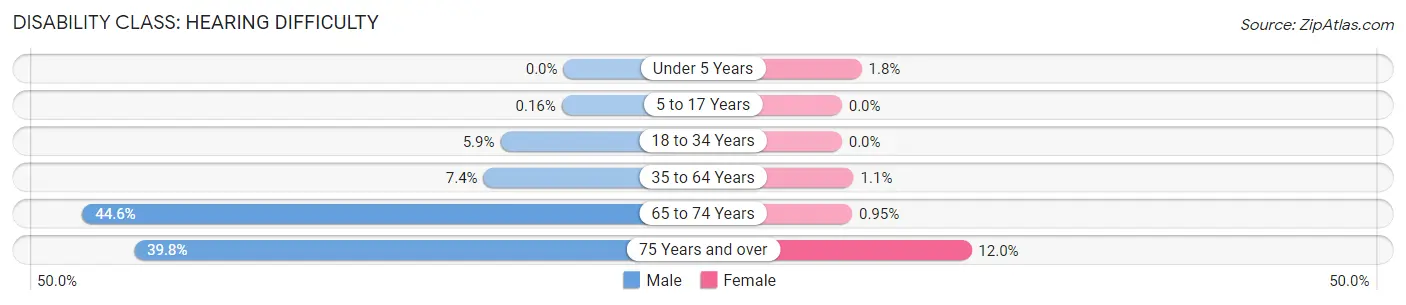
| Age Bracket | Male | Female |
| Under 5 Years | 0 (0.0%) | 3 (1.8%) |
| 5 to 17 Years | 1 (0.2%) | 0 (0.0%) |
| 18 to 34 Years | 35 (5.9%) | 0 (0.0%) |
| 35 to 64 Years | 100 (7.4%) | 14 (1.1%) |
| 65 to 74 Years | 187 (44.6%) | 4 (0.9%) |
| 75 Years and over | 98 (39.8%) | 38 (12.0%) |
Disability Class: Vision Difficulty
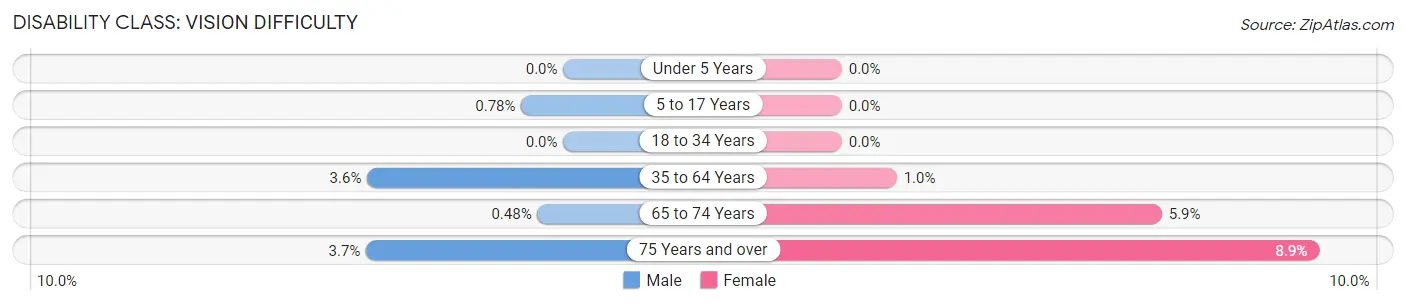
| Age Bracket | Male | Female |
| Under 5 Years | 0 (0.0%) | 0 (0.0%) |
| 5 to 17 Years | 5 (0.8%) | 0 (0.0%) |
| 18 to 34 Years | 0 (0.0%) | 0 (0.0%) |
| 35 to 64 Years | 49 (3.6%) | 13 (1.0%) |
| 65 to 74 Years | 2 (0.5%) | 25 (5.9%) |
| 75 Years and over | 9 (3.7%) | 28 (8.9%) |
Disability Class: Cognitive Difficulty
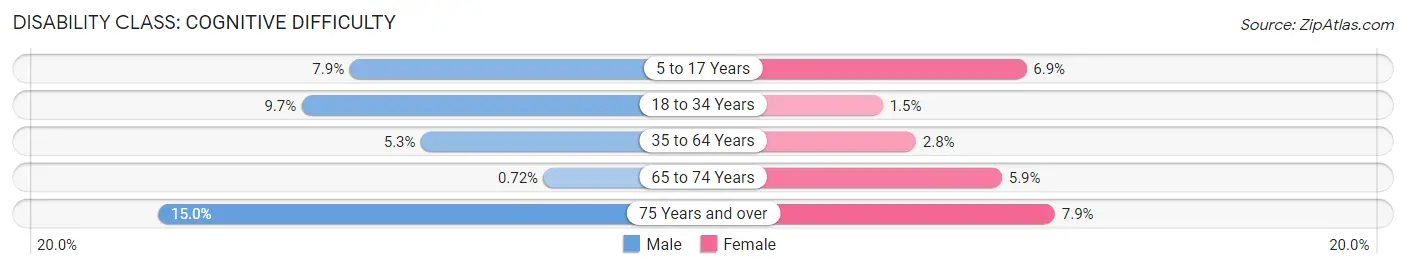
| Age Bracket | Male | Female |
| 5 to 17 Years | 51 (7.9%) | 40 (6.9%) |
| 18 to 34 Years | 58 (9.7%) | 9 (1.5%) |
| 35 to 64 Years | 71 (5.3%) | 35 (2.8%) |
| 65 to 74 Years | 3 (0.7%) | 25 (5.9%) |
| 75 Years and over | 37 (15.0%) | 25 (7.9%) |
Disability Class: Ambulatory Difficulty
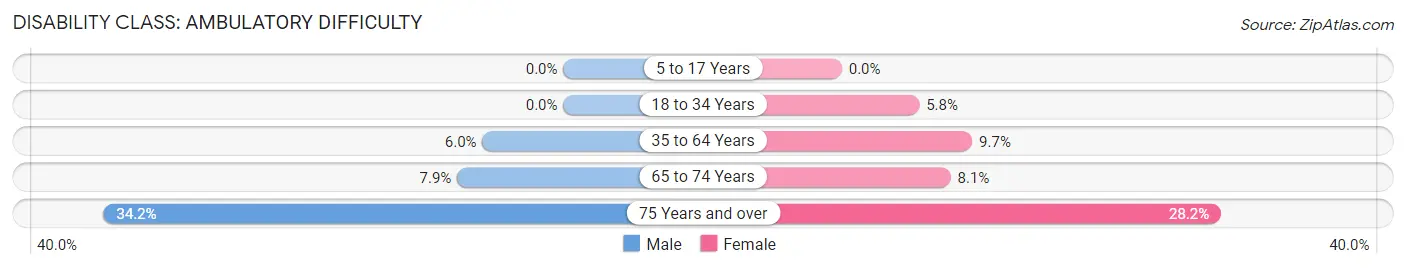
| Age Bracket | Male | Female |
| 5 to 17 Years | 0 (0.0%) | 0 (0.0%) |
| 18 to 34 Years | 0 (0.0%) | 34 (5.8%) |
| 35 to 64 Years | 81 (6.0%) | 123 (9.7%) |
| 65 to 74 Years | 33 (7.9%) | 34 (8.1%) |
| 75 Years and over | 84 (34.2%) | 89 (28.2%) |
Disability Class: Self-Care Difficulty
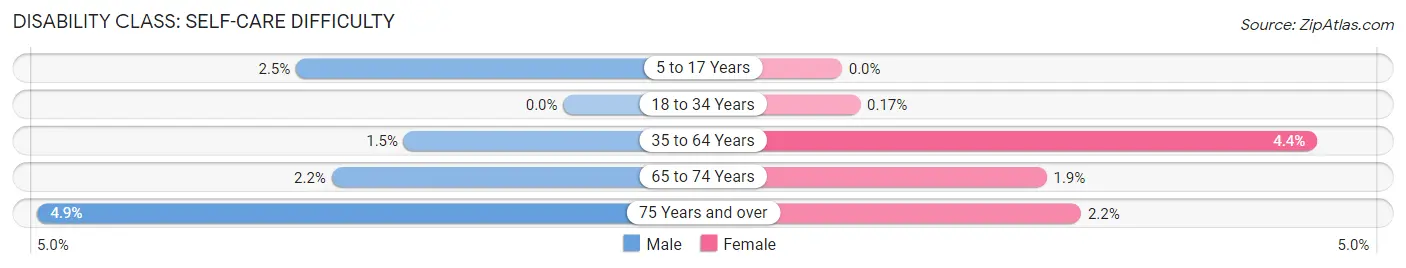
| Age Bracket | Male | Female |
| 5 to 17 Years | 16 (2.5%) | 0 (0.0%) |
| 18 to 34 Years | 0 (0.0%) | 1 (0.2%) |
| 35 to 64 Years | 20 (1.5%) | 56 (4.4%) |
| 65 to 74 Years | 9 (2.1%) | 8 (1.9%) |
| 75 Years and over | 12 (4.9%) | 7 (2.2%) |
Technology Access in Wabaunsee County
Computing Device Access in Wabaunsee County
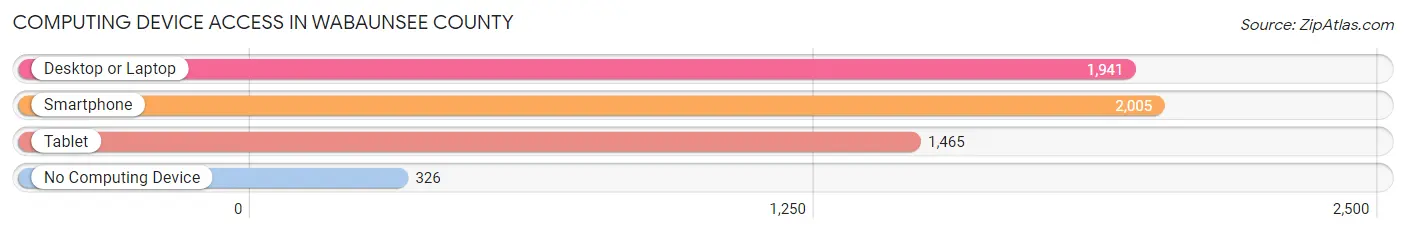
| Device Type | # Households | % Households |
| Desktop or Laptop | 1,941 | 75.5% |
| Smartphone | 2,005 | 78.0% |
| Tablet | 1,465 | 57.0% |
| No Computing Device | 326 | 12.7% |
| Total | 2,570 | 100.0% |
Internet Access in Wabaunsee County
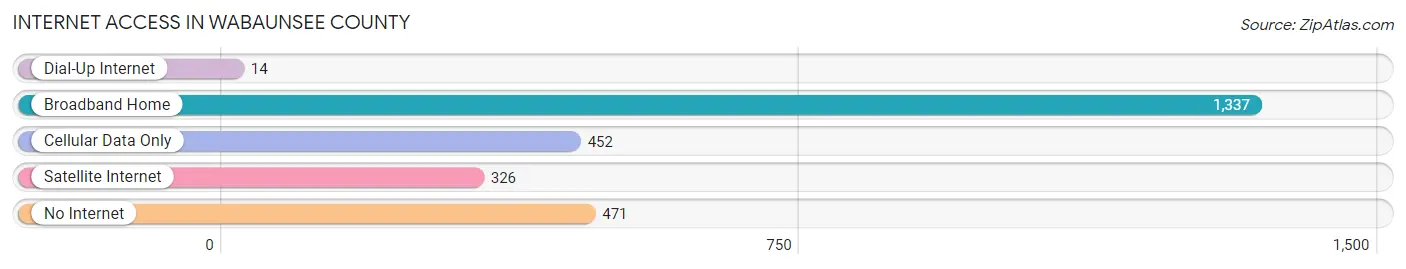
| Internet Type | # Households | % Households |
| Dial-Up Internet | 14 | 0.5% |
| Broadband Home | 1,337 | 52.0% |
| Cellular Data Only | 452 | 17.6% |
| Satellite Internet | 326 | 12.7% |
| No Internet | 471 | 18.3% |
| Total | 2,570 | 100.0% |
Wabaunsee County Summary
Wabaunsee County is located in east-central Kansas, and is part of the Flint Hills region. It is bordered by Pottawatomie County to the north, Riley County to the east, Geary County to the south, and Wabaunsee County to the west. The county seat is Alma, and the largest city is Eskridge. The county was named after the Wabaunsee Indians, who were a band of the Kansa tribe.
Geography
Wabaunsee County covers an area of 576 square miles, and is located in the Flint Hills region of Kansas. The county is mostly rolling hills, with some flat areas in the north and south. The county is drained by the Kansas River, which flows through the northern part of the county. The county is also home to several small lakes, including Lake Wabaunsee, which is located in the northern part of the county.
The climate of Wabaunsee County is characterized by hot, humid summers and cold, dry winters. The average annual temperature is around 54°F, and the average annual precipitation is around 33 inches.
Demographics
As of the 2010 census, Wabaunsee County had a population of 7,053. The racial makeup of the county was 95.3% White, 0.7% African American, 0.5% Native American, 0.3% Asian, 0.1% Pacific Islander, 1.7% from other races, and 1.3% from two or more races. Hispanic or Latino of any race were 3.2% of the population.
The median income for a household in the county was $45,938, and the median income for a family was $53,958. The per capita income for the county was $21,945. About 8.2% of families and 10.7% of the population were below the poverty line, including 14.2% of those under age 18 and 8.2% of those age 65 or over.
Economy
Wabaunsee County is largely agricultural, with the majority of the land being used for farming and ranching. The county is home to several large farms, including the Wabaunsee County Farm Bureau, which is the largest farm in the county. The county is also home to several small businesses, including a number of restaurants, retail stores, and service providers.
The county is also home to several manufacturing companies, including the Wabaunsee County Manufacturing Company, which produces a variety of products, including furniture, clothing, and automotive parts. The county is also home to several energy companies, including the Wabaunsee County Wind Farm, which produces electricity from wind turbines.
The county is served by the Wabaunsee County Airport, which provides air service to the county and surrounding areas. The county is also served by several highways, including Interstate 70, which runs through the county.
Conclusion
Wabaunsee County is a rural county located in east-central Kansas. The county is largely agricultural, with the majority of the land being used for farming and ranching. The county is also home to several small businesses, manufacturing companies, and energy companies. The county is served by the Wabaunsee County Airport, and is connected to the rest of the state by several highways, including Interstate 70. The county has a population of 7,053, and the median income for a household in the county is $45,938.
Common Questions
What is Per Capita Income in Wabaunsee County?
Per Capita income in Wabaunsee County is $34,243.
What is the Median Family Income in Wabaunsee County?
Median Family Income in Wabaunsee County is $84,776.
What is the Median Household income in Wabaunsee County?
Median Household Income in Wabaunsee County is $70,000.
What is Income or Wage Gap in Wabaunsee County?
Income or Wage Gap in Wabaunsee County is 21.4%.
Women in Wabaunsee County earn 78.6 cents for every dollar earned by a man.
What is Family Income Deficit in Wabaunsee County?
Family Income Deficit in Wabaunsee County is $10,443.
Families that are below poverty line in Wabaunsee County earn $10,443 less on average than the poverty threshold level.
What is Inequality or Gini Index in Wabaunsee County?
Inequality or Gini Index in Wabaunsee County is 0.39.
What is the Total Population of Wabaunsee County?
Total Population of Wabaunsee County is 6,922.
What is the Total Male Population of Wabaunsee County?
Total Male Population of Wabaunsee County is 3,527.
What is the Total Female Population of Wabaunsee County?
Total Female Population of Wabaunsee County is 3,395.
What is the Ratio of Males per 100 Females in Wabaunsee County?
There are 103.89 Males per 100 Females in Wabaunsee County.
What is the Ratio of Females per 100 Males in Wabaunsee County?
There are 96.26 Females per 100 Males in Wabaunsee County.
What is the Median Population Age in Wabaunsee County?
Median Population Age in Wabaunsee County is 43.7 Years.
What is the Average Family Size in Wabaunsee County
Average Family Size in Wabaunsee County is 3.3 People.
What is the Average Household Size in Wabaunsee County
Average Household Size in Wabaunsee County is 2.6 People.
How Large is the Labor Force in Wabaunsee County?
There are 3,406 People in the Labor Forcein in Wabaunsee County.
What is the Percentage of People in the Labor Force in Wabaunsee County?
61.6% of People are in the Labor Force in Wabaunsee County.
What is the Unemployment Rate in Wabaunsee County?
Unemployment Rate in Wabaunsee County is 3.0%.