Trego County, KS Map & Demographics
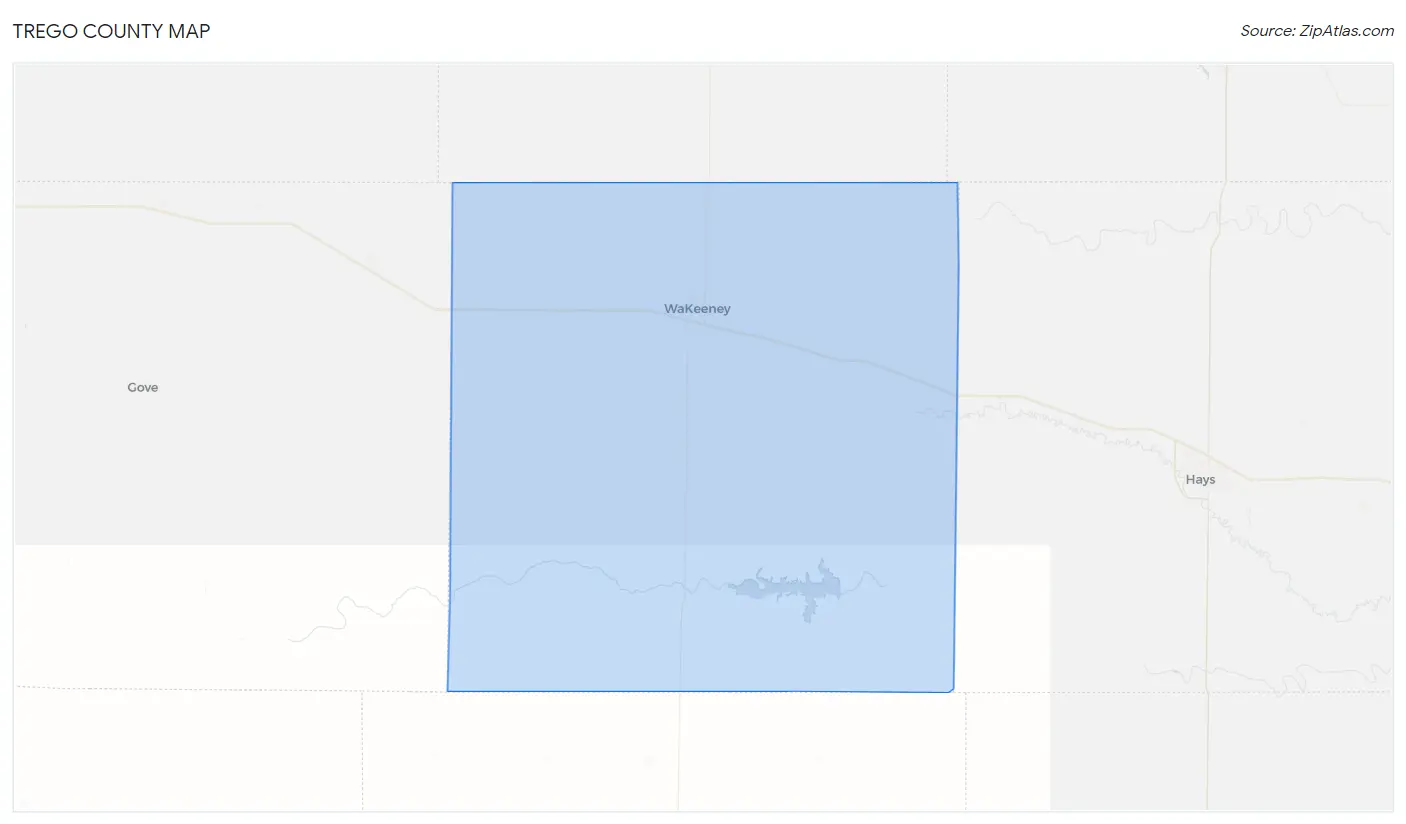
Trego County Map
Trego County Overview
$42,029
PER CAPITA INCOME
$89,593
AVG FAMILY INCOME
$77,500
AVG HOUSEHOLD INCOME
33.1%
WAGE / INCOME GAP [ % ]
66.9¢/ $1
WAGE / INCOME GAP [ $ ]
0.42
INEQUALITY / GINI INDEX
2,798
TOTAL POPULATION
1,410
MALE POPULATION
1,388
FEMALE POPULATION
101.59
MALES / 100 FEMALES
98.44
FEMALES / 100 MALES
47.8
MEDIAN AGE
2.5
AVG FAMILY SIZE
2.1
AVG HOUSEHOLD SIZE
1,448
LABOR FORCE [ PEOPLE ]
62.5%
PERCENT IN LABOR FORCE
2.6%
UNEMPLOYMENT RATE
Trego County Area Codes
Income in Trego County
Income Overview in Trego County
Per Capita Income in Trego County is $42,029, while median incomes of families and households are $89,593 and $77,500 respectively.
| Characteristic | Number | Measure |
| Per Capita Income | 2,798 | $42,029 |
| Median Family Income | 888 | $89,593 |
| Mean Family Income | 888 | $110,192 |
| Median Household Income | 1,308 | $77,500 |
| Mean Household Income | 1,308 | $90,516 |
| Income Deficit | 888 | $0 |
| Wage / Income Gap (%) | 2,798 | 33.08% |
| Wage / Income Gap ($) | 2,798 | 66.92¢ per $1 |
| Gini / Inequality Index | 2,798 | 0.42 |
Earnings by Sex in Trego County
Average Earnings in Trego County are $45,134, $53,000 for men and $35,469 for women, a difference of 33.1%.
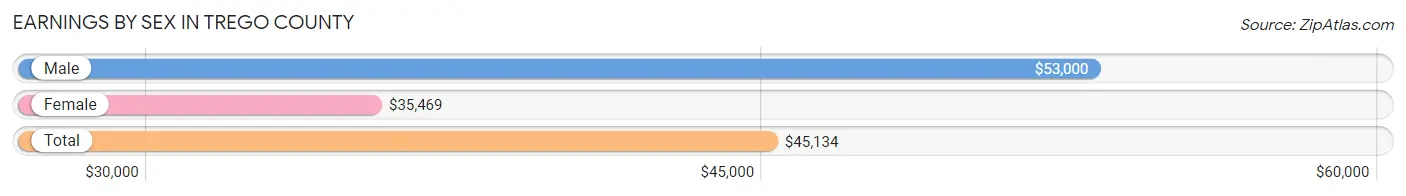
| Sex | Number | Average Earnings |
| Male | 912 (58.8%) | $53,000 |
| Female | 638 (41.2%) | $35,469 |
| Total | 1,550 (100.0%) | $45,134 |
Earnings by Sex by Income Bracket in Trego County
The most common earnings brackets in Trego County are $75,000 to $99,999 for men (198 | 21.7%) and $35,000 to $39,999 for women (72 | 11.3%).
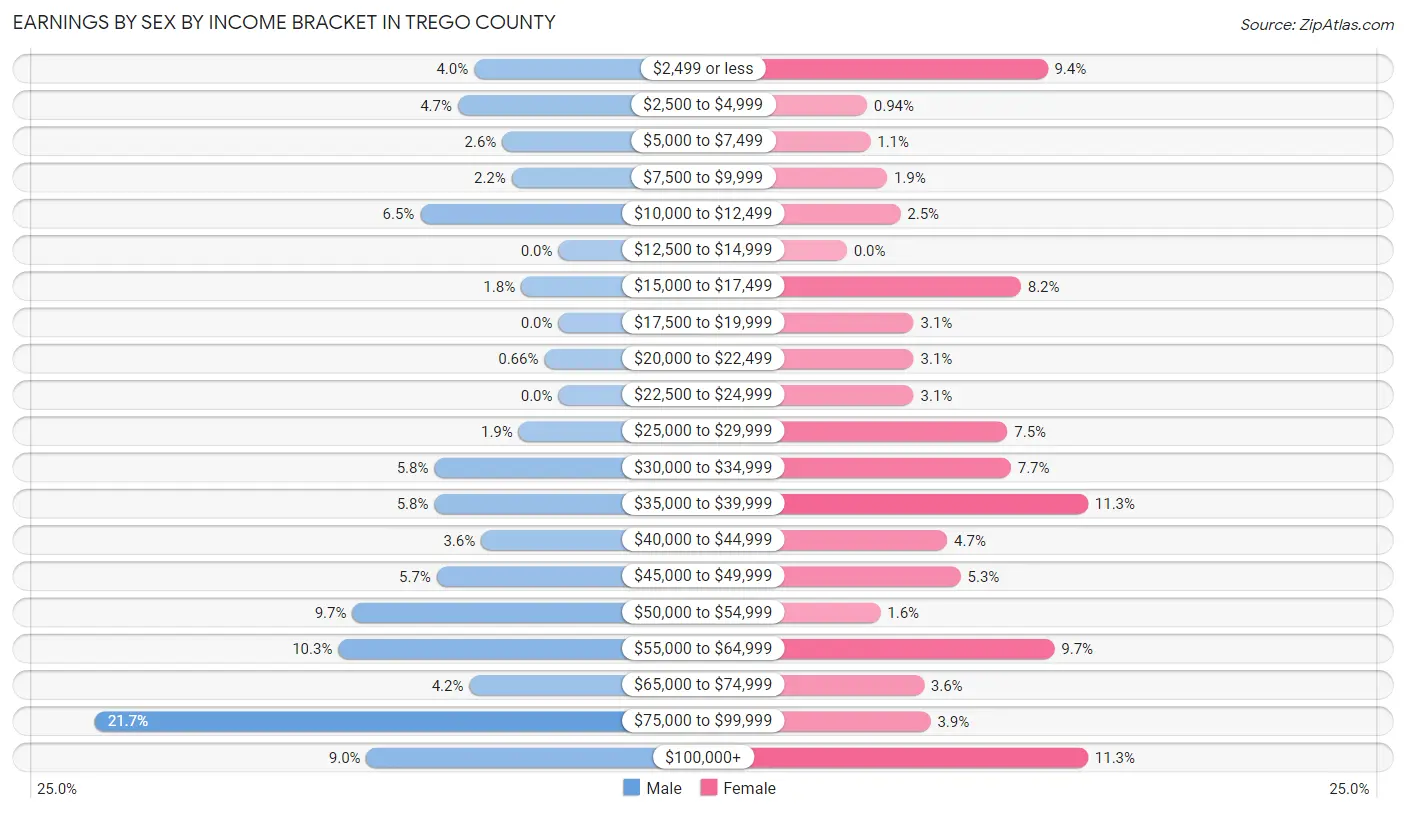
| Income | Male | Female |
| $2,499 or less | 36 (4.0%) | 60 (9.4%) |
| $2,500 to $4,999 | 43 (4.7%) | 6 (0.9%) |
| $5,000 to $7,499 | 24 (2.6%) | 7 (1.1%) |
| $7,500 to $9,999 | 20 (2.2%) | 12 (1.9%) |
| $10,000 to $12,499 | 59 (6.5%) | 16 (2.5%) |
| $12,500 to $14,999 | 0 (0.0%) | 0 (0.0%) |
| $15,000 to $17,499 | 16 (1.8%) | 52 (8.2%) |
| $17,500 to $19,999 | 0 (0.0%) | 20 (3.1%) |
| $20,000 to $22,499 | 6 (0.7%) | 20 (3.1%) |
| $22,500 to $24,999 | 0 (0.0%) | 20 (3.1%) |
| $25,000 to $29,999 | 17 (1.9%) | 48 (7.5%) |
| $30,000 to $34,999 | 53 (5.8%) | 49 (7.7%) |
| $35,000 to $39,999 | 53 (5.8%) | 72 (11.3%) |
| $40,000 to $44,999 | 33 (3.6%) | 30 (4.7%) |
| $45,000 to $49,999 | 52 (5.7%) | 34 (5.3%) |
| $50,000 to $54,999 | 88 (9.7%) | 10 (1.6%) |
| $55,000 to $64,999 | 94 (10.3%) | 62 (9.7%) |
| $65,000 to $74,999 | 38 (4.2%) | 23 (3.6%) |
| $75,000 to $99,999 | 198 (21.7%) | 25 (3.9%) |
| $100,000+ | 82 (9.0%) | 72 (11.3%) |
| Total | 912 (100.0%) | 638 (100.0%) |
Earnings by Sex by Educational Attainment in Trego County
Average earnings in Trego County are $55,223 for men and $36,413 for women, a difference of 34.1%. Men with an educational attainment of college or associate's degree enjoy the highest average annual earnings of $75,871, while those with less than high school education earn the least with $39,135. Women with an educational attainment of college or associate's degree earn the most with the average annual earnings of $38,438, while those with high school diploma education have the smallest earnings of $28,750.
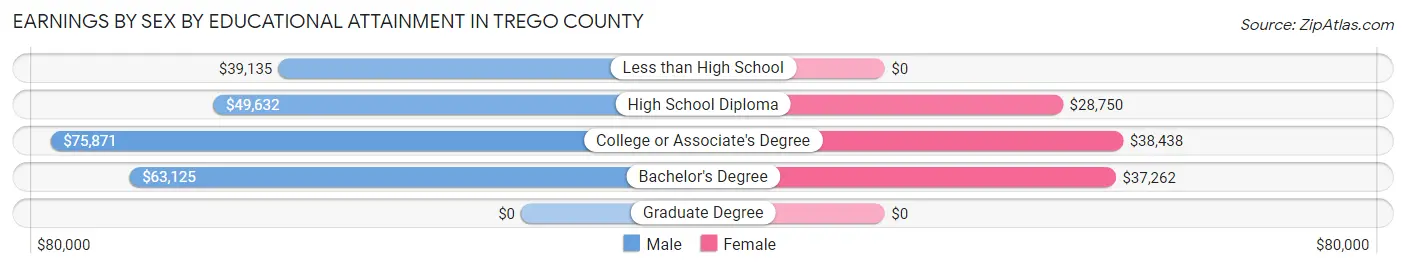
| Educational Attainment | Male Income | Female Income |
| Less than High School | $39,135 | $0 |
| High School Diploma | $49,632 | $28,750 |
| College or Associate's Degree | $75,871 | $38,438 |
| Bachelor's Degree | $63,125 | $37,262 |
| Graduate Degree | - | - |
| Total | $55,223 | $36,413 |
Family Income in Trego County
Family Income Brackets in Trego County
According to the Trego County family income data, there are 258 families falling into the $75,000 to $99,999 income range, which is the most common income bracket and makes up 29.0% of all families. Conversely, the less than $10,000 income bracket is the least frequent group with only 13 families (1.5%) belonging to this category.
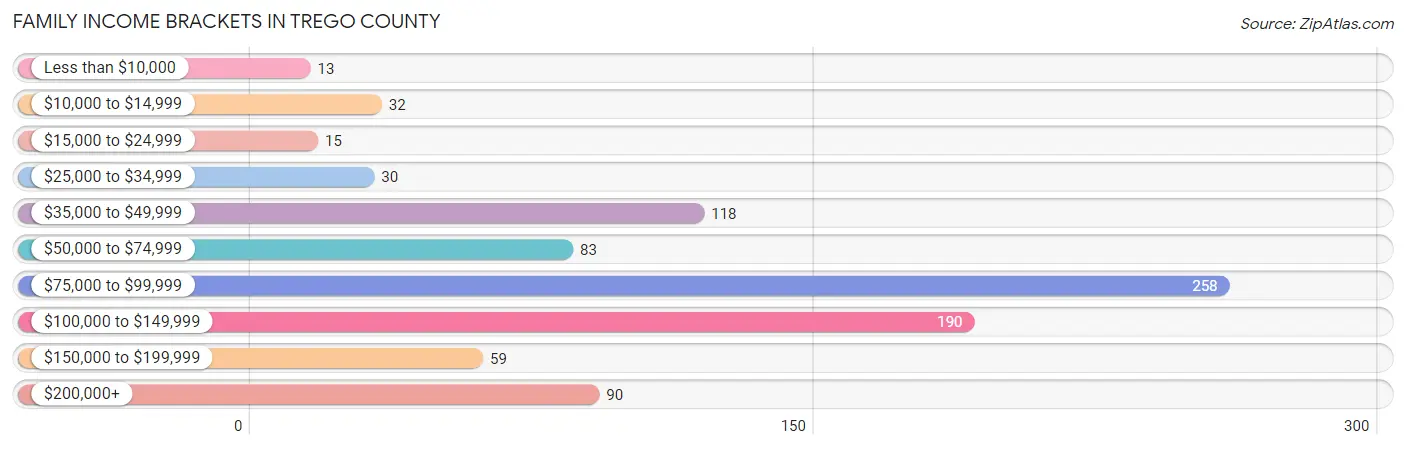
| Income Bracket | # Families | % Families |
| Less than $10,000 | 13 | 1.5% |
| $10,000 to $14,999 | 32 | 3.6% |
| $15,000 to $24,999 | 15 | 1.7% |
| $25,000 to $34,999 | 30 | 3.4% |
| $35,000 to $49,999 | 118 | 13.3% |
| $50,000 to $74,999 | 83 | 9.3% |
| $75,000 to $99,999 | 258 | 29.1% |
| $100,000 to $149,999 | 190 | 21.4% |
| $150,000 to $199,999 | 59 | 6.6% |
| $200,000+ | 90 | 10.1% |
Family Income by Famaliy Size in Trego County
5-person families (111 | 12.5%) account for the highest median family income in Trego County with $250,001 per family, while 5-person families (111 | 12.5%) have the highest median income of $50,000 per family member.
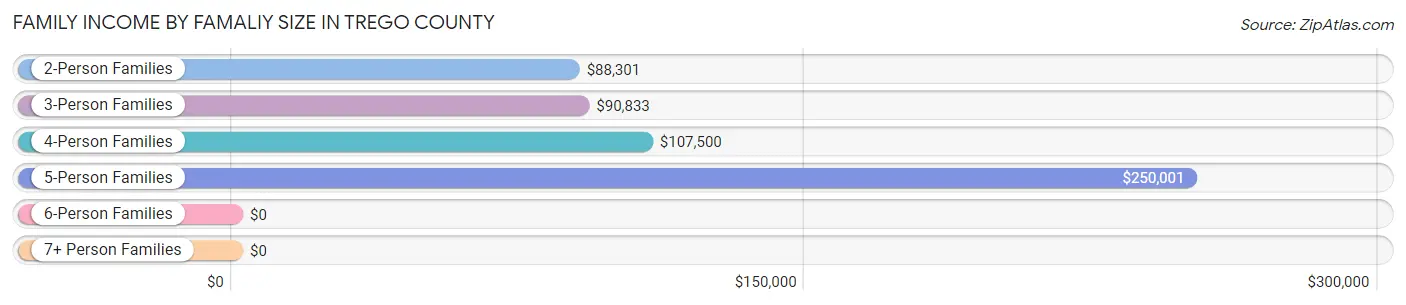
| Income Bracket | # Families | Median Income |
| 2-Person Families | 603 (67.9%) | $88,301 |
| 3-Person Families | 104 (11.7%) | $90,833 |
| 4-Person Families | 60 (6.8%) | $107,500 |
| 5-Person Families | 111 (12.5%) | $250,001 |
| 6-Person Families | 10 (1.1%) | $0 |
| 7+ Person Families | 0 (0.0%) | $0 |
| Total | 888 (100.0%) | $89,593 |
Family Income by Number of Earners in Trego County
The median family income in Trego County is $89,593, with families comprising 3+ earners (86) having the highest median family income of $250,001, while families with 1 earner (206) have the lowest median family income of $53,611, accounting for 9.7% and 23.2% of families, respectively.
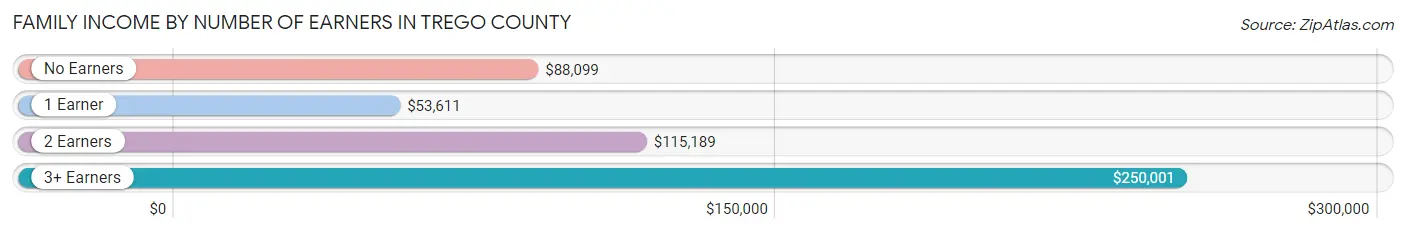
| Number of Earners | # Families | Median Income |
| No Earners | 271 (30.5%) | $88,099 |
| 1 Earner | 206 (23.2%) | $53,611 |
| 2 Earners | 325 (36.6%) | $115,189 |
| 3+ Earners | 86 (9.7%) | $250,001 |
| Total | 888 (100.0%) | $89,593 |
Household Income in Trego County
Household Income Brackets in Trego County
With 268 households falling in the category, the $75,000 to $99,999 income range is the most frequent in Trego County, accounting for 20.5% of all households. In contrast, only 37 households (2.8%) fall into the $10,000 to $14,999 income bracket, making it the least populous group.
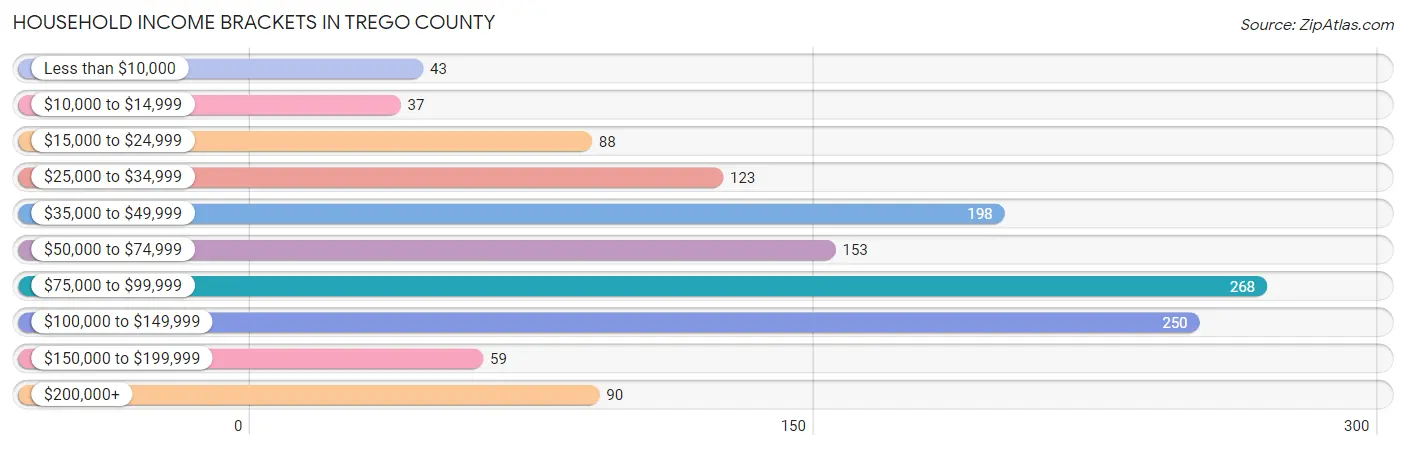
| Income Bracket | # Households | % Households |
| Less than $10,000 | 43 | 3.3% |
| $10,000 to $14,999 | 37 | 2.8% |
| $15,000 to $24,999 | 88 | 6.7% |
| $25,000 to $34,999 | 123 | 9.4% |
| $35,000 to $49,999 | 198 | 15.1% |
| $50,000 to $74,999 | 153 | 11.7% |
| $75,000 to $99,999 | 268 | 20.5% |
| $100,000 to $149,999 | 250 | 19.1% |
| $150,000 to $199,999 | 59 | 4.5% |
| $200,000+ | 90 | 6.9% |
Household Income by Householder Age in Trego County
The median household income in Trego County is $77,500, with the highest median household income of $101,875 found in the 25 to 44 years age bracket for the primary householder. A total of 320 households (24.5%) fall into this category. Meanwhile, the 15 to 24 years age bracket for the primary householder has the lowest median household income of $30,859, with 54 households (4.1%) in this group.
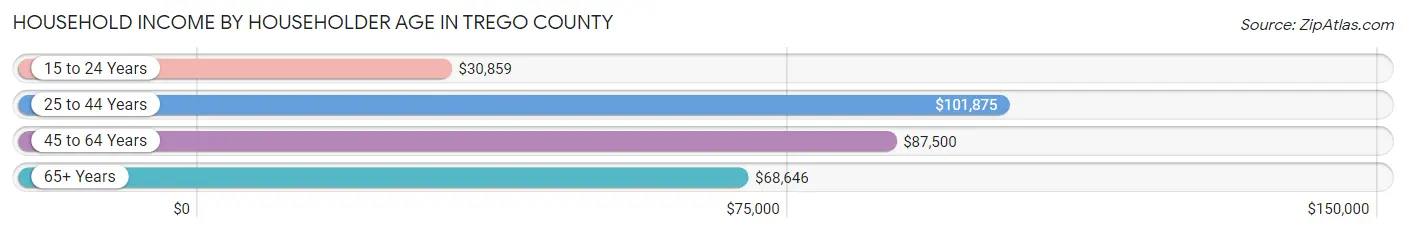
| Income Bracket | # Households | Median Income |
| 15 to 24 Years | 54 (4.1%) | $30,859 |
| 25 to 44 Years | 320 (24.5%) | $101,875 |
| 45 to 64 Years | 452 (34.6%) | $87,500 |
| 65+ Years | 482 (36.8%) | $68,646 |
| Total | 1,308 (100.0%) | $77,500 |
Poverty in Trego County
Income Below Poverty by Sex and Age in Trego County
With 7.3% poverty level for males and 7.3% for females among the residents of Trego County, 18 to 24 year old males and 5 year old females are the most vulnerable to poverty, with 37 males (40.7%) and 4 females (28.6%) in their respective age groups living below the poverty level.
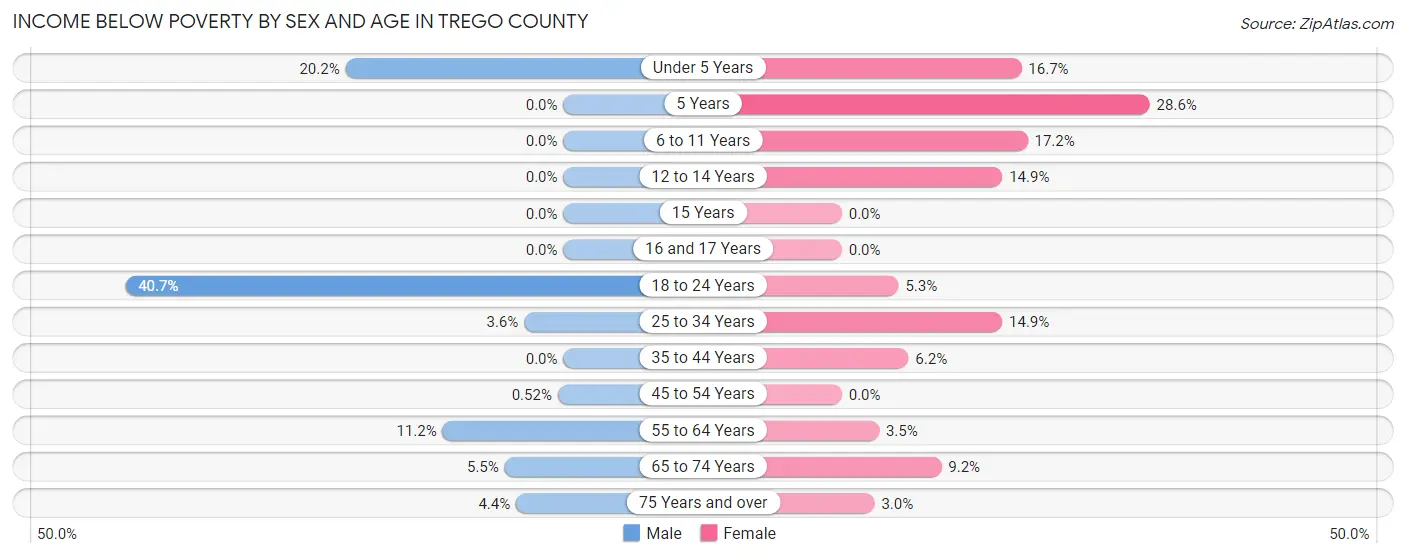
| Age Bracket | Male | Female |
| Under 5 Years | 18 (20.2%) | 9 (16.7%) |
| 5 Years | 0 (0.0%) | 4 (28.6%) |
| 6 to 11 Years | 0 (0.0%) | 5 (17.2%) |
| 12 to 14 Years | 0 (0.0%) | 14 (14.9%) |
| 15 Years | 0 (0.0%) | 0 (0.0%) |
| 16 and 17 Years | 0 (0.0%) | 0 (0.0%) |
| 18 to 24 Years | 37 (40.7%) | 2 (5.3%) |
| 25 to 34 Years | 4 (3.6%) | 18 (14.9%) |
| 35 to 44 Years | 0 (0.0%) | 11 (6.2%) |
| 45 to 54 Years | 1 (0.5%) | 0 (0.0%) |
| 55 to 64 Years | 24 (11.2%) | 8 (3.5%) |
| 65 to 74 Years | 11 (5.4%) | 22 (9.2%) |
| 75 Years and over | 5 (4.4%) | 5 (3.0%) |
| Total | 100 (7.3%) | 98 (7.3%) |
Income Above Poverty by Sex and Age in Trego County
According to the poverty statistics in Trego County, males aged 5 years and females aged 15 years are the age groups that are most secure financially, with 100.0% of males and 100.0% of females in these age groups living above the poverty line.
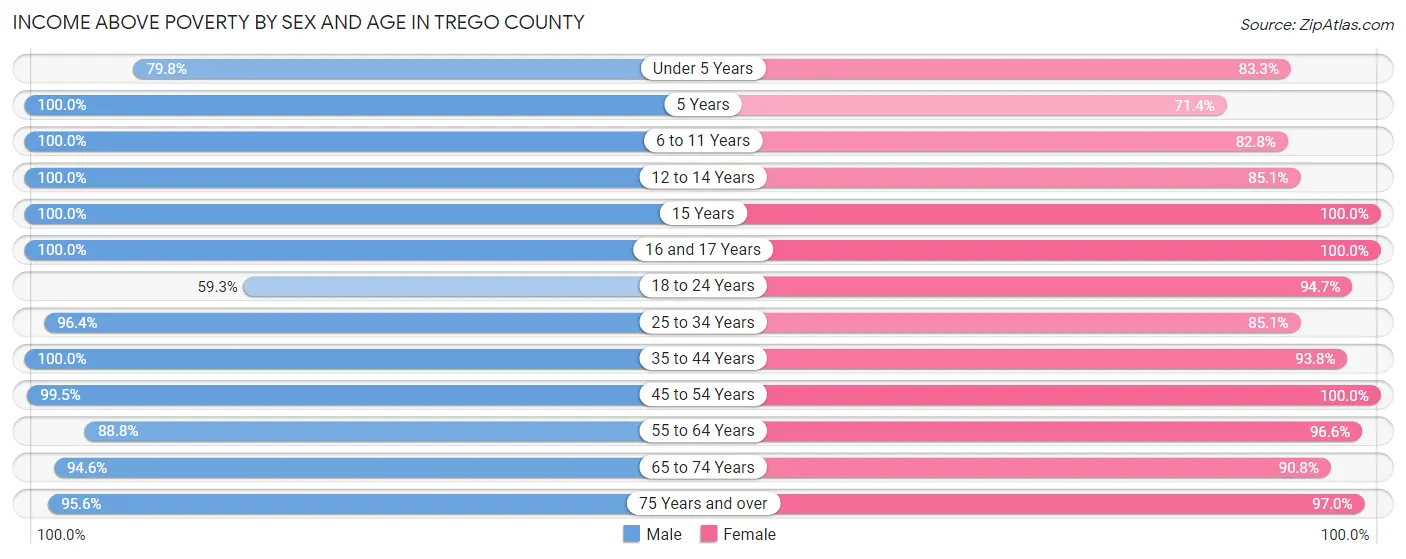
| Age Bracket | Male | Female |
| Under 5 Years | 71 (79.8%) | 45 (83.3%) |
| 5 Years | 8 (100.0%) | 10 (71.4%) |
| 6 to 11 Years | 110 (100.0%) | 24 (82.8%) |
| 12 to 14 Years | 35 (100.0%) | 80 (85.1%) |
| 15 Years | 6 (100.0%) | 24 (100.0%) |
| 16 and 17 Years | 21 (100.0%) | 19 (100.0%) |
| 18 to 24 Years | 54 (59.3%) | 36 (94.7%) |
| 25 to 34 Years | 106 (96.4%) | 103 (85.1%) |
| 35 to 44 Years | 181 (100.0%) | 167 (93.8%) |
| 45 to 54 Years | 193 (99.5%) | 135 (100.0%) |
| 55 to 64 Years | 190 (88.8%) | 224 (96.6%) |
| 65 to 74 Years | 191 (94.6%) | 216 (90.8%) |
| 75 Years and over | 109 (95.6%) | 160 (97.0%) |
| Total | 1,275 (92.7%) | 1,243 (92.7%) |
Income Below Poverty Among Married-Couple Families in Trego County
The poverty statistics for married-couple families in Trego County show that 1.5% or 12 of the total 781 families live below the poverty line. Families with 1 or 2 children have the highest poverty rate of 2.9%, comprising of 5 families. On the other hand, families with 3 or 4 children have the lowest poverty rate of 0.0%, which includes 0 families.
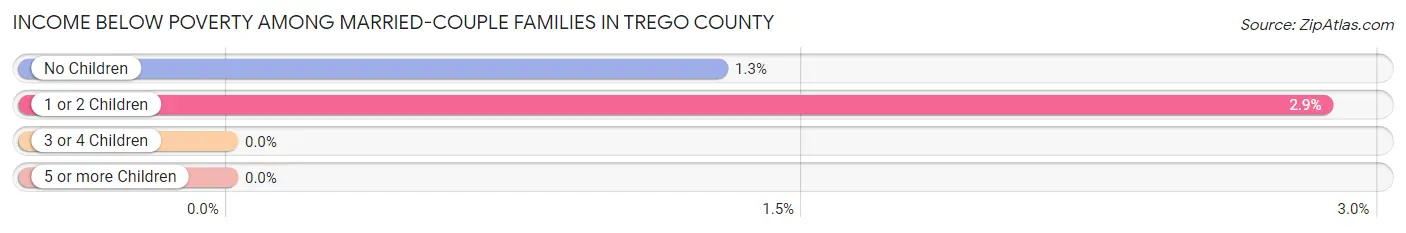
| Children | Above Poverty | Below Poverty |
| No Children | 539 (98.7%) | 7 (1.3%) |
| 1 or 2 Children | 170 (97.1%) | 5 (2.9%) |
| 3 or 4 Children | 60 (100.0%) | 0 (0.0%) |
| 5 or more Children | 0 (0.0%) | 0 (0.0%) |
| Total | 769 (98.5%) | 12 (1.5%) |
Income Below Poverty Among Single-Parent Households in Trego County
According to the poverty data in Trego County, 50.8% or 32 single-father households and 25.0% or 11 single-mother households are living below the poverty line. Among single-father households, those with 1 or 2 children have the highest poverty rate, with 32 households (54.2%) experiencing poverty. Likewise, among single-mother households, those with 1 or 2 children have the highest poverty rate, with 11 households (36.7%) falling below the poverty line.
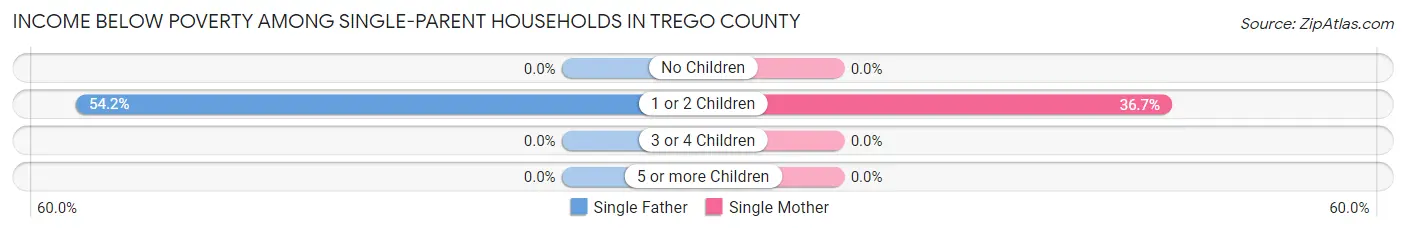
| Children | Single Father | Single Mother |
| No Children | 0 (0.0%) | 0 (0.0%) |
| 1 or 2 Children | 32 (54.2%) | 11 (36.7%) |
| 3 or 4 Children | 0 (0.0%) | 0 (0.0%) |
| 5 or more Children | 0 (0.0%) | 0 (0.0%) |
| Total | 32 (50.8%) | 11 (25.0%) |
Income Below Poverty Among Married-Couple vs Single-Parent Households in Trego County
The poverty data for Trego County shows that 12 of the married-couple family households (1.5%) and 43 of the single-parent households (40.2%) are living below the poverty level. Within the married-couple family households, those with 1 or 2 children have the highest poverty rate, with 5 households (2.9%) falling below the poverty line. Among the single-parent households, those with 1 or 2 children have the highest poverty rate, with 43 household (48.3%) living below poverty.
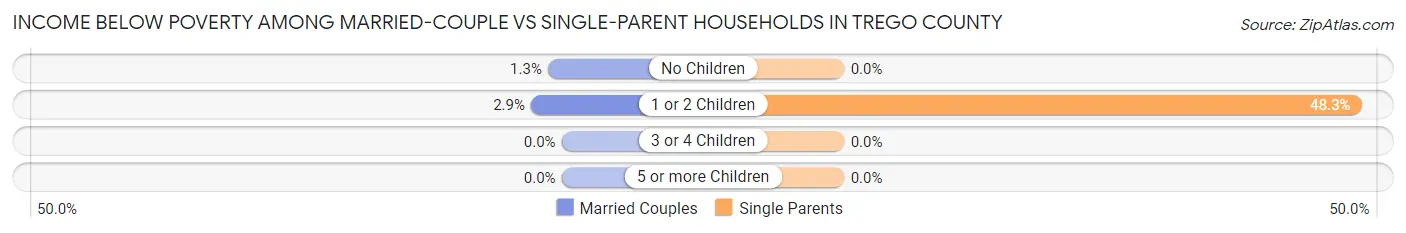
| Children | Married-Couple Families | Single-Parent Households |
| No Children | 7 (1.3%) | 0 (0.0%) |
| 1 or 2 Children | 5 (2.9%) | 43 (48.3%) |
| 3 or 4 Children | 0 (0.0%) | 0 (0.0%) |
| 5 or more Children | 0 (0.0%) | 0 (0.0%) |
| Total | 12 (1.5%) | 43 (40.2%) |
Race in Trego County
The most populous races in Trego County are White / Caucasian (2,727 | 97.5%), Two or more Races (55 | 2.0%), and Hispanic or Latino (23 | 0.8%).
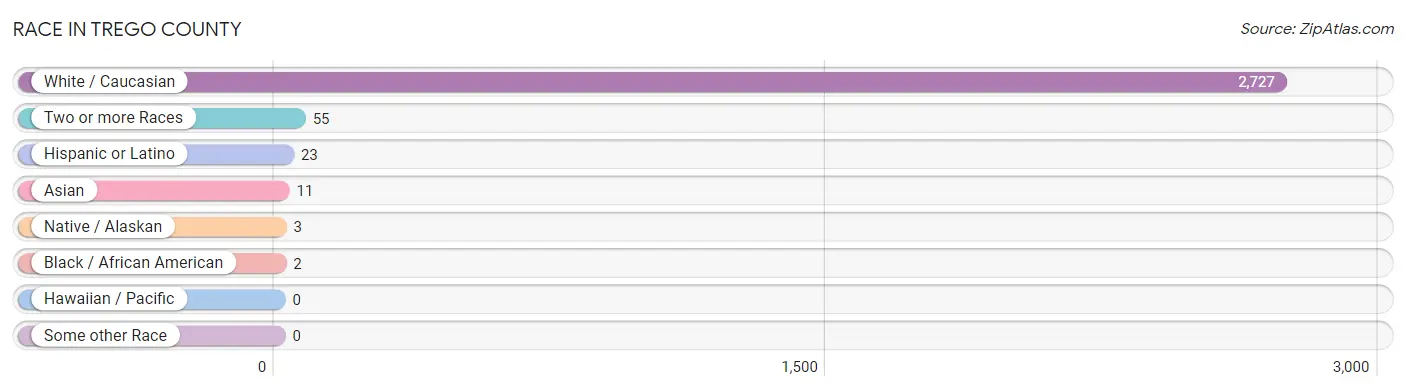
| Race | # Population | % Population |
| Asian | 11 | 0.4% |
| Black / African American | 2 | 0.1% |
| Hawaiian / Pacific | 0 | 0.0% |
| Hispanic or Latino | 23 | 0.8% |
| Native / Alaskan | 3 | 0.1% |
| White / Caucasian | 2,727 | 97.5% |
| Two or more Races | 55 | 2.0% |
| Some other Race | 0 | 0.0% |
| Total | 2,798 | 100.0% |
Ancestry in Trego County
The most populous ancestries reported in Trego County are German (1,390 | 49.7%), Irish (260 | 9.3%), English (247 | 8.8%), Czech (93 | 3.3%), and American (89 | 3.2%), together accounting for 74.3% of all Trego County residents.
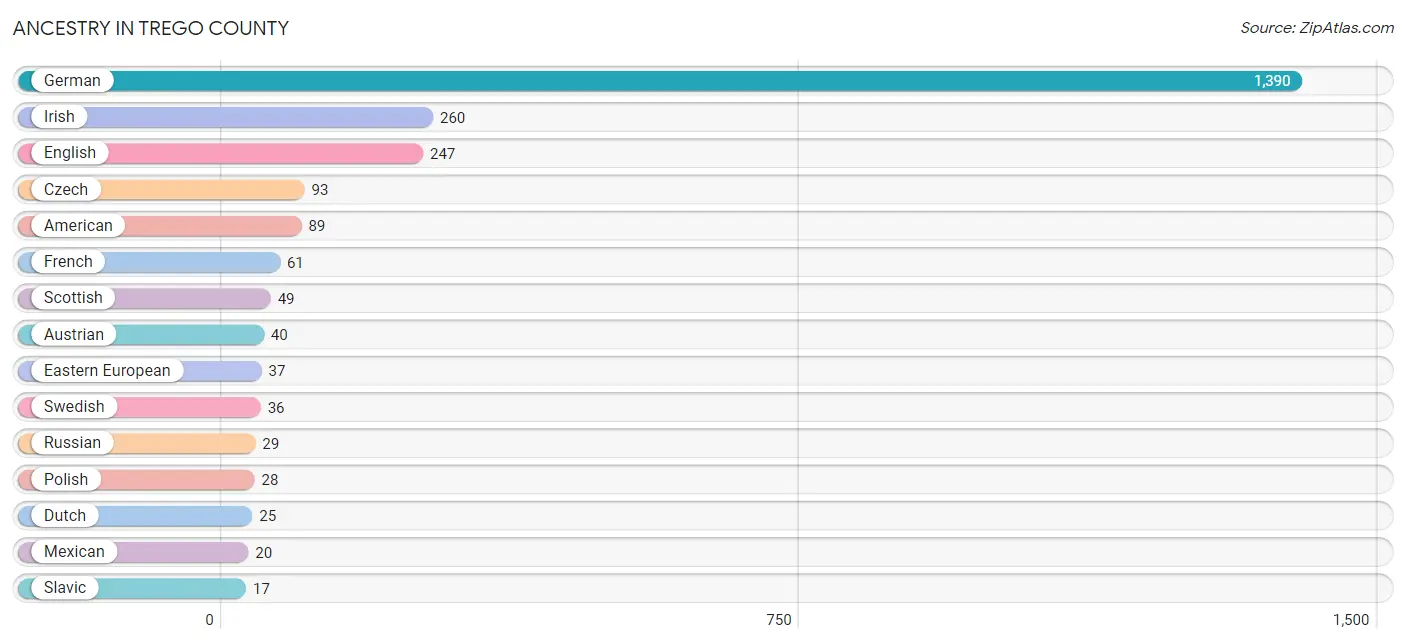
| Ancestry | # Population | % Population |
| American | 89 | 3.2% |
| Austrian | 40 | 1.4% |
| Chippewa | 2 | 0.1% |
| Czech | 93 | 3.3% |
| Danish | 3 | 0.1% |
| Dutch | 25 | 0.9% |
| Eastern European | 37 | 1.3% |
| English | 247 | 8.8% |
| Finnish | 1 | 0.0% |
| French | 61 | 2.2% |
| French Canadian | 16 | 0.6% |
| German | 1,390 | 49.7% |
| Irish | 260 | 9.3% |
| Korean | 11 | 0.4% |
| Mexican | 20 | 0.7% |
| Northern European | 12 | 0.4% |
| Norwegian | 14 | 0.5% |
| Ottawa | 1 | 0.0% |
| Pennsylvania German | 4 | 0.1% |
| Polish | 28 | 1.0% |
| Puerto Rican | 2 | 0.1% |
| Russian | 29 | 1.0% |
| Scotch-Irish | 1 | 0.0% |
| Scottish | 49 | 1.8% |
| Slavic | 17 | 0.6% |
| Slovene | 7 | 0.3% |
| Swedish | 36 | 1.3% |
| Welsh | 8 | 0.3% | View All 28 Rows |
Immigrants in Trego County
The most numerous immigrant groups reported in Trego County came from Asia (11 | 0.4%), Philippines (11 | 0.4%), South Eastern Asia (11 | 0.4%), and Africa (1 | 0.0%), together accounting for 1.2% of all Trego County residents.
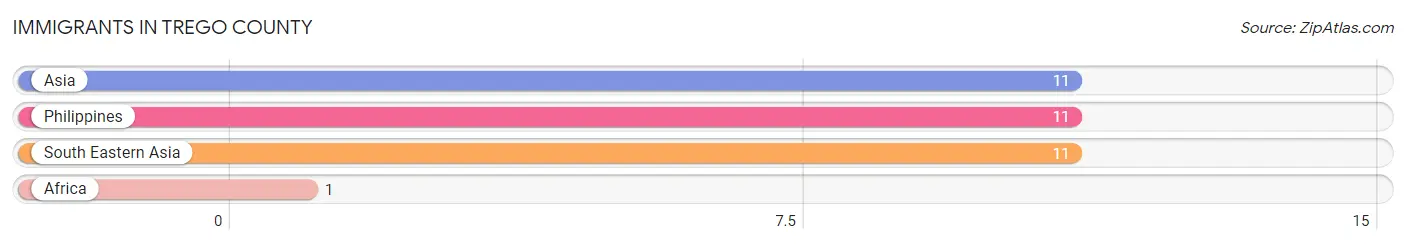
| Immigration Origin | # Population | % Population |
| Africa | 1 | 0.0% |
| Asia | 11 | 0.4% |
| Philippines | 11 | 0.4% |
| South Eastern Asia | 11 | 0.4% | View All 4 Rows |
Sex and Age in Trego County
Sex and Age in Trego County
The most populous age groups in Trego County are 35 to 39 Years (144 | 10.2%) for men and 60 to 64 Years (193 | 13.9%) for women.
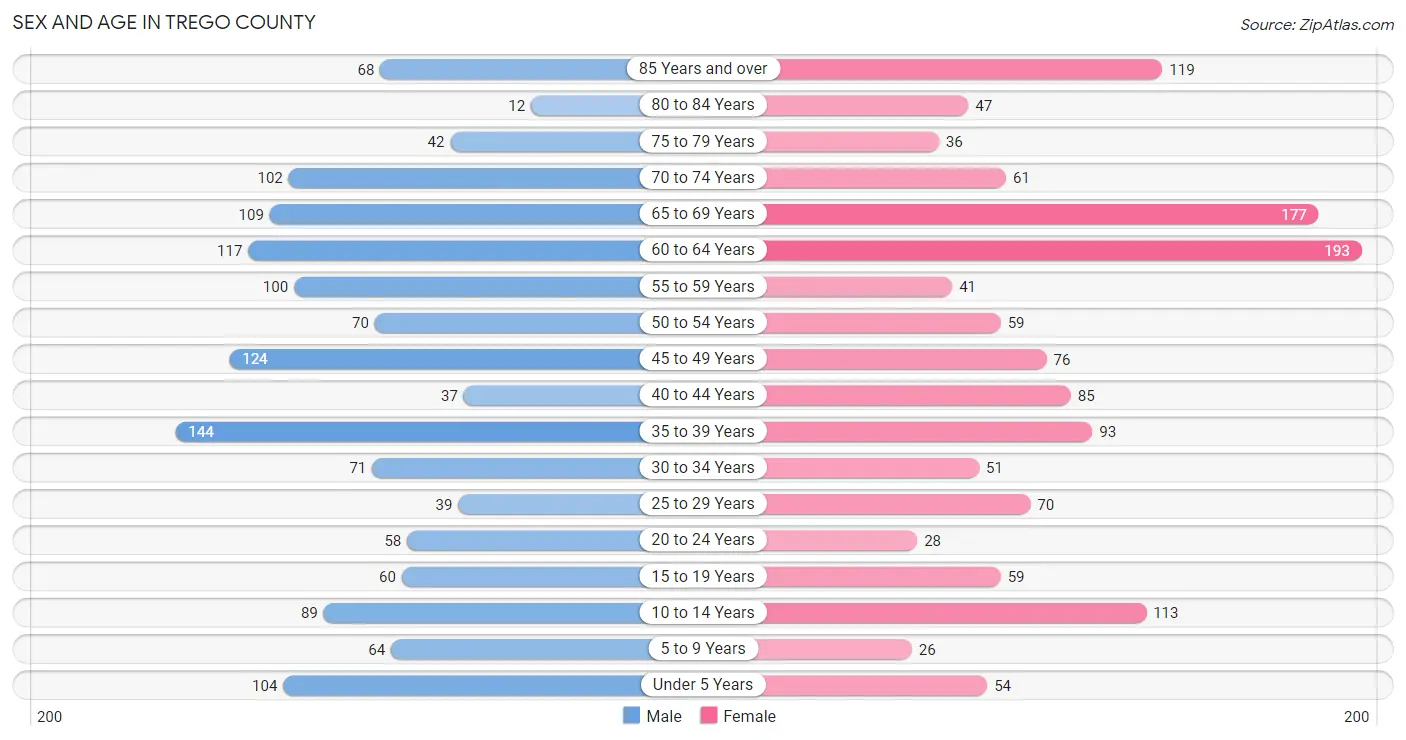
| Age Bracket | Male | Female |
| Under 5 Years | 104 (7.4%) | 54 (3.9%) |
| 5 to 9 Years | 64 (4.5%) | 26 (1.9%) |
| 10 to 14 Years | 89 (6.3%) | 113 (8.1%) |
| 15 to 19 Years | 60 (4.3%) | 59 (4.3%) |
| 20 to 24 Years | 58 (4.1%) | 28 (2.0%) |
| 25 to 29 Years | 39 (2.8%) | 70 (5.0%) |
| 30 to 34 Years | 71 (5.0%) | 51 (3.7%) |
| 35 to 39 Years | 144 (10.2%) | 93 (6.7%) |
| 40 to 44 Years | 37 (2.6%) | 85 (6.1%) |
| 45 to 49 Years | 124 (8.8%) | 76 (5.5%) |
| 50 to 54 Years | 70 (5.0%) | 59 (4.3%) |
| 55 to 59 Years | 100 (7.1%) | 41 (2.9%) |
| 60 to 64 Years | 117 (8.3%) | 193 (13.9%) |
| 65 to 69 Years | 109 (7.7%) | 177 (12.8%) |
| 70 to 74 Years | 102 (7.2%) | 61 (4.4%) |
| 75 to 79 Years | 42 (3.0%) | 36 (2.6%) |
| 80 to 84 Years | 12 (0.9%) | 47 (3.4%) |
| 85 Years and over | 68 (4.8%) | 119 (8.6%) |
| Total | 1,410 (100.0%) | 1,388 (100.0%) |
Families and Households in Trego County
Median Family Size in Trego County
The median family size in Trego County is 2.49 persons per family, with married-couple families (781 | 87.9%) accounting for the largest median family size of 2.56 persons per family. On the other hand, single male/father families (63 | 7.1%) represent the smallest median family size with 1.95 persons per family.
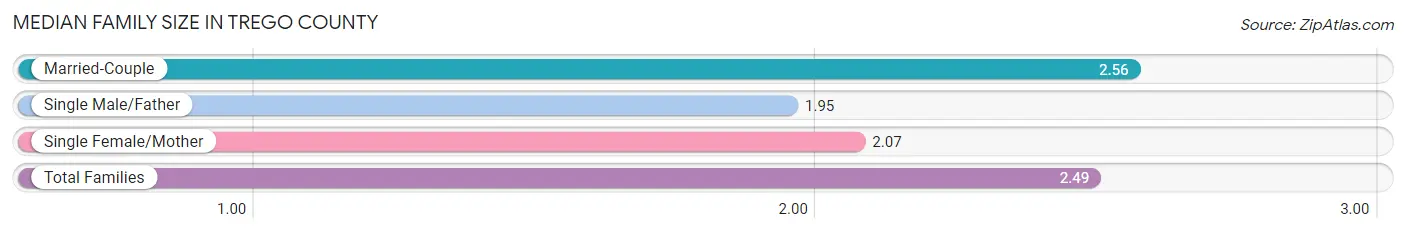
| Family Type | # Families | Family Size |
| Married-Couple | 781 (87.9%) | 2.56 |
| Single Male/Father | 63 (7.1%) | 1.95 |
| Single Female/Mother | 44 (5.0%) | 2.07 |
| Total Families | 888 (100.0%) | 2.49 |
Median Household Size in Trego County
The median household size in Trego County is 2.08 persons per household, with married-couple households (781 | 59.7%) accounting for the largest median household size of 2.58 persons per household. non-family households (420 | 32.1%) represent the smallest median household size with 1.09 persons per household.
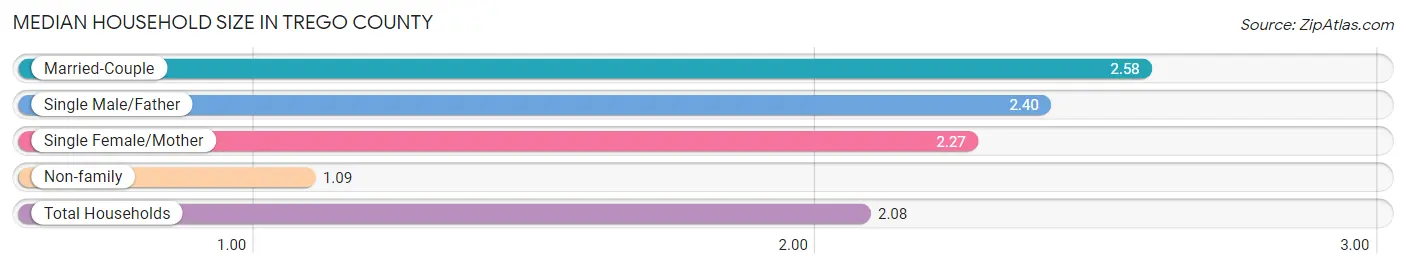
| Household Type | # Households | Household Size |
| Married-Couple | 781 (59.7%) | 2.58 |
| Single Male/Father | 63 (4.8%) | 2.40 |
| Single Female/Mother | 44 (3.4%) | 2.27 |
| Non-family | 420 (32.1%) | 1.09 |
| Total Households | 1,308 (100.0%) | 2.08 |
Household Size by Marriage Status in Trego County
Out of a total of 1,308 households in Trego County, 888 (67.9%) are family households, while 420 (32.1%) are nonfamily households. The most numerous type of family households are 2-person households, comprising 564, and the most common type of nonfamily households are 1-person households, comprising 372.
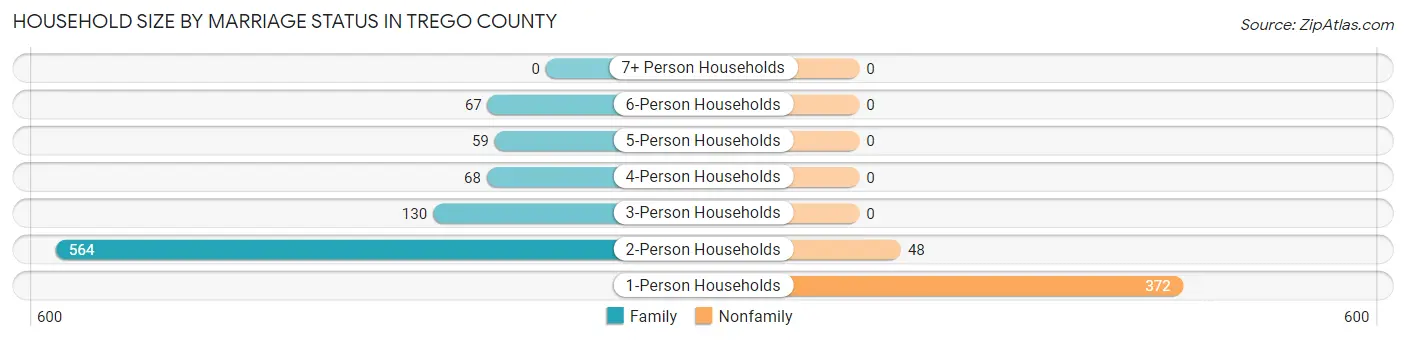
| Household Size | Family Households | Nonfamily Households |
| 1-Person Households | - | 372 (28.4%) |
| 2-Person Households | 564 (43.1%) | 48 (3.7%) |
| 3-Person Households | 130 (9.9%) | 0 (0.0%) |
| 4-Person Households | 68 (5.2%) | 0 (0.0%) |
| 5-Person Households | 59 (4.5%) | 0 (0.0%) |
| 6-Person Households | 67 (5.1%) | 0 (0.0%) |
| 7+ Person Households | 0 (0.0%) | 0 (0.0%) |
| Total | 888 (67.9%) | 420 (32.1%) |
Female Fertility in Trego County
Fertility by Age in Trego County
| Age Bracket | Women with Births | Births / 1,000 Women |
| 15 to 19 years | 0 (0.0%) | 0.0 |
| 20 to 34 years | 0 (0.0%) | 0.0 |
| 35 to 50 years | 0 (0.0%) | 0.0 |
| Total | 0 (0.0%) | 0.0 |
Fertility by Age by Marriage Status in Trego County
| Age Bracket | Married | Unmarried |
| 15 to 19 years | 0 (0.0%) | 0 (0.0%) |
| 20 to 34 years | 0 (0.0%) | 0 (0.0%) |
| 35 to 50 years | 0 (0.0%) | 0 (0.0%) |
| Total | 0 (0.0%) | 0 (0.0%) |
Fertility by Education in Trego County
| Educational Attainment | Women with Births | Births / 1,000 Women |
| Less than High School | 0 (0.0%) | 0.0 |
| High School Diploma | 0 (0.0%) | 0.0 |
| College or Associate's Degree | 0 (0.0%) | 0.0 |
| Bachelor's Degree | 0 (0.0%) | 0.0 |
| Graduate Degree | 0 (0.0%) | 0.0 |
| Total | 0 (0.0%) | 0.0 |
Fertility by Education by Marriage Status in Trego County
| Educational Attainment | Married | Unmarried |
| Less than High School | 0 (0.0%) | 0 (0.0%) |
| High School Diploma | 0 (0.0%) | 0 (0.0%) |
| College or Associate's Degree | 0 (0.0%) | 0 (0.0%) |
| Bachelor's Degree | 0 (0.0%) | 0 (0.0%) |
| Graduate Degree | 0 (0.0%) | 0 (0.0%) |
| Total | 0 (0.0%) | 0 (0.0%) |
Employment Characteristics in Trego County
Employment by Class of Employer in Trego County
Among the 1,404 employed individuals in Trego County, private company employees (651 | 46.4%), self-employed (not incorporated) (308 | 21.9%), and local government employees (159 | 11.3%) make up the most common classes of employment.
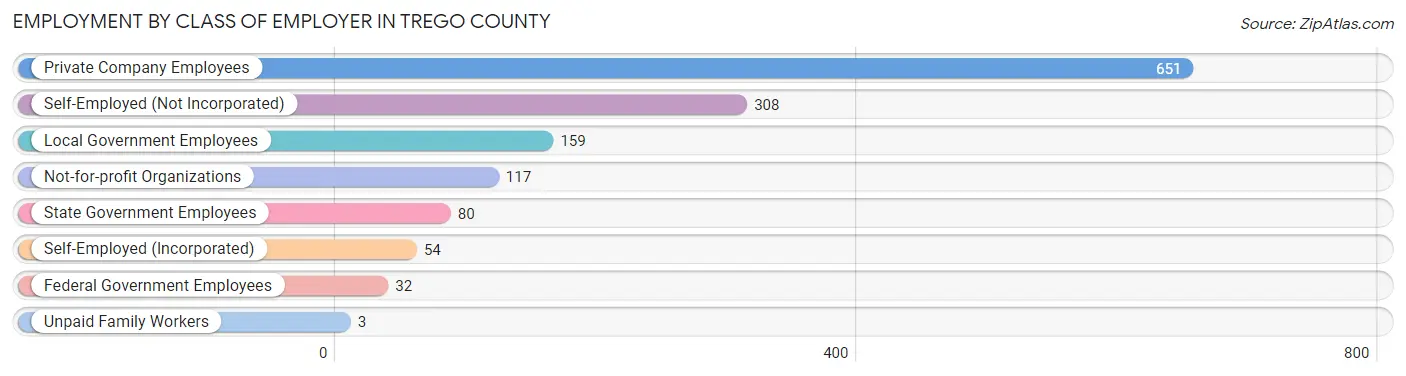
| Employer Class | # Employees | % Employees |
| Private Company Employees | 651 | 46.4% |
| Self-Employed (Incorporated) | 54 | 3.8% |
| Self-Employed (Not Incorporated) | 308 | 21.9% |
| Not-for-profit Organizations | 117 | 8.3% |
| Local Government Employees | 159 | 11.3% |
| State Government Employees | 80 | 5.7% |
| Federal Government Employees | 32 | 2.3% |
| Unpaid Family Workers | 3 | 0.2% |
| Total | 1,404 | 100.0% |
Employment Status by Age in Trego County
According to the labor force statistics for Trego County, out of the total population over 16 years of age (2,316), 62.5% or 1,448 individuals are in the labor force, with 2.6% or 38 of them unemployed. The age group with the highest labor force participation rate is 30 to 34 years, with 99.2% or 121 individuals in the labor force. Within the labor force, the 60 to 64 years age range has the highest percentage of unemployed individuals, with 7.8% or 18 of them being unemployed.
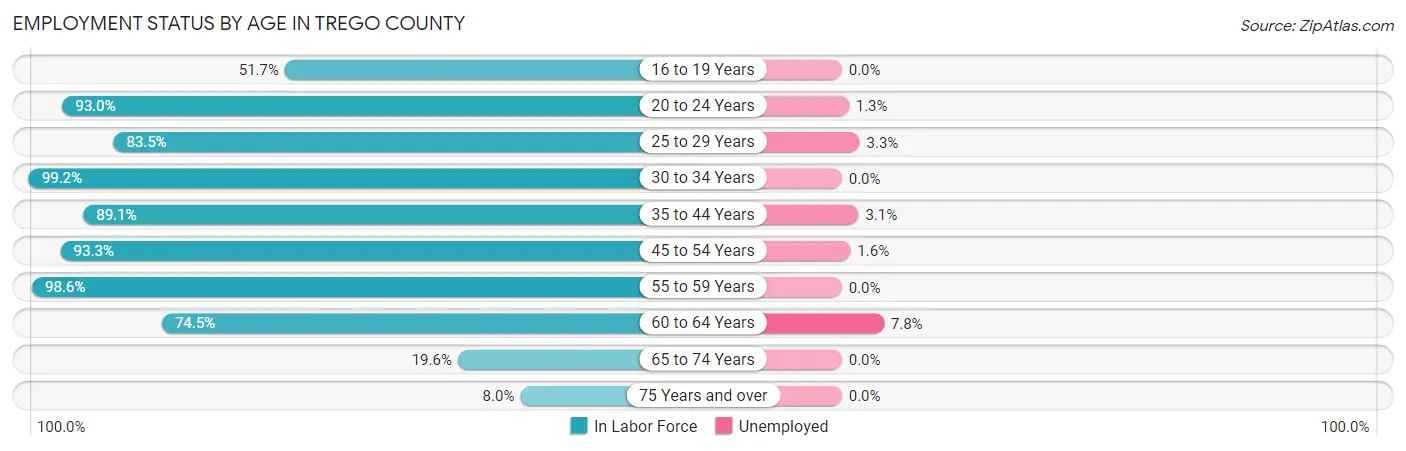
| Age Bracket | In Labor Force | Unemployed |
| 16 to 19 Years | 45 (51.7%) | 0 (0.0%) |
| 20 to 24 Years | 80 (93.0%) | 1 (1.3%) |
| 25 to 29 Years | 91 (83.5%) | 3 (3.3%) |
| 30 to 34 Years | 121 (99.2%) | 0 (0.0%) |
| 35 to 44 Years | 320 (89.1%) | 10 (3.1%) |
| 45 to 54 Years | 307 (93.3%) | 5 (1.6%) |
| 55 to 59 Years | 139 (98.6%) | 0 (0.0%) |
| 60 to 64 Years | 231 (74.5%) | 18 (7.8%) |
| 65 to 74 Years | 88 (19.6%) | 0 (0.0%) |
| 75 Years and over | 26 (8.0%) | 0 (0.0%) |
| Total | 1,448 (62.5%) | 38 (2.6%) |
Employment Status by Educational Attainment in Trego County
According to labor force statistics for Trego County, 88.2% of individuals (1,208) out of the total population between 25 and 64 years of age (1,370) are in the labor force, with 3.0% or 36 of them being unemployed. The group with the highest labor force participation rate are those with the educational attainment of college / associate degree, with 94.5% or 546 individuals in the labor force. Within the labor force, individuals with high school diploma education have the highest percentage of unemployment, with 7.7% or 27 of them being unemployed.
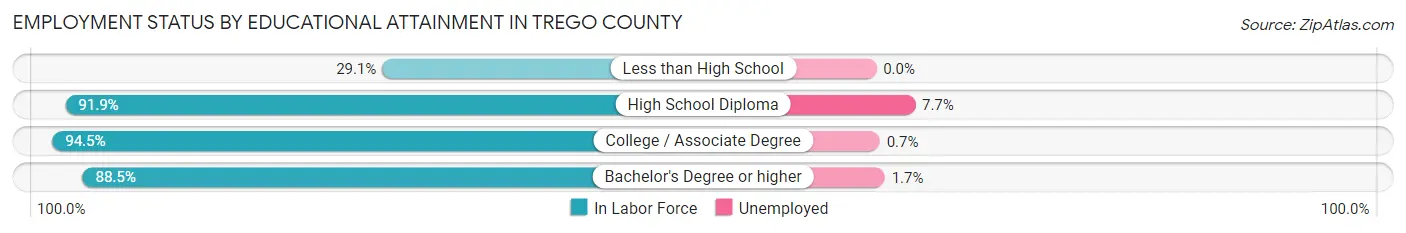
| Educational Attainment | In Labor Force | Unemployed |
| Less than High School | 25 (29.1%) | 0 (0.0%) |
| High School Diploma | 352 (91.9%) | 29 (7.7%) |
| College / Associate Degree | 546 (94.5%) | 4 (0.7%) |
| Bachelor's Degree or higher | 286 (88.5%) | 5 (1.7%) |
| Total | 1,208 (88.2%) | 41 (3.0%) |
Employment Occupations by Sex in Trego County
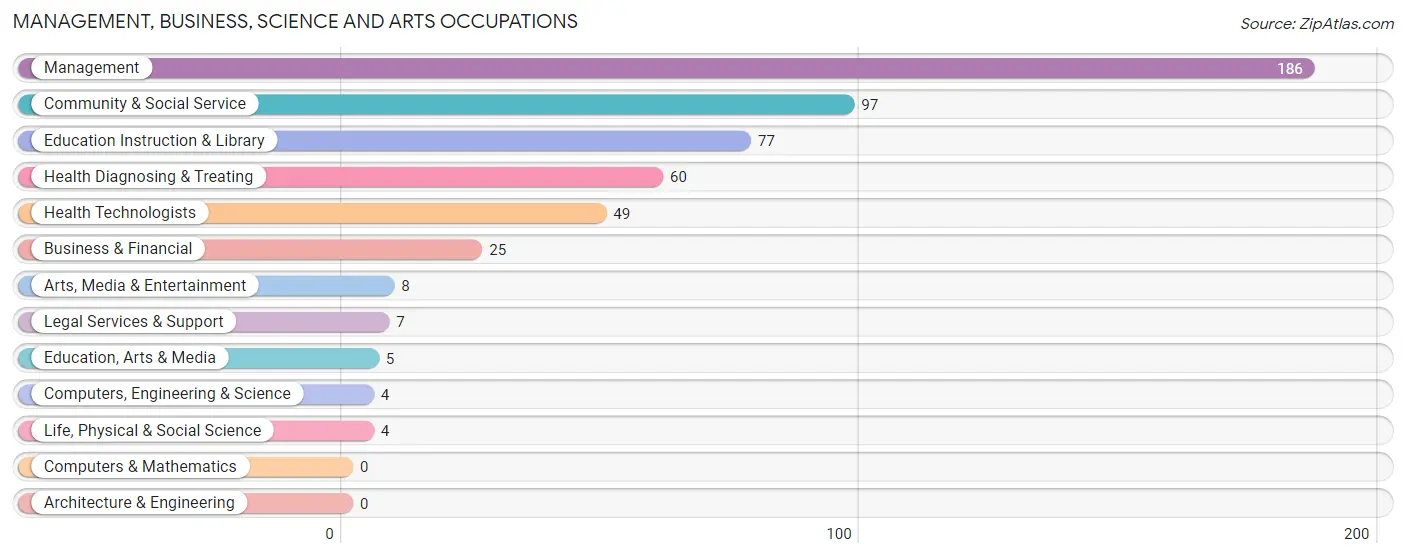
Management, Business, Science and Arts Occupations
The most common Management, Business, Science and Arts occupations in Trego County are Management (186 | 13.2%), Community & Social Service (97 | 6.9%), Education Instruction & Library (77 | 5.5%), Health Diagnosing & Treating (60 | 4.3%), and Health Technologists (49 | 3.5%).
Management, Business, Science and Arts Occupations by Sex
Within the Management, Business, Science and Arts occupations in Trego County, the most male-oriented occupations are Legal Services & Support (100.0%), Arts, Media & Entertainment (100.0%), and Management (75.3%), while the most female-oriented occupations are Business & Financial (100.0%), Computers, Engineering & Science (100.0%), and Life, Physical & Social Science (100.0%).
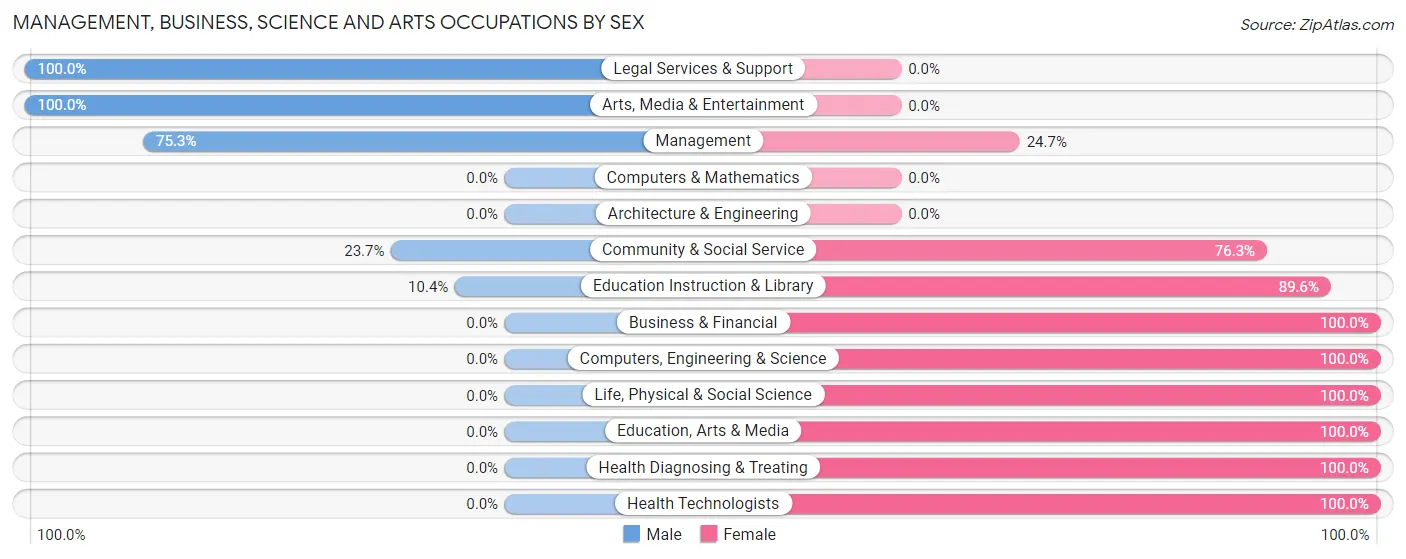
| Occupation | Male | Female |
| Management | 140 (75.3%) | 46 (24.7%) |
| Business & Financial | 0 (0.0%) | 25 (100.0%) |
| Computers, Engineering & Science | 0 (0.0%) | 4 (100.0%) |
| Computers & Mathematics | 0 (0.0%) | 0 (0.0%) |
| Architecture & Engineering | 0 (0.0%) | 0 (0.0%) |
| Life, Physical & Social Science | 0 (0.0%) | 4 (100.0%) |
| Community & Social Service | 23 (23.7%) | 74 (76.3%) |
| Education, Arts & Media | 0 (0.0%) | 5 (100.0%) |
| Legal Services & Support | 7 (100.0%) | 0 (0.0%) |
| Education Instruction & Library | 8 (10.4%) | 69 (89.6%) |
| Arts, Media & Entertainment | 8 (100.0%) | 0 (0.0%) |
| Health Diagnosing & Treating | 0 (0.0%) | 60 (100.0%) |
| Health Technologists | 0 (0.0%) | 49 (100.0%) |
| Total (Category) | 163 (43.8%) | 209 (56.2%) |
| Total (Overall) | 815 (58.0%) | 590 (42.0%) |
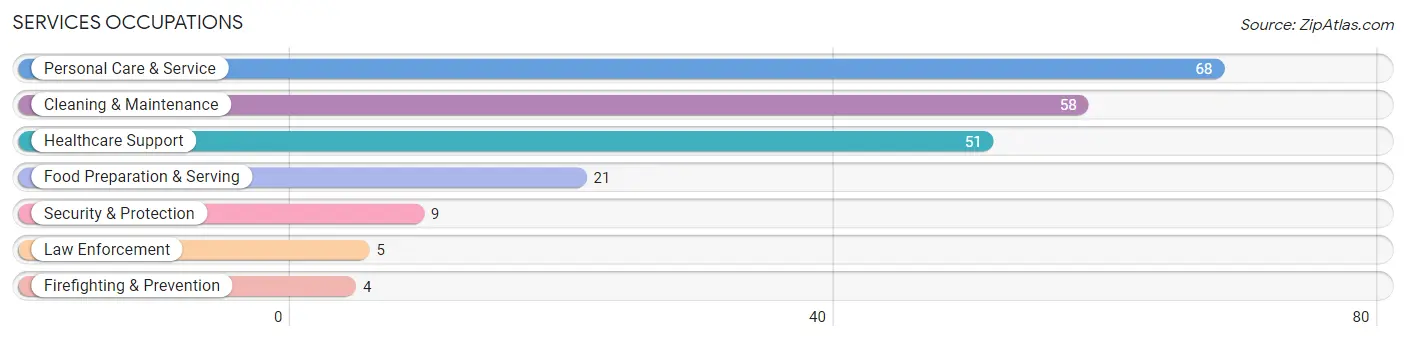
Services Occupations
The most common Services occupations in Trego County are Personal Care & Service (68 | 4.8%), Cleaning & Maintenance (58 | 4.1%), Healthcare Support (51 | 3.6%), Food Preparation & Serving (21 | 1.5%), and Security & Protection (9 | 0.6%).
Services Occupations by Sex
Within the Services occupations in Trego County, the most male-oriented occupations are Security & Protection (100.0%), Firefighting & Prevention (100.0%), and Law Enforcement (100.0%), while the most female-oriented occupations are Healthcare Support (100.0%), Personal Care & Service (97.1%), and Food Preparation & Serving (80.9%).
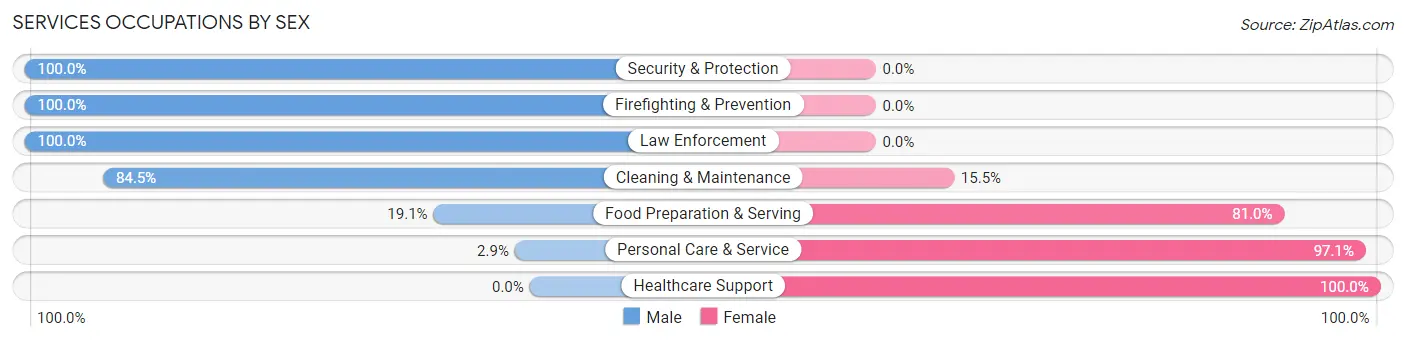
| Occupation | Male | Female |
| Healthcare Support | 0 (0.0%) | 51 (100.0%) |
| Security & Protection | 9 (100.0%) | 0 (0.0%) |
| Firefighting & Prevention | 4 (100.0%) | 0 (0.0%) |
| Law Enforcement | 5 (100.0%) | 0 (0.0%) |
| Food Preparation & Serving | 4 (19.1%) | 17 (80.9%) |
| Cleaning & Maintenance | 49 (84.5%) | 9 (15.5%) |
| Personal Care & Service | 2 (2.9%) | 66 (97.1%) |
| Total (Category) | 64 (30.9%) | 143 (69.1%) |
| Total (Overall) | 815 (58.0%) | 590 (42.0%) |
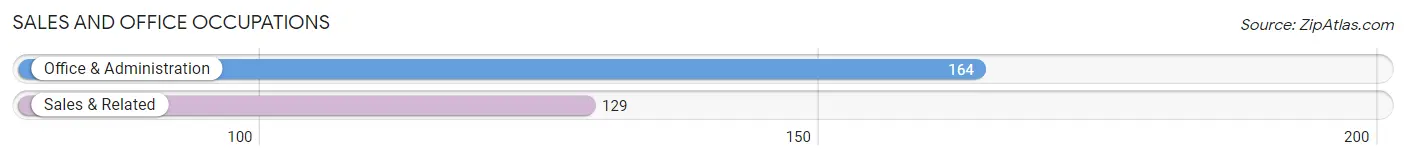
Sales and Office Occupations
The most common Sales and Office occupations in Trego County are Office & Administration (164 | 11.7%), and Sales & Related (129 | 9.2%).
Sales and Office Occupations by Sex
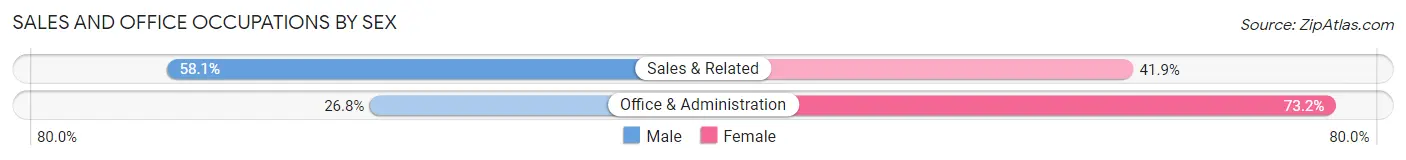
| Occupation | Male | Female |
| Sales & Related | 75 (58.1%) | 54 (41.9%) |
| Office & Administration | 44 (26.8%) | 120 (73.2%) |
| Total (Category) | 119 (40.6%) | 174 (59.4%) |
| Total (Overall) | 815 (58.0%) | 590 (42.0%) |
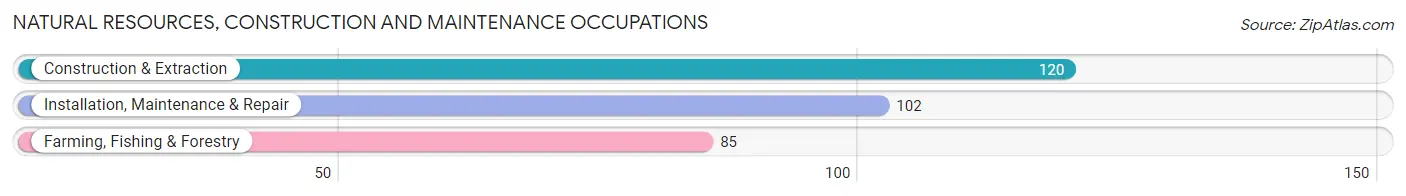
Natural Resources, Construction and Maintenance Occupations
The most common Natural Resources, Construction and Maintenance occupations in Trego County are Construction & Extraction (120 | 8.5%), Installation, Maintenance & Repair (102 | 7.3%), and Farming, Fishing & Forestry (85 | 6.0%).
Natural Resources, Construction and Maintenance Occupations by Sex
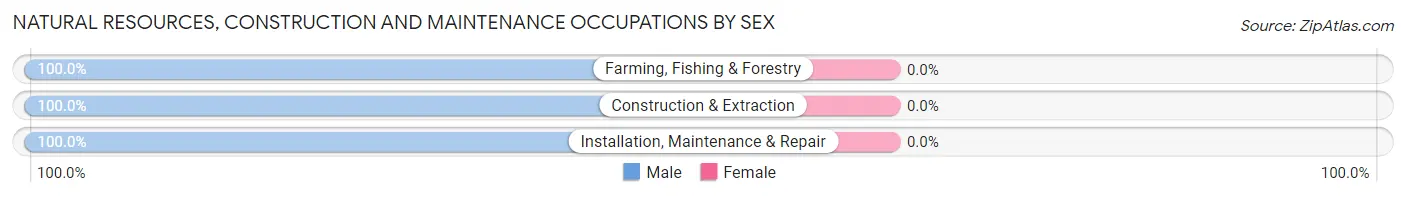
| Occupation | Male | Female |
| Farming, Fishing & Forestry | 85 (100.0%) | 0 (0.0%) |
| Construction & Extraction | 120 (100.0%) | 0 (0.0%) |
| Installation, Maintenance & Repair | 102 (100.0%) | 0 (0.0%) |
| Total (Category) | 307 (100.0%) | 0 (0.0%) |
| Total (Overall) | 815 (58.0%) | 590 (42.0%) |
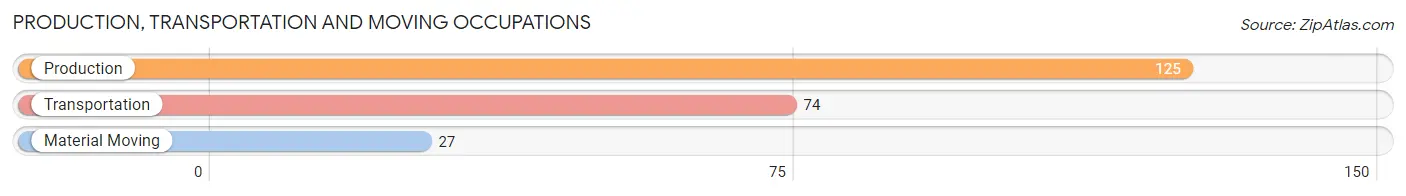
Production, Transportation and Moving Occupations
The most common Production, Transportation and Moving occupations in Trego County are Production (125 | 8.9%), Transportation (74 | 5.3%), and Material Moving (27 | 1.9%).
Production, Transportation and Moving Occupations by Sex
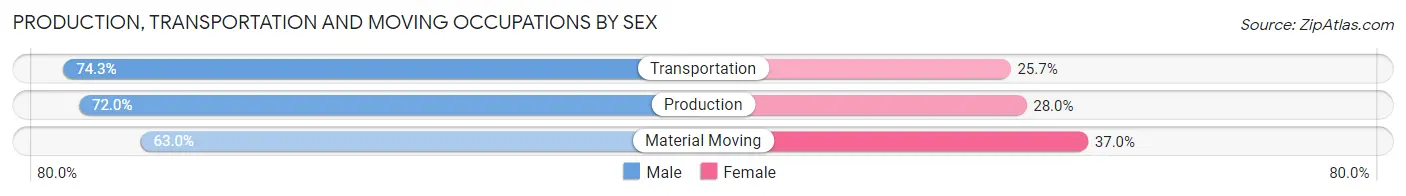
| Occupation | Male | Female |
| Production | 90 (72.0%) | 35 (28.0%) |
| Transportation | 55 (74.3%) | 19 (25.7%) |
| Material Moving | 17 (63.0%) | 10 (37.0%) |
| Total (Category) | 162 (71.7%) | 64 (28.3%) |
| Total (Overall) | 815 (58.0%) | 590 (42.0%) |
Employment Industries by Sex in Trego County
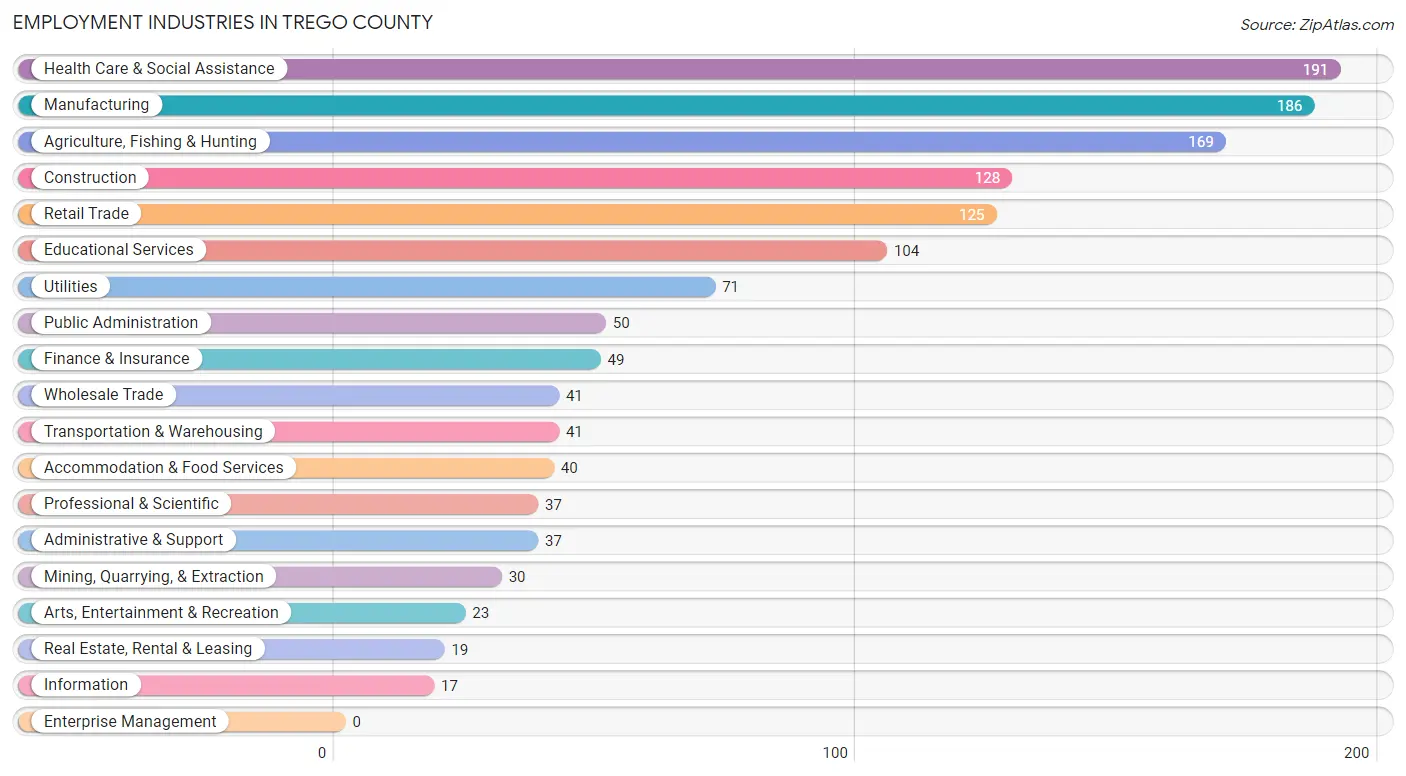
Employment Industries in Trego County
The major employment industries in Trego County include Health Care & Social Assistance (191 | 13.6%), Manufacturing (186 | 13.2%), Agriculture, Fishing & Hunting (169 | 12.0%), Construction (128 | 9.1%), and Retail Trade (125 | 8.9%).
Employment Industries by Sex in Trego County
The Trego County industries that see more men than women are Construction (100.0%), Wholesale Trade (100.0%), and Arts, Entertainment & Recreation (100.0%), whereas the industries that tend to have a higher number of women are Accommodation & Food Services (92.5%), Health Care & Social Assistance (90.6%), and Professional & Scientific (81.1%).
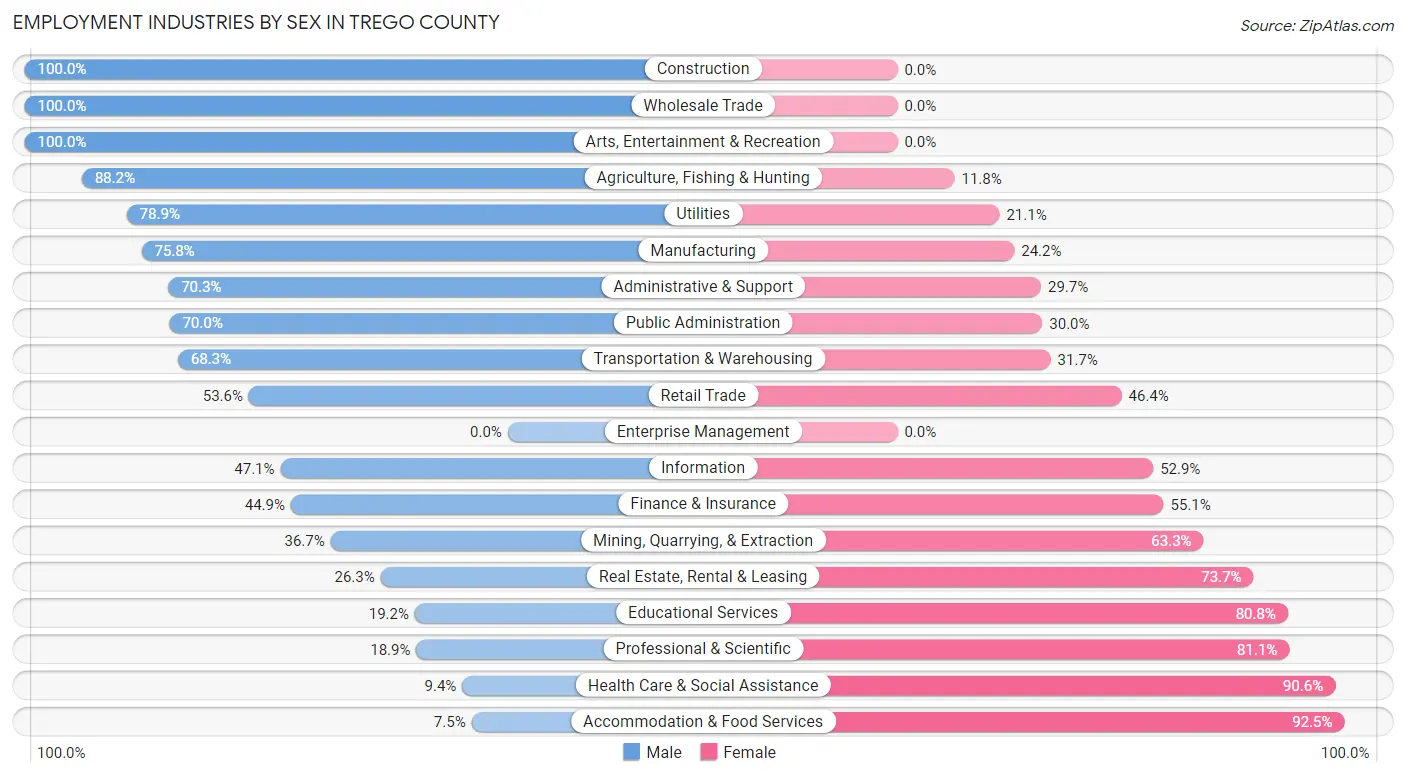
| Industry | Male | Female |
| Agriculture, Fishing & Hunting | 149 (88.2%) | 20 (11.8%) |
| Mining, Quarrying, & Extraction | 11 (36.7%) | 19 (63.3%) |
| Construction | 128 (100.0%) | 0 (0.0%) |
| Manufacturing | 141 (75.8%) | 45 (24.2%) |
| Wholesale Trade | 41 (100.0%) | 0 (0.0%) |
| Retail Trade | 67 (53.6%) | 58 (46.4%) |
| Transportation & Warehousing | 28 (68.3%) | 13 (31.7%) |
| Utilities | 56 (78.9%) | 15 (21.1%) |
| Information | 8 (47.1%) | 9 (52.9%) |
| Finance & Insurance | 22 (44.9%) | 27 (55.1%) |
| Real Estate, Rental & Leasing | 5 (26.3%) | 14 (73.7%) |
| Professional & Scientific | 7 (18.9%) | 30 (81.1%) |
| Enterprise Management | 0 (0.0%) | 0 (0.0%) |
| Administrative & Support | 26 (70.3%) | 11 (29.7%) |
| Educational Services | 20 (19.2%) | 84 (80.8%) |
| Health Care & Social Assistance | 18 (9.4%) | 173 (90.6%) |
| Arts, Entertainment & Recreation | 23 (100.0%) | 0 (0.0%) |
| Accommodation & Food Services | 3 (7.5%) | 37 (92.5%) |
| Public Administration | 35 (70.0%) | 15 (30.0%) |
| Total | 815 (58.0%) | 590 (42.0%) |
Education in Trego County
School Enrollment in Trego County
The most common levels of schooling among the 475 students in Trego County are middle school (157 | 33.1%), high school (144 | 30.3%), and elementary school (63 | 13.3%).
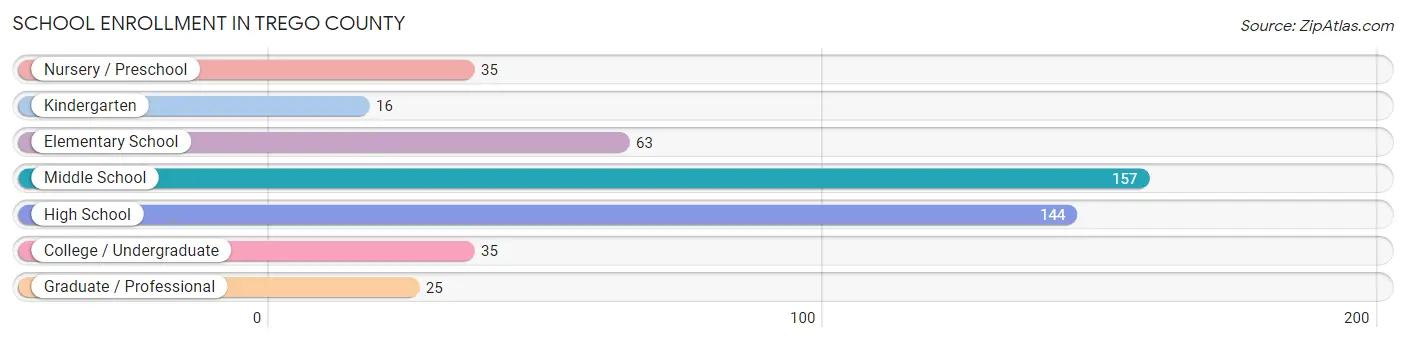
| School Level | # Students | % Students |
| Nursery / Preschool | 35 | 7.4% |
| Kindergarten | 16 | 3.4% |
| Elementary School | 63 | 13.3% |
| Middle School | 157 | 33.1% |
| High School | 144 | 30.3% |
| College / Undergraduate | 35 | 7.4% |
| Graduate / Professional | 25 | 5.3% |
| Total | 475 | 100.0% |
School Enrollment by Age by Funding Source in Trego County
Out of a total of 475 students who are enrolled in schools in Trego County, 8 (1.7%) attend a private institution, while the remaining 467 (98.3%) are enrolled in public schools. The age group of 35 years and over has the highest likelihood of being enrolled in private schools, with 6 (26.1% in the age bracket) enrolled. Conversely, the age group of 3 to 4 year olds has the lowest likelihood of being enrolled in a private school, with 30 (100.0% in the age bracket) attending a public institution.
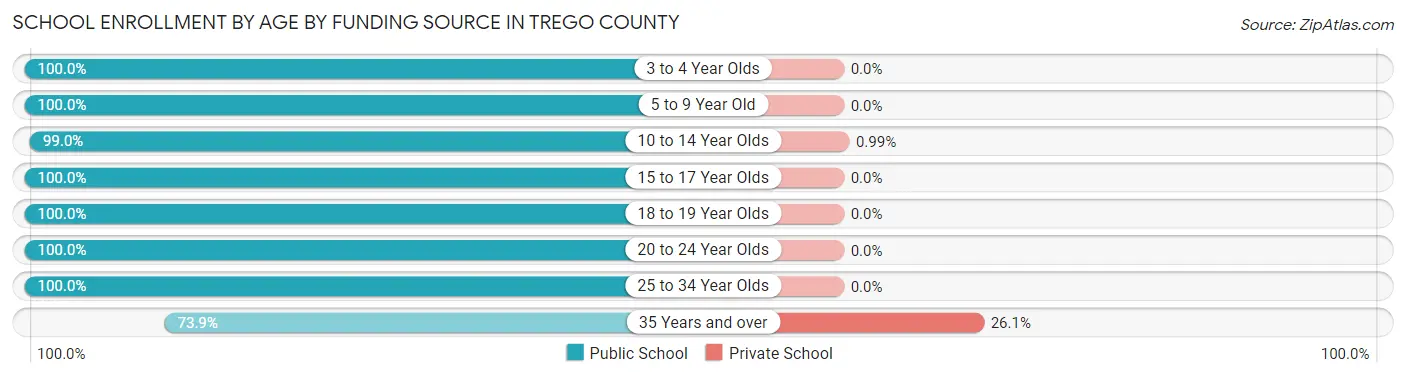
| Age Bracket | Public School | Private School |
| 3 to 4 Year Olds | 30 (100.0%) | 0 (0.0%) |
| 5 to 9 Year Old | 82 (100.0%) | 0 (0.0%) |
| 10 to 14 Year Olds | 200 (99.0%) | 2 (1.0%) |
| 15 to 17 Year Olds | 74 (100.0%) | 0 (0.0%) |
| 18 to 19 Year Olds | 43 (100.0%) | 0 (0.0%) |
| 20 to 24 Year Olds | 5 (100.0%) | 0 (0.0%) |
| 25 to 34 Year Olds | 16 (100.0%) | 0 (0.0%) |
| 35 Years and over | 17 (73.9%) | 6 (26.1%) |
| Total | 467 (98.3%) | 8 (1.7%) |
Educational Attainment by Field of Study in Trego County
Education (231 | 39.8%), business (97 | 16.7%), bio, nature & agricultural (69 | 11.9%), science & technology (55 | 9.5%), and arts & humanities (42 | 7.2%) are the most common fields of study among 581 individuals in Trego County who have obtained a bachelor's degree or higher.
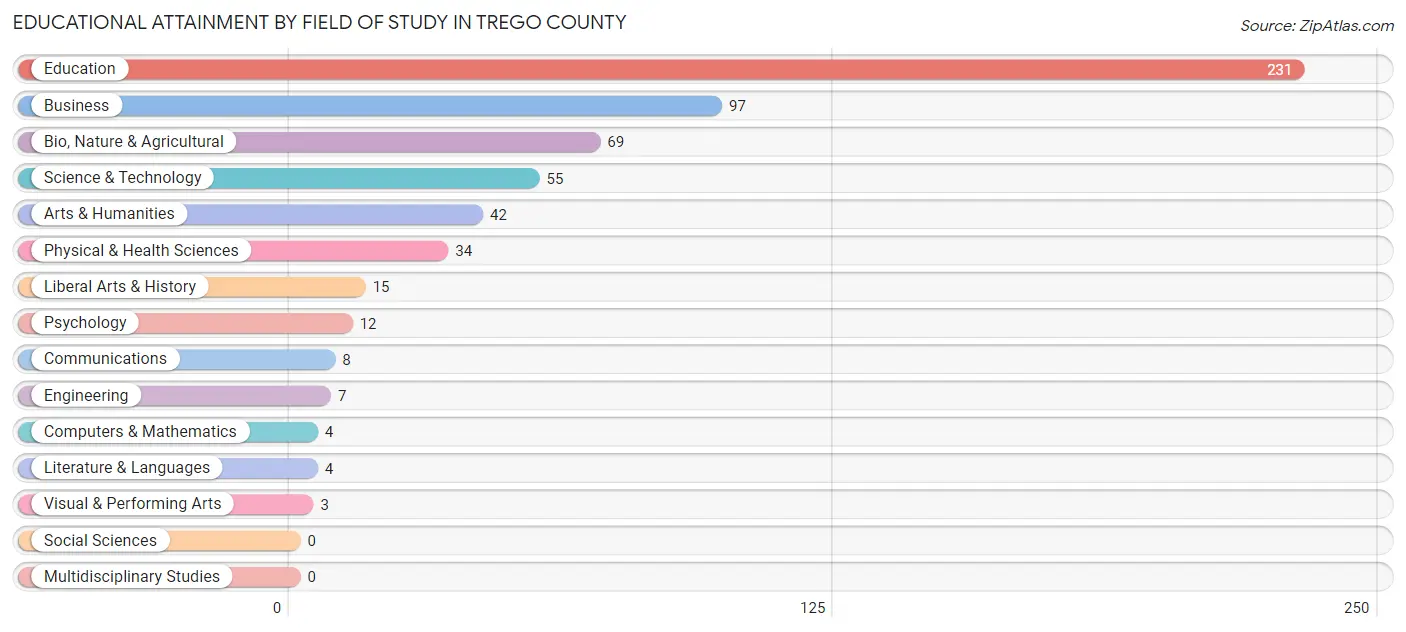
| Field of Study | # Graduates | % Graduates |
| Computers & Mathematics | 4 | 0.7% |
| Bio, Nature & Agricultural | 69 | 11.9% |
| Physical & Health Sciences | 34 | 5.9% |
| Psychology | 12 | 2.1% |
| Social Sciences | 0 | 0.0% |
| Engineering | 7 | 1.2% |
| Multidisciplinary Studies | 0 | 0.0% |
| Science & Technology | 55 | 9.5% |
| Business | 97 | 16.7% |
| Education | 231 | 39.8% |
| Literature & Languages | 4 | 0.7% |
| Liberal Arts & History | 15 | 2.6% |
| Visual & Performing Arts | 3 | 0.5% |
| Communications | 8 | 1.4% |
| Arts & Humanities | 42 | 7.2% |
| Total | 581 | 100.0% |
Transportation & Commute in Trego County
Vehicle Availability by Sex in Trego County
The most prevalent vehicle ownership categories in Trego County are males with 2 vehicles (338, accounting for 41.6%) and females with 2 vehicles (226, making up 57.3%).
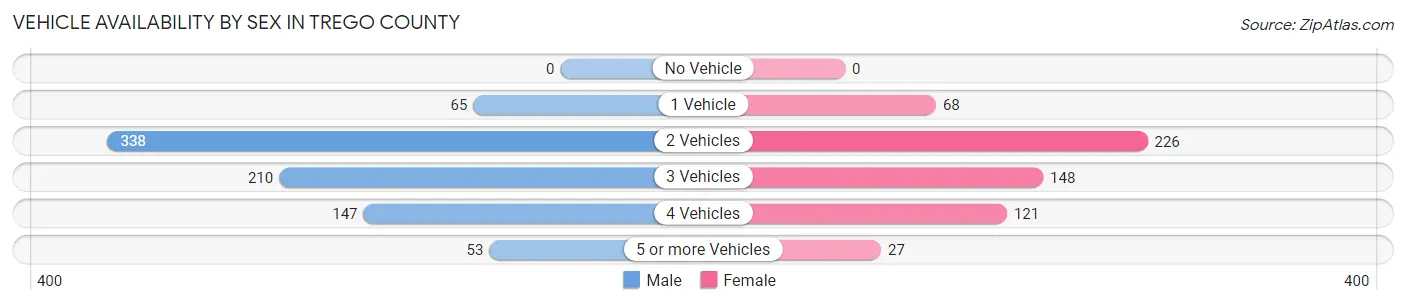
| Vehicles Available | Male | Female |
| No Vehicle | 0 (0.0%) | 0 (0.0%) |
| 1 Vehicle | 65 (8.0%) | 68 (11.5%) |
| 2 Vehicles | 338 (41.6%) | 226 (38.3%) |
| 3 Vehicles | 210 (25.8%) | 148 (25.1%) |
| 4 Vehicles | 147 (18.1%) | 121 (20.5%) |
| 5 or more Vehicles | 53 (6.5%) | 27 (4.6%) |
| Total | 813 (100.0%) | 590 (100.0%) |
Commute Time in Trego County
The most frequently occuring commute durations in Trego County are 5 to 9 minutes (365 commuters, 28.1%), less than 5 minutes (313 commuters, 24.1%), and 30 to 34 minutes (130 commuters, 10.0%).
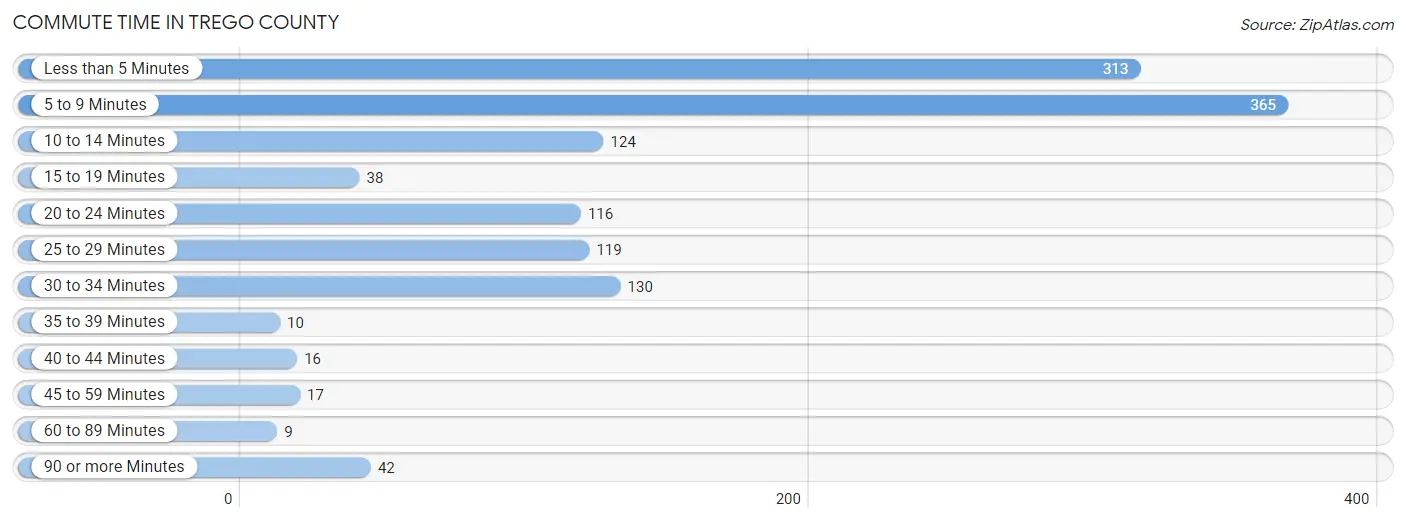
| Commute Time | # Commuters | % Commuters |
| Less than 5 Minutes | 313 | 24.1% |
| 5 to 9 Minutes | 365 | 28.1% |
| 10 to 14 Minutes | 124 | 9.6% |
| 15 to 19 Minutes | 38 | 2.9% |
| 20 to 24 Minutes | 116 | 8.9% |
| 25 to 29 Minutes | 119 | 9.2% |
| 30 to 34 Minutes | 130 | 10.0% |
| 35 to 39 Minutes | 10 | 0.8% |
| 40 to 44 Minutes | 16 | 1.2% |
| 45 to 59 Minutes | 17 | 1.3% |
| 60 to 89 Minutes | 9 | 0.7% |
| 90 or more Minutes | 42 | 3.2% |
Commute Time by Sex in Trego County
The most common commute times in Trego County are less than 5 minutes (209 commuters, 27.1%) for males and 5 to 9 minutes (179 commuters, 33.9%) for females.
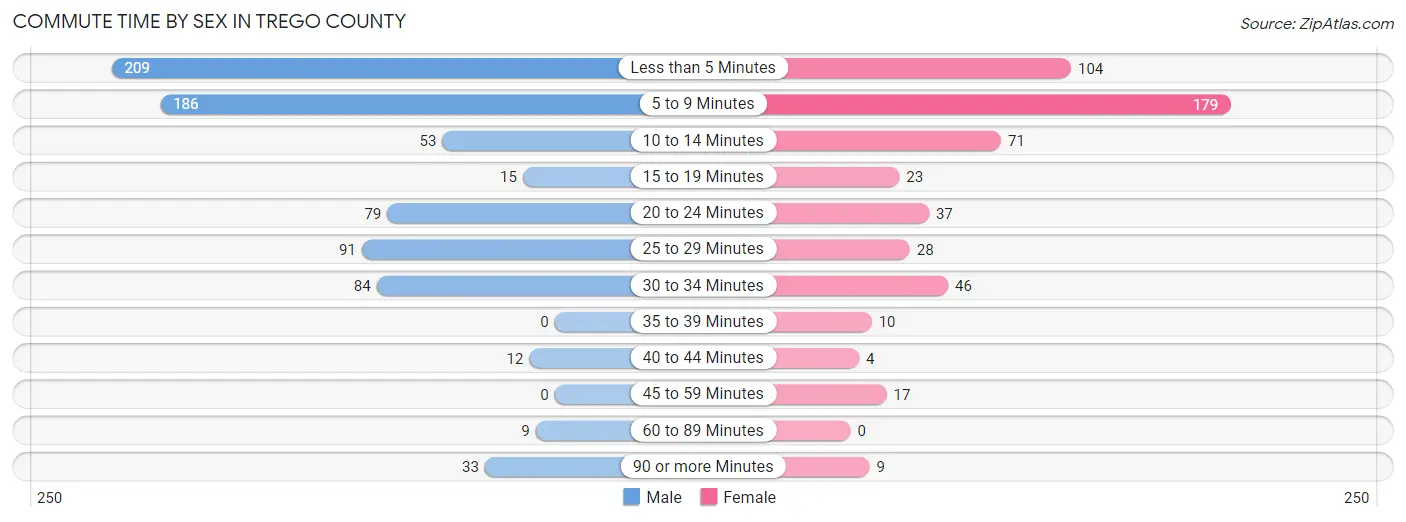
| Commute Time | Male | Female |
| Less than 5 Minutes | 209 (27.1%) | 104 (19.7%) |
| 5 to 9 Minutes | 186 (24.1%) | 179 (33.9%) |
| 10 to 14 Minutes | 53 (6.9%) | 71 (13.5%) |
| 15 to 19 Minutes | 15 (1.9%) | 23 (4.4%) |
| 20 to 24 Minutes | 79 (10.2%) | 37 (7.0%) |
| 25 to 29 Minutes | 91 (11.8%) | 28 (5.3%) |
| 30 to 34 Minutes | 84 (10.9%) | 46 (8.7%) |
| 35 to 39 Minutes | 0 (0.0%) | 10 (1.9%) |
| 40 to 44 Minutes | 12 (1.6%) | 4 (0.8%) |
| 45 to 59 Minutes | 0 (0.0%) | 17 (3.2%) |
| 60 to 89 Minutes | 9 (1.2%) | 0 (0.0%) |
| 90 or more Minutes | 33 (4.3%) | 9 (1.7%) |
Time of Departure to Work by Sex in Trego County
The most frequent times of departure to work in Trego County are 7:30 AM to 7:59 AM (164, 21.3%) for males and 7:30 AM to 7:59 AM (120, 22.7%) for females.
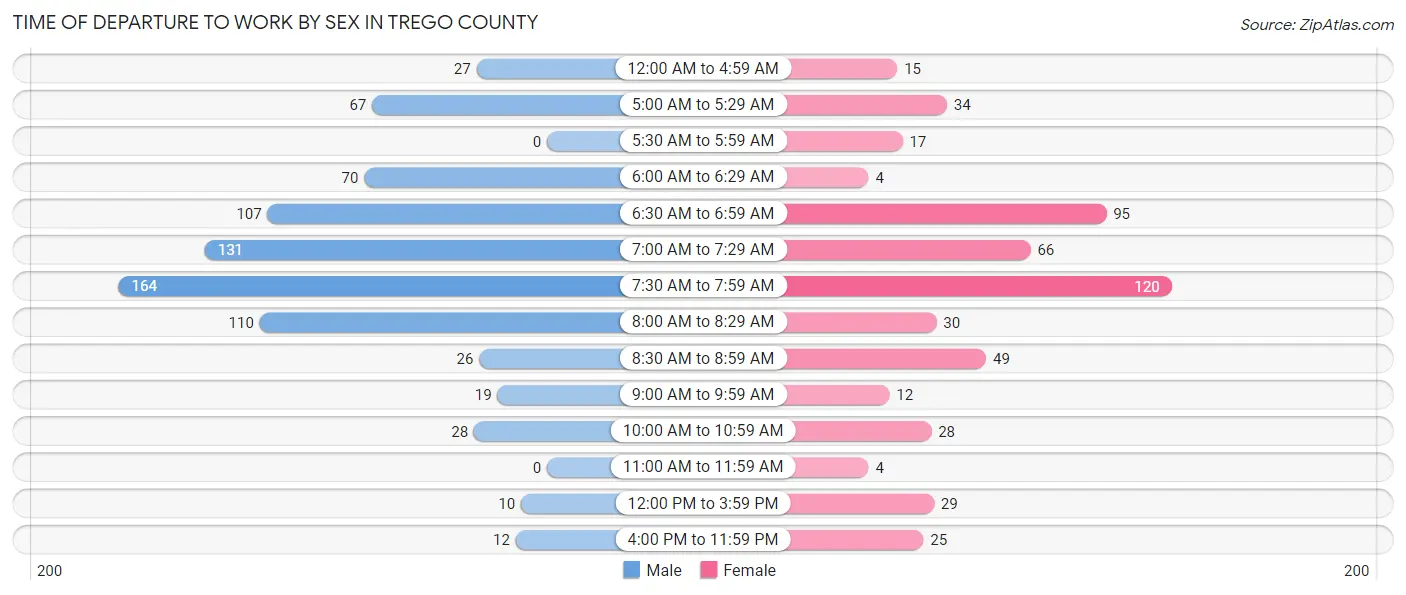
| Time of Departure | Male | Female |
| 12:00 AM to 4:59 AM | 27 (3.5%) | 15 (2.8%) |
| 5:00 AM to 5:29 AM | 67 (8.7%) | 34 (6.4%) |
| 5:30 AM to 5:59 AM | 0 (0.0%) | 17 (3.2%) |
| 6:00 AM to 6:29 AM | 70 (9.1%) | 4 (0.8%) |
| 6:30 AM to 6:59 AM | 107 (13.9%) | 95 (18.0%) |
| 7:00 AM to 7:29 AM | 131 (17.0%) | 66 (12.5%) |
| 7:30 AM to 7:59 AM | 164 (21.3%) | 120 (22.7%) |
| 8:00 AM to 8:29 AM | 110 (14.3%) | 30 (5.7%) |
| 8:30 AM to 8:59 AM | 26 (3.4%) | 49 (9.3%) |
| 9:00 AM to 9:59 AM | 19 (2.5%) | 12 (2.3%) |
| 10:00 AM to 10:59 AM | 28 (3.6%) | 28 (5.3%) |
| 11:00 AM to 11:59 AM | 0 (0.0%) | 4 (0.8%) |
| 12:00 PM to 3:59 PM | 10 (1.3%) | 29 (5.5%) |
| 4:00 PM to 11:59 PM | 12 (1.6%) | 25 (4.7%) |
| Total | 771 (100.0%) | 528 (100.0%) |
Housing Occupancy in Trego County
Occupancy by Ownership in Trego County
Of the total 1,308 dwellings in Trego County, owner-occupied units account for 1,073 (82.0%), while renter-occupied units make up 235 (18.0%).
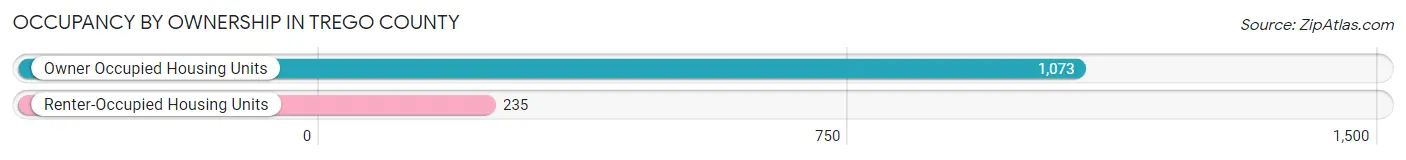
| Occupancy | # Housing Units | % Housing Units |
| Owner Occupied Housing Units | 1,073 | 82.0% |
| Renter-Occupied Housing Units | 235 | 18.0% |
| Total Occupied Housing Units | 1,308 | 100.0% |
Occupancy by Household Size in Trego County
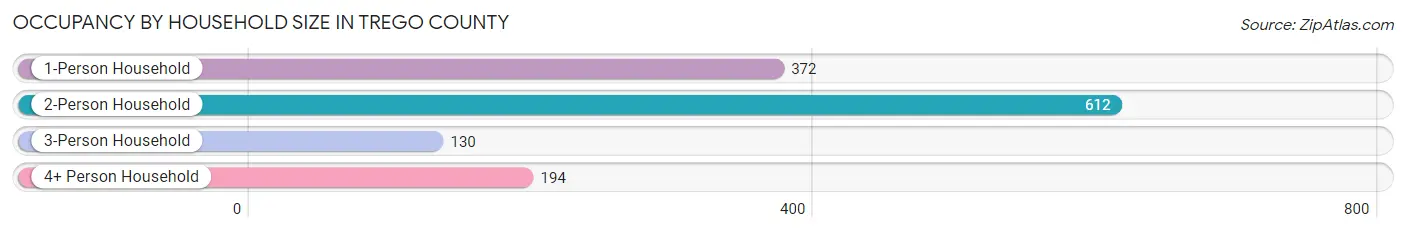
| Household Size | # Housing Units | % Housing Units |
| 1-Person Household | 372 | 28.4% |
| 2-Person Household | 612 | 46.8% |
| 3-Person Household | 130 | 9.9% |
| 4+ Person Household | 194 | 14.8% |
| Total Housing Units | 1,308 | 100.0% |
Occupancy by Ownership by Household Size in Trego County
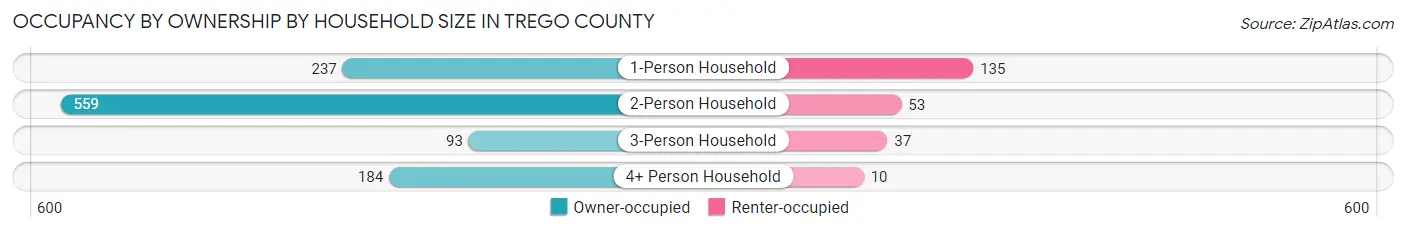
| Household Size | Owner-occupied | Renter-occupied |
| 1-Person Household | 237 (63.7%) | 135 (36.3%) |
| 2-Person Household | 559 (91.3%) | 53 (8.7%) |
| 3-Person Household | 93 (71.5%) | 37 (28.5%) |
| 4+ Person Household | 184 (94.9%) | 10 (5.1%) |
| Total Housing Units | 1,073 (82.0%) | 235 (18.0%) |
Occupancy by Educational Attainment in Trego County
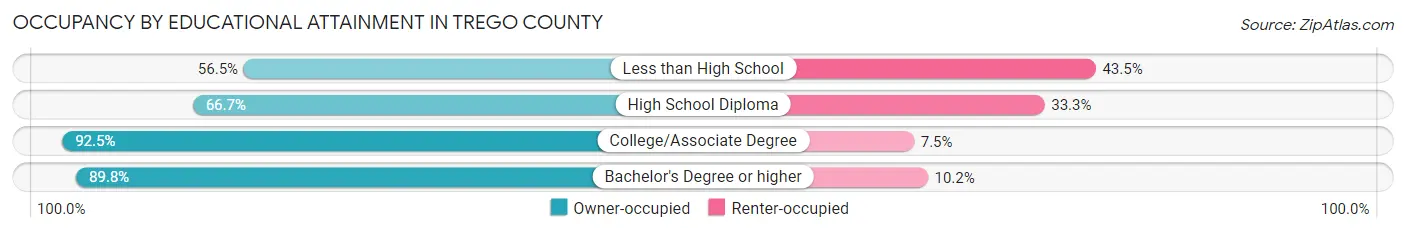
| Household Size | Owner-occupied | Renter-occupied |
| Less than High School | 52 (56.5%) | 40 (43.5%) |
| High School Diploma | 246 (66.7%) | 123 (33.3%) |
| College/Associate Degree | 484 (92.5%) | 39 (7.5%) |
| Bachelor's Degree or higher | 291 (89.8%) | 33 (10.2%) |
Occupancy by Age of Householder in Trego County
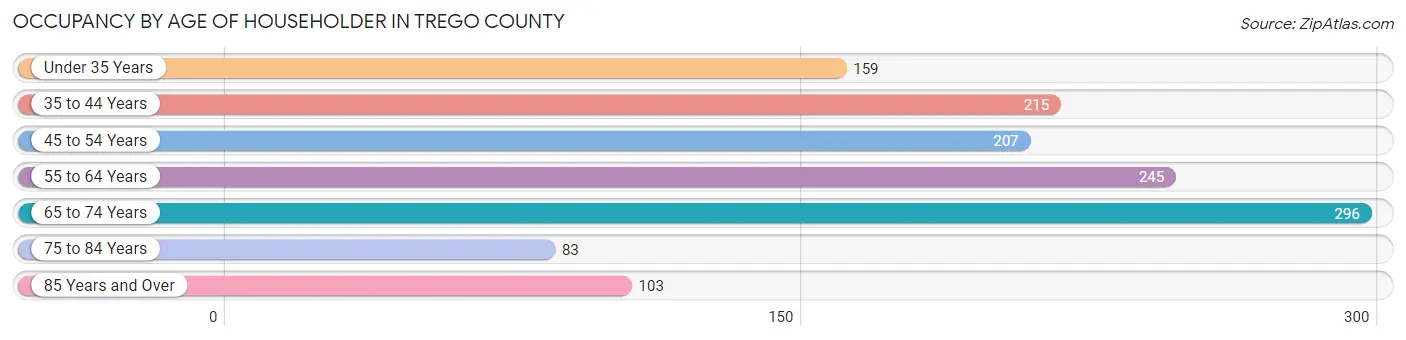
| Age Bracket | # Households | % Households |
| Under 35 Years | 159 | 12.2% |
| 35 to 44 Years | 215 | 16.4% |
| 45 to 54 Years | 207 | 15.8% |
| 55 to 64 Years | 245 | 18.7% |
| 65 to 74 Years | 296 | 22.6% |
| 75 to 84 Years | 83 | 6.4% |
| 85 Years and Over | 103 | 7.9% |
| Total | 1,308 | 100.0% |
Housing Finances in Trego County
Median Income by Occupancy in Trego County
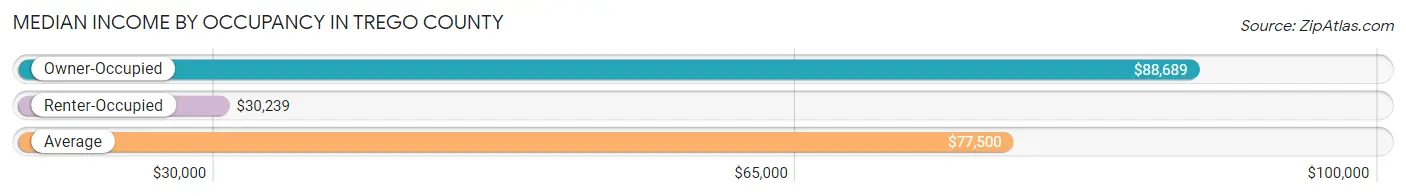
| Occupancy Type | # Households | Median Income |
| Owner-Occupied | 1,073 (82.0%) | $88,689 |
| Renter-Occupied | 235 (18.0%) | $30,239 |
| Average | 1,308 (100.0%) | $77,500 |
Occupancy by Householder Income Bracket in Trego County
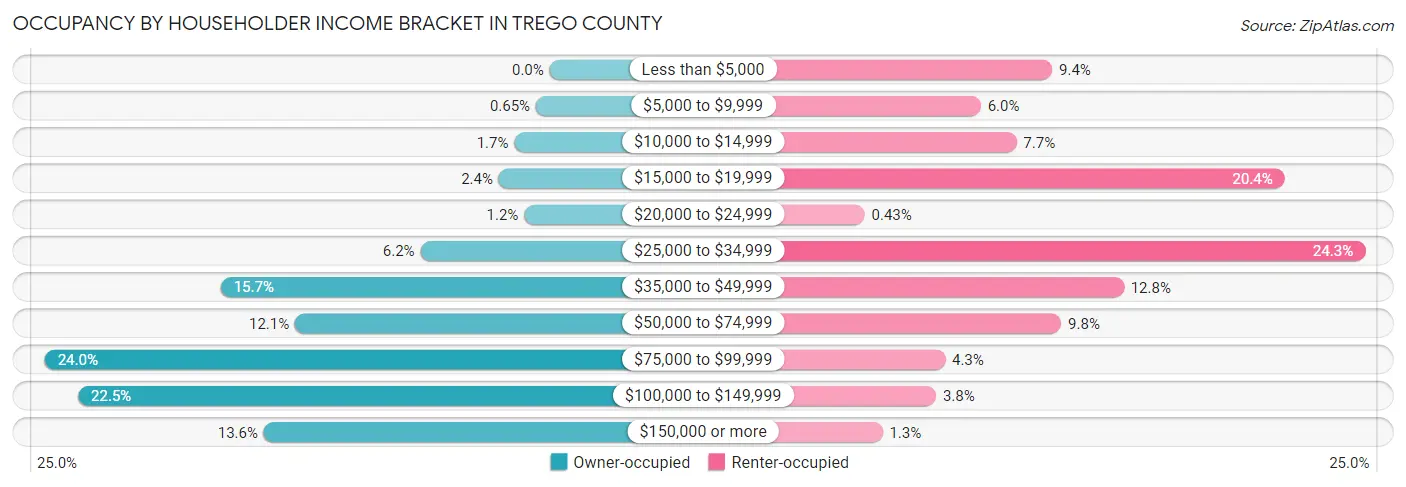
| Income Bracket | Owner-occupied | Renter-occupied |
| Less than $5,000 | 0 (0.0%) | 22 (9.4%) |
| $5,000 to $9,999 | 7 (0.6%) | 14 (6.0%) |
| $10,000 to $14,999 | 18 (1.7%) | 18 (7.7%) |
| $15,000 to $19,999 | 26 (2.4%) | 48 (20.4%) |
| $20,000 to $24,999 | 13 (1.2%) | 1 (0.4%) |
| $25,000 to $34,999 | 66 (6.1%) | 57 (24.3%) |
| $35,000 to $49,999 | 168 (15.7%) | 30 (12.8%) |
| $50,000 to $74,999 | 130 (12.1%) | 23 (9.8%) |
| $75,000 to $99,999 | 258 (24.0%) | 10 (4.3%) |
| $100,000 to $149,999 | 241 (22.5%) | 9 (3.8%) |
| $150,000 or more | 146 (13.6%) | 3 (1.3%) |
| Total | 1,073 (100.0%) | 235 (100.0%) |
Monthly Housing Cost Tiers in Trego County
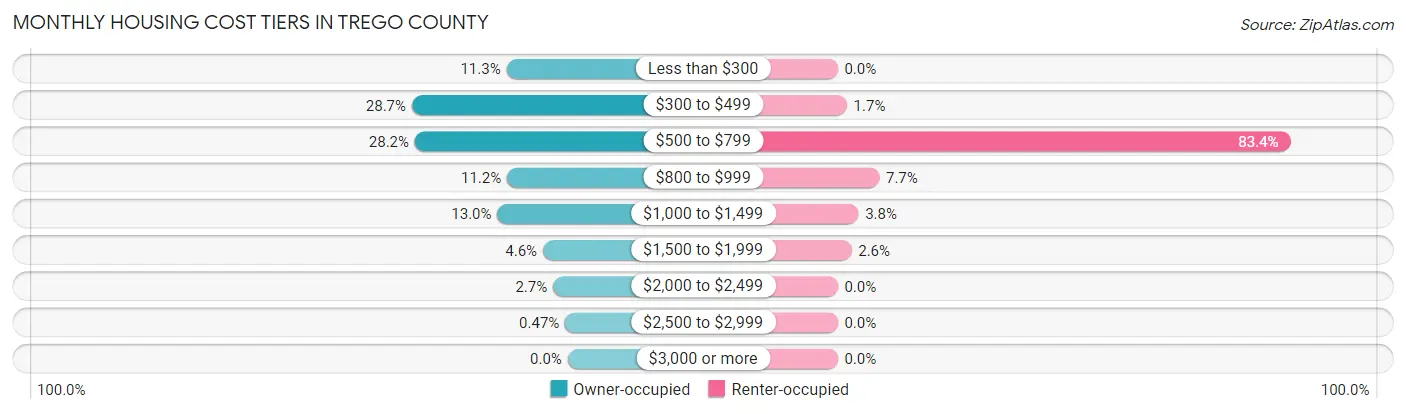
| Monthly Cost | Owner-occupied | Renter-occupied |
| Less than $300 | 121 (11.3%) | 0 (0.0%) |
| $300 to $499 | 308 (28.7%) | 4 (1.7%) |
| $500 to $799 | 302 (28.1%) | 196 (83.4%) |
| $800 to $999 | 120 (11.2%) | 18 (7.7%) |
| $1,000 to $1,499 | 139 (13.0%) | 9 (3.8%) |
| $1,500 to $1,999 | 49 (4.6%) | 6 (2.5%) |
| $2,000 to $2,499 | 29 (2.7%) | 0 (0.0%) |
| $2,500 to $2,999 | 5 (0.5%) | 0 (0.0%) |
| $3,000 or more | 0 (0.0%) | 0 (0.0%) |
| Total | 1,073 (100.0%) | 235 (100.0%) |
Physical Housing Characteristics in Trego County
Housing Structures in Trego County
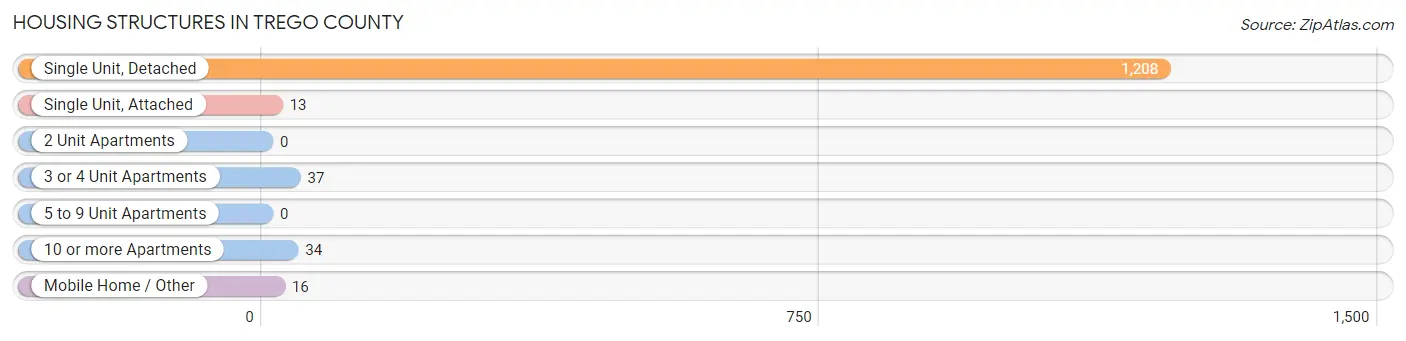
| Structure Type | # Housing Units | % Housing Units |
| Single Unit, Detached | 1,208 | 92.3% |
| Single Unit, Attached | 13 | 1.0% |
| 2 Unit Apartments | 0 | 0.0% |
| 3 or 4 Unit Apartments | 37 | 2.8% |
| 5 to 9 Unit Apartments | 0 | 0.0% |
| 10 or more Apartments | 34 | 2.6% |
| Mobile Home / Other | 16 | 1.2% |
| Total | 1,308 | 100.0% |
Housing Structures by Occupancy in Trego County
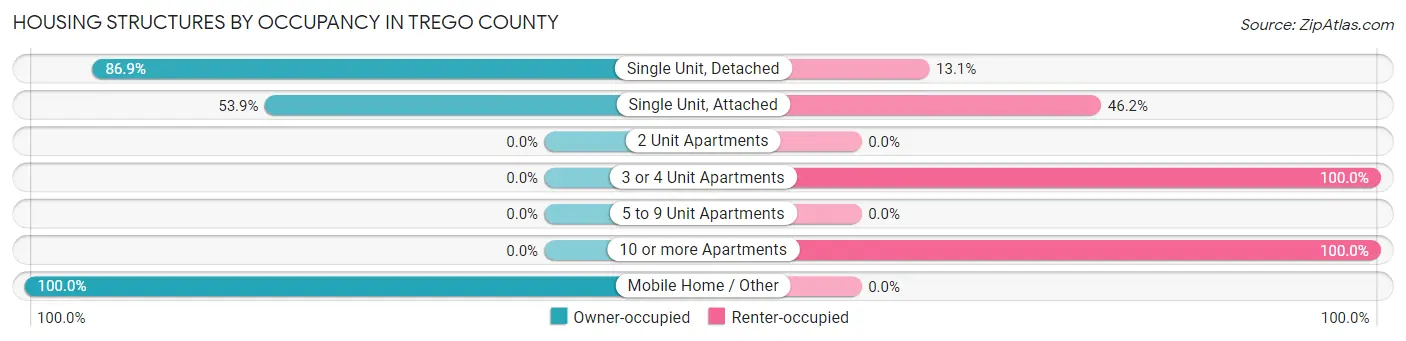
| Structure Type | Owner-occupied | Renter-occupied |
| Single Unit, Detached | 1,050 (86.9%) | 158 (13.1%) |
| Single Unit, Attached | 7 (53.8%) | 6 (46.2%) |
| 2 Unit Apartments | 0 (0.0%) | 0 (0.0%) |
| 3 or 4 Unit Apartments | 0 (0.0%) | 37 (100.0%) |
| 5 to 9 Unit Apartments | 0 (0.0%) | 0 (0.0%) |
| 10 or more Apartments | 0 (0.0%) | 34 (100.0%) |
| Mobile Home / Other | 16 (100.0%) | 0 (0.0%) |
| Total | 1,073 (82.0%) | 235 (18.0%) |
Housing Structures by Number of Rooms in Trego County
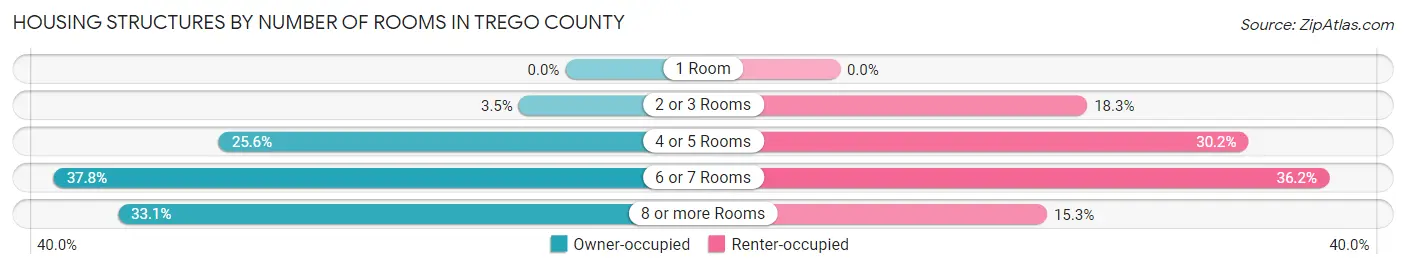
| Number of Rooms | Owner-occupied | Renter-occupied |
| 1 Room | 0 (0.0%) | 0 (0.0%) |
| 2 or 3 Rooms | 37 (3.5%) | 43 (18.3%) |
| 4 or 5 Rooms | 275 (25.6%) | 71 (30.2%) |
| 6 or 7 Rooms | 406 (37.8%) | 85 (36.2%) |
| 8 or more Rooms | 355 (33.1%) | 36 (15.3%) |
| Total | 1,073 (100.0%) | 235 (100.0%) |
Housing Structure by Heating Type in Trego County
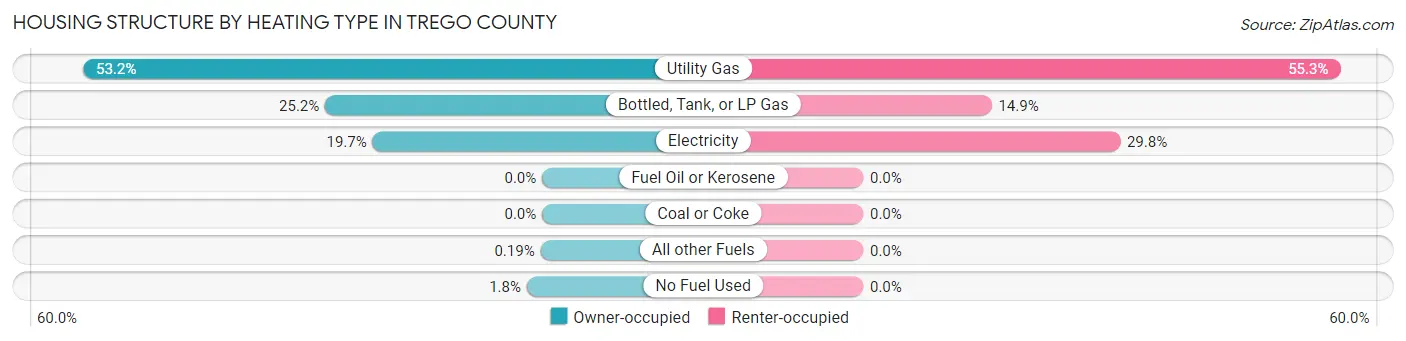
| Heating Type | Owner-occupied | Renter-occupied |
| Utility Gas | 571 (53.2%) | 130 (55.3%) |
| Bottled, Tank, or LP Gas | 270 (25.2%) | 35 (14.9%) |
| Electricity | 211 (19.7%) | 70 (29.8%) |
| Fuel Oil or Kerosene | 0 (0.0%) | 0 (0.0%) |
| Coal or Coke | 0 (0.0%) | 0 (0.0%) |
| All other Fuels | 2 (0.2%) | 0 (0.0%) |
| No Fuel Used | 19 (1.8%) | 0 (0.0%) |
| Total | 1,073 (100.0%) | 235 (100.0%) |
Household Vehicle Usage in Trego County
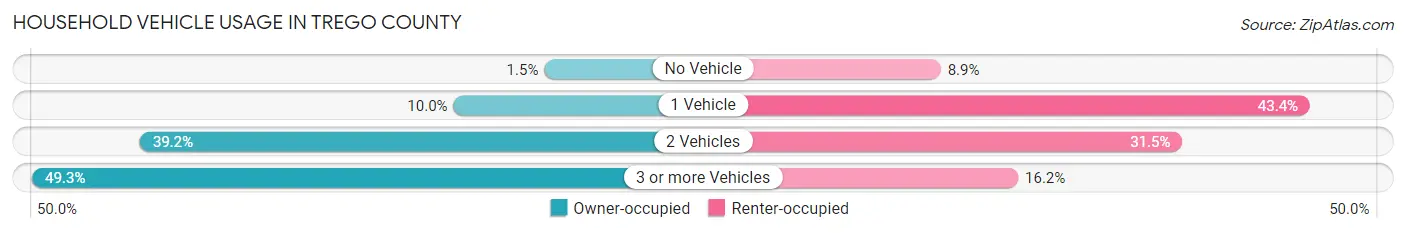
| Vehicles per Household | Owner-occupied | Renter-occupied |
| No Vehicle | 16 (1.5%) | 21 (8.9%) |
| 1 Vehicle | 107 (10.0%) | 102 (43.4%) |
| 2 Vehicles | 421 (39.2%) | 74 (31.5%) |
| 3 or more Vehicles | 529 (49.3%) | 38 (16.2%) |
| Total | 1,073 (100.0%) | 235 (100.0%) |
Real Estate & Mortgages in Trego County
Real Estate and Mortgage Overview in Trego County
| Characteristic | Without Mortgage | With Mortgage |
| Housing Units | 770 | 303 |
| Median Property Value | $109,900 | $124,800 |
| Median Household Income | $87,679 | $111 |
| Monthly Housing Costs | $475 | $0 |
| Real Estate Taxes | $1,516 | $7 |
Property Value by Mortgage Status in Trego County
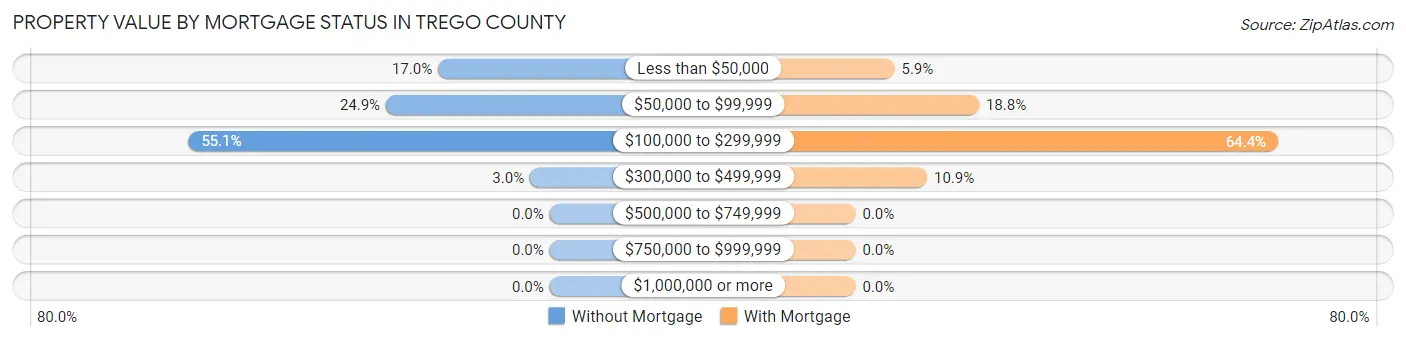
| Property Value | Without Mortgage | With Mortgage |
| Less than $50,000 | 131 (17.0%) | 18 (5.9%) |
| $50,000 to $99,999 | 192 (24.9%) | 57 (18.8%) |
| $100,000 to $299,999 | 424 (55.1%) | 195 (64.4%) |
| $300,000 to $499,999 | 23 (3.0%) | 33 (10.9%) |
| $500,000 to $749,999 | 0 (0.0%) | 0 (0.0%) |
| $750,000 to $999,999 | 0 (0.0%) | 0 (0.0%) |
| $1,000,000 or more | 0 (0.0%) | 0 (0.0%) |
| Total | 770 (100.0%) | 303 (100.0%) |
Household Income by Mortgage Status in Trego County
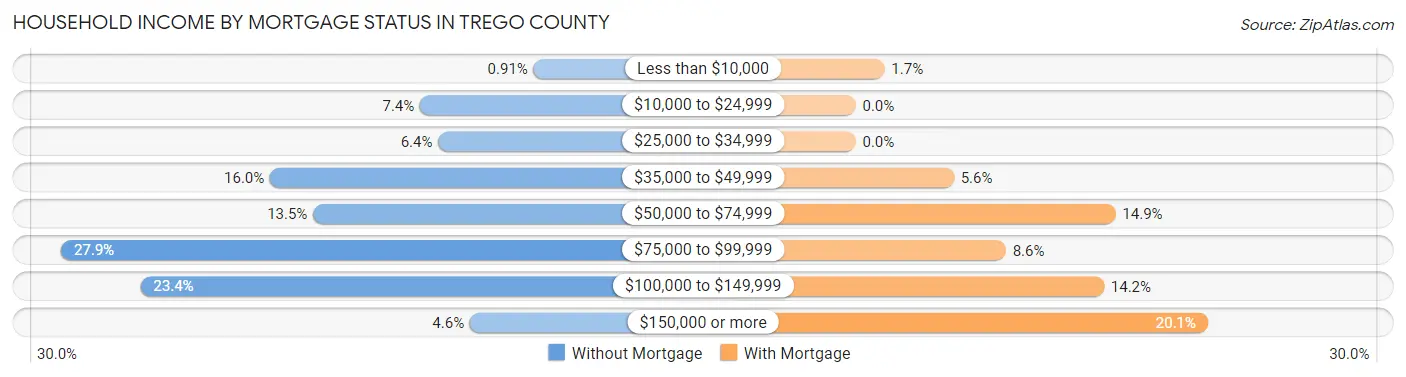
| Household Income | Without Mortgage | With Mortgage |
| Less than $10,000 | 7 (0.9%) | 5 (1.7%) |
| $10,000 to $24,999 | 57 (7.4%) | 0 (0.0%) |
| $25,000 to $34,999 | 49 (6.4%) | 0 (0.0%) |
| $35,000 to $49,999 | 123 (16.0%) | 17 (5.6%) |
| $50,000 to $74,999 | 104 (13.5%) | 45 (14.8%) |
| $75,000 to $99,999 | 215 (27.9%) | 26 (8.6%) |
| $100,000 to $149,999 | 180 (23.4%) | 43 (14.2%) |
| $150,000 or more | 35 (4.5%) | 61 (20.1%) |
| Total | 770 (100.0%) | 303 (100.0%) |
Property Value to Household Income Ratio in Trego County
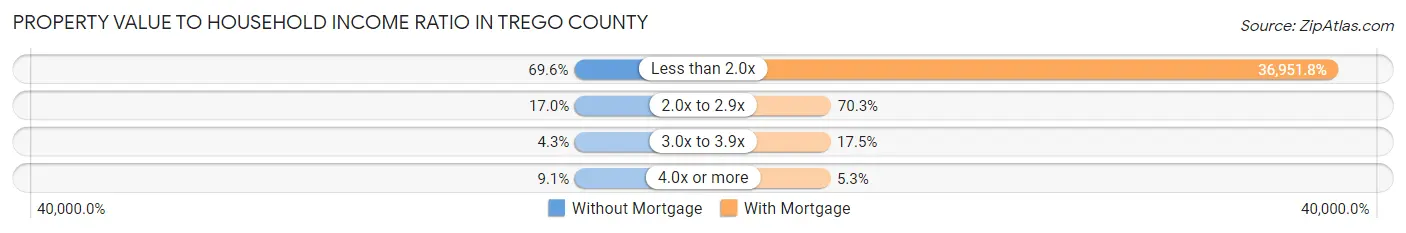
| Value-to-Income Ratio | Without Mortgage | With Mortgage |
| Less than 2.0x | 536 (69.6%) | 111,964 (36,951.8%) |
| 2.0x to 2.9x | 131 (17.0%) | 213 (70.3%) |
| 3.0x to 3.9x | 33 (4.3%) | 53 (17.5%) |
| 4.0x or more | 70 (9.1%) | 16 (5.3%) |
| Total | 770 (100.0%) | 303 (100.0%) |
Real Estate Taxes by Mortgage Status in Trego County
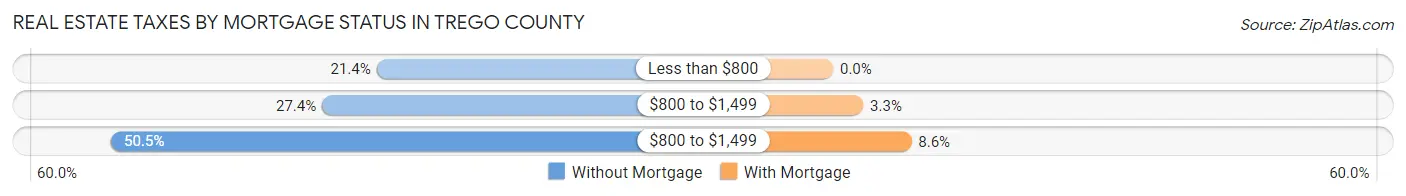
| Property Taxes | Without Mortgage | With Mortgage |
| Less than $800 | 165 (21.4%) | 0 (0.0%) |
| $800 to $1,499 | 211 (27.4%) | 10 (3.3%) |
| $800 to $1,499 | 389 (50.5%) | 26 (8.6%) |
| Total | 770 (100.0%) | 303 (100.0%) |
Health & Disability in Trego County
Health Insurance Coverage by Age in Trego County
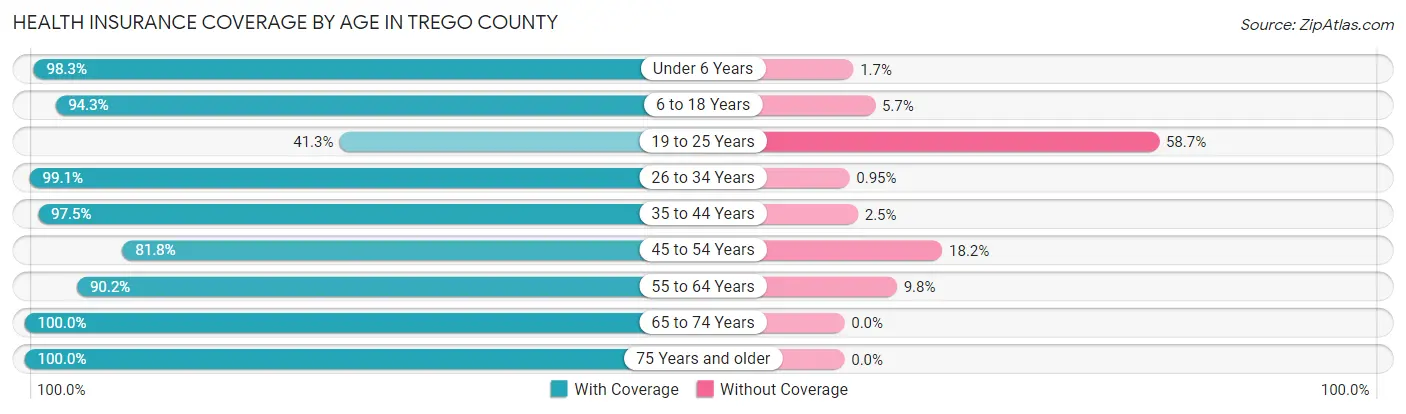
| Age Bracket | With Coverage | Without Coverage |
| Under 6 Years | 177 (98.3%) | 3 (1.7%) |
| 6 to 18 Years | 346 (94.3%) | 21 (5.7%) |
| 19 to 25 Years | 50 (41.3%) | 71 (58.7%) |
| 26 to 34 Years | 208 (99.1%) | 2 (0.9%) |
| 35 to 44 Years | 350 (97.5%) | 9 (2.5%) |
| 45 to 54 Years | 269 (81.8%) | 60 (18.2%) |
| 55 to 64 Years | 397 (90.2%) | 43 (9.8%) |
| 65 to 74 Years | 440 (100.0%) | 0 (0.0%) |
| 75 Years and older | 279 (100.0%) | 0 (0.0%) |
| Total | 2,516 (92.3%) | 209 (7.7%) |
Health Insurance Coverage by Citizenship Status in Trego County
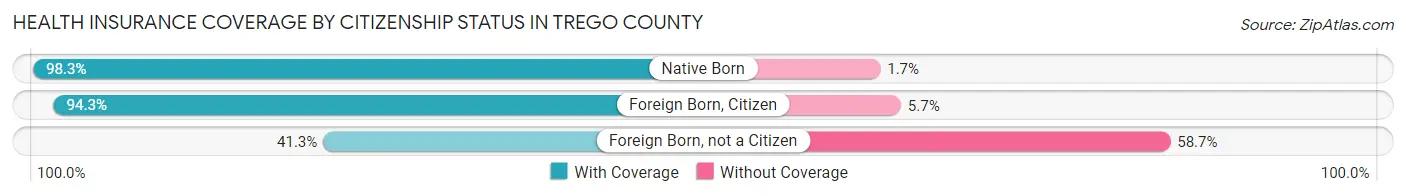
| Citizenship Status | With Coverage | Without Coverage |
| Native Born | 177 (98.3%) | 3 (1.7%) |
| Foreign Born, Citizen | 346 (94.3%) | 21 (5.7%) |
| Foreign Born, not a Citizen | 50 (41.3%) | 71 (58.7%) |
Health Insurance Coverage by Household Income in Trego County
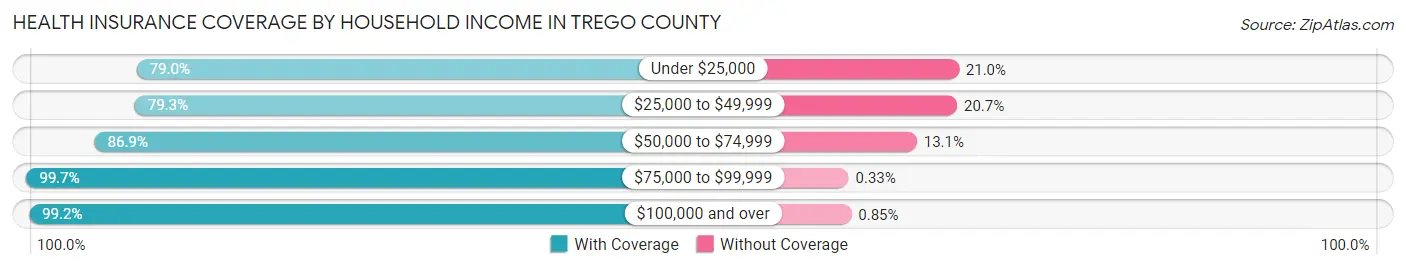
| Household Income | With Coverage | Without Coverage |
| Under $25,000 | 158 (79.0%) | 42 (21.0%) |
| $25,000 to $49,999 | 434 (79.3%) | 113 (20.7%) |
| $50,000 to $74,999 | 278 (86.9%) | 42 (13.1%) |
| $75,000 to $99,999 | 596 (99.7%) | 2 (0.3%) |
| $100,000 and over | 1,047 (99.2%) | 9 (0.9%) |
Public vs Private Health Insurance Coverage by Age in Trego County
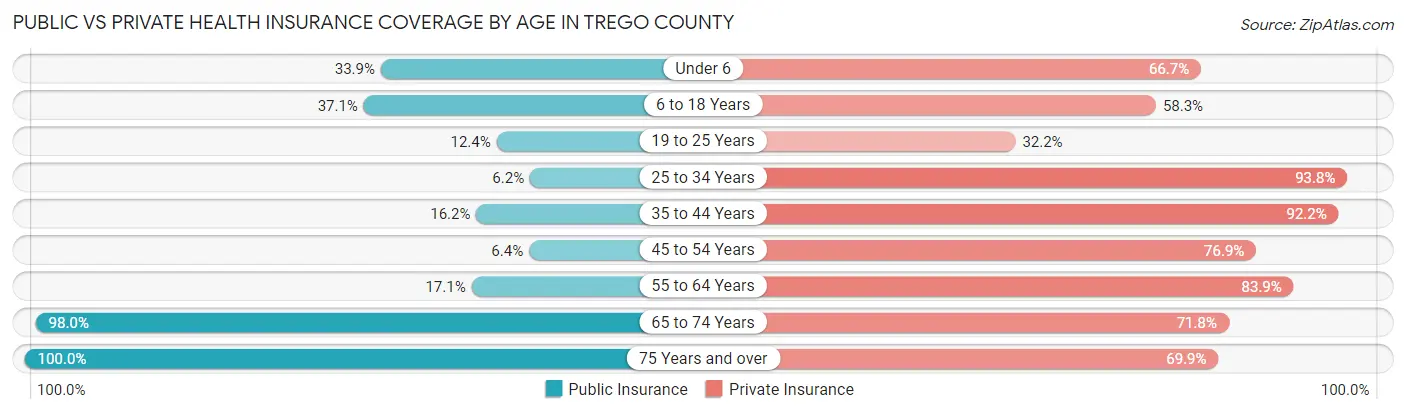
| Age Bracket | Public Insurance | Private Insurance |
| Under 6 | 61 (33.9%) | 120 (66.7%) |
| 6 to 18 Years | 136 (37.1%) | 214 (58.3%) |
| 19 to 25 Years | 15 (12.4%) | 39 (32.2%) |
| 25 to 34 Years | 13 (6.2%) | 197 (93.8%) |
| 35 to 44 Years | 58 (16.2%) | 331 (92.2%) |
| 45 to 54 Years | 21 (6.4%) | 253 (76.9%) |
| 55 to 64 Years | 75 (17.1%) | 369 (83.9%) |
| 65 to 74 Years | 431 (98.0%) | 316 (71.8%) |
| 75 Years and over | 279 (100.0%) | 195 (69.9%) |
| Total | 1,089 (40.0%) | 2,034 (74.6%) |
Disability Status by Sex by Age in Trego County
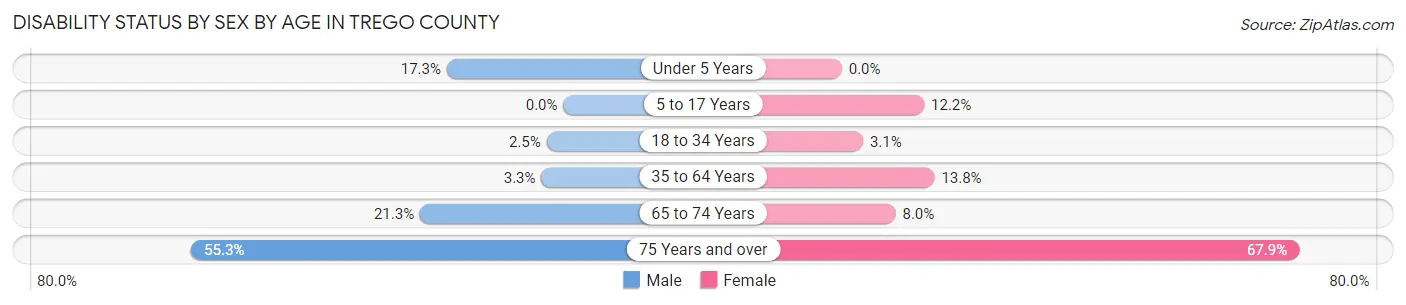
| Age Bracket | Male | Female |
| Under 5 Years | 18 (17.3%) | 0 (0.0%) |
| 5 to 17 Years | 0 (0.0%) | 22 (12.2%) |
| 18 to 34 Years | 5 (2.5%) | 5 (3.1%) |
| 35 to 64 Years | 19 (3.3%) | 75 (13.8%) |
| 65 to 74 Years | 43 (21.3%) | 19 (8.0%) |
| 75 Years and over | 63 (55.3%) | 112 (67.9%) |
Disability Class by Sex by Age in Trego County
Disability Class: Hearing Difficulty
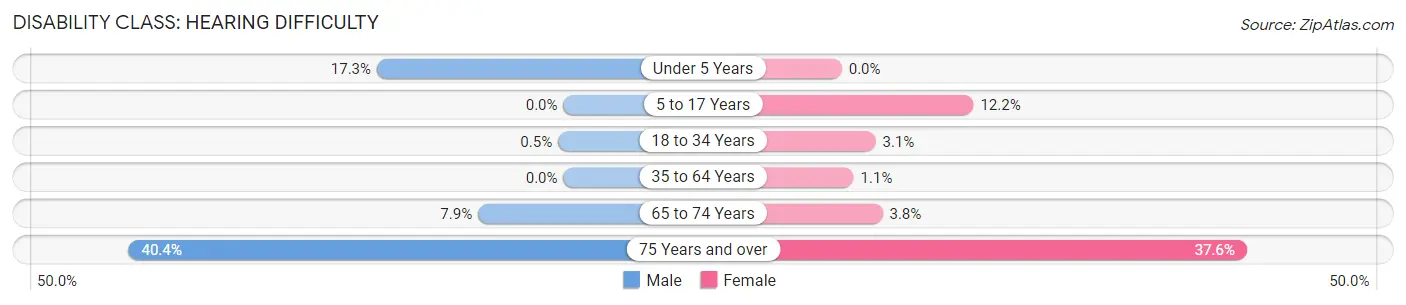
| Age Bracket | Male | Female |
| Under 5 Years | 18 (17.3%) | 0 (0.0%) |
| 5 to 17 Years | 0 (0.0%) | 22 (12.2%) |
| 18 to 34 Years | 1 (0.5%) | 5 (3.1%) |
| 35 to 64 Years | 0 (0.0%) | 6 (1.1%) |
| 65 to 74 Years | 16 (7.9%) | 9 (3.8%) |
| 75 Years and over | 46 (40.4%) | 62 (37.6%) |
Disability Class: Vision Difficulty
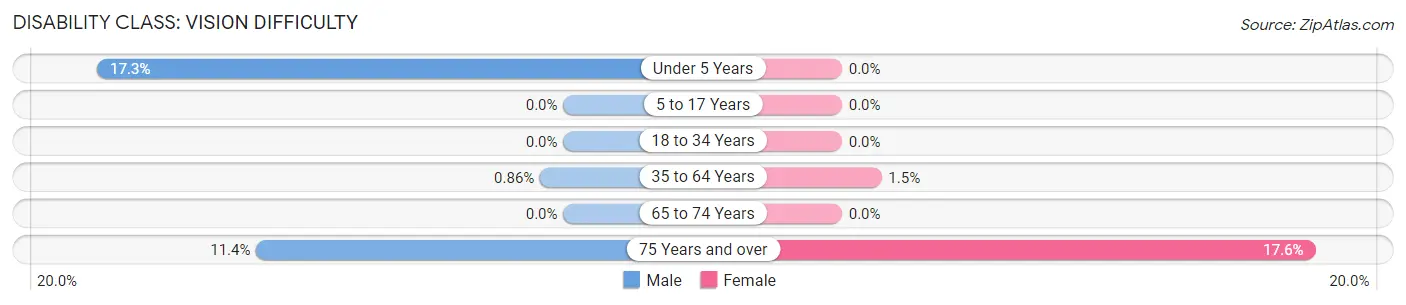
| Age Bracket | Male | Female |
| Under 5 Years | 18 (17.3%) | 0 (0.0%) |
| 5 to 17 Years | 0 (0.0%) | 0 (0.0%) |
| 18 to 34 Years | 0 (0.0%) | 0 (0.0%) |
| 35 to 64 Years | 5 (0.9%) | 8 (1.5%) |
| 65 to 74 Years | 0 (0.0%) | 0 (0.0%) |
| 75 Years and over | 13 (11.4%) | 29 (17.6%) |
Disability Class: Cognitive Difficulty
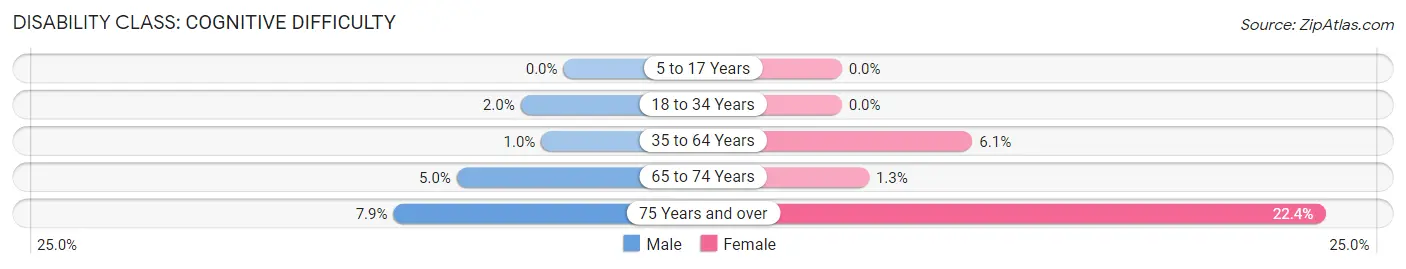
| Age Bracket | Male | Female |
| 5 to 17 Years | 0 (0.0%) | 0 (0.0%) |
| 18 to 34 Years | 4 (2.0%) | 0 (0.0%) |
| 35 to 64 Years | 6 (1.0%) | 33 (6.1%) |
| 65 to 74 Years | 10 (5.0%) | 3 (1.3%) |
| 75 Years and over | 9 (7.9%) | 37 (22.4%) |
Disability Class: Ambulatory Difficulty
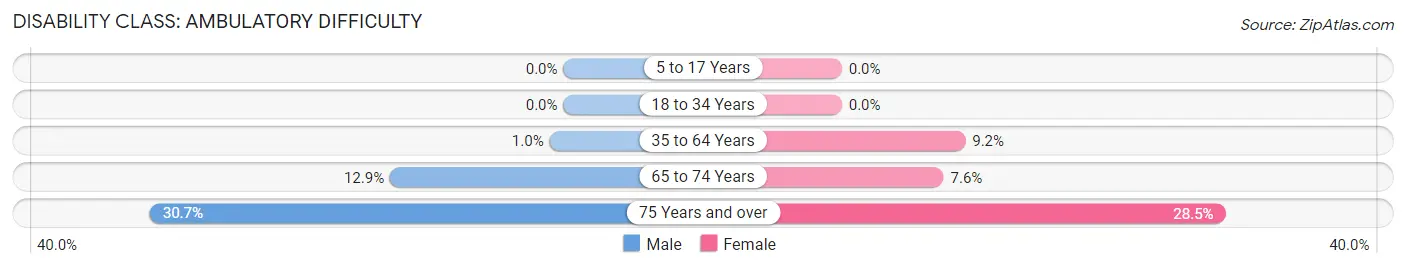
| Age Bracket | Male | Female |
| 5 to 17 Years | 0 (0.0%) | 0 (0.0%) |
| 18 to 34 Years | 0 (0.0%) | 0 (0.0%) |
| 35 to 64 Years | 6 (1.0%) | 50 (9.2%) |
| 65 to 74 Years | 26 (12.9%) | 18 (7.6%) |
| 75 Years and over | 35 (30.7%) | 47 (28.5%) |
Disability Class: Self-Care Difficulty
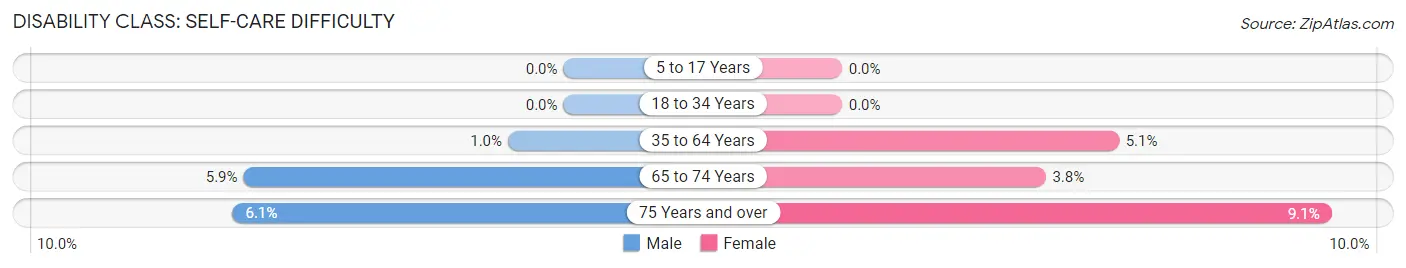
| Age Bracket | Male | Female |
| 5 to 17 Years | 0 (0.0%) | 0 (0.0%) |
| 18 to 34 Years | 0 (0.0%) | 0 (0.0%) |
| 35 to 64 Years | 6 (1.0%) | 28 (5.1%) |
| 65 to 74 Years | 12 (5.9%) | 9 (3.8%) |
| 75 Years and over | 7 (6.1%) | 15 (9.1%) |
Technology Access in Trego County
Computing Device Access in Trego County
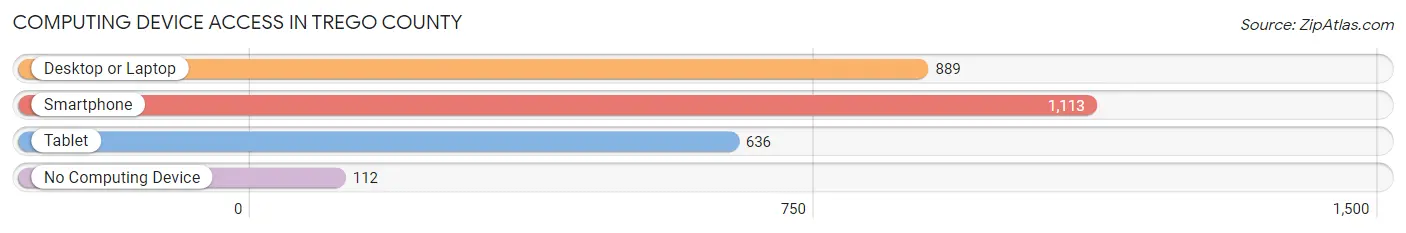
| Device Type | # Households | % Households |
| Desktop or Laptop | 889 | 68.0% |
| Smartphone | 1,113 | 85.1% |
| Tablet | 636 | 48.6% |
| No Computing Device | 112 | 8.6% |
| Total | 1,308 | 100.0% |
Internet Access in Trego County
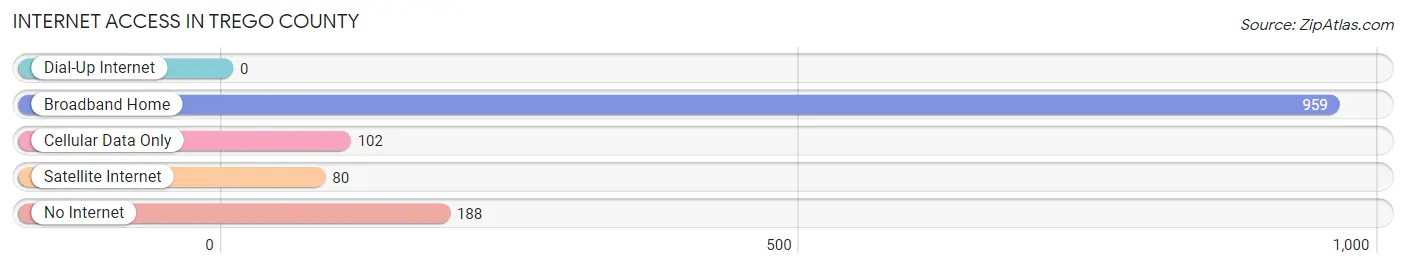
| Internet Type | # Households | % Households |
| Dial-Up Internet | 0 | 0.0% |
| Broadband Home | 959 | 73.3% |
| Cellular Data Only | 102 | 7.8% |
| Satellite Internet | 80 | 6.1% |
| No Internet | 188 | 14.4% |
| Total | 1,308 | 100.0% |
Trego County Summary
Trego County is located in the northwest corner of Kansas, and is bordered by Ellis, Gove, Graham, Ness, and Rooks counties. The county seat is WaKeeney, and the county was named after Edward F. Trego, a Union Army officer who was killed in the Civil War. The county has a total area of 890 square miles, and a population of 3,902 as of the 2010 census.
Geography
Trego County is located in the High Plains region of Kansas, and is characterized by rolling hills and flat plains. The county is drained by the Smoky Hill River, which flows through the county from east to west. The county is also home to several small lakes, including Cedar Bluff Reservoir, which is located in the northern part of the county. The county is mostly rural, with the majority of the population living in small towns and rural areas.
Climate
Trego County has a semi-arid climate, with hot summers and cold winters. The average annual temperature is 54 degrees Fahrenheit, and the average annual precipitation is 22 inches. The county is prone to severe weather, including tornadoes, hail, and thunderstorms.
Economy
Trego County's economy is largely based on agriculture, with wheat, corn, and sorghum being the main crops. The county is also home to several oil and gas fields, and is a major producer of oil and natural gas. Other industries in the county include manufacturing, retail, and tourism.
Demographics
As of the 2010 census, Trego County had a population of 3,902. The racial makeup of the county was 95.3% White, 0.3% African American, 0.7% Native American, 0.2% Asian, 0.1% Pacific Islander, 1.7% from other races, and 1.9% from two or more races. Hispanic or Latino of any race were 4.2% of the population.
The median income for a household in the county was $41,944, and the median income for a family was $50,938. The per capita income for the county was $20,845. About 11.2% of families and 14.2% of the population were below the poverty line, including 19.2% of those under age 18 and 8.2% of those age 65 or over.
Trego County is served by several school districts, including WaKeeney USD 272, Trego Community USD 273, and Ogallah USD 274. The county is also home to several higher education institutions, including Fort Hays State University, Kansas State University, and the University of Kansas.
Trego County is a rural county with a strong agricultural base. The county is home to a diverse population, and is served by several school districts and higher education institutions. The county has a semi-arid climate, and is prone to severe weather. The economy is largely based on agriculture, oil and gas production, and manufacturing.
Common Questions
What is Per Capita Income in Trego County?
Per Capita income in Trego County is $42,029.
What is the Median Family Income in Trego County?
Median Family Income in Trego County is $89,593.
What is the Median Household income in Trego County?
Median Household Income in Trego County is $77,500.
What is Income or Wage Gap in Trego County?
Income or Wage Gap in Trego County is 33.1%.
Women in Trego County earn 66.9 cents for every dollar earned by a man.
What is Inequality or Gini Index in Trego County?
Inequality or Gini Index in Trego County is 0.42.
What is the Total Population of Trego County?
Total Population of Trego County is 2,798.
What is the Total Male Population of Trego County?
Total Male Population of Trego County is 1,410.
What is the Total Female Population of Trego County?
Total Female Population of Trego County is 1,388.
What is the Ratio of Males per 100 Females in Trego County?
There are 101.59 Males per 100 Females in Trego County.
What is the Ratio of Females per 100 Males in Trego County?
There are 98.44 Females per 100 Males in Trego County.
What is the Median Population Age in Trego County?
Median Population Age in Trego County is 47.8 Years.
What is the Average Family Size in Trego County
Average Family Size in Trego County is 2.5 People.
What is the Average Household Size in Trego County
Average Household Size in Trego County is 2.1 People.
How Large is the Labor Force in Trego County?
There are 1,448 People in the Labor Forcein in Trego County.
What is the Percentage of People in the Labor Force in Trego County?
62.5% of People are in the Labor Force in Trego County.
What is the Unemployment Rate in Trego County?
Unemployment Rate in Trego County is 2.6%.