Sherman County, KS Map & Demographics
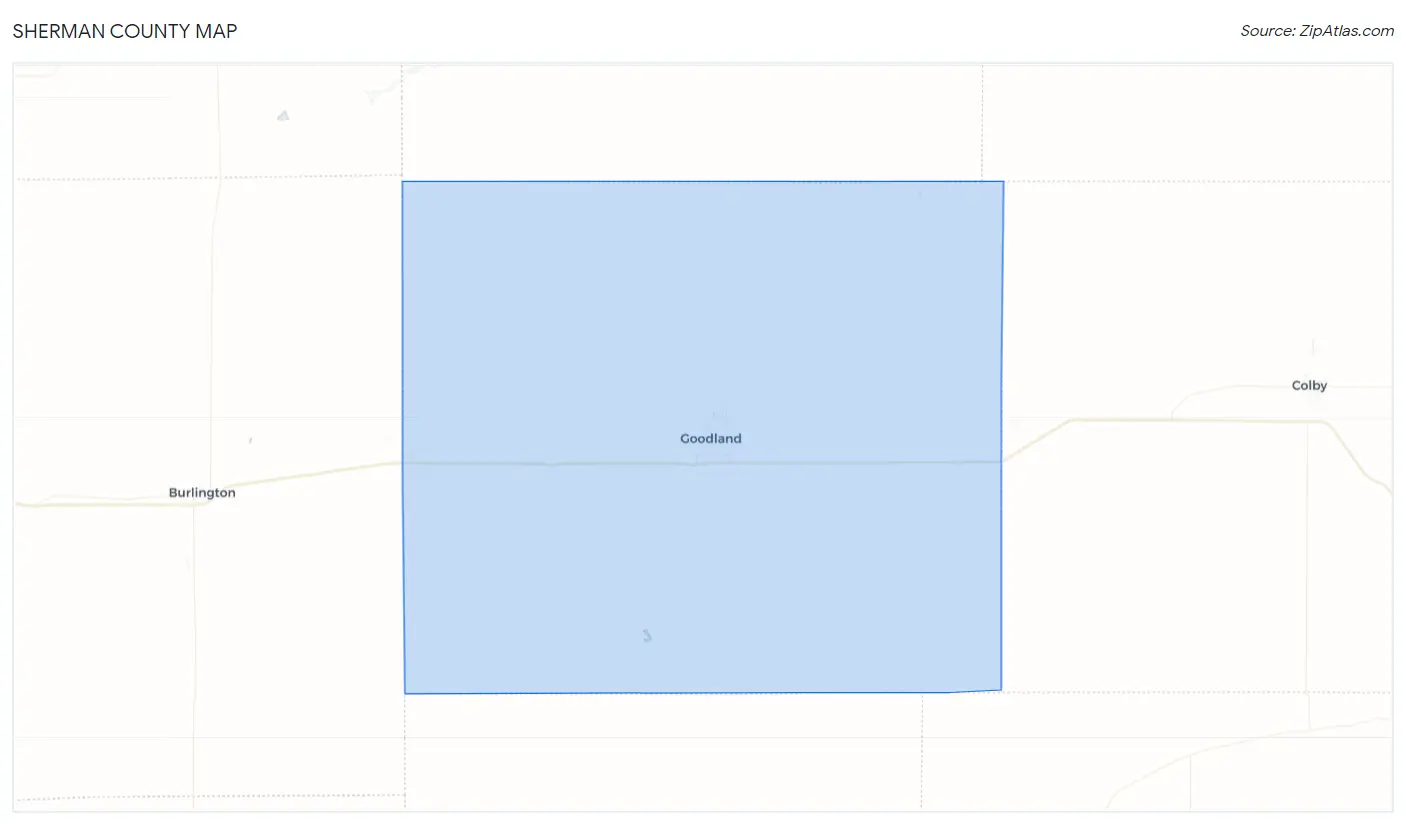
Sherman County Map
Sherman County Overview
$37,930
PER CAPITA INCOME
$73,530
AVG FAMILY INCOME
$61,404
AVG HOUSEHOLD INCOME
42.2%
WAGE / INCOME GAP [ % ]
57.8¢/ $1
WAGE / INCOME GAP [ $ ]
0.50
INEQUALITY / GINI INDEX
5,940
TOTAL POPULATION
3,136
MALE POPULATION
2,804
FEMALE POPULATION
111.84
MALES / 100 FEMALES
89.41
FEMALES / 100 MALES
38.0
MEDIAN AGE
3.2
AVG FAMILY SIZE
2.4
AVG HOUSEHOLD SIZE
3,126
LABOR FORCE [ PEOPLE ]
65.6%
PERCENT IN LABOR FORCE
2.4%
UNEMPLOYMENT RATE
Sherman County Area Codes
Income in Sherman County
Income Overview in Sherman County
Per Capita Income in Sherman County is $37,930, while median incomes of families and households are $73,530 and $61,404 respectively.
| Characteristic | Number | Measure |
| Per Capita Income | 5,940 | $37,930 |
| Median Family Income | 1,431 | $73,530 |
| Mean Family Income | 1,431 | $101,318 |
| Median Household Income | 2,317 | $61,404 |
| Mean Household Income | 2,317 | $89,437 |
| Income Deficit | 1,431 | $0 |
| Wage / Income Gap (%) | 5,940 | 42.22% |
| Wage / Income Gap ($) | 5,940 | 57.78¢ per $1 |
| Gini / Inequality Index | 5,940 | 0.50 |
Earnings by Sex in Sherman County
Average Earnings in Sherman County are $33,154, $41,995 for men and $24,263 for women, a difference of 42.2%.
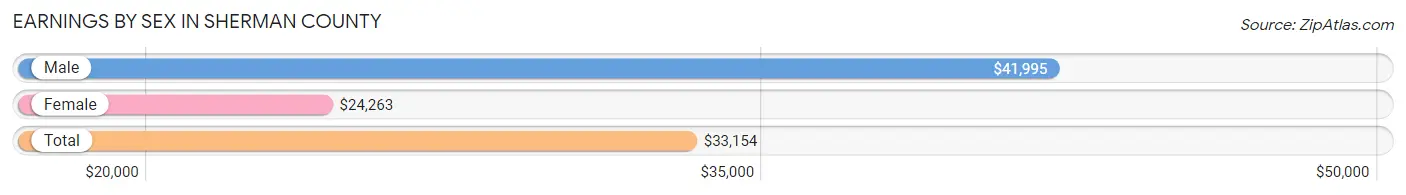
| Sex | Number | Average Earnings |
| Male | 1,787 (53.1%) | $41,995 |
| Female | 1,575 (46.9%) | $24,263 |
| Total | 3,362 (100.0%) | $33,154 |
Earnings by Sex by Income Bracket in Sherman County
The most common earnings brackets in Sherman County are $75,000 to $99,999 for men (261 | 14.6%) and $65,000 to $74,999 for women (208 | 13.2%).
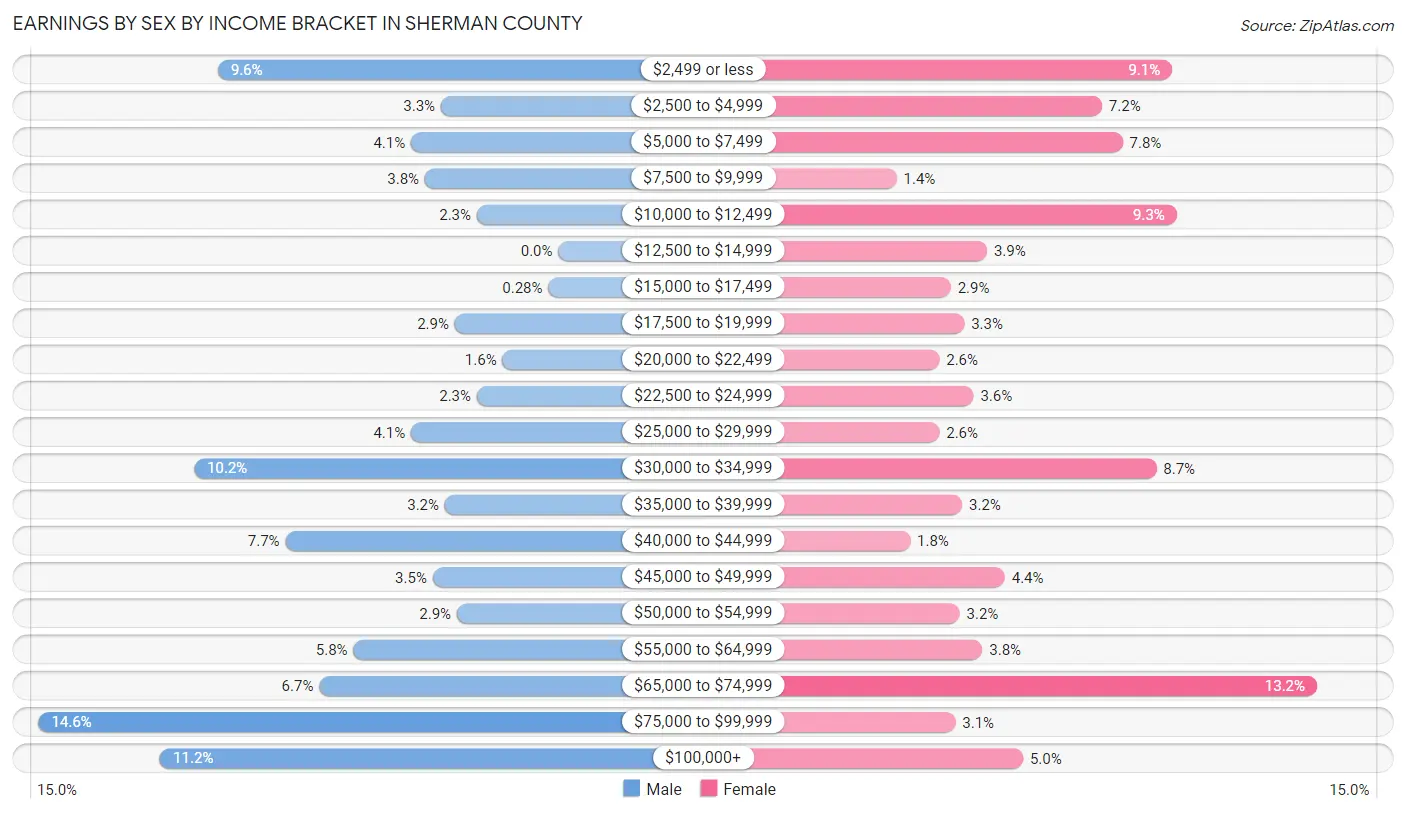
| Income | Male | Female |
| $2,499 or less | 171 (9.6%) | 144 (9.1%) |
| $2,500 to $4,999 | 59 (3.3%) | 113 (7.2%) |
| $5,000 to $7,499 | 74 (4.1%) | 122 (7.7%) |
| $7,500 to $9,999 | 67 (3.7%) | 22 (1.4%) |
| $10,000 to $12,499 | 41 (2.3%) | 146 (9.3%) |
| $12,500 to $14,999 | 0 (0.0%) | 62 (3.9%) |
| $15,000 to $17,499 | 5 (0.3%) | 46 (2.9%) |
| $17,500 to $19,999 | 52 (2.9%) | 52 (3.3%) |
| $20,000 to $22,499 | 28 (1.6%) | 41 (2.6%) |
| $22,500 to $24,999 | 41 (2.3%) | 56 (3.6%) |
| $25,000 to $29,999 | 74 (4.1%) | 41 (2.6%) |
| $30,000 to $34,999 | 183 (10.2%) | 137 (8.7%) |
| $35,000 to $39,999 | 57 (3.2%) | 51 (3.2%) |
| $40,000 to $44,999 | 137 (7.7%) | 28 (1.8%) |
| $45,000 to $49,999 | 63 (3.5%) | 70 (4.4%) |
| $50,000 to $54,999 | 51 (2.9%) | 50 (3.2%) |
| $55,000 to $64,999 | 103 (5.8%) | 60 (3.8%) |
| $65,000 to $74,999 | 120 (6.7%) | 208 (13.2%) |
| $75,000 to $99,999 | 261 (14.6%) | 48 (3.0%) |
| $100,000+ | 200 (11.2%) | 78 (5.0%) |
| Total | 1,787 (100.0%) | 1,575 (100.0%) |
Earnings by Sex by Educational Attainment in Sherman County
Average earnings in Sherman County are $55,096 for men and $33,995 for women, a difference of 38.3%. Men with an educational attainment of graduate degree enjoy the highest average annual earnings of $76,625, while those with less than high school education earn the least with $42,969. Women with an educational attainment of graduate degree earn the most with the average annual earnings of $65,632, while those with less than high school education have the smallest earnings of $11,483.
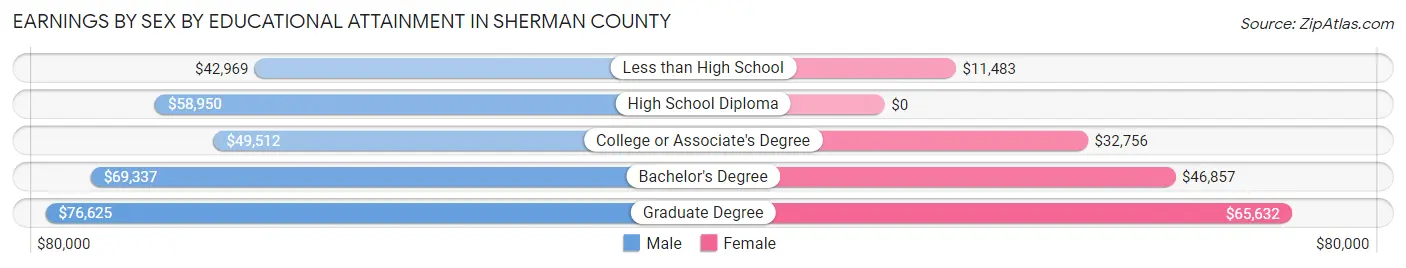
| Educational Attainment | Male Income | Female Income |
| Less than High School | $42,969 | $11,483 |
| High School Diploma | $58,950 | $0 |
| College or Associate's Degree | $49,512 | $32,756 |
| Bachelor's Degree | $69,337 | $46,857 |
| Graduate Degree | $76,625 | $65,632 |
| Total | $55,096 | $33,995 |
Family Income in Sherman County
Family Income Brackets in Sherman County
According to the Sherman County family income data, there are 322 families falling into the $50,000 to $74,999 income range, which is the most common income bracket and makes up 22.5% of all families. Conversely, the $15,000 to $24,999 income bracket is the least frequent group with only 31 families (2.2%) belonging to this category.
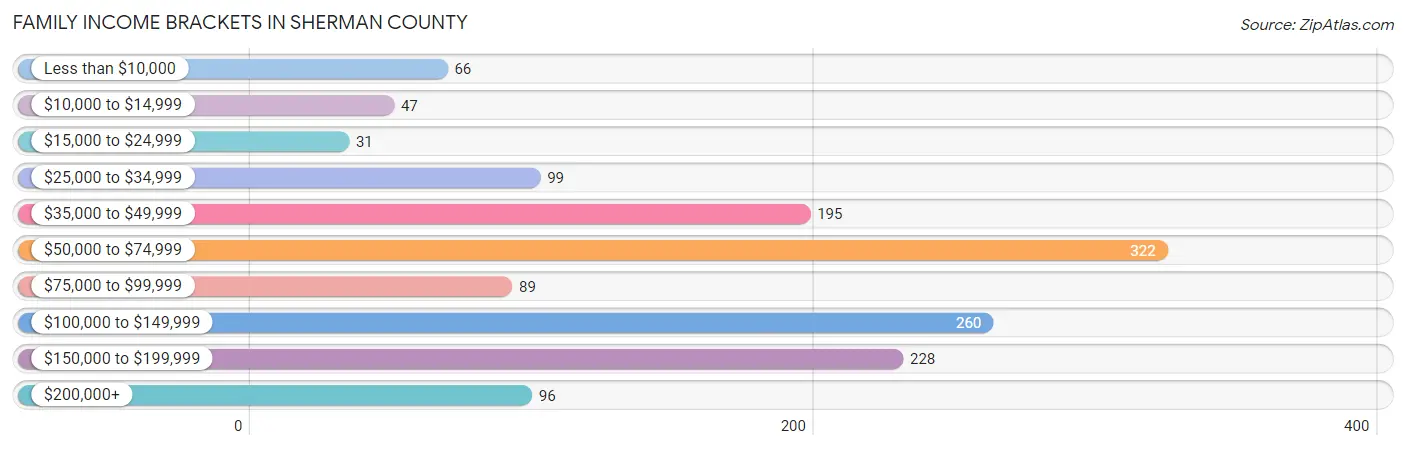
| Income Bracket | # Families | % Families |
| Less than $10,000 | 66 | 4.6% |
| $10,000 to $14,999 | 47 | 3.3% |
| $15,000 to $24,999 | 31 | 2.2% |
| $25,000 to $34,999 | 99 | 6.9% |
| $35,000 to $49,999 | 195 | 13.6% |
| $50,000 to $74,999 | 322 | 22.5% |
| $75,000 to $99,999 | 89 | 6.2% |
| $100,000 to $149,999 | 260 | 18.2% |
| $150,000 to $199,999 | 228 | 15.9% |
| $200,000+ | 96 | 6.7% |
Family Income by Famaliy Size in Sherman County
5-person families (30 | 2.1%) account for the highest median family income in Sherman County with $250,001 per family, while 5-person families (30 | 2.1%) have the highest median income of $50,000 per family member.
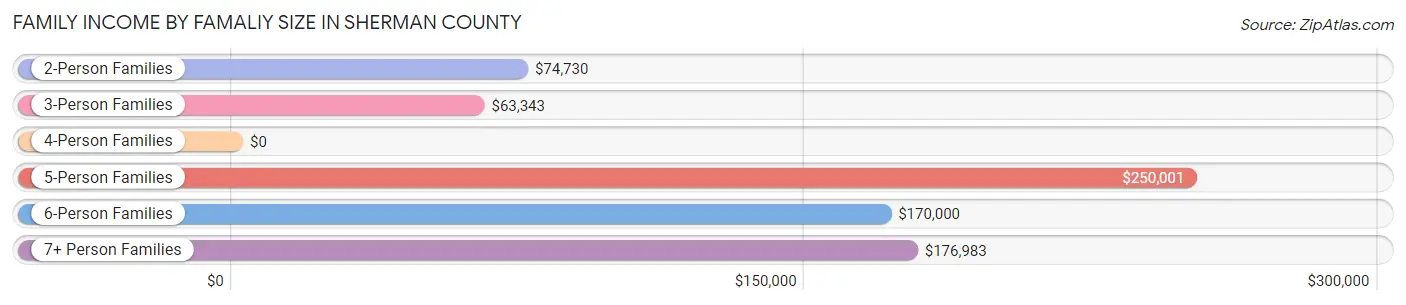
| Income Bracket | # Families | Median Income |
| 2-Person Families | 847 (59.2%) | $74,730 |
| 3-Person Families | 330 (23.1%) | $63,343 |
| 4-Person Families | 136 (9.5%) | $0 |
| 5-Person Families | 30 (2.1%) | $250,001 |
| 6-Person Families | 40 (2.8%) | $170,000 |
| 7+ Person Families | 48 (3.4%) | $176,983 |
| Total | 1,431 (100.0%) | $73,530 |
Family Income by Number of Earners in Sherman County
The median family income in Sherman County is $73,530, with families comprising 3+ earners (164) having the highest median family income of $175,086, while families with no earners (193) have the lowest median family income of $36,534, accounting for 11.5% and 13.5% of families, respectively.
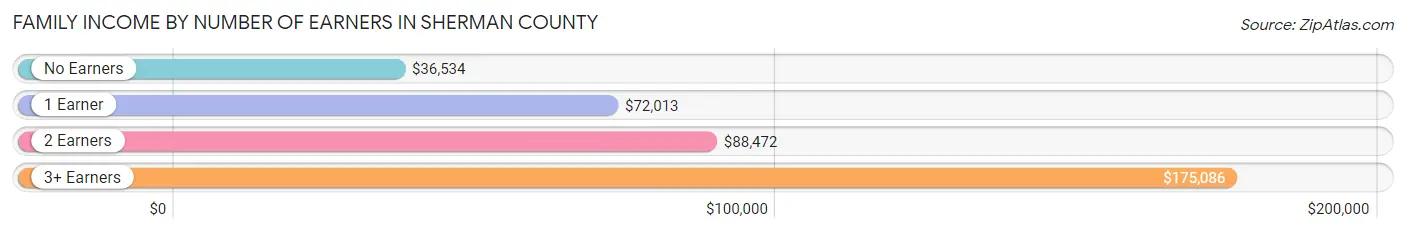
| Number of Earners | # Families | Median Income |
| No Earners | 193 (13.5%) | $36,534 |
| 1 Earner | 431 (30.1%) | $72,013 |
| 2 Earners | 643 (44.9%) | $88,472 |
| 3+ Earners | 164 (11.5%) | $175,086 |
| Total | 1,431 (100.0%) | $73,530 |
Household Income in Sherman County
Household Income Brackets in Sherman County
With 454 households falling in the category, the $50,000 to $74,999 income range is the most frequent in Sherman County, accounting for 19.6% of all households. In contrast, only 116 households (5.0%) fall into the $200,000+ income bracket, making it the least populous group.
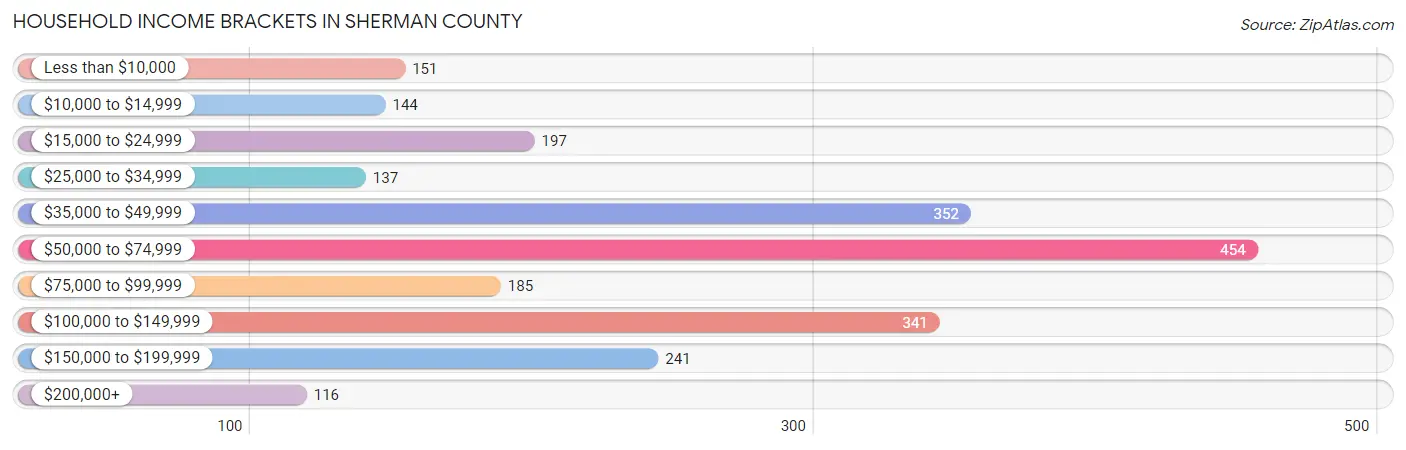
| Income Bracket | # Households | % Households |
| Less than $10,000 | 151 | 6.5% |
| $10,000 to $14,999 | 144 | 6.2% |
| $15,000 to $24,999 | 197 | 8.5% |
| $25,000 to $34,999 | 137 | 5.9% |
| $35,000 to $49,999 | 352 | 15.2% |
| $50,000 to $74,999 | 454 | 19.6% |
| $75,000 to $99,999 | 185 | 8.0% |
| $100,000 to $149,999 | 341 | 14.7% |
| $150,000 to $199,999 | 241 | 10.4% |
| $200,000+ | 116 | 5.0% |
Household Income by Householder Age in Sherman County
The median household income in Sherman County is $61,404, with the highest median household income of $83,463 found in the 25 to 44 years age bracket for the primary householder. A total of 683 households (29.5%) fall into this category. Meanwhile, the 15 to 24 years age bracket for the primary householder has the lowest median household income of $30,227, with 110 households (4.8%) in this group.
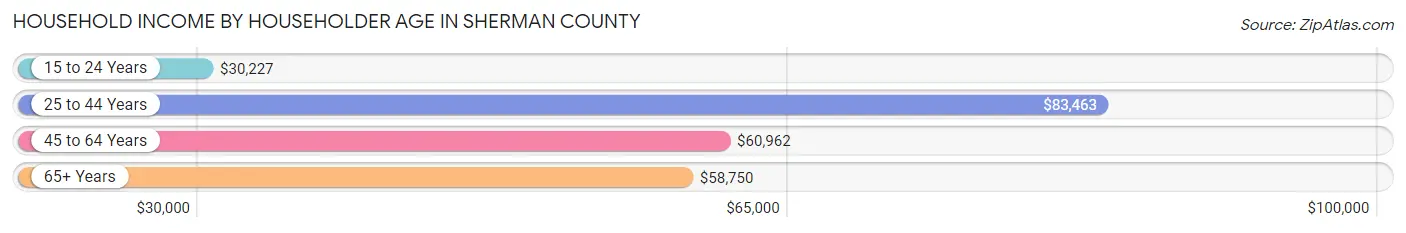
| Income Bracket | # Households | Median Income |
| 15 to 24 Years | 110 (4.8%) | $30,227 |
| 25 to 44 Years | 683 (29.5%) | $83,463 |
| 45 to 64 Years | 840 (36.2%) | $60,962 |
| 65+ Years | 684 (29.5%) | $58,750 |
| Total | 2,317 (100.0%) | $61,404 |
Poverty in Sherman County
Income Below Poverty by Sex and Age in Sherman County
With 9.0% poverty level for males and 12.1% for females among the residents of Sherman County, 6 to 11 year old males and 15 year old females are the most vulnerable to poverty, with 61 males (22.6%) and 18 females (81.8%) in their respective age groups living below the poverty level.
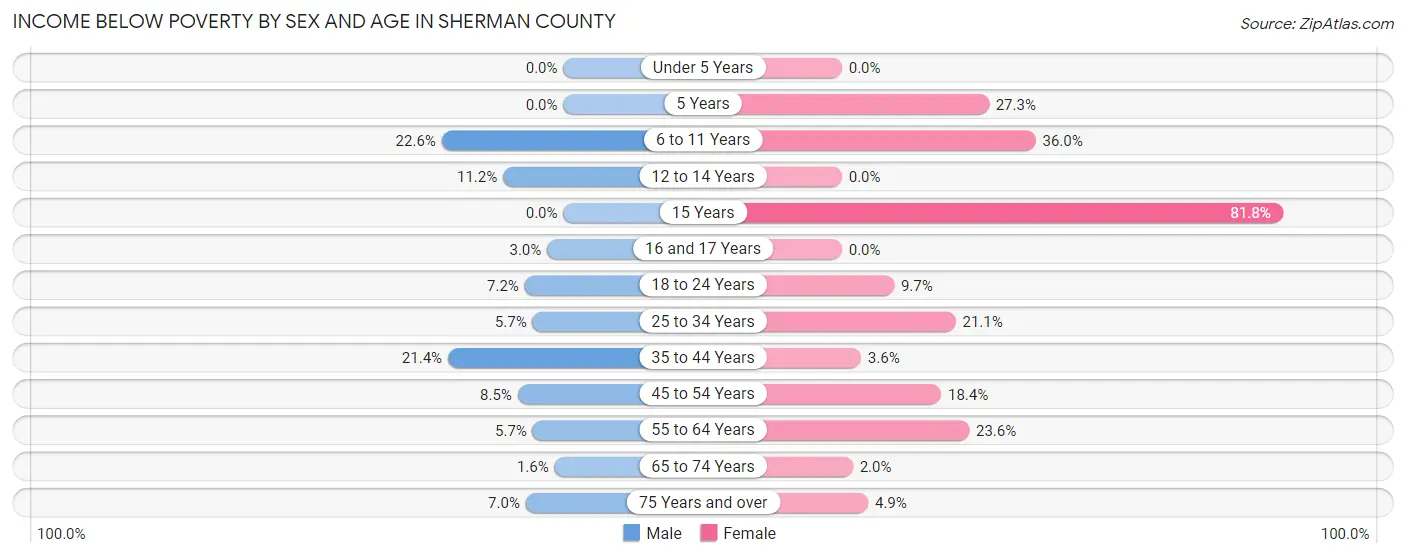
| Age Bracket | Male | Female |
| Under 5 Years | 0 (0.0%) | 0 (0.0%) |
| 5 Years | 0 (0.0%) | 9 (27.3%) |
| 6 to 11 Years | 61 (22.6%) | 64 (36.0%) |
| 12 to 14 Years | 14 (11.2%) | 0 (0.0%) |
| 15 Years | 0 (0.0%) | 18 (81.8%) |
| 16 and 17 Years | 4 (3.0%) | 0 (0.0%) |
| 18 to 24 Years | 27 (7.2%) | 22 (9.7%) |
| 25 to 34 Years | 11 (5.7%) | 34 (21.1%) |
| 35 to 44 Years | 87 (21.4%) | 15 (3.5%) |
| 45 to 54 Years | 21 (8.5%) | 47 (18.4%) |
| 55 to 64 Years | 23 (5.7%) | 90 (23.6%) |
| 65 to 74 Years | 5 (1.6%) | 6 (2.0%) |
| 75 Years and over | 15 (7.0%) | 17 (4.9%) |
| Total | 268 (9.0%) | 322 (12.1%) |
Income Above Poverty by Sex and Age in Sherman County
According to the poverty statistics in Sherman County, males aged under 5 years and females aged under 5 years are the age groups that are most secure financially, with 100.0% of males and 100.0% of females in these age groups living above the poverty line.
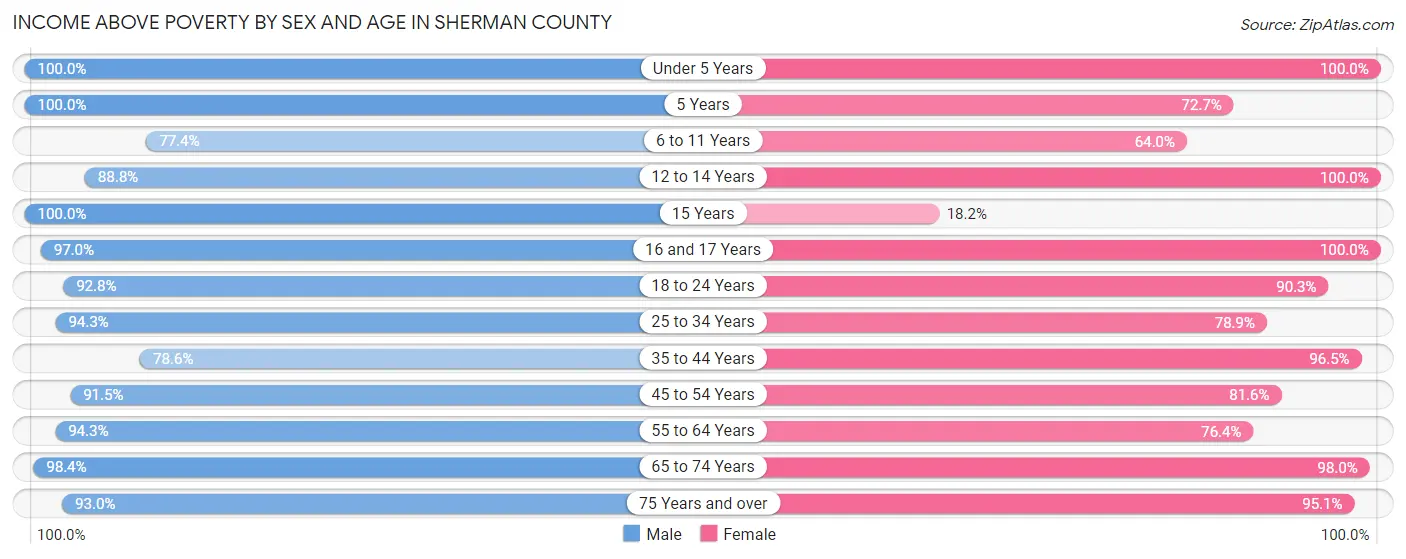
| Age Bracket | Male | Female |
| Under 5 Years | 269 (100.0%) | 134 (100.0%) |
| 5 Years | 21 (100.0%) | 24 (72.7%) |
| 6 to 11 Years | 209 (77.4%) | 114 (64.0%) |
| 12 to 14 Years | 111 (88.8%) | 117 (100.0%) |
| 15 Years | 4 (100.0%) | 4 (18.2%) |
| 16 and 17 Years | 129 (97.0%) | 78 (100.0%) |
| 18 to 24 Years | 349 (92.8%) | 205 (90.3%) |
| 25 to 34 Years | 181 (94.3%) | 127 (78.9%) |
| 35 to 44 Years | 319 (78.6%) | 408 (96.5%) |
| 45 to 54 Years | 227 (91.5%) | 208 (81.6%) |
| 55 to 64 Years | 381 (94.3%) | 291 (76.4%) |
| 65 to 74 Years | 302 (98.4%) | 290 (98.0%) |
| 75 Years and over | 200 (93.0%) | 332 (95.1%) |
| Total | 2,702 (91.0%) | 2,332 (87.9%) |
Income Below Poverty Among Married-Couple Families in Sherman County
The poverty statistics for married-couple families in Sherman County show that 0.9% or 10 of the total 1,079 families live below the poverty line. Families with 1 or 2 children have the highest poverty rate of 4.1%, comprising of 8 families. On the other hand, families with 3 or 4 children have the lowest poverty rate of 0.0%, which includes 0 families.
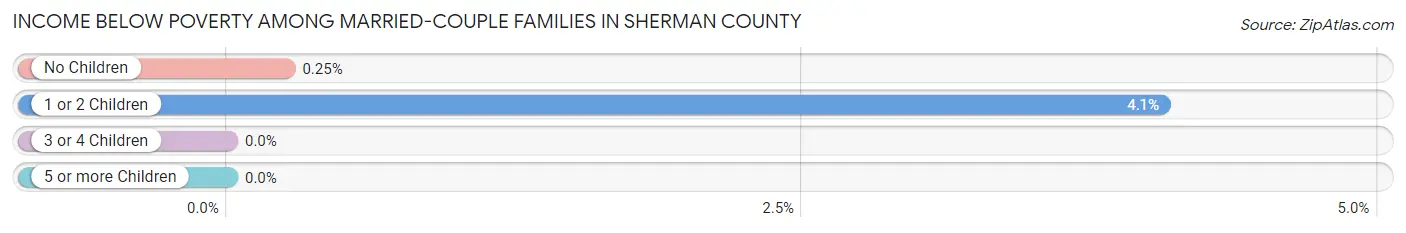
| Children | Above Poverty | Below Poverty |
| No Children | 784 (99.8%) | 2 (0.3%) |
| 1 or 2 Children | 189 (95.9%) | 8 (4.1%) |
| 3 or 4 Children | 78 (100.0%) | 0 (0.0%) |
| 5 or more Children | 18 (100.0%) | 0 (0.0%) |
| Total | 1,069 (99.1%) | 10 (0.9%) |
Income Below Poverty Among Single-Parent Households in Sherman County
According to the poverty data in Sherman County, 43.9% or 47 single-father households and 25.3% or 62 single-mother households are living below the poverty line. Among single-father households, those with 1 or 2 children have the highest poverty rate, with 47 households (51.1%) experiencing poverty. Likewise, among single-mother households, those with 1 or 2 children have the highest poverty rate, with 62 households (29.1%) falling below the poverty line.
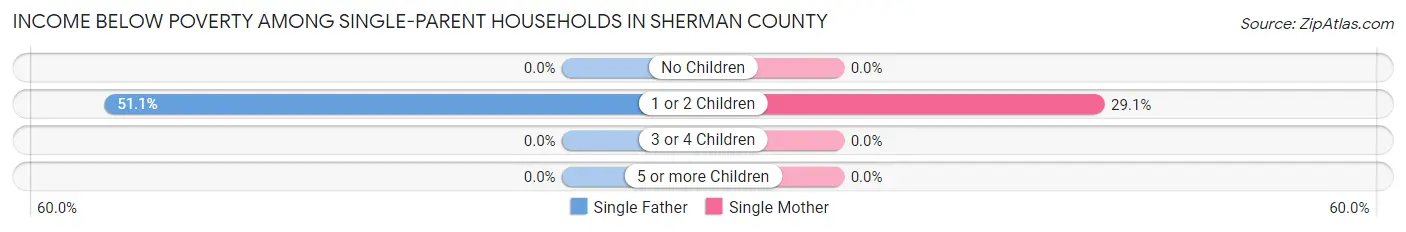
| Children | Single Father | Single Mother |
| No Children | 0 (0.0%) | 0 (0.0%) |
| 1 or 2 Children | 47 (51.1%) | 62 (29.1%) |
| 3 or 4 Children | 0 (0.0%) | 0 (0.0%) |
| 5 or more Children | 0 (0.0%) | 0 (0.0%) |
| Total | 47 (43.9%) | 62 (25.3%) |
Income Below Poverty Among Married-Couple vs Single-Parent Households in Sherman County
The poverty data for Sherman County shows that 10 of the married-couple family households (0.9%) and 109 of the single-parent households (31.0%) are living below the poverty level. Within the married-couple family households, those with 1 or 2 children have the highest poverty rate, with 8 households (4.1%) falling below the poverty line. Among the single-parent households, those with 1 or 2 children have the highest poverty rate, with 109 household (35.7%) living below poverty.
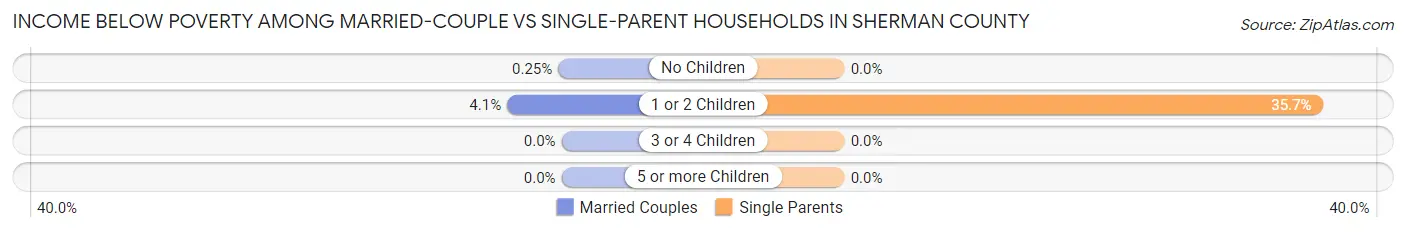
| Children | Married-Couple Families | Single-Parent Households |
| No Children | 2 (0.3%) | 0 (0.0%) |
| 1 or 2 Children | 8 (4.1%) | 109 (35.7%) |
| 3 or 4 Children | 0 (0.0%) | 0 (0.0%) |
| 5 or more Children | 0 (0.0%) | 0 (0.0%) |
| Total | 10 (0.9%) | 109 (31.0%) |
Race in Sherman County
The most populous races in Sherman County are White / Caucasian (5,230 | 88.0%), Hispanic or Latino (759 | 12.8%), and Some other Race (299 | 5.0%).
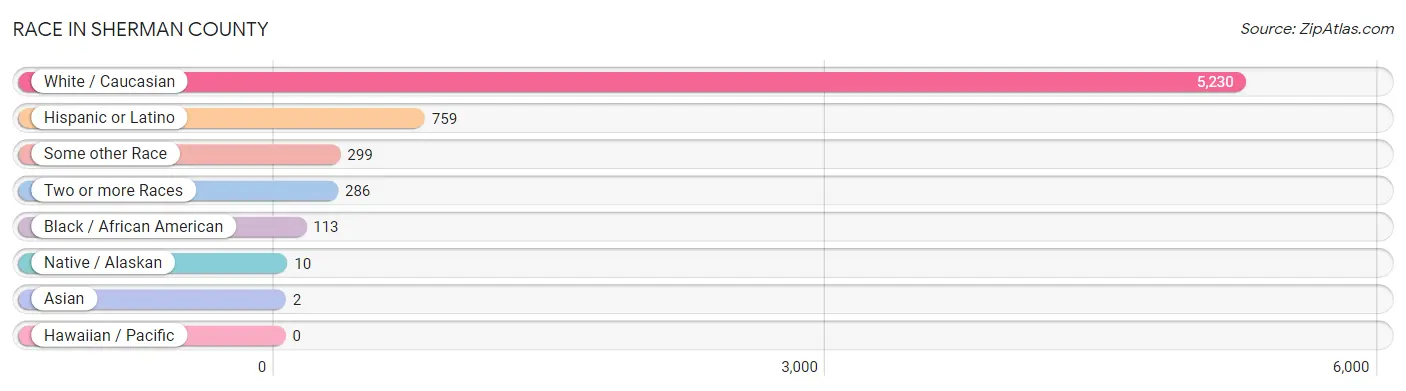
| Race | # Population | % Population |
| Asian | 2 | 0.0% |
| Black / African American | 113 | 1.9% |
| Hawaiian / Pacific | 0 | 0.0% |
| Hispanic or Latino | 759 | 12.8% |
| Native / Alaskan | 10 | 0.2% |
| White / Caucasian | 5,230 | 88.0% |
| Two or more Races | 286 | 4.8% |
| Some other Race | 299 | 5.0% |
| Total | 5,940 | 100.0% |
Ancestry in Sherman County
The most populous ancestries reported in Sherman County are German (1,958 | 33.0%), Irish (792 | 13.3%), Mexican (708 | 11.9%), English (380 | 6.4%), and American (333 | 5.6%), together accounting for 70.2% of all Sherman County residents.
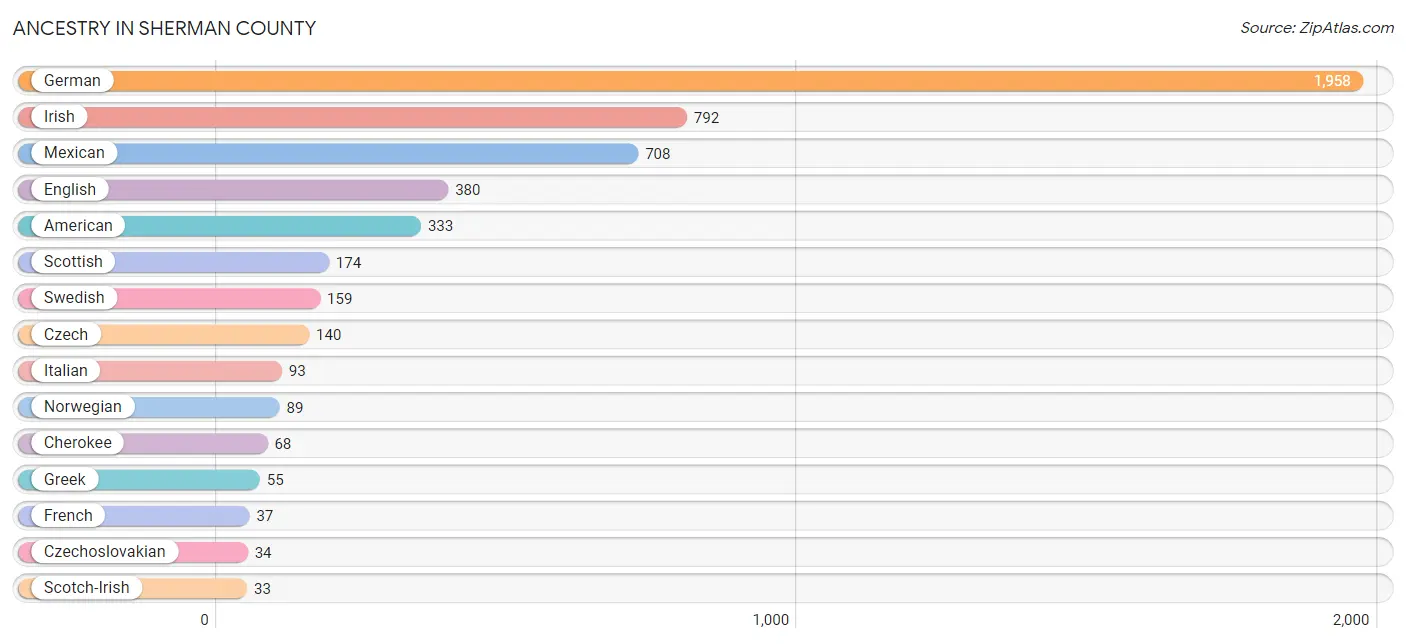
| Ancestry | # Population | % Population |
| American | 333 | 5.6% |
| Arab | 3 | 0.1% |
| Belgian | 3 | 0.1% |
| British | 3 | 0.1% |
| Burmese | 19 | 0.3% |
| Central American | 1 | 0.0% |
| Cherokee | 68 | 1.1% |
| Czech | 140 | 2.4% |
| Czechoslovakian | 34 | 0.6% |
| Danish | 2 | 0.0% |
| Dutch | 7 | 0.1% |
| English | 380 | 6.4% |
| European | 21 | 0.4% |
| French | 37 | 0.6% |
| French Canadian | 20 | 0.3% |
| German | 1,958 | 33.0% |
| Greek | 55 | 0.9% |
| Guatemalan | 1 | 0.0% |
| Irish | 792 | 13.3% |
| Italian | 93 | 1.6% |
| Lebanese | 3 | 0.1% |
| Malaysian | 1 | 0.0% |
| Mexican | 708 | 11.9% |
| Norwegian | 89 | 1.5% |
| Paiute | 9 | 0.2% |
| Pakistani | 1 | 0.0% |
| Polish | 28 | 0.5% |
| Potawatomi | 12 | 0.2% |
| Russian | 14 | 0.2% |
| Scandinavian | 2 | 0.0% |
| Scotch-Irish | 33 | 0.6% |
| Scottish | 174 | 2.9% |
| Spanish | 13 | 0.2% |
| Sri Lankan | 1 | 0.0% |
| Swedish | 159 | 2.7% |
| Swiss | 2 | 0.0% |
| Ukrainian | 11 | 0.2% | View All 37 Rows |
Immigrants in Sherman County
The most numerous immigrant groups reported in Sherman County came from Central America (115 | 1.9%), Latin America (115 | 1.9%), Mexico (115 | 1.9%), Europe (23 | 0.4%), and England (18 | 0.3%), together accounting for 6.5% of all Sherman County residents.
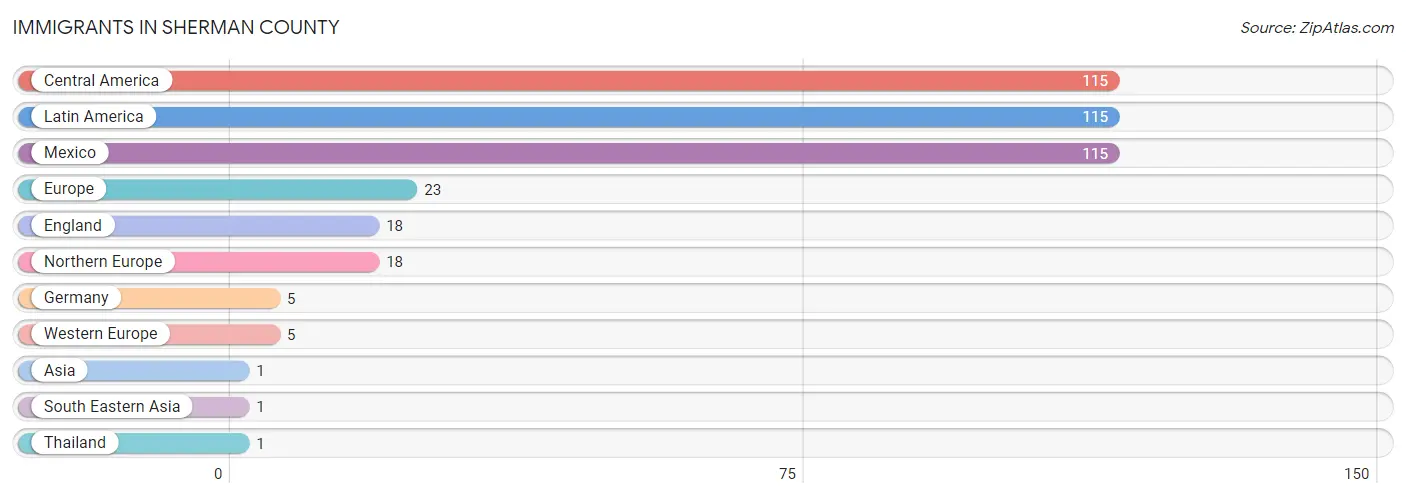
| Immigration Origin | # Population | % Population |
| Asia | 1 | 0.0% |
| Central America | 115 | 1.9% |
| England | 18 | 0.3% |
| Europe | 23 | 0.4% |
| Germany | 5 | 0.1% |
| Latin America | 115 | 1.9% |
| Mexico | 115 | 1.9% |
| Northern Europe | 18 | 0.3% |
| South Eastern Asia | 1 | 0.0% |
| Thailand | 1 | 0.0% |
| Western Europe | 5 | 0.1% | View All 11 Rows |
Sex and Age in Sherman County
Sex and Age in Sherman County
The most populous age groups in Sherman County are 15 to 19 Years (404 | 12.9%) for men and 35 to 39 Years (293 | 10.4%) for women.
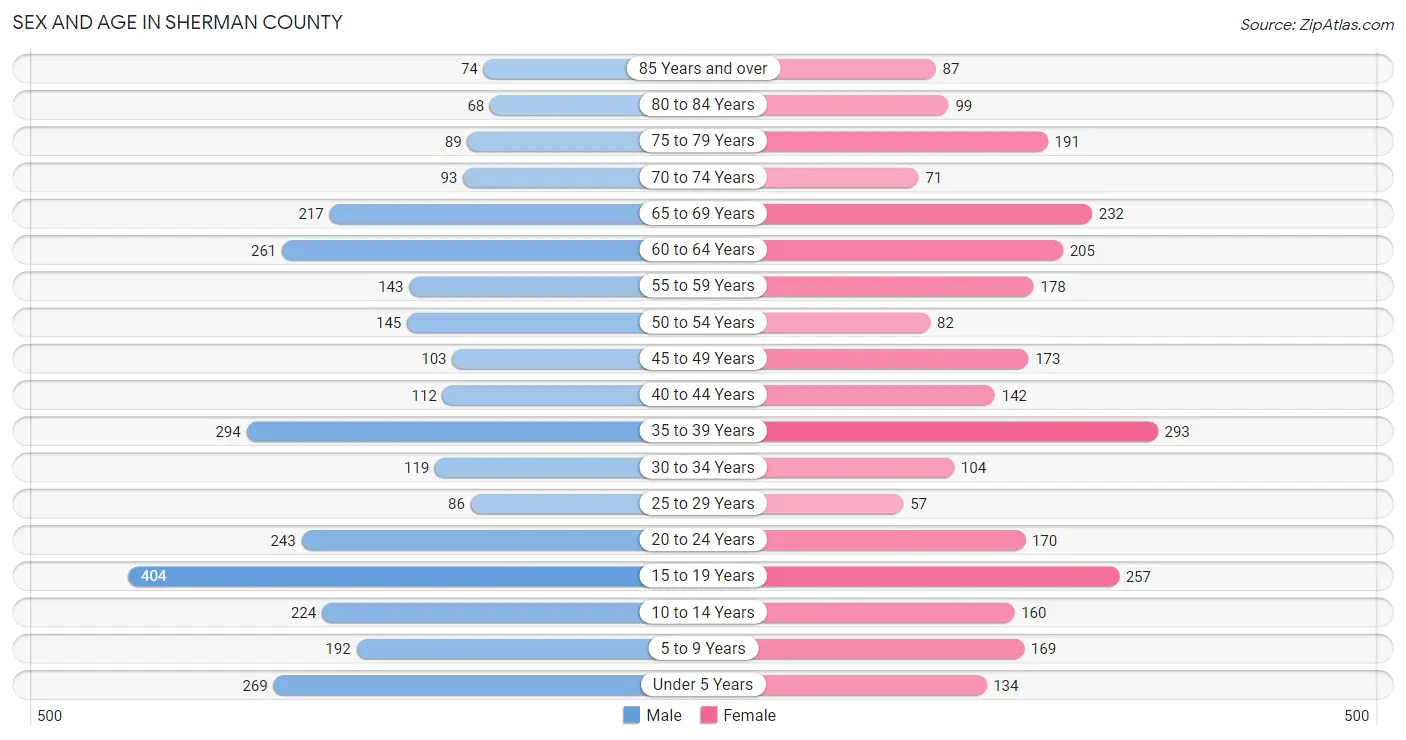
| Age Bracket | Male | Female |
| Under 5 Years | 269 (8.6%) | 134 (4.8%) |
| 5 to 9 Years | 192 (6.1%) | 169 (6.0%) |
| 10 to 14 Years | 224 (7.1%) | 160 (5.7%) |
| 15 to 19 Years | 404 (12.9%) | 257 (9.2%) |
| 20 to 24 Years | 243 (7.7%) | 170 (6.1%) |
| 25 to 29 Years | 86 (2.7%) | 57 (2.0%) |
| 30 to 34 Years | 119 (3.8%) | 104 (3.7%) |
| 35 to 39 Years | 294 (9.4%) | 293 (10.4%) |
| 40 to 44 Years | 112 (3.6%) | 142 (5.1%) |
| 45 to 49 Years | 103 (3.3%) | 173 (6.2%) |
| 50 to 54 Years | 145 (4.6%) | 82 (2.9%) |
| 55 to 59 Years | 143 (4.6%) | 178 (6.4%) |
| 60 to 64 Years | 261 (8.3%) | 205 (7.3%) |
| 65 to 69 Years | 217 (6.9%) | 232 (8.3%) |
| 70 to 74 Years | 93 (3.0%) | 71 (2.5%) |
| 75 to 79 Years | 89 (2.8%) | 191 (6.8%) |
| 80 to 84 Years | 68 (2.2%) | 99 (3.5%) |
| 85 Years and over | 74 (2.4%) | 87 (3.1%) |
| Total | 3,136 (100.0%) | 2,804 (100.0%) |
Families and Households in Sherman County
Median Family Size in Sherman County
The median family size in Sherman County is 3.20 persons per family, with married-couple families (1,079 | 75.4%) accounting for the largest median family size of 3.24 persons per family. On the other hand, single female/mother families (245 | 17.1%) represent the smallest median family size with 3.04 persons per family.
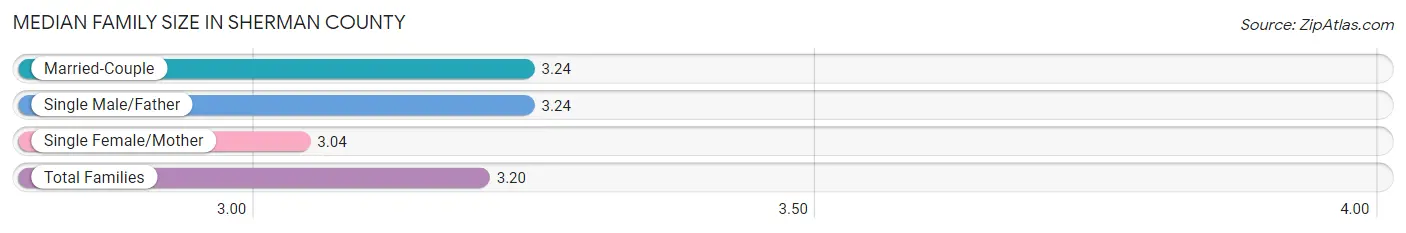
| Family Type | # Families | Family Size |
| Married-Couple | 1,079 (75.4%) | 3.24 |
| Single Male/Father | 107 (7.5%) | 3.24 |
| Single Female/Mother | 245 (17.1%) | 3.04 |
| Total Families | 1,431 (100.0%) | 3.20 |
Median Household Size in Sherman County
The median household size in Sherman County is 2.41 persons per household, with single male/father households (107 | 4.6%) accounting for the largest median household size of 3.26 persons per household. non-family households (886 | 38.2%) represent the smallest median household size with 1.09 persons per household.
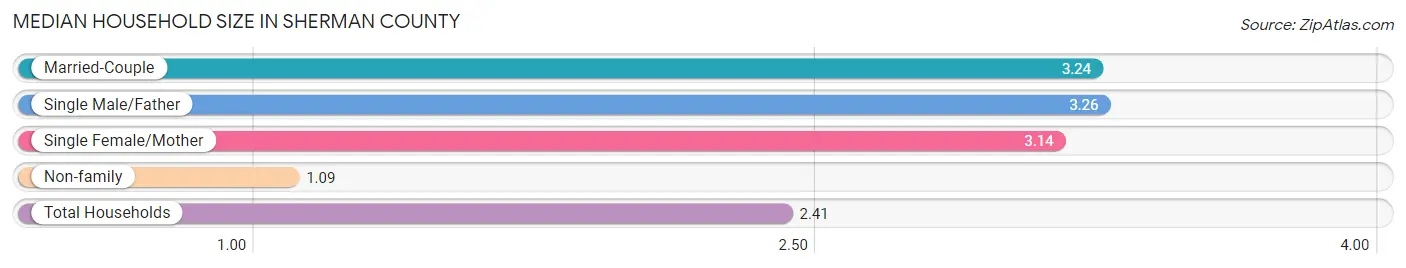
| Household Type | # Households | Household Size |
| Married-Couple | 1,079 (46.6%) | 3.24 |
| Single Male/Father | 107 (4.6%) | 3.26 |
| Single Female/Mother | 245 (10.6%) | 3.14 |
| Non-family | 886 (38.2%) | 1.09 |
| Total Households | 2,317 (100.0%) | 2.41 |
Household Size by Marriage Status in Sherman County
Out of a total of 2,317 households in Sherman County, 1,431 (61.8%) are family households, while 886 (38.2%) are nonfamily households. The most numerous type of family households are 2-person households, comprising 832, and the most common type of nonfamily households are 1-person households, comprising 812.
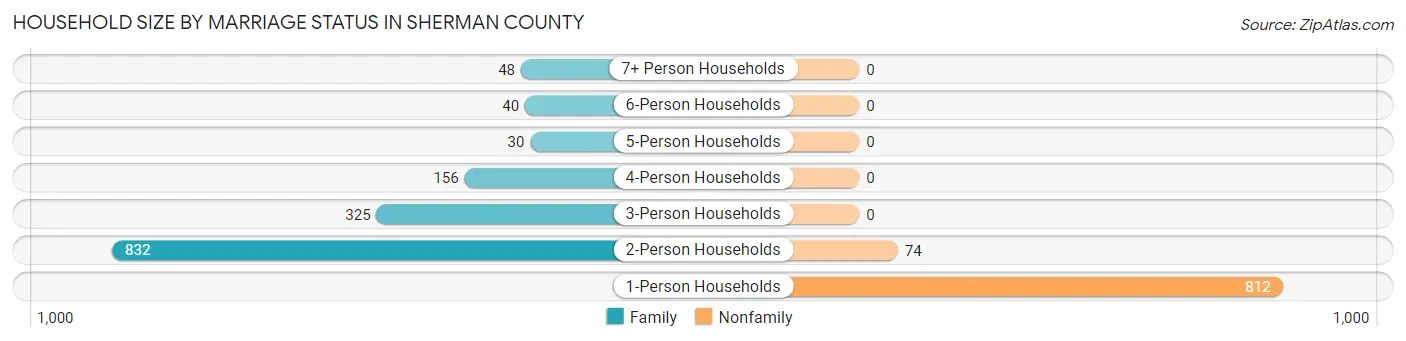
| Household Size | Family Households | Nonfamily Households |
| 1-Person Households | - | 812 (35.0%) |
| 2-Person Households | 832 (35.9%) | 74 (3.2%) |
| 3-Person Households | 325 (14.0%) | 0 (0.0%) |
| 4-Person Households | 156 (6.7%) | 0 (0.0%) |
| 5-Person Households | 30 (1.3%) | 0 (0.0%) |
| 6-Person Households | 40 (1.7%) | 0 (0.0%) |
| 7+ Person Households | 48 (2.1%) | 0 (0.0%) |
| Total | 1,431 (61.8%) | 886 (38.2%) |
Female Fertility in Sherman County
Fertility by Age in Sherman County
Average fertility rate in Sherman County is 54.0 births per 1,000 women. Women in the age bracket of 35 to 50 years have the highest fertility rate with 76.0 births per 1,000 women. Women in the age bracket of 35 to 50 years acount for 70.8% of all women with births.
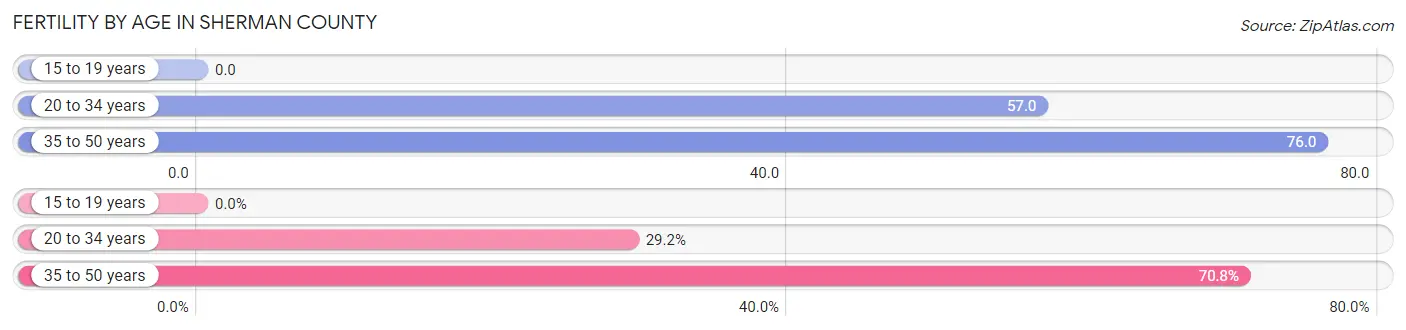
| Age Bracket | Women with Births | Births / 1,000 Women |
| 15 to 19 years | 0 (0.0%) | 0.0 |
| 20 to 34 years | 19 (29.2%) | 57.0 |
| 35 to 50 years | 46 (70.8%) | 76.0 |
| Total | 65 (100.0%) | 54.0 |
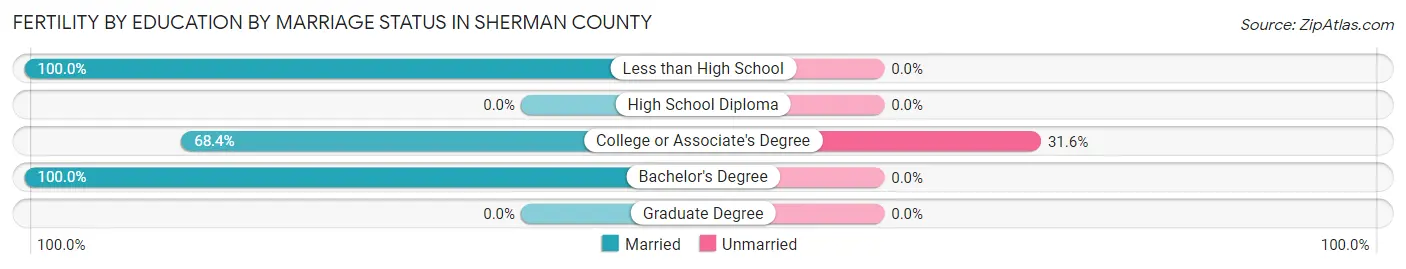
Fertility by Age by Marriage Status in Sherman County
90.8% of women with births (65) in Sherman County are married. The highest percentage of unmarried women with births falls into 20 to 34 years age bracket with 31.6% of them unmarried at the time of birth, while the lowest percentage of unmarried women with births belong to 35 to 50 years age bracket with 0.0% of them unmarried.
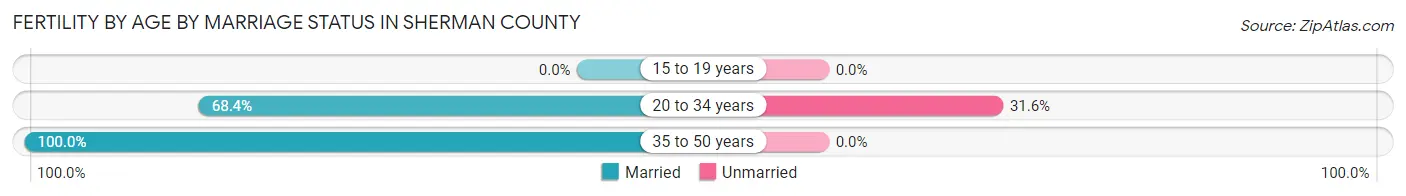
| Age Bracket | Married | Unmarried |
| 15 to 19 years | 0 (0.0%) | 0 (0.0%) |
| 20 to 34 years | 13 (68.4%) | 6 (31.6%) |
| 35 to 50 years | 46 (100.0%) | 0 (0.0%) |
| Total | 59 (90.8%) | 6 (9.2%) |
Fertility by Education in Sherman County
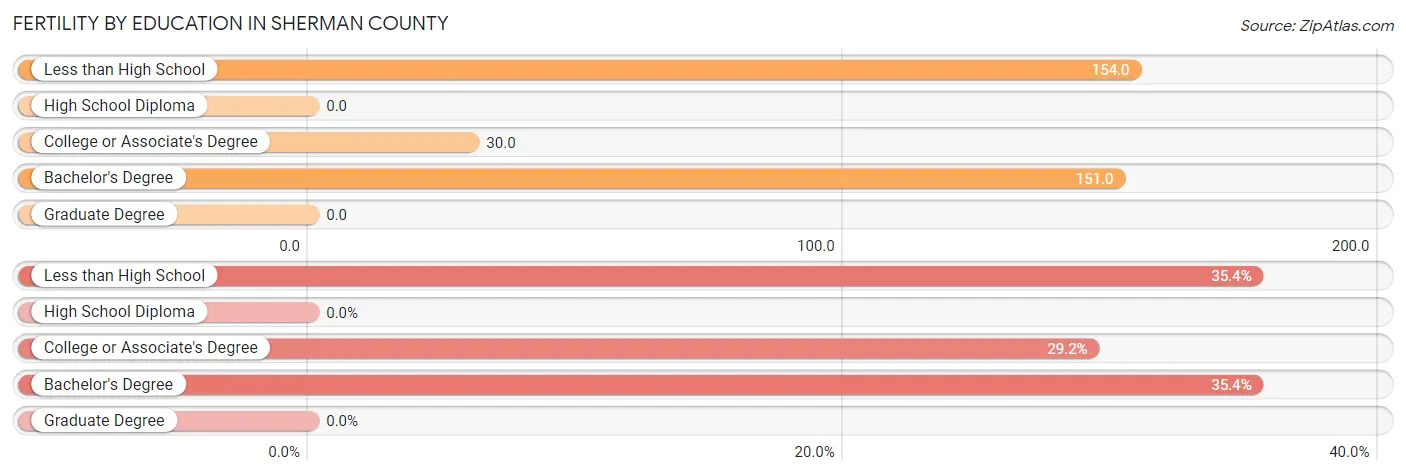
| Educational Attainment | Women with Births | Births / 1,000 Women |
| Less than High School | 23 (35.4%) | 154.0 |
| High School Diploma | 0 (0.0%) | 0.0 |
| College or Associate's Degree | 19 (29.2%) | 30.0 |
| Bachelor's Degree | 23 (35.4%) | 151.0 |
| Graduate Degree | 0 (0.0%) | 0.0 |
| Total | 65 (100.0%) | 54.0 |
Fertility by Education by Marriage Status in Sherman County
9.2% of women with births in Sherman County are unmarried. Women with the educational attainment of less than high school are most likely to be married with 100.0% of them married at childbirth, while women with the educational attainment of college or associate's degree are least likely to be married with 31.6% of them unmarried at childbirth.
| Educational Attainment | Married | Unmarried |
| Less than High School | 23 (100.0%) | 0 (0.0%) |
| High School Diploma | 0 (0.0%) | 0 (0.0%) |
| College or Associate's Degree | 13 (68.4%) | 6 (31.6%) |
| Bachelor's Degree | 23 (100.0%) | 0 (0.0%) |
| Graduate Degree | 0 (0.0%) | 0 (0.0%) |
| Total | 59 (90.8%) | 6 (9.2%) |
Employment Characteristics in Sherman County
Employment by Class of Employer in Sherman County
Among the 3,030 employed individuals in Sherman County, private company employees (1,791 | 59.1%), self-employed (not incorporated) (374 | 12.3%), and local government employees (345 | 11.4%) make up the most common classes of employment.
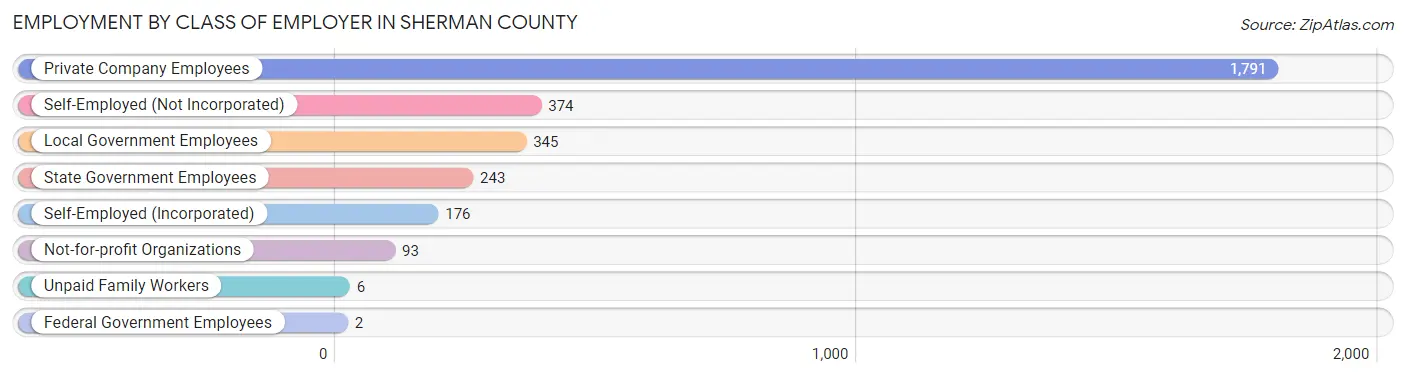
| Employer Class | # Employees | % Employees |
| Private Company Employees | 1,791 | 59.1% |
| Self-Employed (Incorporated) | 176 | 5.8% |
| Self-Employed (Not Incorporated) | 374 | 12.3% |
| Not-for-profit Organizations | 93 | 3.1% |
| Local Government Employees | 345 | 11.4% |
| State Government Employees | 243 | 8.0% |
| Federal Government Employees | 2 | 0.1% |
| Unpaid Family Workers | 6 | 0.2% |
| Total | 3,030 | 100.0% |
Employment Status by Age in Sherman County
According to the labor force statistics for Sherman County, out of the total population over 16 years of age (4,766), 65.6% or 3,126 individuals are in the labor force, with 2.4% or 75 of them unemployed. The age group with the highest labor force participation rate is 30 to 34 years, with 93.7% or 209 individuals in the labor force. Within the labor force, the 20 to 24 years age range has the highest percentage of unemployed individuals, with 12.5% or 42 of them being unemployed.
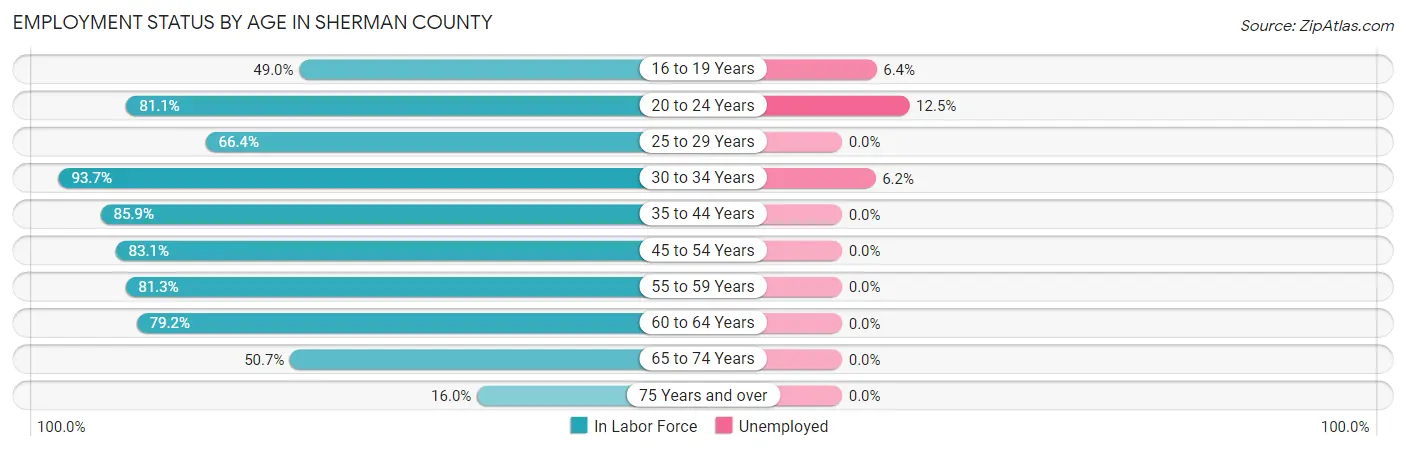
| Age Bracket | In Labor Force | Unemployed |
| 16 to 19 Years | 311 (49.0%) | 20 (6.4%) |
| 20 to 24 Years | 335 (81.1%) | 42 (12.5%) |
| 25 to 29 Years | 95 (66.4%) | 0 (0.0%) |
| 30 to 34 Years | 209 (93.7%) | 13 (6.2%) |
| 35 to 44 Years | 722 (85.9%) | 0 (0.0%) |
| 45 to 54 Years | 418 (83.1%) | 0 (0.0%) |
| 55 to 59 Years | 261 (81.3%) | 0 (0.0%) |
| 60 to 64 Years | 369 (79.2%) | 0 (0.0%) |
| 65 to 74 Years | 311 (50.7%) | 0 (0.0%) |
| 75 Years and over | 97 (16.0%) | 0 (0.0%) |
| Total | 3,126 (65.6%) | 75 (2.4%) |
Employment Status by Educational Attainment in Sherman County
According to labor force statistics for Sherman County, 83.1% of individuals (2,075) out of the total population between 25 and 64 years of age (2,497) are in the labor force, with 0.6% or 12 of them being unemployed. The group with the highest labor force participation rate are those with the educational attainment of bachelor's degree or higher, with 87.3% or 575 individuals in the labor force. Within the labor force, individuals with less than high school education have the highest percentage of unemployment, with 8.8% or 13 of them being unemployed.
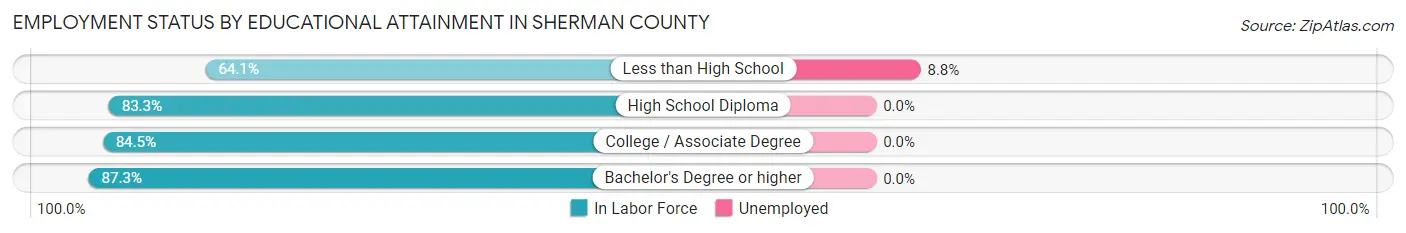
| Educational Attainment | In Labor Force | Unemployed |
| Less than High School | 148 (64.1%) | 20 (8.8%) |
| High School Diploma | 514 (83.3%) | 0 (0.0%) |
| College / Associate Degree | 837 (84.5%) | 0 (0.0%) |
| Bachelor's Degree or higher | 575 (87.3%) | 0 (0.0%) |
| Total | 2,075 (83.1%) | 15 (0.6%) |
Employment Occupations by Sex in Sherman County
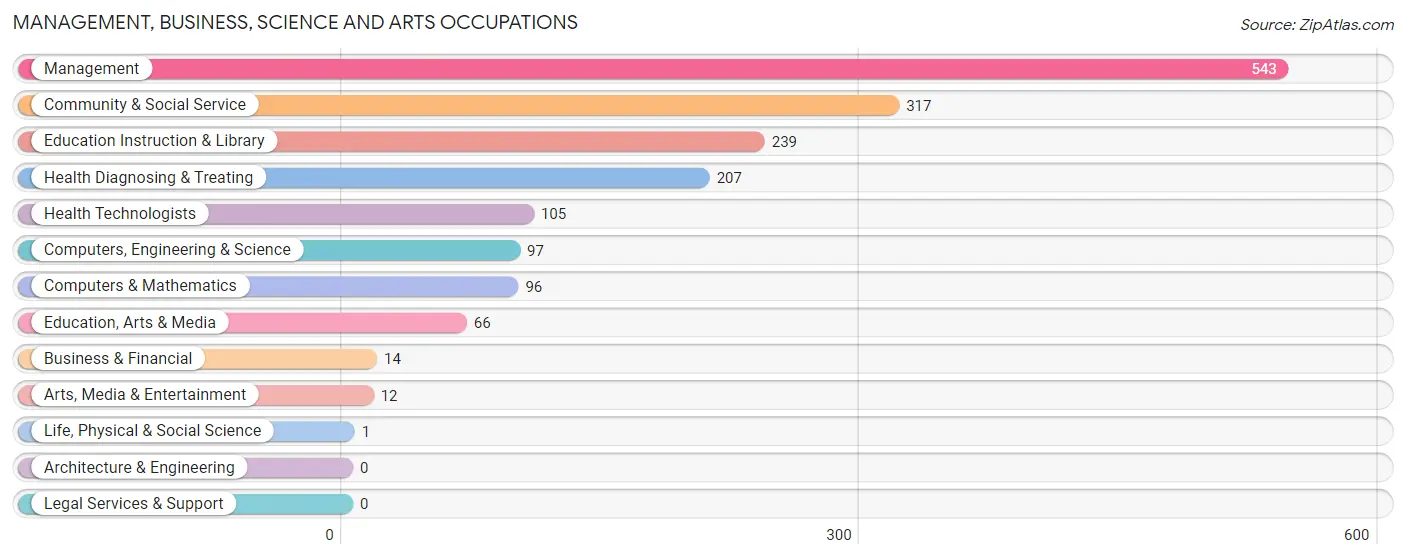
Management, Business, Science and Arts Occupations
The most common Management, Business, Science and Arts occupations in Sherman County are Management (543 | 17.8%), Community & Social Service (317 | 10.4%), Education Instruction & Library (239 | 7.8%), Health Diagnosing & Treating (207 | 6.8%), and Health Technologists (105 | 3.4%).
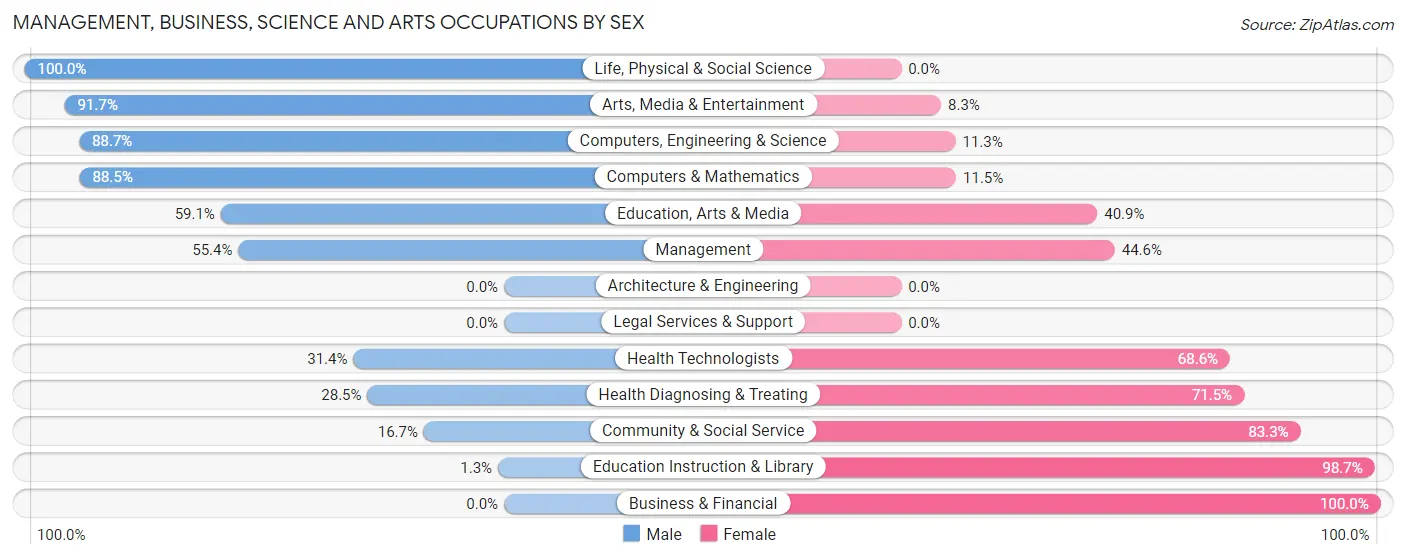
Management, Business, Science and Arts Occupations by Sex
Within the Management, Business, Science and Arts occupations in Sherman County, the most male-oriented occupations are Life, Physical & Social Science (100.0%), Arts, Media & Entertainment (91.7%), and Computers, Engineering & Science (88.7%), while the most female-oriented occupations are Business & Financial (100.0%), Education Instruction & Library (98.7%), and Community & Social Service (83.3%).
| Occupation | Male | Female |
| Management | 301 (55.4%) | 242 (44.6%) |
| Business & Financial | 0 (0.0%) | 14 (100.0%) |
| Computers, Engineering & Science | 86 (88.7%) | 11 (11.3%) |
| Computers & Mathematics | 85 (88.5%) | 11 (11.5%) |
| Architecture & Engineering | 0 (0.0%) | 0 (0.0%) |
| Life, Physical & Social Science | 1 (100.0%) | 0 (0.0%) |
| Community & Social Service | 53 (16.7%) | 264 (83.3%) |
| Education, Arts & Media | 39 (59.1%) | 27 (40.9%) |
| Legal Services & Support | 0 (0.0%) | 0 (0.0%) |
| Education Instruction & Library | 3 (1.3%) | 236 (98.7%) |
| Arts, Media & Entertainment | 11 (91.7%) | 1 (8.3%) |
| Health Diagnosing & Treating | 59 (28.5%) | 148 (71.5%) |
| Health Technologists | 33 (31.4%) | 72 (68.6%) |
| Total (Category) | 499 (42.4%) | 679 (57.6%) |
| Total (Overall) | 1,588 (52.0%) | 1,465 (48.0%) |
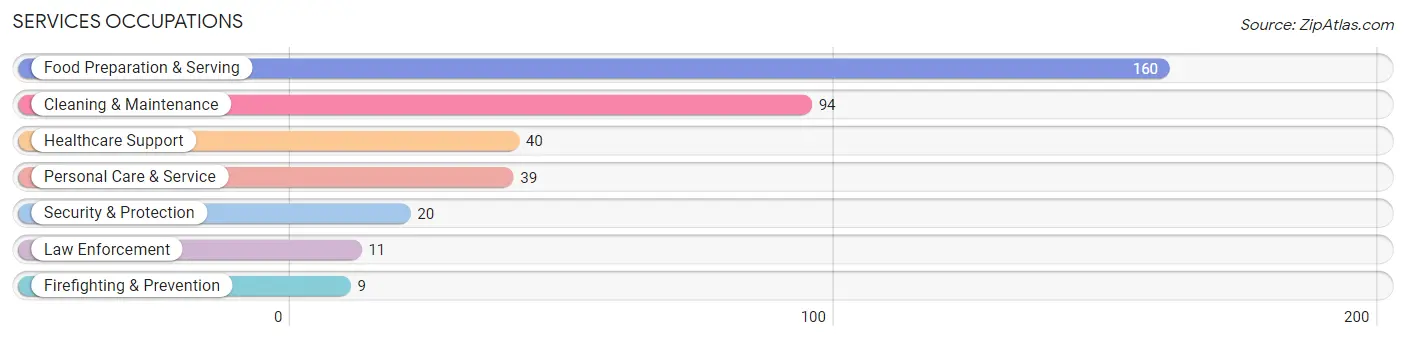
Services Occupations
The most common Services occupations in Sherman County are Food Preparation & Serving (160 | 5.2%), Cleaning & Maintenance (94 | 3.1%), Healthcare Support (40 | 1.3%), Personal Care & Service (39 | 1.3%), and Security & Protection (20 | 0.7%).
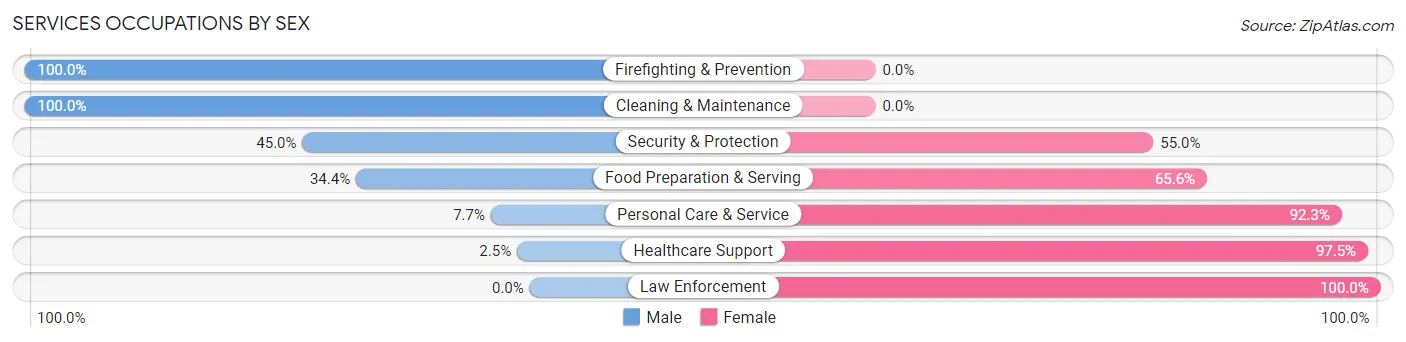
Services Occupations by Sex
Within the Services occupations in Sherman County, the most male-oriented occupations are Firefighting & Prevention (100.0%), Cleaning & Maintenance (100.0%), and Security & Protection (45.0%), while the most female-oriented occupations are Law Enforcement (100.0%), Healthcare Support (97.5%), and Personal Care & Service (92.3%).
| Occupation | Male | Female |
| Healthcare Support | 1 (2.5%) | 39 (97.5%) |
| Security & Protection | 9 (45.0%) | 11 (55.0%) |
| Firefighting & Prevention | 9 (100.0%) | 0 (0.0%) |
| Law Enforcement | 0 (0.0%) | 11 (100.0%) |
| Food Preparation & Serving | 55 (34.4%) | 105 (65.6%) |
| Cleaning & Maintenance | 94 (100.0%) | 0 (0.0%) |
| Personal Care & Service | 3 (7.7%) | 36 (92.3%) |
| Total (Category) | 162 (45.9%) | 191 (54.1%) |
| Total (Overall) | 1,588 (52.0%) | 1,465 (48.0%) |
Sales and Office Occupations
The most common Sales and Office occupations in Sherman County are Sales & Related (408 | 13.4%), and Office & Administration (241 | 7.9%).

Sales and Office Occupations by Sex

| Occupation | Male | Female |
| Sales & Related | 191 (46.8%) | 217 (53.2%) |
| Office & Administration | 18 (7.5%) | 223 (92.5%) |
| Total (Category) | 209 (32.2%) | 440 (67.8%) |
| Total (Overall) | 1,588 (52.0%) | 1,465 (48.0%) |
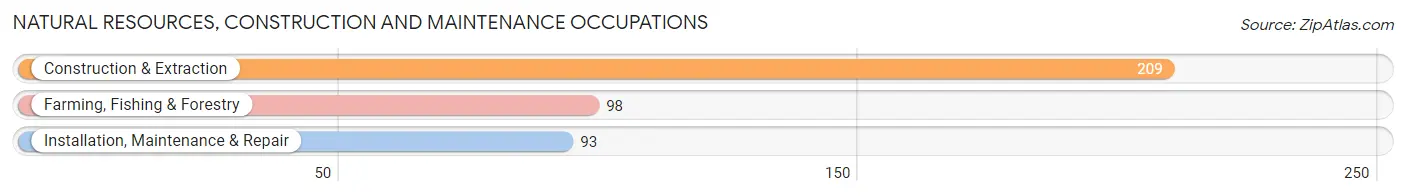
Natural Resources, Construction and Maintenance Occupations
The most common Natural Resources, Construction and Maintenance occupations in Sherman County are Construction & Extraction (209 | 6.9%), Farming, Fishing & Forestry (98 | 3.2%), and Installation, Maintenance & Repair (93 | 3.0%).
Natural Resources, Construction and Maintenance Occupations by Sex
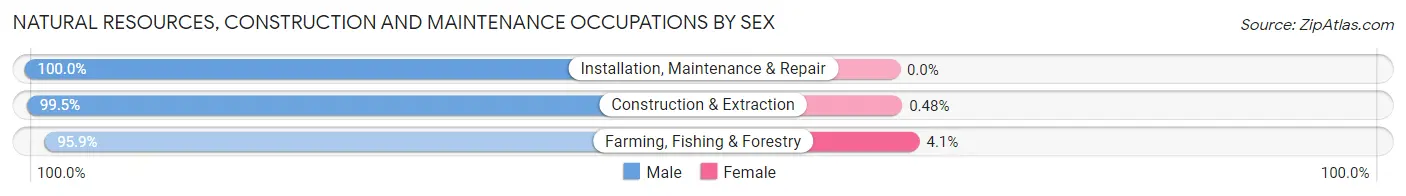
| Occupation | Male | Female |
| Farming, Fishing & Forestry | 94 (95.9%) | 4 (4.1%) |
| Construction & Extraction | 208 (99.5%) | 1 (0.5%) |
| Installation, Maintenance & Repair | 93 (100.0%) | 0 (0.0%) |
| Total (Category) | 395 (98.8%) | 5 (1.3%) |
| Total (Overall) | 1,588 (52.0%) | 1,465 (48.0%) |
Production, Transportation and Moving Occupations
The most common Production, Transportation and Moving occupations in Sherman County are Transportation (183 | 6.0%), Production (157 | 5.1%), and Material Moving (133 | 4.4%).
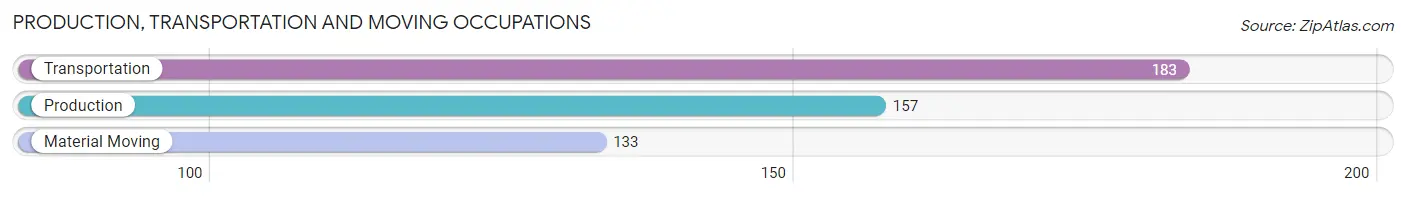
Production, Transportation and Moving Occupations by Sex
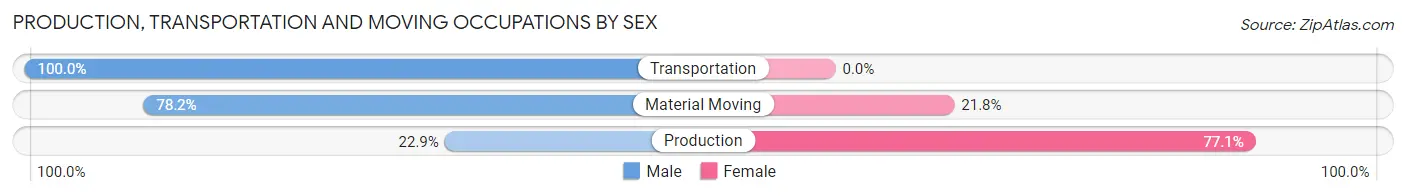
| Occupation | Male | Female |
| Production | 36 (22.9%) | 121 (77.1%) |
| Transportation | 183 (100.0%) | 0 (0.0%) |
| Material Moving | 104 (78.2%) | 29 (21.8%) |
| Total (Category) | 323 (68.3%) | 150 (31.7%) |
| Total (Overall) | 1,588 (52.0%) | 1,465 (48.0%) |
Employment Industries by Sex in Sherman County
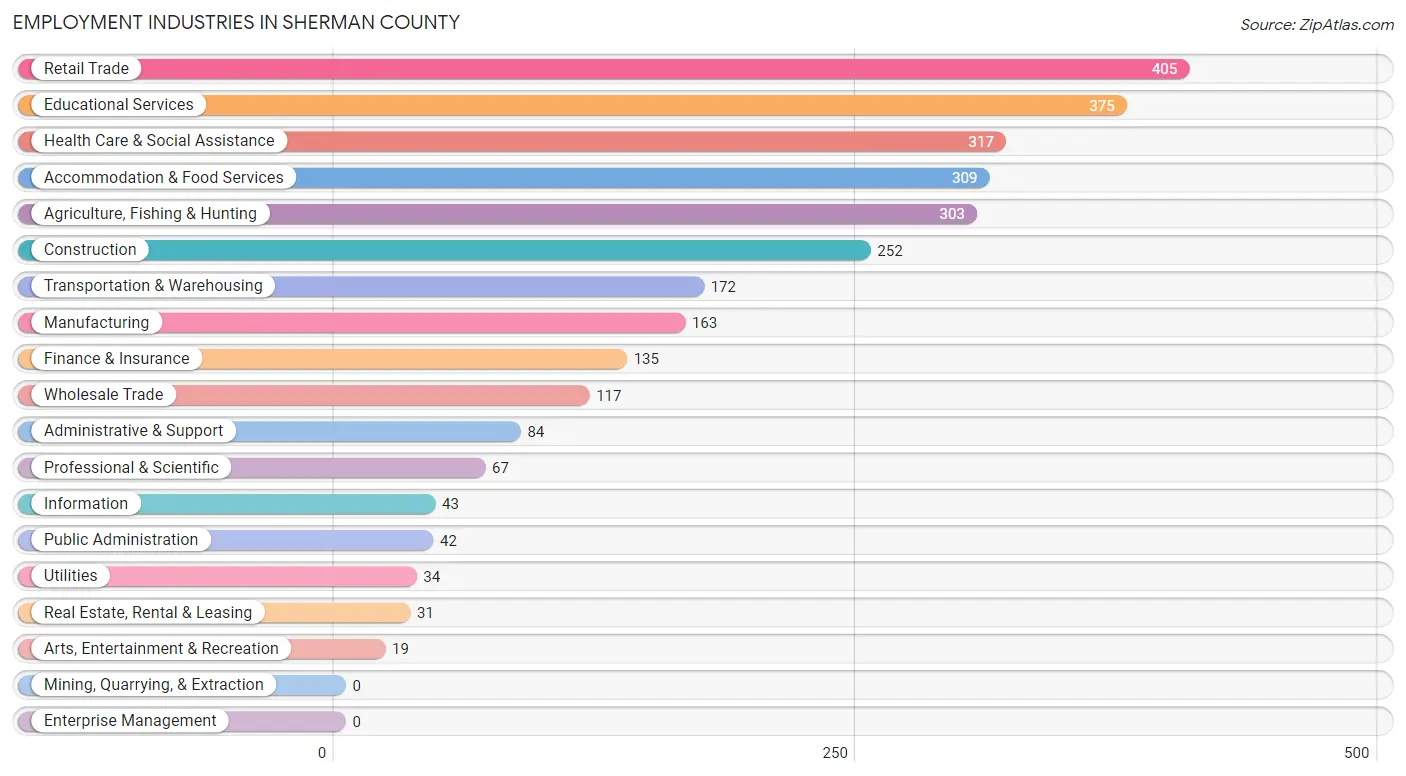
Employment Industries in Sherman County
The major employment industries in Sherman County include Retail Trade (405 | 13.3%), Educational Services (375 | 12.3%), Health Care & Social Assistance (317 | 10.4%), Accommodation & Food Services (309 | 10.1%), and Agriculture, Fishing & Hunting (303 | 9.9%).
Employment Industries by Sex in Sherman County
The Sherman County industries that see more men than women are Utilities (100.0%), Construction (99.6%), and Transportation & Warehousing (97.1%), whereas the industries that tend to have a higher number of women are Health Care & Social Assistance (84.5%), Accommodation & Food Services (81.6%), and Educational Services (78.1%).
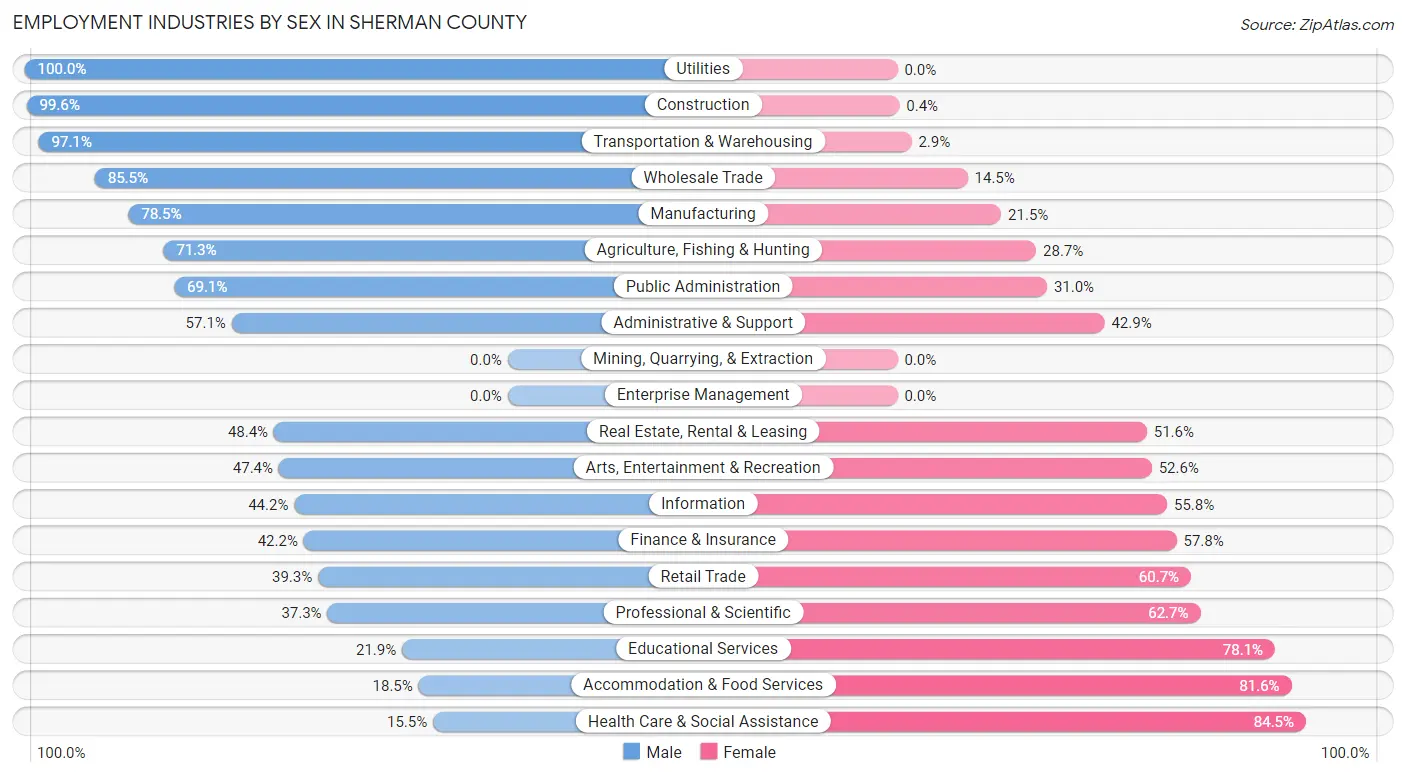
| Industry | Male | Female |
| Agriculture, Fishing & Hunting | 216 (71.3%) | 87 (28.7%) |
| Mining, Quarrying, & Extraction | 0 (0.0%) | 0 (0.0%) |
| Construction | 251 (99.6%) | 1 (0.4%) |
| Manufacturing | 128 (78.5%) | 35 (21.5%) |
| Wholesale Trade | 100 (85.5%) | 17 (14.5%) |
| Retail Trade | 159 (39.3%) | 246 (60.7%) |
| Transportation & Warehousing | 167 (97.1%) | 5 (2.9%) |
| Utilities | 34 (100.0%) | 0 (0.0%) |
| Information | 19 (44.2%) | 24 (55.8%) |
| Finance & Insurance | 57 (42.2%) | 78 (57.8%) |
| Real Estate, Rental & Leasing | 15 (48.4%) | 16 (51.6%) |
| Professional & Scientific | 25 (37.3%) | 42 (62.7%) |
| Enterprise Management | 0 (0.0%) | 0 (0.0%) |
| Administrative & Support | 48 (57.1%) | 36 (42.9%) |
| Educational Services | 82 (21.9%) | 293 (78.1%) |
| Health Care & Social Assistance | 49 (15.5%) | 268 (84.5%) |
| Arts, Entertainment & Recreation | 9 (47.4%) | 10 (52.6%) |
| Accommodation & Food Services | 57 (18.4%) | 252 (81.6%) |
| Public Administration | 29 (69.1%) | 13 (30.9%) |
| Total | 1,588 (52.0%) | 1,465 (48.0%) |
Education in Sherman County
School Enrollment in Sherman County
The most common levels of schooling among the 1,747 students in Sherman County are high school (469 | 26.9%), college / undergraduate (411 | 23.5%), and middle school (333 | 19.1%).
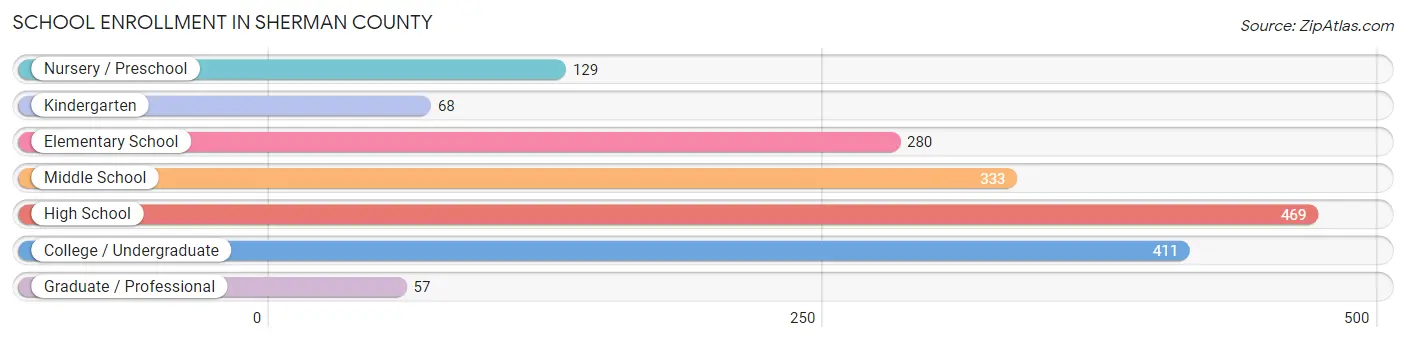
| School Level | # Students | % Students |
| Nursery / Preschool | 129 | 7.4% |
| Kindergarten | 68 | 3.9% |
| Elementary School | 280 | 16.0% |
| Middle School | 333 | 19.1% |
| High School | 469 | 26.9% |
| College / Undergraduate | 411 | 23.5% |
| Graduate / Professional | 57 | 3.3% |
| Total | 1,747 | 100.0% |
School Enrollment by Age by Funding Source in Sherman County
Out of a total of 1,747 students who are enrolled in schools in Sherman County, 224 (12.8%) attend a private institution, while the remaining 1,523 (87.2%) are enrolled in public schools. The age group of 20 to 24 year olds has the highest likelihood of being enrolled in private schools, with 57 (39.6% in the age bracket) enrolled. Conversely, the age group of 25 to 34 year olds has the lowest likelihood of being enrolled in a private school, with 2 (100.0% in the age bracket) attending a public institution.
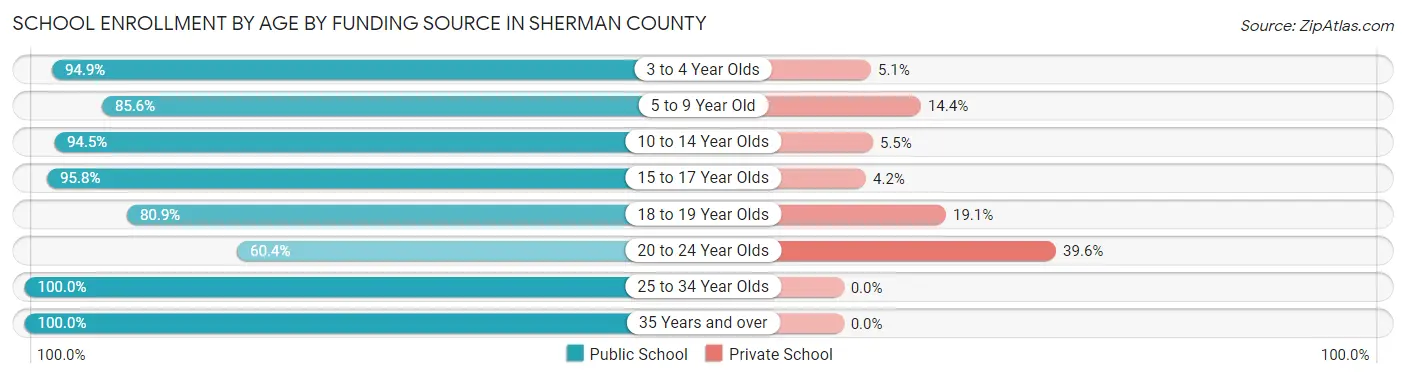
| Age Bracket | Public School | Private School |
| 3 to 4 Year Olds | 93 (94.9%) | 5 (5.1%) |
| 5 to 9 Year Old | 309 (85.6%) | 52 (14.4%) |
| 10 to 14 Year Olds | 363 (94.5%) | 21 (5.5%) |
| 15 to 17 Year Olds | 229 (95.8%) | 10 (4.2%) |
| 18 to 19 Year Olds | 331 (80.9%) | 78 (19.1%) |
| 20 to 24 Year Olds | 87 (60.4%) | 57 (39.6%) |
| 25 to 34 Year Olds | 2 (100.0%) | 0 (0.0%) |
| 35 Years and over | 110 (100.0%) | 0 (0.0%) |
| Total | 1,523 (87.2%) | 224 (12.8%) |
Educational Attainment by Field of Study in Sherman County
Education (274 | 25.7%), bio, nature & agricultural (208 | 19.5%), business (156 | 14.6%), science & technology (153 | 14.4%), and social sciences (61 | 5.7%) are the most common fields of study among 1,065 individuals in Sherman County who have obtained a bachelor's degree or higher.
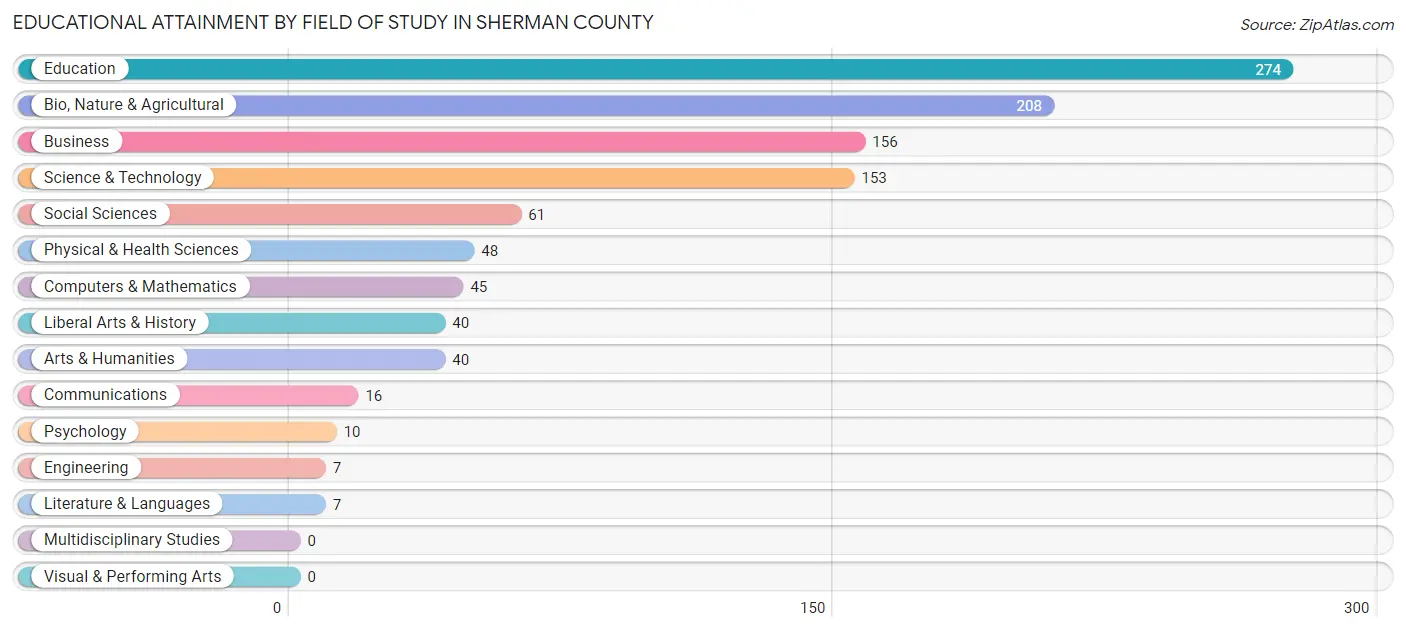
| Field of Study | # Graduates | % Graduates |
| Computers & Mathematics | 45 | 4.2% |
| Bio, Nature & Agricultural | 208 | 19.5% |
| Physical & Health Sciences | 48 | 4.5% |
| Psychology | 10 | 0.9% |
| Social Sciences | 61 | 5.7% |
| Engineering | 7 | 0.7% |
| Multidisciplinary Studies | 0 | 0.0% |
| Science & Technology | 153 | 14.4% |
| Business | 156 | 14.6% |
| Education | 274 | 25.7% |
| Literature & Languages | 7 | 0.7% |
| Liberal Arts & History | 40 | 3.8% |
| Visual & Performing Arts | 0 | 0.0% |
| Communications | 16 | 1.5% |
| Arts & Humanities | 40 | 3.8% |
| Total | 1,065 | 100.0% |
Transportation & Commute in Sherman County
Vehicle Availability by Sex in Sherman County
The most prevalent vehicle ownership categories in Sherman County are males with 2 vehicles (594, accounting for 38.8%) and females with 2 vehicles (383, making up 43.4%).
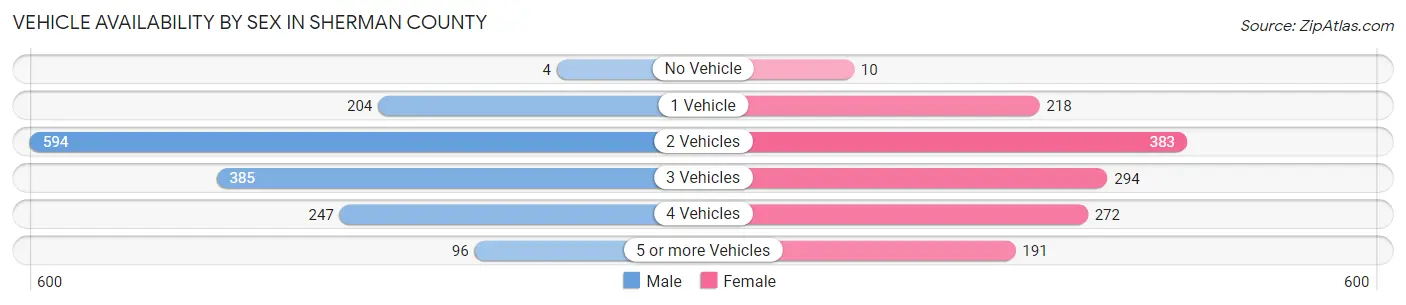
| Vehicles Available | Male | Female |
| No Vehicle | 4 (0.3%) | 10 (0.7%) |
| 1 Vehicle | 204 (13.3%) | 218 (15.9%) |
| 2 Vehicles | 594 (38.8%) | 383 (28.0%) |
| 3 Vehicles | 385 (25.2%) | 294 (21.5%) |
| 4 Vehicles | 247 (16.1%) | 272 (19.9%) |
| 5 or more Vehicles | 96 (6.3%) | 191 (14.0%) |
| Total | 1,530 (100.0%) | 1,368 (100.0%) |
Commute Time in Sherman County
The most frequently occuring commute durations in Sherman County are 5 to 9 minutes (834 commuters, 33.8%), less than 5 minutes (585 commuters, 23.7%), and 10 to 14 minutes (418 commuters, 16.9%).
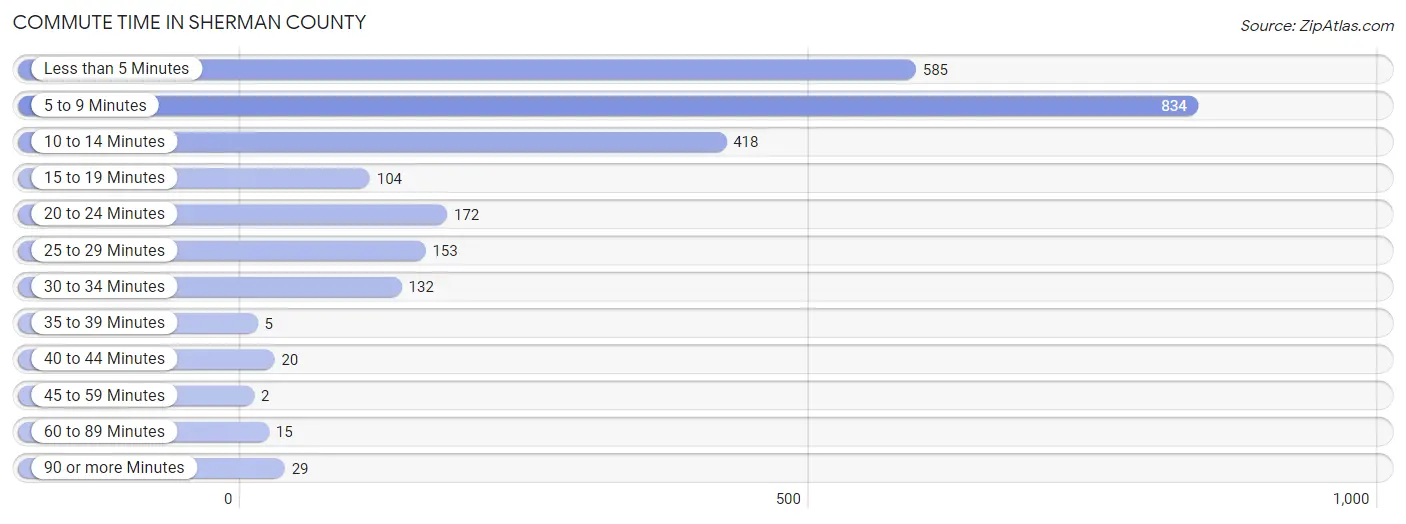
| Commute Time | # Commuters | % Commuters |
| Less than 5 Minutes | 585 | 23.7% |
| 5 to 9 Minutes | 834 | 33.8% |
| 10 to 14 Minutes | 418 | 16.9% |
| 15 to 19 Minutes | 104 | 4.2% |
| 20 to 24 Minutes | 172 | 7.0% |
| 25 to 29 Minutes | 153 | 6.2% |
| 30 to 34 Minutes | 132 | 5.3% |
| 35 to 39 Minutes | 5 | 0.2% |
| 40 to 44 Minutes | 20 | 0.8% |
| 45 to 59 Minutes | 2 | 0.1% |
| 60 to 89 Minutes | 15 | 0.6% |
| 90 or more Minutes | 29 | 1.2% |
Commute Time by Sex in Sherman County
The most common commute times in Sherman County are 5 to 9 minutes (515 commuters, 42.0%) for males and less than 5 minutes (393 commuters, 31.6%) for females.
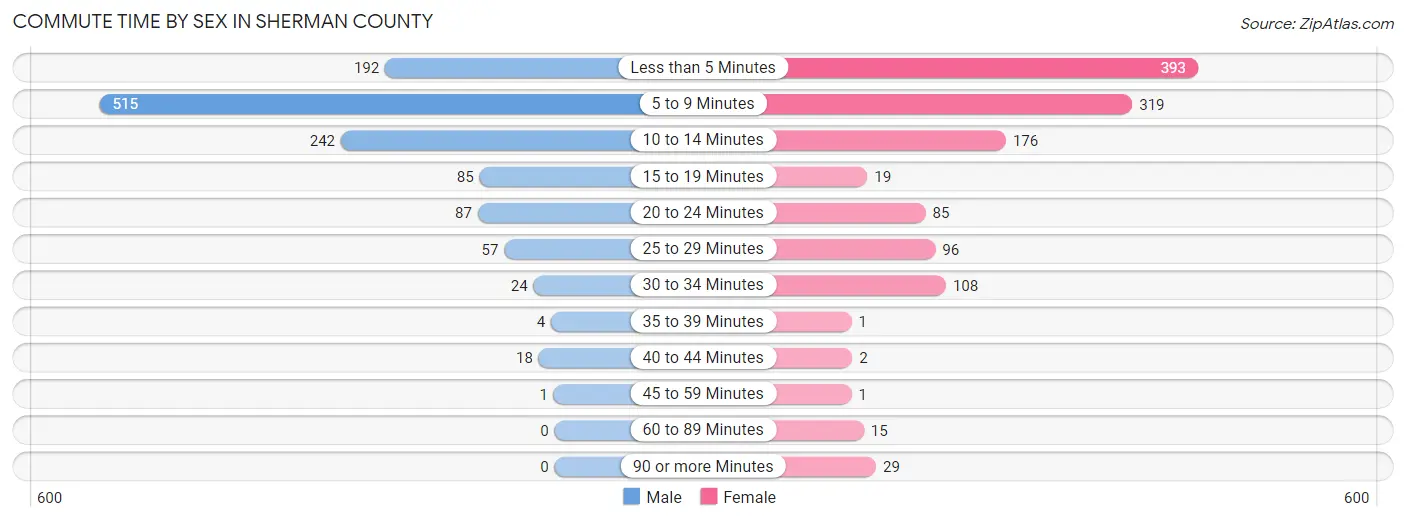
| Commute Time | Male | Female |
| Less than 5 Minutes | 192 (15.7%) | 393 (31.6%) |
| 5 to 9 Minutes | 515 (42.0%) | 319 (25.6%) |
| 10 to 14 Minutes | 242 (19.8%) | 176 (14.1%) |
| 15 to 19 Minutes | 85 (6.9%) | 19 (1.5%) |
| 20 to 24 Minutes | 87 (7.1%) | 85 (6.8%) |
| 25 to 29 Minutes | 57 (4.6%) | 96 (7.7%) |
| 30 to 34 Minutes | 24 (2.0%) | 108 (8.7%) |
| 35 to 39 Minutes | 4 (0.3%) | 1 (0.1%) |
| 40 to 44 Minutes | 18 (1.5%) | 2 (0.2%) |
| 45 to 59 Minutes | 1 (0.1%) | 1 (0.1%) |
| 60 to 89 Minutes | 0 (0.0%) | 15 (1.2%) |
| 90 or more Minutes | 0 (0.0%) | 29 (2.3%) |
Time of Departure to Work by Sex in Sherman County
The most frequent times of departure to work in Sherman County are 7:30 AM to 7:59 AM (264, 21.5%) for males and 12:00 AM to 4:59 AM (181, 14.5%) for females.
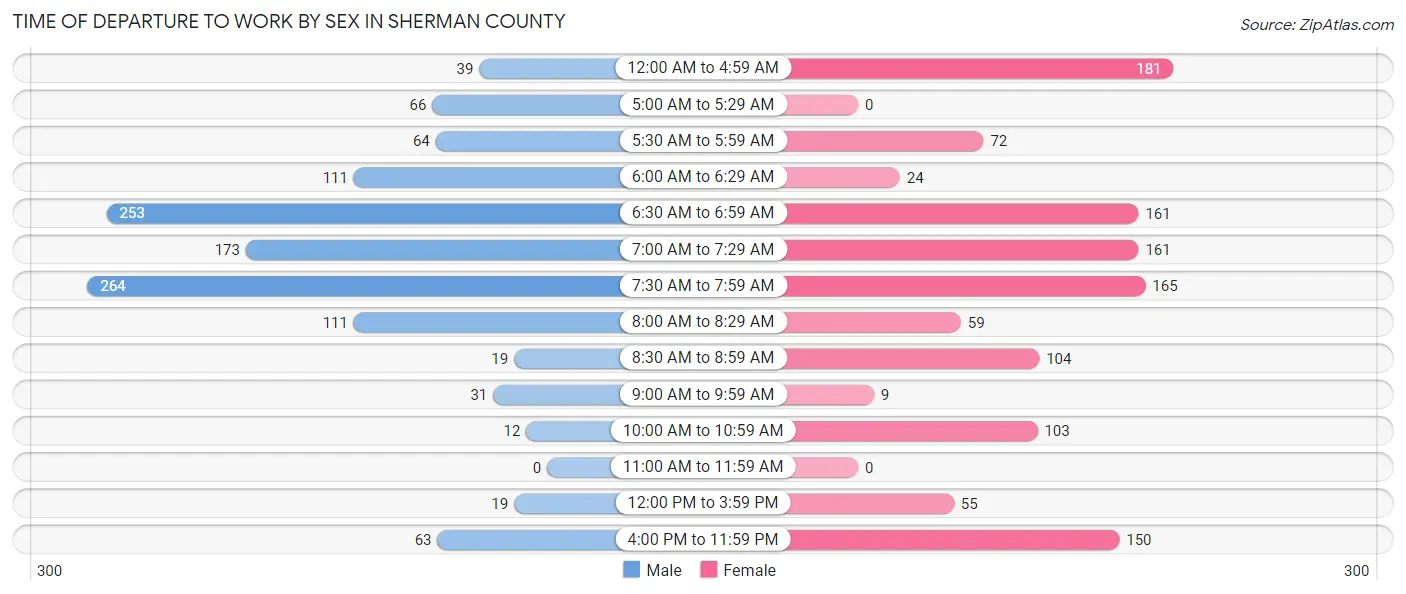
| Time of Departure | Male | Female |
| 12:00 AM to 4:59 AM | 39 (3.2%) | 181 (14.5%) |
| 5:00 AM to 5:29 AM | 66 (5.4%) | 0 (0.0%) |
| 5:30 AM to 5:59 AM | 64 (5.2%) | 72 (5.8%) |
| 6:00 AM to 6:29 AM | 111 (9.1%) | 24 (1.9%) |
| 6:30 AM to 6:59 AM | 253 (20.6%) | 161 (12.9%) |
| 7:00 AM to 7:29 AM | 173 (14.1%) | 161 (12.9%) |
| 7:30 AM to 7:59 AM | 264 (21.5%) | 165 (13.3%) |
| 8:00 AM to 8:29 AM | 111 (9.1%) | 59 (4.7%) |
| 8:30 AM to 8:59 AM | 19 (1.5%) | 104 (8.4%) |
| 9:00 AM to 9:59 AM | 31 (2.5%) | 9 (0.7%) |
| 10:00 AM to 10:59 AM | 12 (1.0%) | 103 (8.3%) |
| 11:00 AM to 11:59 AM | 0 (0.0%) | 0 (0.0%) |
| 12:00 PM to 3:59 PM | 19 (1.5%) | 55 (4.4%) |
| 4:00 PM to 11:59 PM | 63 (5.1%) | 150 (12.1%) |
| Total | 1,225 (100.0%) | 1,244 (100.0%) |
Housing Occupancy in Sherman County
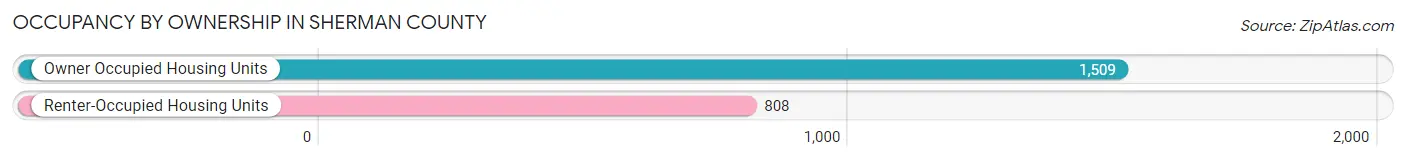
Occupancy by Ownership in Sherman County
Of the total 2,317 dwellings in Sherman County, owner-occupied units account for 1,509 (65.1%), while renter-occupied units make up 808 (34.9%).
| Occupancy | # Housing Units | % Housing Units |
| Owner Occupied Housing Units | 1,509 | 65.1% |
| Renter-Occupied Housing Units | 808 | 34.9% |
| Total Occupied Housing Units | 2,317 | 100.0% |
Occupancy by Household Size in Sherman County
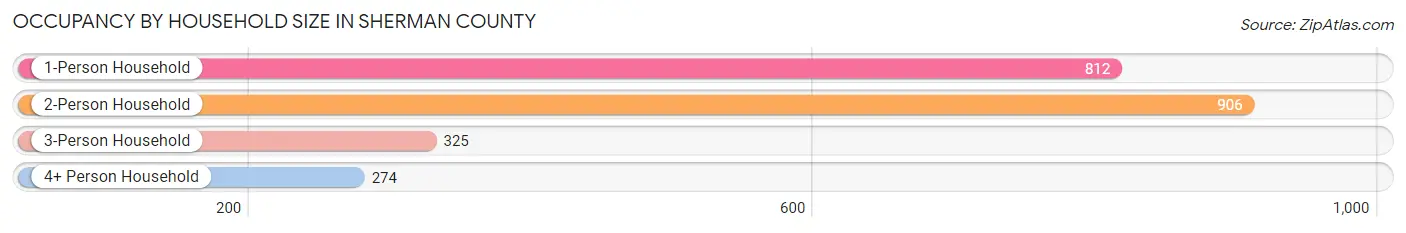
| Household Size | # Housing Units | % Housing Units |
| 1-Person Household | 812 | 35.0% |
| 2-Person Household | 906 | 39.1% |
| 3-Person Household | 325 | 14.0% |
| 4+ Person Household | 274 | 11.8% |
| Total Housing Units | 2,317 | 100.0% |
Occupancy by Ownership by Household Size in Sherman County
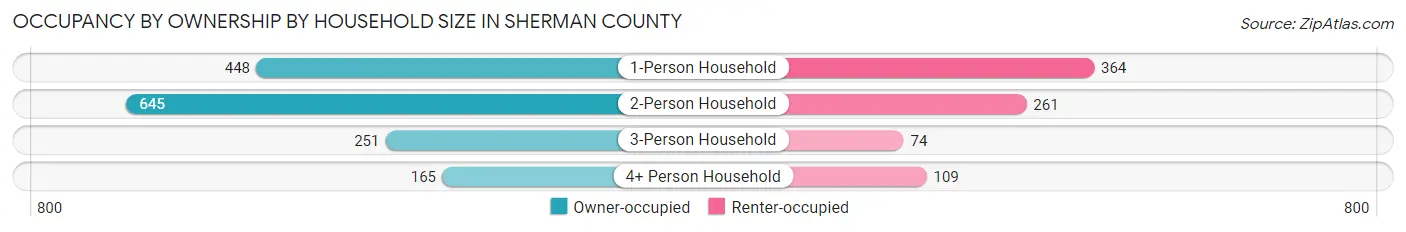
| Household Size | Owner-occupied | Renter-occupied |
| 1-Person Household | 448 (55.2%) | 364 (44.8%) |
| 2-Person Household | 645 (71.2%) | 261 (28.8%) |
| 3-Person Household | 251 (77.2%) | 74 (22.8%) |
| 4+ Person Household | 165 (60.2%) | 109 (39.8%) |
| Total Housing Units | 1,509 (65.1%) | 808 (34.9%) |
Occupancy by Educational Attainment in Sherman County
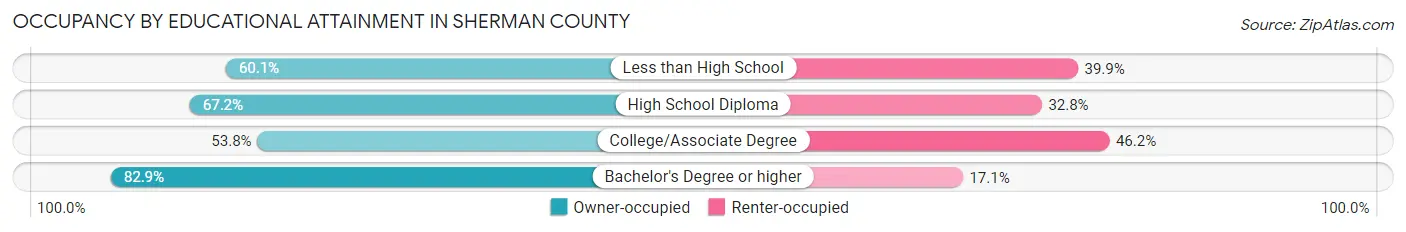
| Household Size | Owner-occupied | Renter-occupied |
| Less than High School | 146 (60.1%) | 97 (39.9%) |
| High School Diploma | 359 (67.2%) | 175 (32.8%) |
| College/Associate Degree | 505 (53.8%) | 433 (46.2%) |
| Bachelor's Degree or higher | 499 (82.9%) | 103 (17.1%) |
Occupancy by Age of Householder in Sherman County
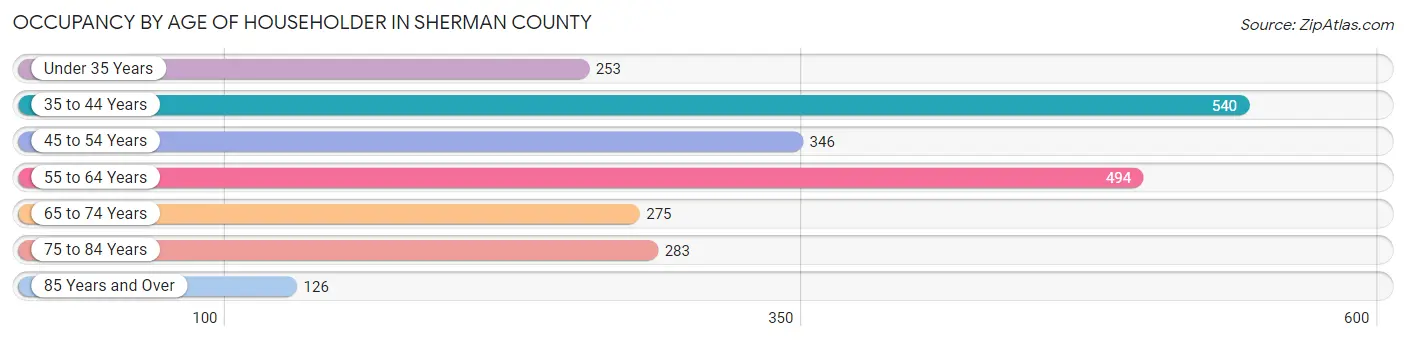
| Age Bracket | # Households | % Households |
| Under 35 Years | 253 | 10.9% |
| 35 to 44 Years | 540 | 23.3% |
| 45 to 54 Years | 346 | 14.9% |
| 55 to 64 Years | 494 | 21.3% |
| 65 to 74 Years | 275 | 11.9% |
| 75 to 84 Years | 283 | 12.2% |
| 85 Years and Over | 126 | 5.4% |
| Total | 2,317 | 100.0% |
Housing Finances in Sherman County
Median Income by Occupancy in Sherman County
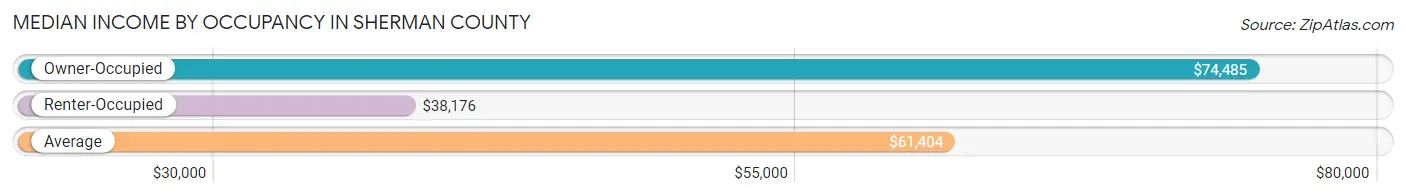
| Occupancy Type | # Households | Median Income |
| Owner-Occupied | 1,509 (65.1%) | $74,485 |
| Renter-Occupied | 808 (34.9%) | $38,176 |
| Average | 2,317 (100.0%) | $61,404 |
Occupancy by Householder Income Bracket in Sherman County
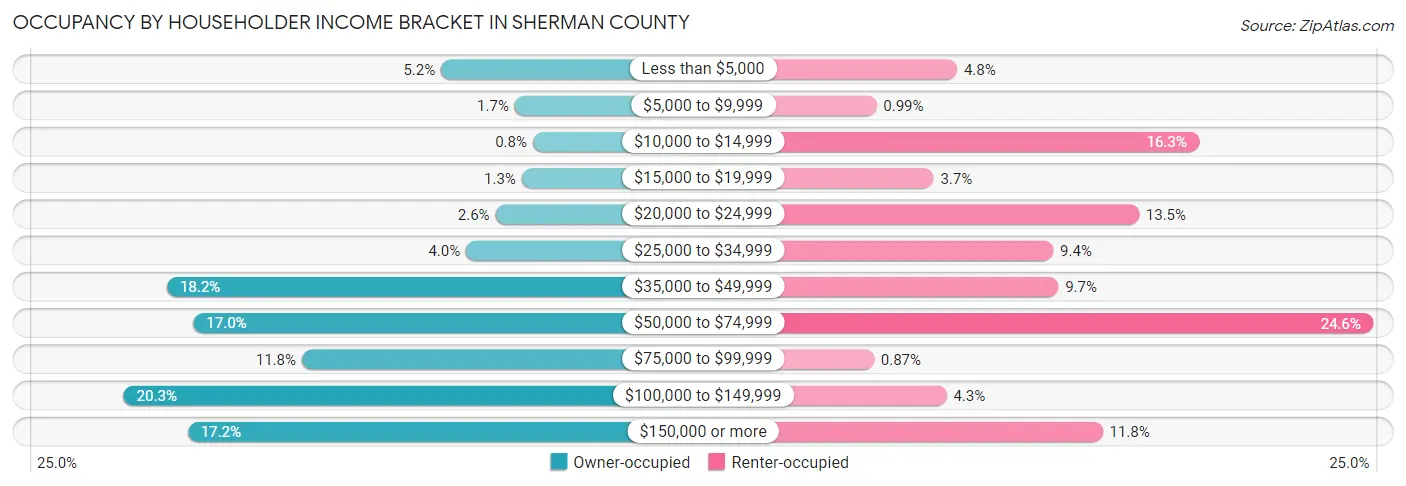
| Income Bracket | Owner-occupied | Renter-occupied |
| Less than $5,000 | 78 (5.2%) | 39 (4.8%) |
| $5,000 to $9,999 | 25 (1.7%) | 8 (1.0%) |
| $10,000 to $14,999 | 12 (0.8%) | 132 (16.3%) |
| $15,000 to $19,999 | 20 (1.3%) | 30 (3.7%) |
| $20,000 to $24,999 | 39 (2.6%) | 109 (13.5%) |
| $25,000 to $34,999 | 60 (4.0%) | 76 (9.4%) |
| $35,000 to $49,999 | 275 (18.2%) | 78 (9.7%) |
| $50,000 to $74,999 | 256 (17.0%) | 199 (24.6%) |
| $75,000 to $99,999 | 178 (11.8%) | 7 (0.9%) |
| $100,000 to $149,999 | 306 (20.3%) | 35 (4.3%) |
| $150,000 or more | 260 (17.2%) | 95 (11.8%) |
| Total | 1,509 (100.0%) | 808 (100.0%) |
Monthly Housing Cost Tiers in Sherman County
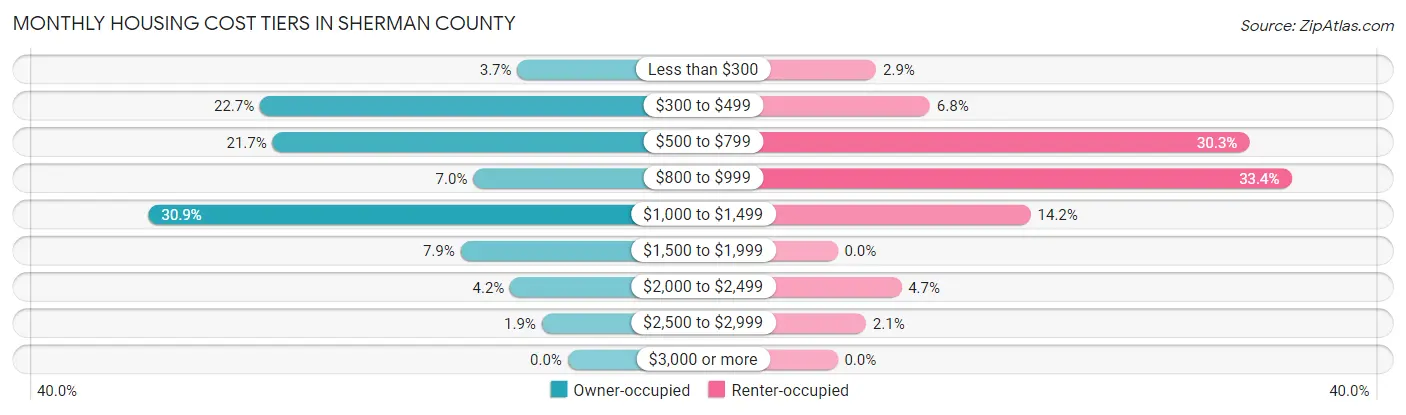
| Monthly Cost | Owner-occupied | Renter-occupied |
| Less than $300 | 56 (3.7%) | 23 (2.9%) |
| $300 to $499 | 342 (22.7%) | 55 (6.8%) |
| $500 to $799 | 328 (21.7%) | 245 (30.3%) |
| $800 to $999 | 105 (7.0%) | 270 (33.4%) |
| $1,000 to $1,499 | 466 (30.9%) | 115 (14.2%) |
| $1,500 to $1,999 | 119 (7.9%) | 0 (0.0%) |
| $2,000 to $2,499 | 64 (4.2%) | 38 (4.7%) |
| $2,500 to $2,999 | 29 (1.9%) | 17 (2.1%) |
| $3,000 or more | 0 (0.0%) | 0 (0.0%) |
| Total | 1,509 (100.0%) | 808 (100.0%) |
Physical Housing Characteristics in Sherman County
Housing Structures in Sherman County
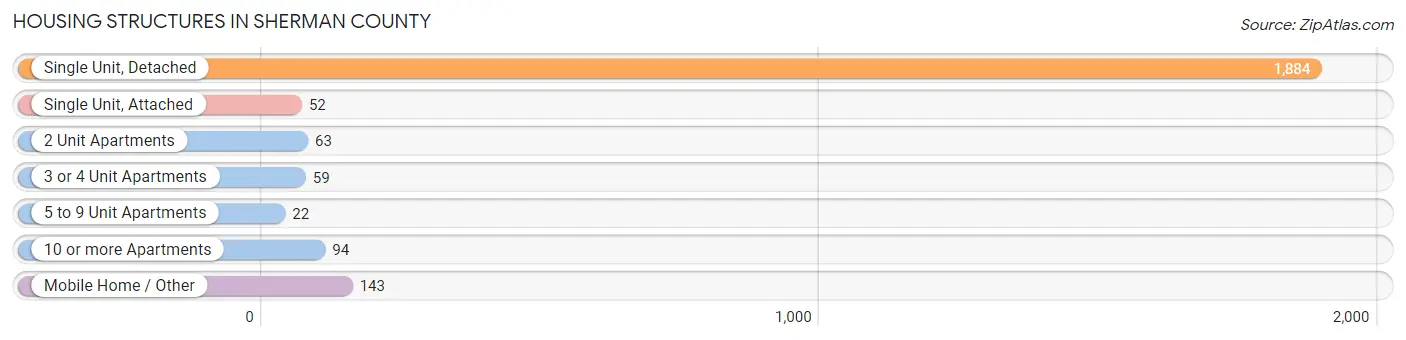
| Structure Type | # Housing Units | % Housing Units |
| Single Unit, Detached | 1,884 | 81.3% |
| Single Unit, Attached | 52 | 2.2% |
| 2 Unit Apartments | 63 | 2.7% |
| 3 or 4 Unit Apartments | 59 | 2.5% |
| 5 to 9 Unit Apartments | 22 | 0.9% |
| 10 or more Apartments | 94 | 4.1% |
| Mobile Home / Other | 143 | 6.2% |
| Total | 2,317 | 100.0% |
Housing Structures by Occupancy in Sherman County
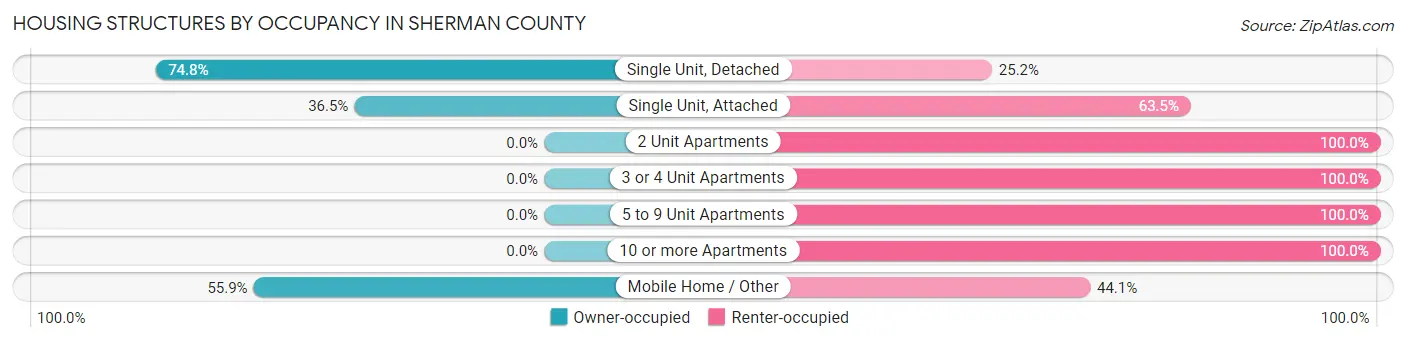
| Structure Type | Owner-occupied | Renter-occupied |
| Single Unit, Detached | 1,410 (74.8%) | 474 (25.2%) |
| Single Unit, Attached | 19 (36.5%) | 33 (63.5%) |
| 2 Unit Apartments | 0 (0.0%) | 63 (100.0%) |
| 3 or 4 Unit Apartments | 0 (0.0%) | 59 (100.0%) |
| 5 to 9 Unit Apartments | 0 (0.0%) | 22 (100.0%) |
| 10 or more Apartments | 0 (0.0%) | 94 (100.0%) |
| Mobile Home / Other | 80 (55.9%) | 63 (44.1%) |
| Total | 1,509 (65.1%) | 808 (34.9%) |
Housing Structures by Number of Rooms in Sherman County
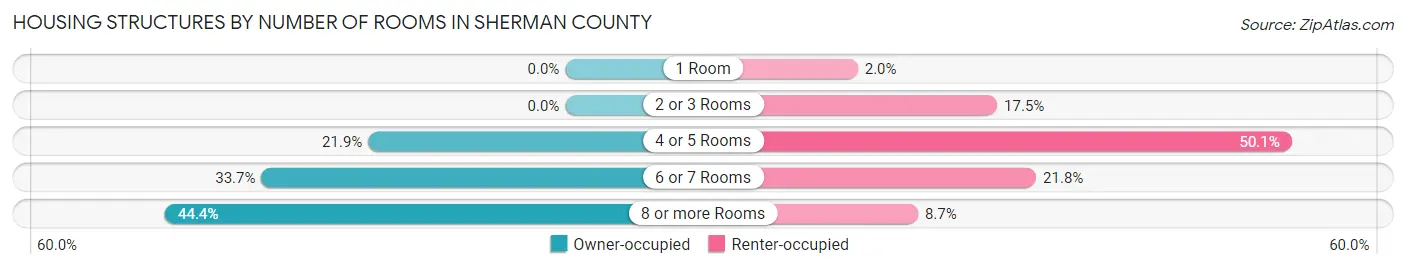
| Number of Rooms | Owner-occupied | Renter-occupied |
| 1 Room | 0 (0.0%) | 16 (2.0%) |
| 2 or 3 Rooms | 0 (0.0%) | 141 (17.4%) |
| 4 or 5 Rooms | 330 (21.9%) | 405 (50.1%) |
| 6 or 7 Rooms | 509 (33.7%) | 176 (21.8%) |
| 8 or more Rooms | 670 (44.4%) | 70 (8.7%) |
| Total | 1,509 (100.0%) | 808 (100.0%) |
Housing Structure by Heating Type in Sherman County
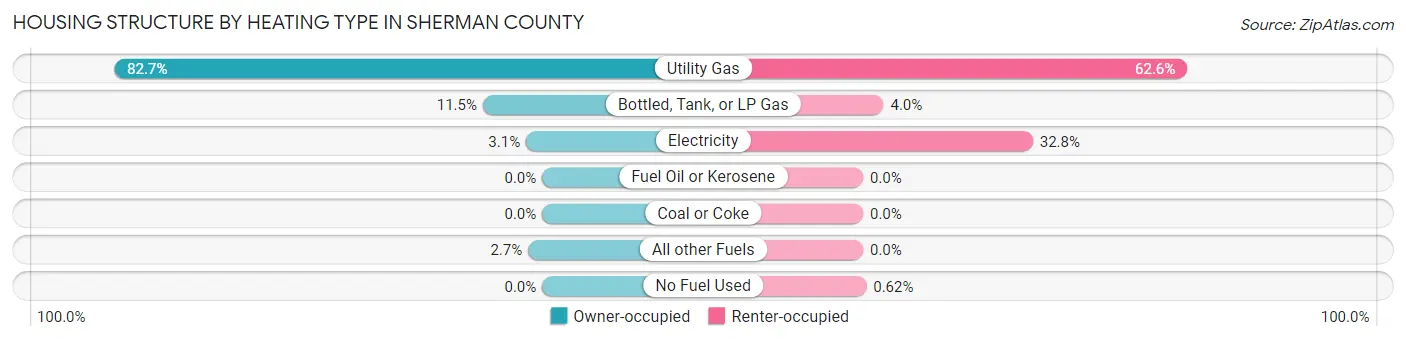
| Heating Type | Owner-occupied | Renter-occupied |
| Utility Gas | 1,248 (82.7%) | 506 (62.6%) |
| Bottled, Tank, or LP Gas | 173 (11.5%) | 32 (4.0%) |
| Electricity | 47 (3.1%) | 265 (32.8%) |
| Fuel Oil or Kerosene | 0 (0.0%) | 0 (0.0%) |
| Coal or Coke | 0 (0.0%) | 0 (0.0%) |
| All other Fuels | 41 (2.7%) | 0 (0.0%) |
| No Fuel Used | 0 (0.0%) | 5 (0.6%) |
| Total | 1,509 (100.0%) | 808 (100.0%) |
Household Vehicle Usage in Sherman County
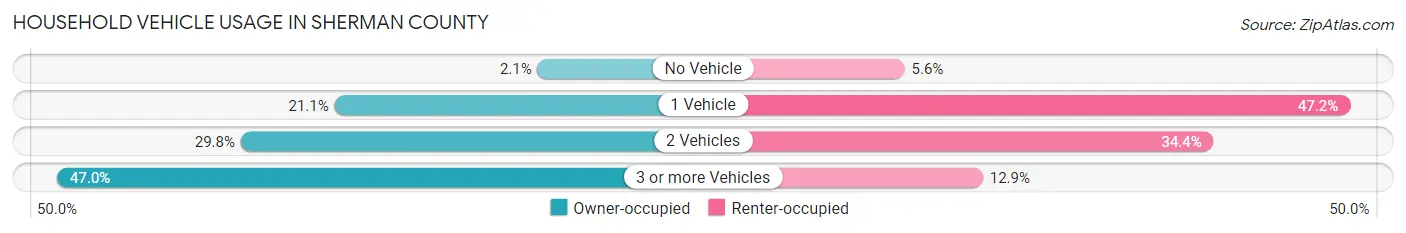
| Vehicles per Household | Owner-occupied | Renter-occupied |
| No Vehicle | 32 (2.1%) | 45 (5.6%) |
| 1 Vehicle | 318 (21.1%) | 381 (47.1%) |
| 2 Vehicles | 450 (29.8%) | 278 (34.4%) |
| 3 or more Vehicles | 709 (47.0%) | 104 (12.9%) |
| Total | 1,509 (100.0%) | 808 (100.0%) |
Real Estate & Mortgages in Sherman County
Real Estate and Mortgage Overview in Sherman County
| Characteristic | Without Mortgage | With Mortgage |
| Housing Units | 715 | 794 |
| Median Property Value | $92,900 | $145,500 |
| Median Household Income | $63,445 | $164 |
| Monthly Housing Costs | $475 | $0 |
| Real Estate Taxes | $1,349 | $8 |
Property Value by Mortgage Status in Sherman County
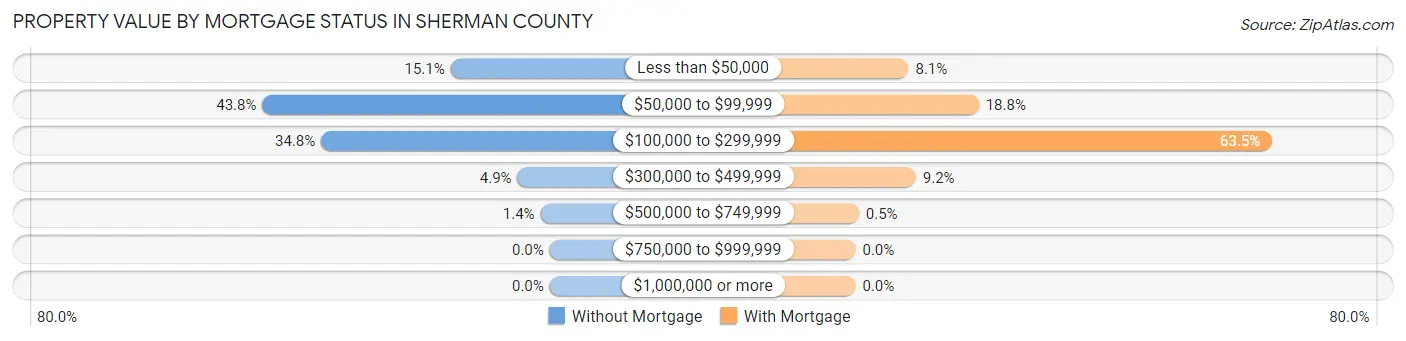
| Property Value | Without Mortgage | With Mortgage |
| Less than $50,000 | 108 (15.1%) | 64 (8.1%) |
| $50,000 to $99,999 | 313 (43.8%) | 149 (18.8%) |
| $100,000 to $299,999 | 249 (34.8%) | 504 (63.5%) |
| $300,000 to $499,999 | 35 (4.9%) | 73 (9.2%) |
| $500,000 to $749,999 | 10 (1.4%) | 4 (0.5%) |
| $750,000 to $999,999 | 0 (0.0%) | 0 (0.0%) |
| $1,000,000 or more | 0 (0.0%) | 0 (0.0%) |
| Total | 715 (100.0%) | 794 (100.0%) |
Household Income by Mortgage Status in Sherman County
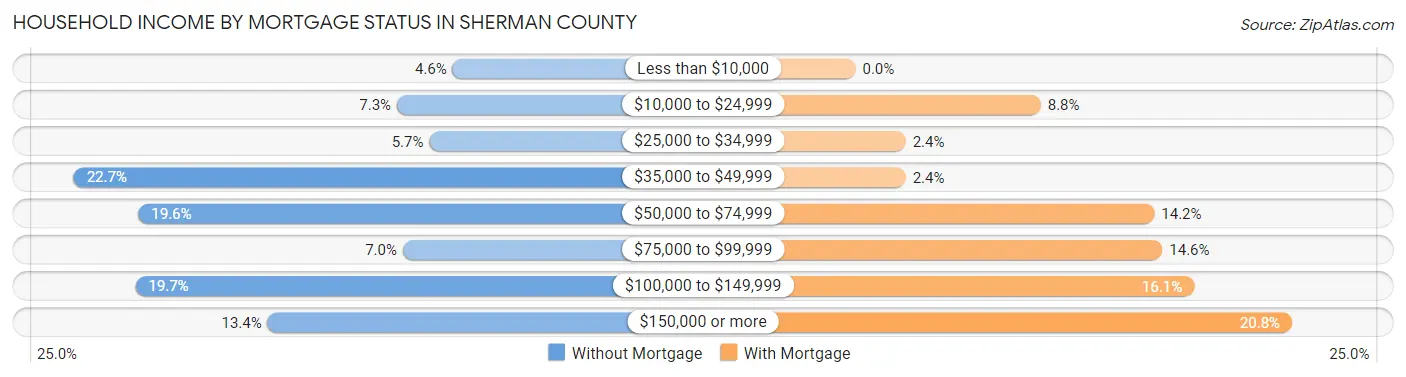
| Household Income | Without Mortgage | With Mortgage |
| Less than $10,000 | 33 (4.6%) | 0 (0.0%) |
| $10,000 to $24,999 | 52 (7.3%) | 70 (8.8%) |
| $25,000 to $34,999 | 41 (5.7%) | 19 (2.4%) |
| $35,000 to $49,999 | 162 (22.7%) | 19 (2.4%) |
| $50,000 to $74,999 | 140 (19.6%) | 113 (14.2%) |
| $75,000 to $99,999 | 50 (7.0%) | 116 (14.6%) |
| $100,000 to $149,999 | 141 (19.7%) | 128 (16.1%) |
| $150,000 or more | 96 (13.4%) | 165 (20.8%) |
| Total | 715 (100.0%) | 794 (100.0%) |
Property Value to Household Income Ratio in Sherman County
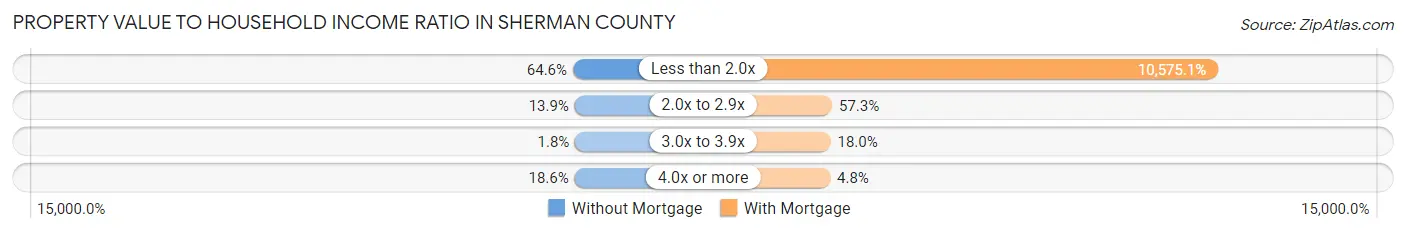
| Value-to-Income Ratio | Without Mortgage | With Mortgage |
| Less than 2.0x | 462 (64.6%) | 83,966 (10,575.1%) |
| 2.0x to 2.9x | 99 (13.9%) | 455 (57.3%) |
| 3.0x to 3.9x | 13 (1.8%) | 143 (18.0%) |
| 4.0x or more | 133 (18.6%) | 38 (4.8%) |
| Total | 715 (100.0%) | 794 (100.0%) |
Real Estate Taxes by Mortgage Status in Sherman County
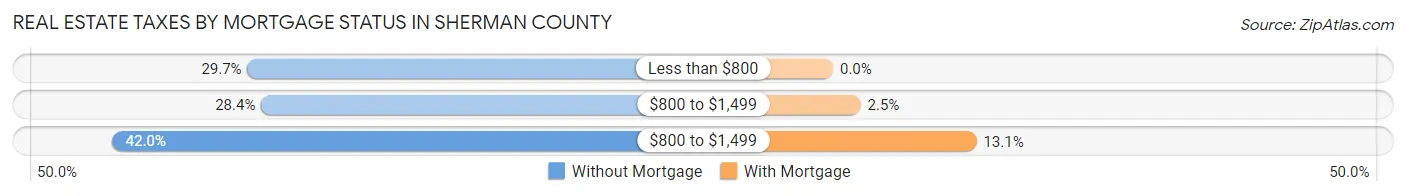
| Property Taxes | Without Mortgage | With Mortgage |
| Less than $800 | 212 (29.6%) | 0 (0.0%) |
| $800 to $1,499 | 203 (28.4%) | 20 (2.5%) |
| $800 to $1,499 | 300 (42.0%) | 104 (13.1%) |
| Total | 715 (100.0%) | 794 (100.0%) |
Health & Disability in Sherman County
Health Insurance Coverage by Age in Sherman County
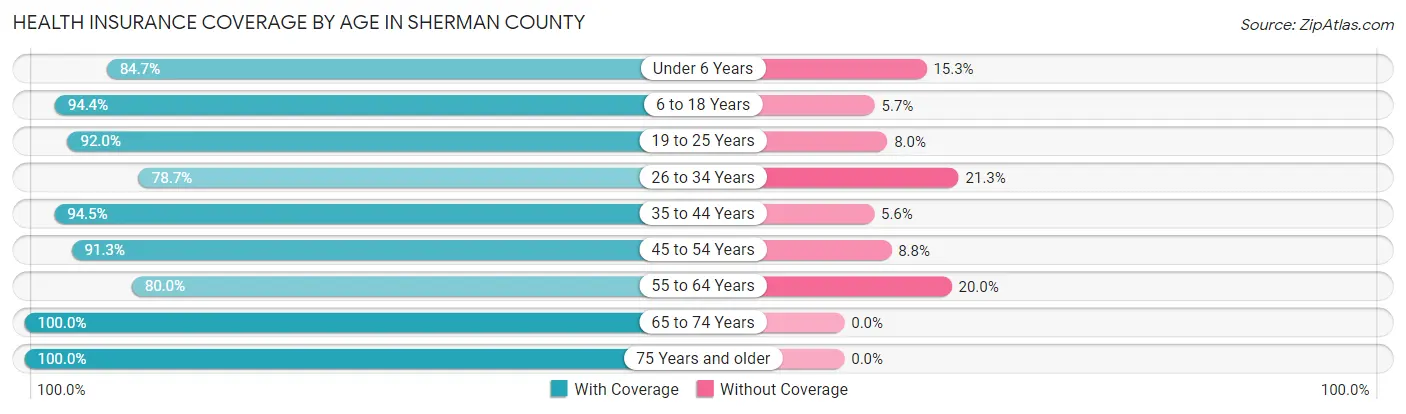
| Age Bracket | With Coverage | Without Coverage |
| Under 6 Years | 387 (84.7%) | 70 (15.3%) |
| 6 to 18 Years | 1,119 (94.4%) | 67 (5.7%) |
| 19 to 25 Years | 563 (92.0%) | 49 (8.0%) |
| 26 to 34 Years | 262 (78.7%) | 71 (21.3%) |
| 35 to 44 Years | 783 (94.5%) | 46 (5.6%) |
| 45 to 54 Years | 459 (91.2%) | 44 (8.7%) |
| 55 to 64 Years | 628 (80.0%) | 157 (20.0%) |
| 65 to 74 Years | 603 (100.0%) | 0 (0.0%) |
| 75 Years and older | 564 (100.0%) | 0 (0.0%) |
| Total | 5,368 (91.4%) | 504 (8.6%) |
Health Insurance Coverage by Citizenship Status in Sherman County
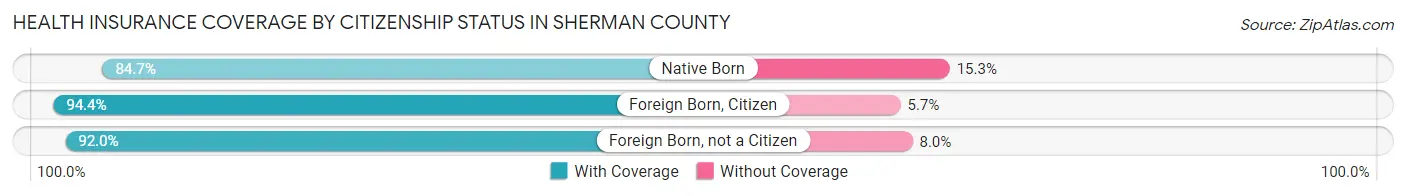
| Citizenship Status | With Coverage | Without Coverage |
| Native Born | 387 (84.7%) | 70 (15.3%) |
| Foreign Born, Citizen | 1,119 (94.4%) | 67 (5.7%) |
| Foreign Born, not a Citizen | 563 (92.0%) | 49 (8.0%) |
Health Insurance Coverage by Household Income in Sherman County
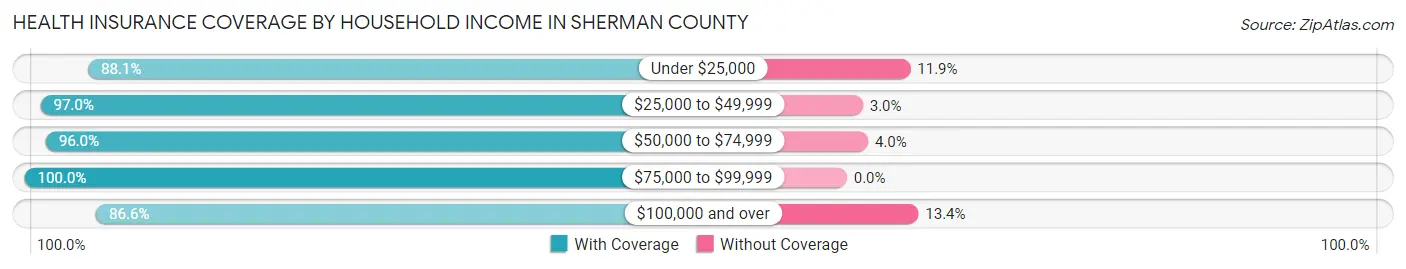
| Household Income | With Coverage | Without Coverage |
| Under $25,000 | 658 (88.1%) | 89 (11.9%) |
| $25,000 to $49,999 | 1,037 (97.0%) | 32 (3.0%) |
| $50,000 to $74,999 | 1,062 (96.0%) | 44 (4.0%) |
| $75,000 to $99,999 | 398 (100.0%) | 0 (0.0%) |
| $100,000 and over | 1,963 (86.6%) | 304 (13.4%) |
Public vs Private Health Insurance Coverage by Age in Sherman County
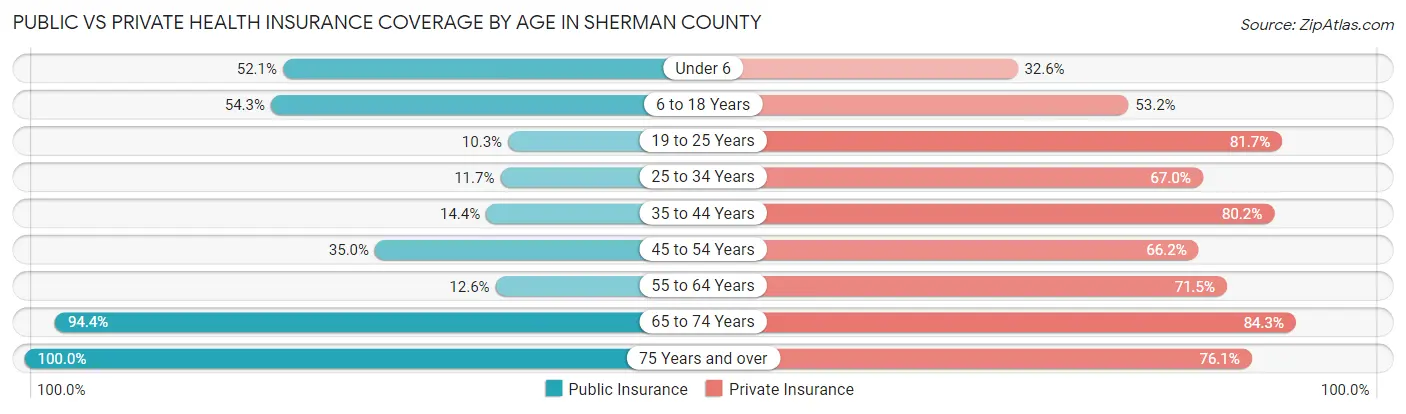
| Age Bracket | Public Insurance | Private Insurance |
| Under 6 | 238 (52.1%) | 149 (32.6%) |
| 6 to 18 Years | 644 (54.3%) | 631 (53.2%) |
| 19 to 25 Years | 63 (10.3%) | 500 (81.7%) |
| 25 to 34 Years | 39 (11.7%) | 223 (67.0%) |
| 35 to 44 Years | 119 (14.3%) | 665 (80.2%) |
| 45 to 54 Years | 176 (35.0%) | 333 (66.2%) |
| 55 to 64 Years | 99 (12.6%) | 561 (71.5%) |
| 65 to 74 Years | 569 (94.4%) | 508 (84.3%) |
| 75 Years and over | 564 (100.0%) | 429 (76.1%) |
| Total | 2,511 (42.8%) | 3,999 (68.1%) |
Disability Status by Sex by Age in Sherman County
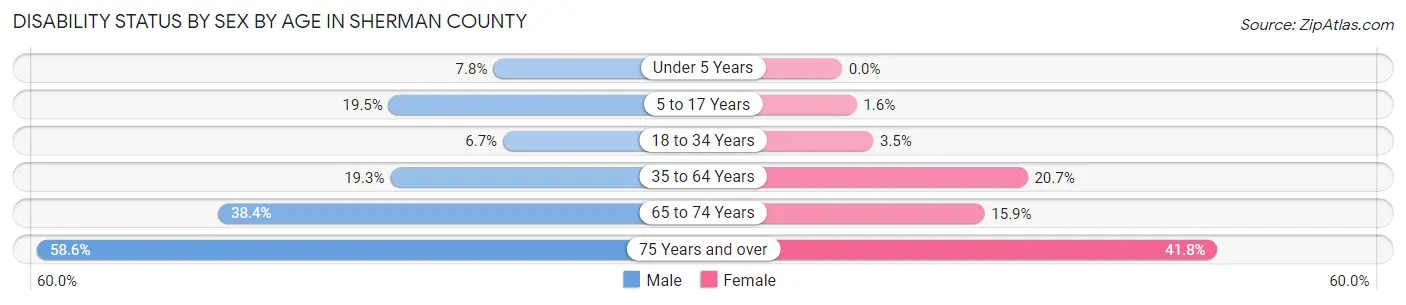
| Age Bracket | Male | Female |
| Under 5 Years | 21 (7.8%) | 0 (0.0%) |
| 5 to 17 Years | 108 (19.5%) | 7 (1.6%) |
| 18 to 34 Years | 48 (6.7%) | 17 (3.5%) |
| 35 to 64 Years | 204 (19.3%) | 219 (20.7%) |
| 65 to 74 Years | 118 (38.4%) | 47 (15.9%) |
| 75 Years and over | 126 (58.6%) | 146 (41.8%) |
Disability Class by Sex by Age in Sherman County
Disability Class: Hearing Difficulty
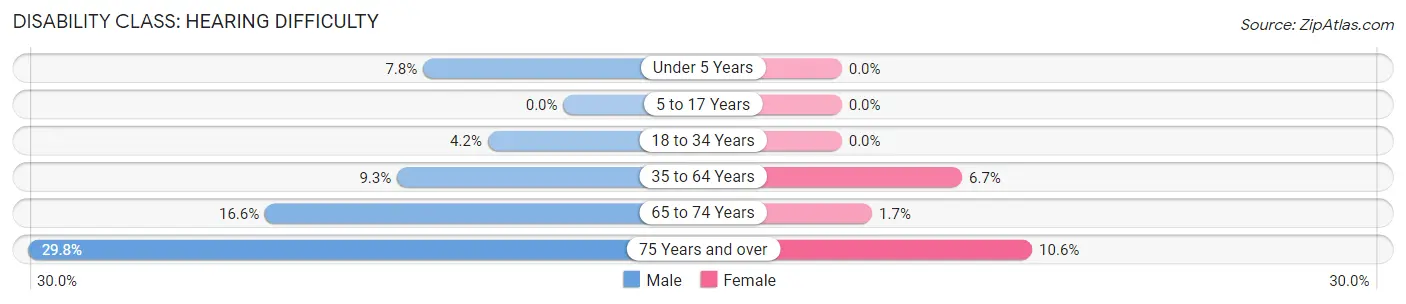
| Age Bracket | Male | Female |
| Under 5 Years | 21 (7.8%) | 0 (0.0%) |
| 5 to 17 Years | 0 (0.0%) | 0 (0.0%) |
| 18 to 34 Years | 30 (4.2%) | 0 (0.0%) |
| 35 to 64 Years | 98 (9.3%) | 71 (6.7%) |
| 65 to 74 Years | 51 (16.6%) | 5 (1.7%) |
| 75 Years and over | 64 (29.8%) | 37 (10.6%) |
Disability Class: Vision Difficulty
| Age Bracket | Male | Female |
| Under 5 Years | 0 (0.0%) | 0 (0.0%) |
| 5 to 17 Years | 6 (1.1%) | 0 (0.0%) |
| 18 to 34 Years | 5 (0.7%) | 0 (0.0%) |
| 35 to 64 Years | 57 (5.4%) | 89 (8.4%) |
| 65 to 74 Years | 16 (5.2%) | 0 (0.0%) |
| 75 Years and over | 61 (28.4%) | 9 (2.6%) |
Disability Class: Cognitive Difficulty
| Age Bracket | Male | Female |
| 5 to 17 Years | 102 (18.4%) | 7 (1.6%) |
| 18 to 34 Years | 46 (6.5%) | 1 (0.2%) |
| 35 to 64 Years | 70 (6.6%) | 30 (2.8%) |
| 65 to 74 Years | 40 (13.0%) | 16 (5.4%) |
| 75 Years and over | 53 (24.6%) | 74 (21.2%) |
Disability Class: Ambulatory Difficulty
| Age Bracket | Male | Female |
| 5 to 17 Years | 0 (0.0%) | 0 (0.0%) |
| 18 to 34 Years | 2 (0.3%) | 16 (3.3%) |
| 35 to 64 Years | 48 (4.5%) | 107 (10.1%) |
| 65 to 74 Years | 67 (21.8%) | 22 (7.4%) |
| 75 Years and over | 75 (34.9%) | 141 (40.4%) |
Disability Class: Self-Care Difficulty
| Age Bracket | Male | Female |
| 5 to 17 Years | 0 (0.0%) | 0 (0.0%) |
| 18 to 34 Years | 5 (0.7%) | 0 (0.0%) |
| 35 to 64 Years | 14 (1.3%) | 1 (0.1%) |
| 65 to 74 Years | 39 (12.7%) | 0 (0.0%) |
| 75 Years and over | 12 (5.6%) | 89 (25.5%) |
Technology Access in Sherman County
Computing Device Access in Sherman County
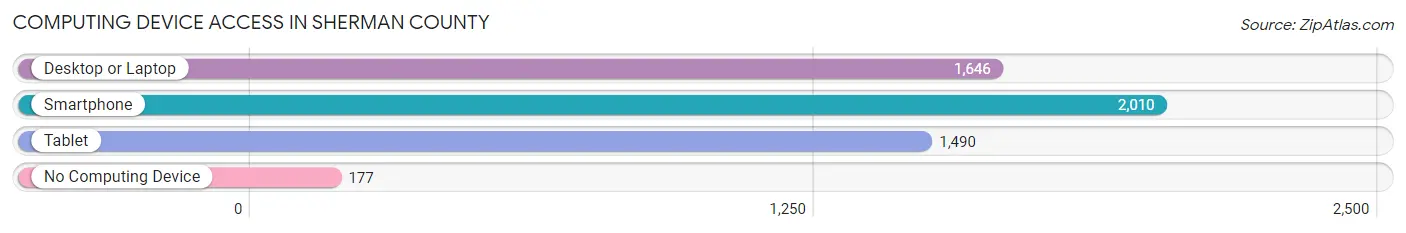
| Device Type | # Households | % Households |
| Desktop or Laptop | 1,646 | 71.0% |
| Smartphone | 2,010 | 86.8% |
| Tablet | 1,490 | 64.3% |
| No Computing Device | 177 | 7.6% |
| Total | 2,317 | 100.0% |
Internet Access in Sherman County
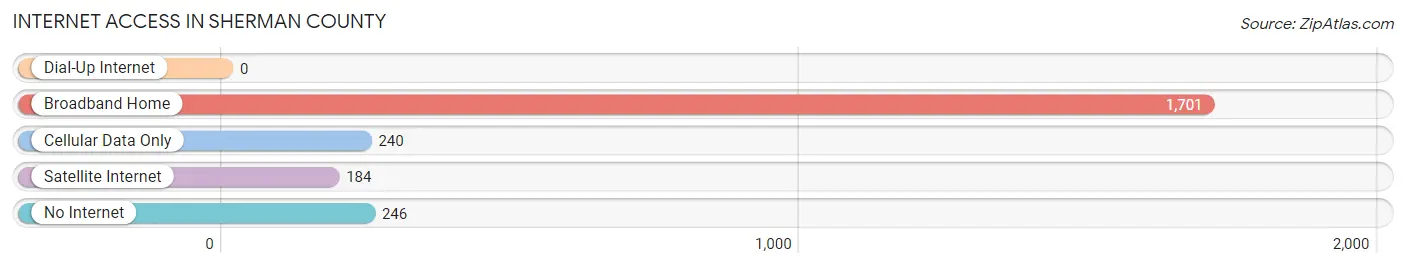
| Internet Type | # Households | % Households |
| Dial-Up Internet | 0 | 0.0% |
| Broadband Home | 1,701 | 73.4% |
| Cellular Data Only | 240 | 10.4% |
| Satellite Internet | 184 | 7.9% |
| No Internet | 246 | 10.6% |
| Total | 2,317 | 100.0% |
Sherman County Summary
Sherman County, Kansas is located in the northwest corner of the state and is bordered by Nebraska to the north, Colorado to the west, and the state of Kansas to the east and south. The county seat is Goodland, and the county is named after General William Tecumseh Sherman, who served in the Civil War. The county has a total area of 890 square miles, with a population of 6,068 as of the 2010 census.
Sherman County is part of the High Plains region of the Great Plains, and is characterized by flat terrain and rolling hills. The county is mostly rural, with the majority of the population living in small towns and rural areas. The county is home to several small lakes, including Lake Scott State Park, which is a popular destination for fishing, camping, and other outdoor activities.
The economy of Sherman County is largely based on agriculture, with wheat, corn, and sorghum being the primary crops. The county also has a strong manufacturing sector, with several companies producing agricultural equipment, furniture, and other products. The county is also home to several oil and gas wells, which provide jobs and revenue to the local economy.
The demographics of Sherman County are largely white, with a small Hispanic population. The median household income is $45,000, and the median home value is $90,000. The unemployment rate is 4.2%, and the poverty rate is 11.2%.
Sherman County is served by several school districts, including Goodland USD 352, Sherman County USD 361, and Brewster USD 364. The county is also home to several higher education institutions, including Northwest Kansas Technical College and Fort Hays State University.
Sherman County is a rural county with a strong agricultural base and a growing manufacturing sector. The county is home to several small towns and rural areas, and is a popular destination for outdoor activities. The county has a diverse population and a strong economy, and is a great place to live and work.
Common Questions
What is Per Capita Income in Sherman County?
Per Capita income in Sherman County is $37,930.
What is the Median Family Income in Sherman County?
Median Family Income in Sherman County is $73,530.
What is the Median Household income in Sherman County?
Median Household Income in Sherman County is $61,404.
What is Income or Wage Gap in Sherman County?
Income or Wage Gap in Sherman County is 42.2%.
Women in Sherman County earn 57.8 cents for every dollar earned by a man.
What is Inequality or Gini Index in Sherman County?
Inequality or Gini Index in Sherman County is 0.50.
What is the Total Population of Sherman County?
Total Population of Sherman County is 5,940.
What is the Total Male Population of Sherman County?
Total Male Population of Sherman County is 3,136.
What is the Total Female Population of Sherman County?
Total Female Population of Sherman County is 2,804.
What is the Ratio of Males per 100 Females in Sherman County?
There are 111.84 Males per 100 Females in Sherman County.
What is the Ratio of Females per 100 Males in Sherman County?
There are 89.41 Females per 100 Males in Sherman County.
What is the Median Population Age in Sherman County?
Median Population Age in Sherman County is 38.0 Years.
What is the Average Family Size in Sherman County
Average Family Size in Sherman County is 3.2 People.
What is the Average Household Size in Sherman County
Average Household Size in Sherman County is 2.4 People.
How Large is the Labor Force in Sherman County?
There are 3,126 People in the Labor Forcein in Sherman County.
What is the Percentage of People in the Labor Force in Sherman County?
65.6% of People are in the Labor Force in Sherman County.
What is the Unemployment Rate in Sherman County?
Unemployment Rate in Sherman County is 2.4%.