Russell County, KS Map & Demographics
Russell County Map
Russell County Overview
$30,680
PER CAPITA INCOME
$66,153
AVG FAMILY INCOME
$49,929
AVG HOUSEHOLD INCOME
33.0%
WAGE / INCOME GAP [ % ]
67.0¢/ $1
WAGE / INCOME GAP [ $ ]
$9,118
FAMILY INCOME DEFICIT
0.47
INEQUALITY / GINI INDEX
6,702
TOTAL POPULATION
3,291
MALE POPULATION
3,411
FEMALE POPULATION
96.48
MALES / 100 FEMALES
103.65
FEMALES / 100 MALES
45.3
MEDIAN AGE
2.9
AVG FAMILY SIZE
2.2
AVG HOUSEHOLD SIZE
3,343
LABOR FORCE [ PEOPLE ]
61.1%
PERCENT IN LABOR FORCE
3.9%
UNEMPLOYMENT RATE
Russell County Area Codes
Income in Russell County
Income Overview in Russell County
Per Capita Income in Russell County is $30,680, while median incomes of families and households are $66,153 and $49,929 respectively.
| Characteristic | Number | Measure |
| Per Capita Income | 6,702 | $30,680 |
| Median Family Income | 1,687 | $66,153 |
| Mean Family Income | 1,687 | $92,023 |
| Median Household Income | 2,995 | $49,929 |
| Mean Household Income | 2,995 | $68,506 |
| Income Deficit | 1,687 | $9,118 |
| Wage / Income Gap (%) | 6,702 | 33.04% |
| Wage / Income Gap ($) | 6,702 | 66.96¢ per $1 |
| Gini / Inequality Index | 6,702 | 0.47 |
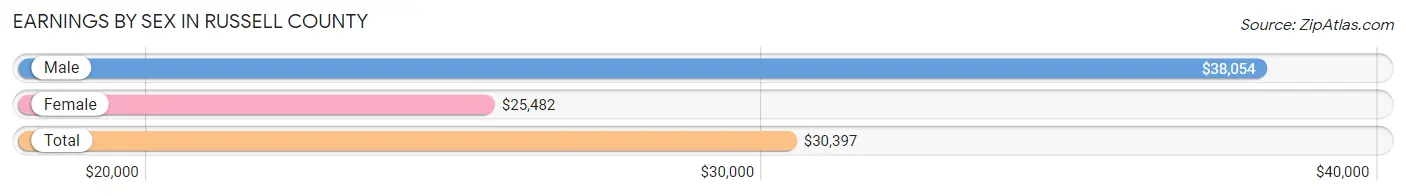
Earnings by Sex in Russell County
Average Earnings in Russell County are $30,397, $38,054 for men and $25,482 for women, a difference of 33.0%.
| Sex | Number | Average Earnings |
| Male | 1,861 (50.2%) | $38,054 |
| Female | 1,848 (49.8%) | $25,482 |
| Total | 3,709 (100.0%) | $30,397 |
Earnings by Sex by Income Bracket in Russell County
The most common earnings brackets in Russell County are $55,000 to $64,999 for men (223 | 12.0%) and $2,499 or less for women (246 | 13.3%).
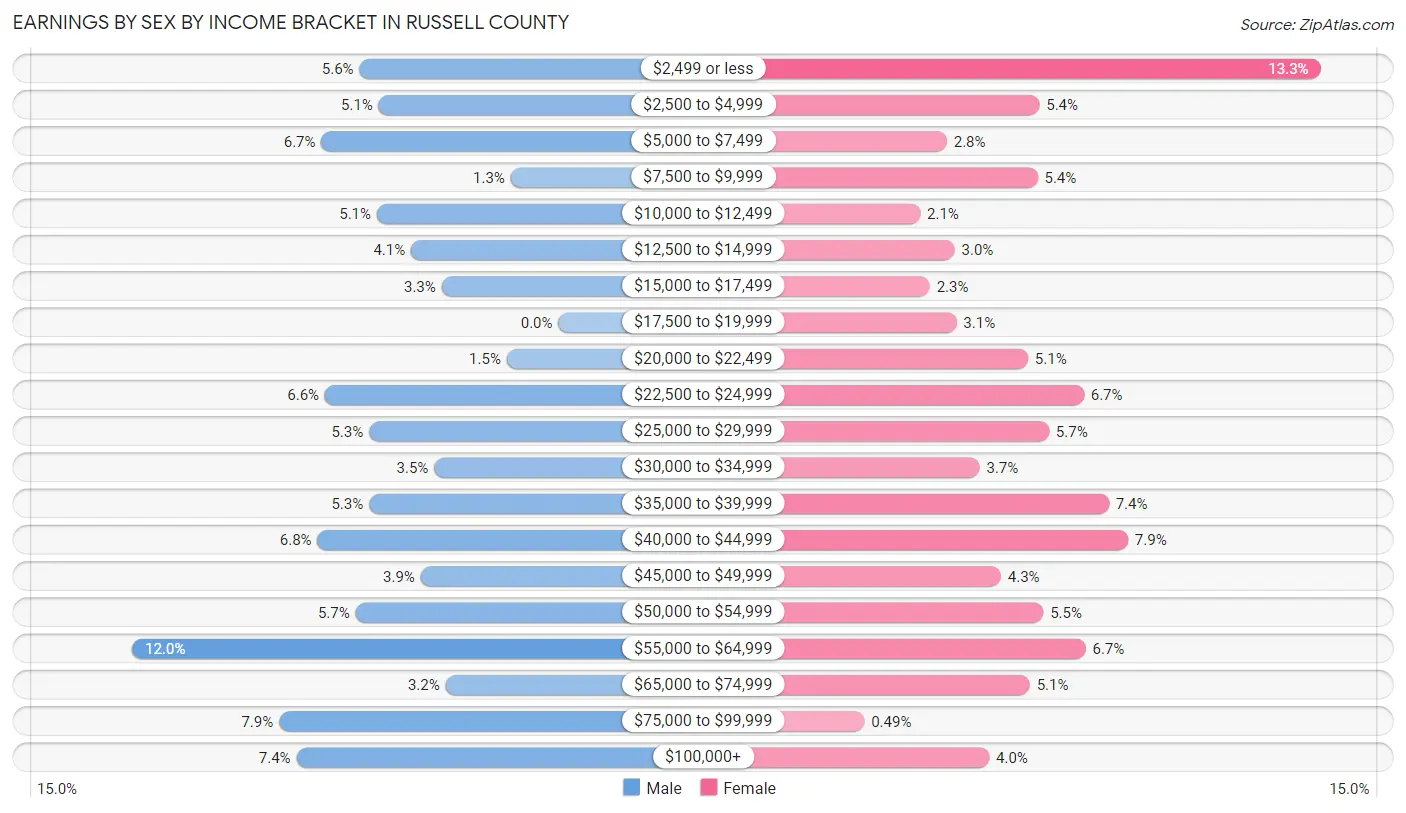
| Income | Male | Female |
| $2,499 or less | 104 (5.6%) | 246 (13.3%) |
| $2,500 to $4,999 | 94 (5.1%) | 100 (5.4%) |
| $5,000 to $7,499 | 124 (6.7%) | 52 (2.8%) |
| $7,500 to $9,999 | 25 (1.3%) | 99 (5.4%) |
| $10,000 to $12,499 | 95 (5.1%) | 38 (2.1%) |
| $12,500 to $14,999 | 77 (4.1%) | 56 (3.0%) |
| $15,000 to $17,499 | 61 (3.3%) | 43 (2.3%) |
| $17,500 to $19,999 | 0 (0.0%) | 57 (3.1%) |
| $20,000 to $22,499 | 27 (1.5%) | 94 (5.1%) |
| $22,500 to $24,999 | 122 (6.6%) | 123 (6.7%) |
| $25,000 to $29,999 | 99 (5.3%) | 105 (5.7%) |
| $30,000 to $34,999 | 65 (3.5%) | 69 (3.7%) |
| $35,000 to $39,999 | 99 (5.3%) | 136 (7.4%) |
| $40,000 to $44,999 | 126 (6.8%) | 146 (7.9%) |
| $45,000 to $49,999 | 72 (3.9%) | 80 (4.3%) |
| $50,000 to $54,999 | 106 (5.7%) | 102 (5.5%) |
| $55,000 to $64,999 | 223 (12.0%) | 124 (6.7%) |
| $65,000 to $74,999 | 59 (3.2%) | 95 (5.1%) |
| $75,000 to $99,999 | 146 (7.9%) | 9 (0.5%) |
| $100,000+ | 137 (7.4%) | 74 (4.0%) |
| Total | 1,861 (100.0%) | 1,848 (100.0%) |
Earnings by Sex by Educational Attainment in Russell County
Average earnings in Russell County are $42,443 for men and $33,047 for women, a difference of 22.1%. Men with an educational attainment of college or associate's degree enjoy the highest average annual earnings of $50,060, while those with less than high school education earn the least with $14,671. Women with an educational attainment of graduate degree earn the most with the average annual earnings of $55,852, while those with high school diploma education have the smallest earnings of $25,053.
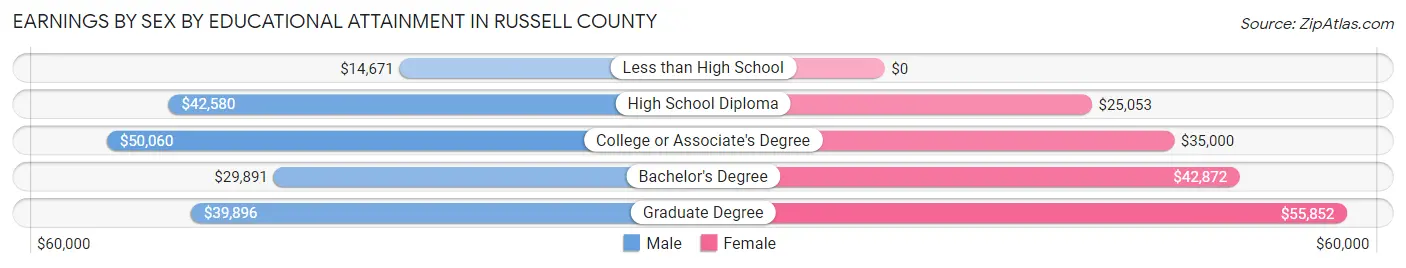
| Educational Attainment | Male Income | Female Income |
| Less than High School | $14,671 | $0 |
| High School Diploma | $42,580 | $25,053 |
| College or Associate's Degree | $50,060 | $35,000 |
| Bachelor's Degree | $29,891 | $42,872 |
| Graduate Degree | $39,896 | $55,852 |
| Total | $42,443 | $33,047 |
Family Income in Russell County
Family Income Brackets in Russell County
According to the Russell County family income data, there are 474 families falling into the $50,000 to $74,999 income range, which is the most common income bracket and makes up 28.1% of all families. Conversely, the $15,000 to $24,999 income bracket is the least frequent group with only 34 families (2.0%) belonging to this category.
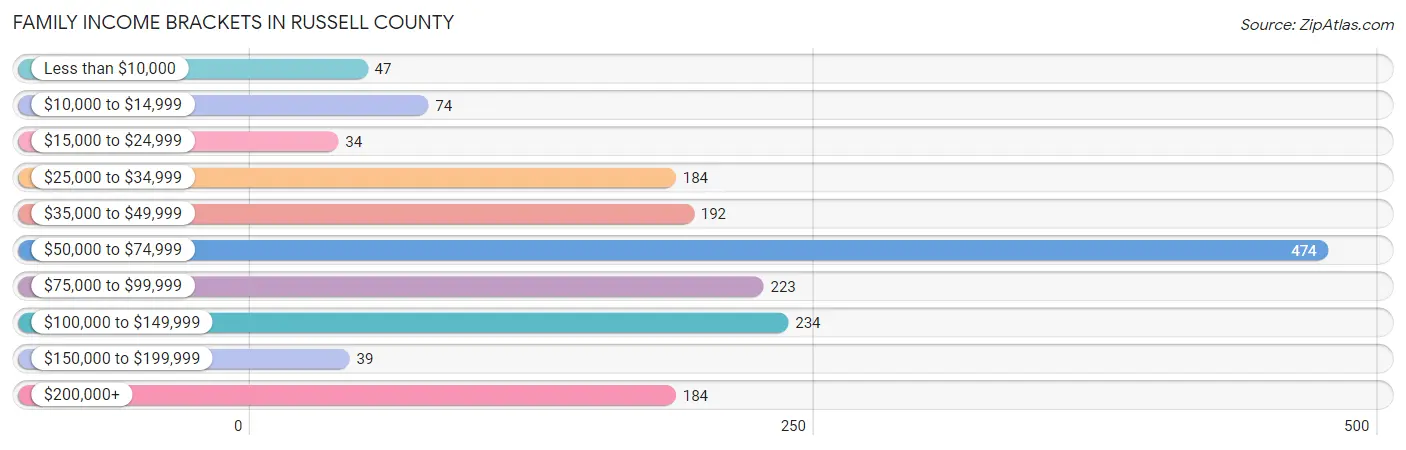
| Income Bracket | # Families | % Families |
| Less than $10,000 | 47 | 2.8% |
| $10,000 to $14,999 | 74 | 4.4% |
| $15,000 to $24,999 | 34 | 2.0% |
| $25,000 to $34,999 | 184 | 10.9% |
| $35,000 to $49,999 | 192 | 11.4% |
| $50,000 to $74,999 | 474 | 28.1% |
| $75,000 to $99,999 | 223 | 13.2% |
| $100,000 to $149,999 | 234 | 13.9% |
| $150,000 to $199,999 | 39 | 2.3% |
| $200,000+ | 184 | 10.9% |
Family Income by Famaliy Size in Russell County
5-person families (77 | 4.6%) account for the highest median family income in Russell County with $88,750 per family, while 2-person families (986 | 58.5%) have the highest median income of $32,350 per family member.
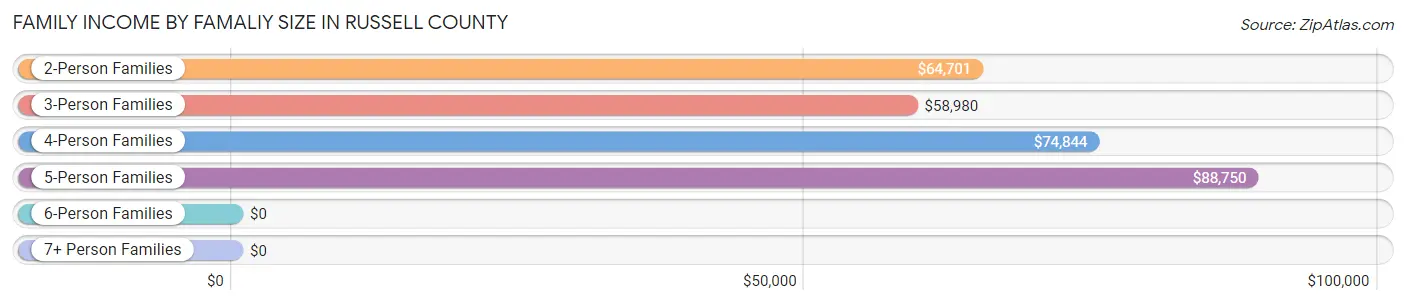
| Income Bracket | # Families | Median Income |
| 2-Person Families | 986 (58.5%) | $64,701 |
| 3-Person Families | 255 (15.1%) | $58,980 |
| 4-Person Families | 323 (19.2%) | $74,844 |
| 5-Person Families | 77 (4.6%) | $88,750 |
| 6-Person Families | 26 (1.5%) | $0 |
| 7+ Person Families | 20 (1.2%) | $0 |
| Total | 1,687 (100.0%) | $66,153 |
Family Income by Number of Earners in Russell County
The median family income in Russell County is $66,153, with families comprising 2 earners (789) having the highest median family income of $96,344, while families with no earners (278) have the lowest median family income of $40,833, accounting for 46.8% and 16.5% of families, respectively.
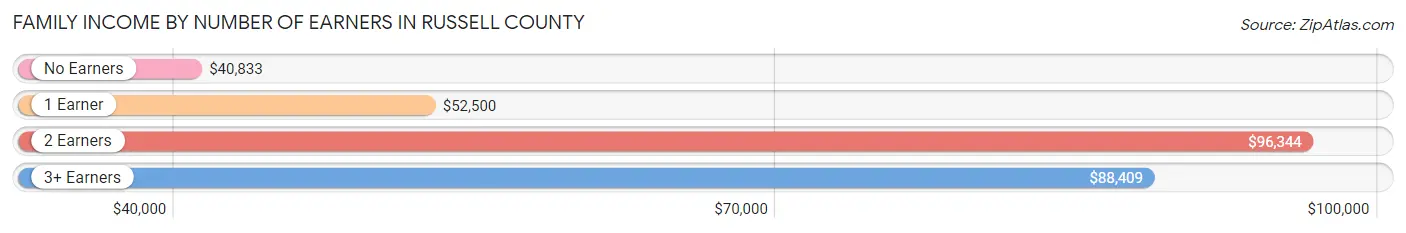
| Number of Earners | # Families | Median Income |
| No Earners | 278 (16.5%) | $40,833 |
| 1 Earner | 486 (28.8%) | $52,500 |
| 2 Earners | 789 (46.8%) | $96,344 |
| 3+ Earners | 134 (7.9%) | $88,409 |
| Total | 1,687 (100.0%) | $66,153 |
Household Income in Russell County
Household Income Brackets in Russell County
With 752 households falling in the category, the $50,000 to $74,999 income range is the most frequent in Russell County, accounting for 25.1% of all households. In contrast, only 39 households (1.3%) fall into the $150,000 to $199,999 income bracket, making it the least populous group.
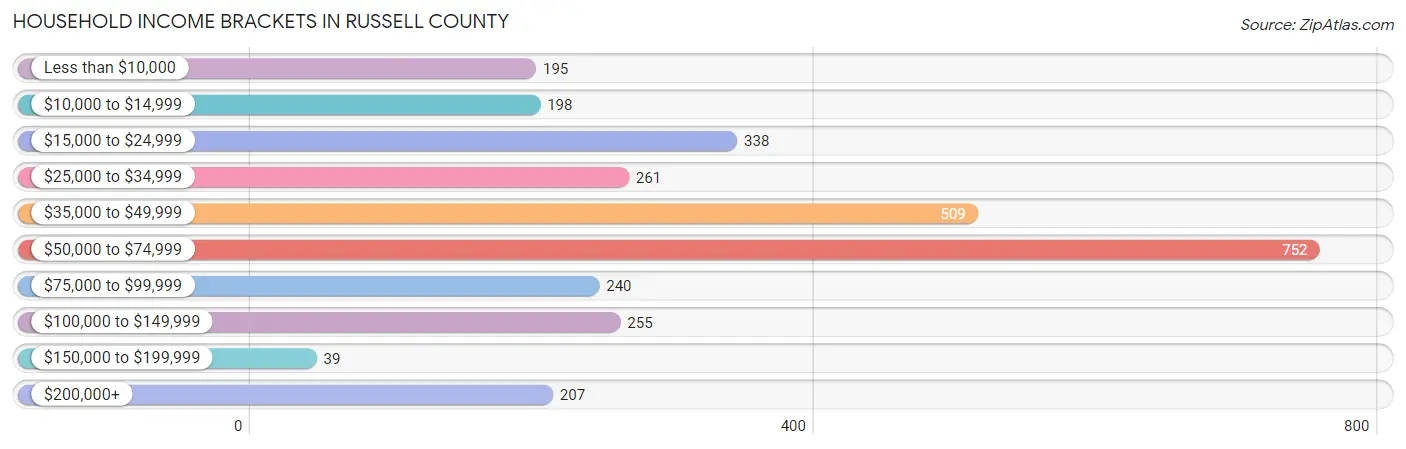
| Income Bracket | # Households | % Households |
| Less than $10,000 | 195 | 6.5% |
| $10,000 to $14,999 | 198 | 6.6% |
| $15,000 to $24,999 | 338 | 11.3% |
| $25,000 to $34,999 | 261 | 8.7% |
| $35,000 to $49,999 | 509 | 17.0% |
| $50,000 to $74,999 | 752 | 25.1% |
| $75,000 to $99,999 | 240 | 8.0% |
| $100,000 to $149,999 | 255 | 8.5% |
| $150,000 to $199,999 | 39 | 1.3% |
| $200,000+ | 207 | 6.9% |
Household Income by Householder Age in Russell County
The median household income in Russell County is $49,929, with the highest median household income of $57,923 found in the 25 to 44 years age bracket for the primary householder. A total of 848 households (28.3%) fall into this category. Meanwhile, the 15 to 24 years age bracket for the primary householder has the lowest median household income of $0, with 93 households (3.1%) in this group.
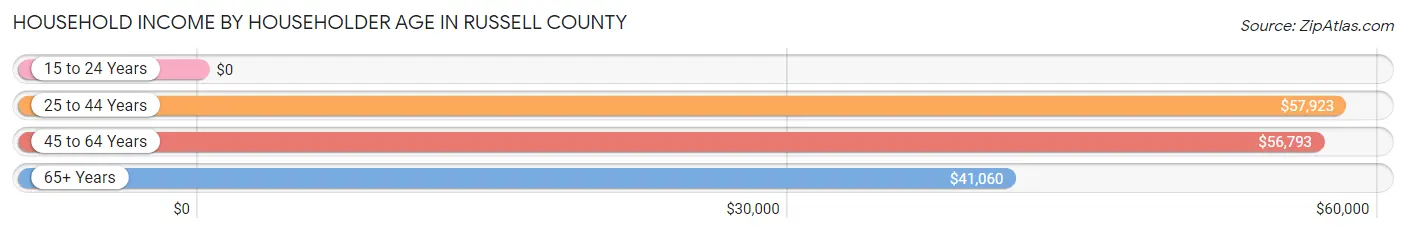
| Income Bracket | # Households | Median Income |
| 15 to 24 Years | 93 (3.1%) | $0 |
| 25 to 44 Years | 848 (28.3%) | $57,923 |
| 45 to 64 Years | 900 (30.0%) | $56,793 |
| 65+ Years | 1,154 (38.5%) | $41,060 |
| Total | 2,995 (100.0%) | $49,929 |
Poverty in Russell County
Income Below Poverty by Sex and Age in Russell County
With 19.6% poverty level for males and 15.5% for females among the residents of Russell County, under 5 year old males and 18 to 24 year old females are the most vulnerable to poverty, with 123 males (68.7%) and 93 females (44.3%) in their respective age groups living below the poverty level.
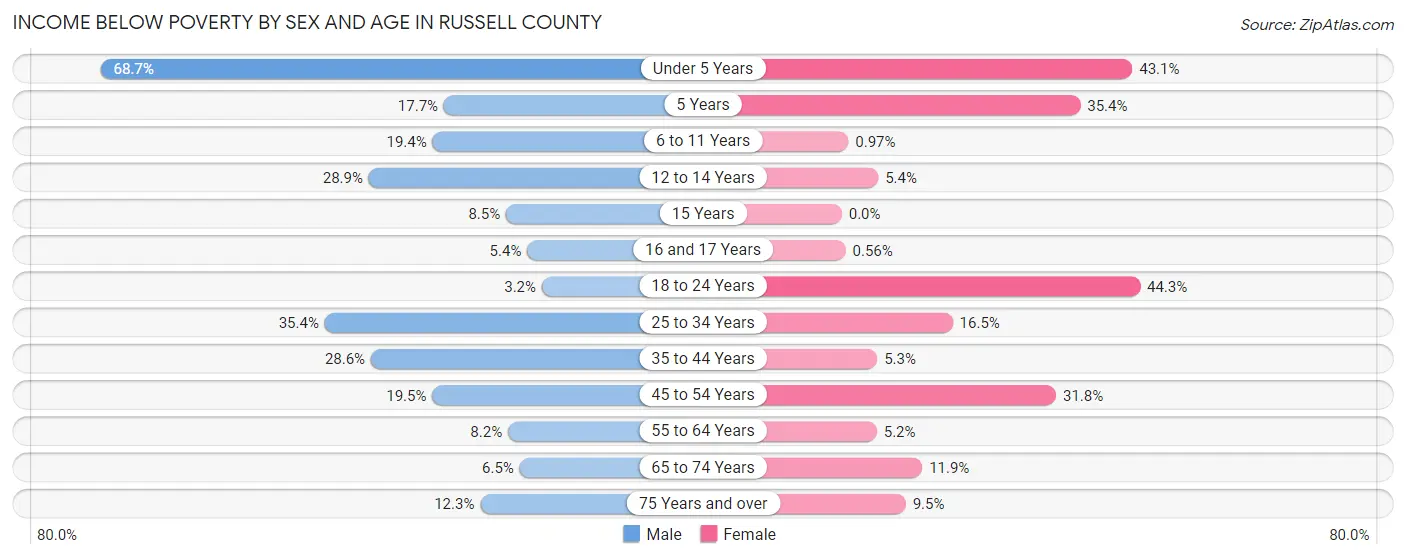
| Age Bracket | Male | Female |
| Under 5 Years | 123 (68.7%) | 88 (43.1%) |
| 5 Years | 11 (17.7%) | 17 (35.4%) |
| 6 to 11 Years | 40 (19.4%) | 2 (1.0%) |
| 12 to 14 Years | 39 (28.9%) | 4 (5.4%) |
| 15 Years | 4 (8.5%) | 0 (0.0%) |
| 16 and 17 Years | 3 (5.4%) | 1 (0.6%) |
| 18 to 24 Years | 8 (3.2%) | 93 (44.3%) |
| 25 to 34 Years | 107 (35.4%) | 52 (16.5%) |
| 35 to 44 Years | 124 (28.6%) | 18 (5.3%) |
| 45 to 54 Years | 65 (19.5%) | 118 (31.8%) |
| 55 to 64 Years | 41 (8.2%) | 25 (5.2%) |
| 65 to 74 Years | 26 (6.5%) | 59 (11.9%) |
| 75 Years and over | 38 (12.3%) | 37 (9.5%) |
| Total | 629 (19.6%) | 514 (15.5%) |
Income Above Poverty by Sex and Age in Russell County
According to the poverty statistics in Russell County, males aged 18 to 24 years and females aged 15 years are the age groups that are most secure financially, with 96.8% of males and 100.0% of females in these age groups living above the poverty line.
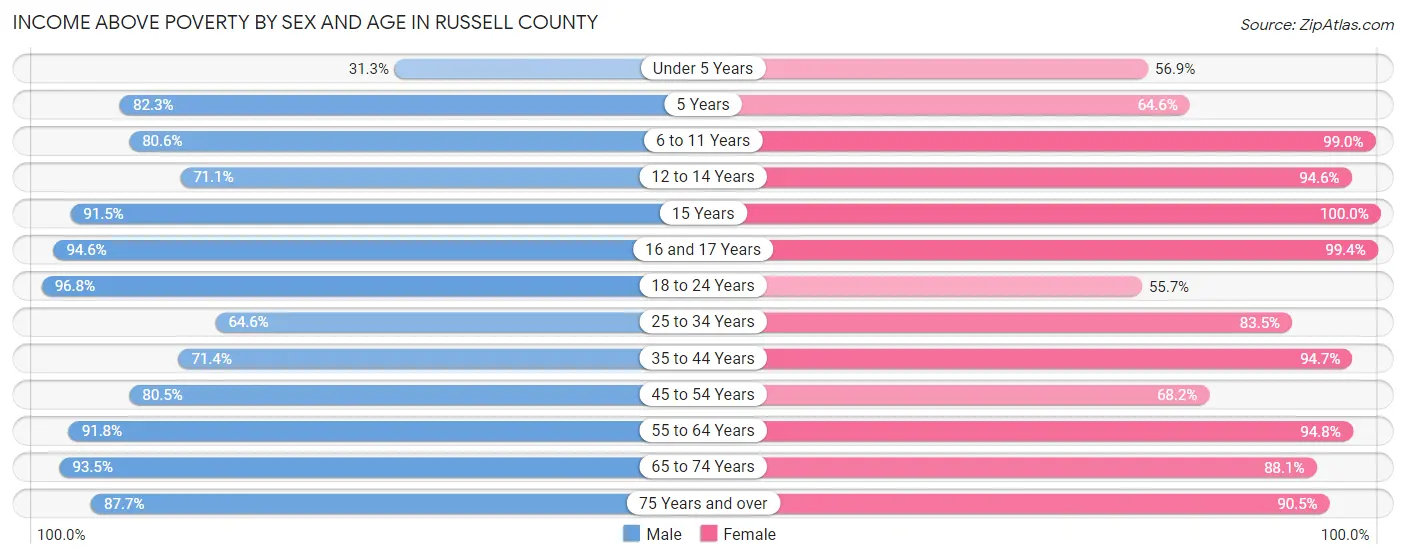
| Age Bracket | Male | Female |
| Under 5 Years | 56 (31.3%) | 116 (56.9%) |
| 5 Years | 51 (82.3%) | 31 (64.6%) |
| 6 to 11 Years | 166 (80.6%) | 205 (99.0%) |
| 12 to 14 Years | 96 (71.1%) | 70 (94.6%) |
| 15 Years | 43 (91.5%) | 4 (100.0%) |
| 16 and 17 Years | 53 (94.6%) | 176 (99.4%) |
| 18 to 24 Years | 243 (96.8%) | 117 (55.7%) |
| 25 to 34 Years | 195 (64.6%) | 264 (83.5%) |
| 35 to 44 Years | 310 (71.4%) | 324 (94.7%) |
| 45 to 54 Years | 269 (80.5%) | 253 (68.2%) |
| 55 to 64 Years | 458 (91.8%) | 456 (94.8%) |
| 65 to 74 Years | 375 (93.5%) | 435 (88.1%) |
| 75 Years and over | 270 (87.7%) | 353 (90.5%) |
| Total | 2,585 (80.4%) | 2,804 (84.5%) |
Income Below Poverty Among Married-Couple Families in Russell County
The poverty statistics for married-couple families in Russell County show that 4.5% or 60 of the total 1,320 families live below the poverty line. Families with 5 or more children have the highest poverty rate of 40.0%, comprising of 8 families. On the other hand, families with no children have the lowest poverty rate of 2.6%, which includes 24 families.
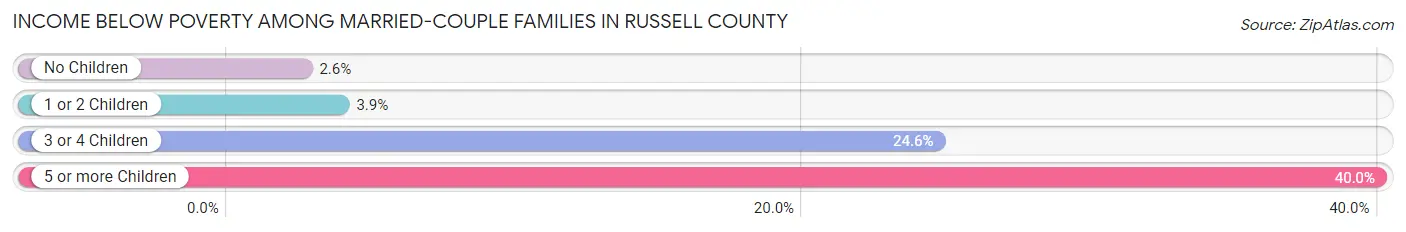
| Children | Above Poverty | Below Poverty |
| No Children | 902 (97.4%) | 24 (2.6%) |
| 1 or 2 Children | 297 (96.1%) | 12 (3.9%) |
| 3 or 4 Children | 49 (75.4%) | 16 (24.6%) |
| 5 or more Children | 12 (60.0%) | 8 (40.0%) |
| Total | 1,260 (95.5%) | 60 (4.5%) |
Income Below Poverty Among Single-Parent Households in Russell County
According to the poverty data in Russell County, 51.3% or 77 single-father households and 18.4% or 40 single-mother households are living below the poverty line. Among single-father households, those with 1 or 2 children have the highest poverty rate, with 74 households (71.2%) experiencing poverty. Likewise, among single-mother households, those with no children have the highest poverty rate, with 27 households (38.6%) falling below the poverty line.
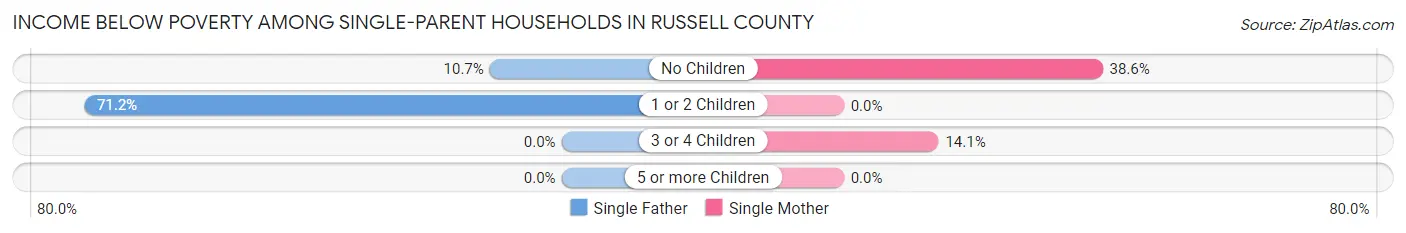
| Children | Single Father | Single Mother |
| No Children | 3 (10.7%) | 27 (38.6%) |
| 1 or 2 Children | 74 (71.2%) | 0 (0.0%) |
| 3 or 4 Children | 0 (0.0%) | 13 (14.1%) |
| 5 or more Children | 0 (0.0%) | 0 (0.0%) |
| Total | 77 (51.3%) | 40 (18.4%) |
Income Below Poverty Among Married-Couple vs Single-Parent Households in Russell County
The poverty data for Russell County shows that 60 of the married-couple family households (4.5%) and 117 of the single-parent households (31.9%) are living below the poverty level. Within the married-couple family households, those with 5 or more children have the highest poverty rate, with 8 households (40.0%) falling below the poverty line. Among the single-parent households, those with 1 or 2 children have the highest poverty rate, with 74 household (46.5%) living below poverty.
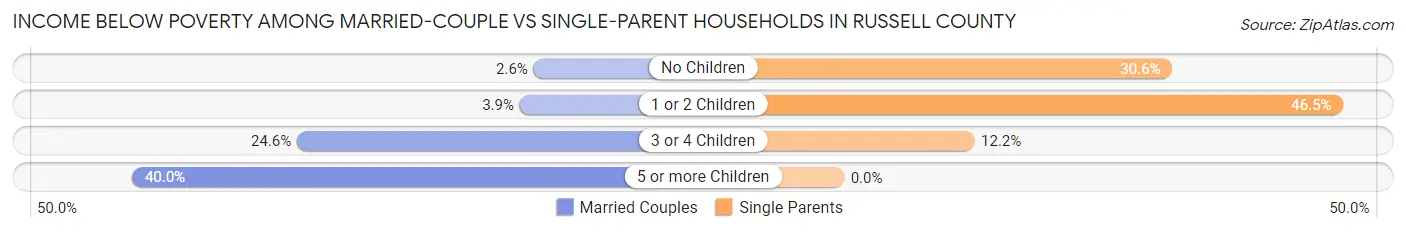
| Children | Married-Couple Families | Single-Parent Households |
| No Children | 24 (2.6%) | 30 (30.6%) |
| 1 or 2 Children | 12 (3.9%) | 74 (46.5%) |
| 3 or 4 Children | 16 (24.6%) | 13 (12.1%) |
| 5 or more Children | 8 (40.0%) | 0 (0.0%) |
| Total | 60 (4.5%) | 117 (31.9%) |
Race in Russell County
The most populous races in Russell County are White / Caucasian (6,061 | 90.4%), Two or more Races (402 | 6.0%), and Hispanic or Latino (294 | 4.4%).
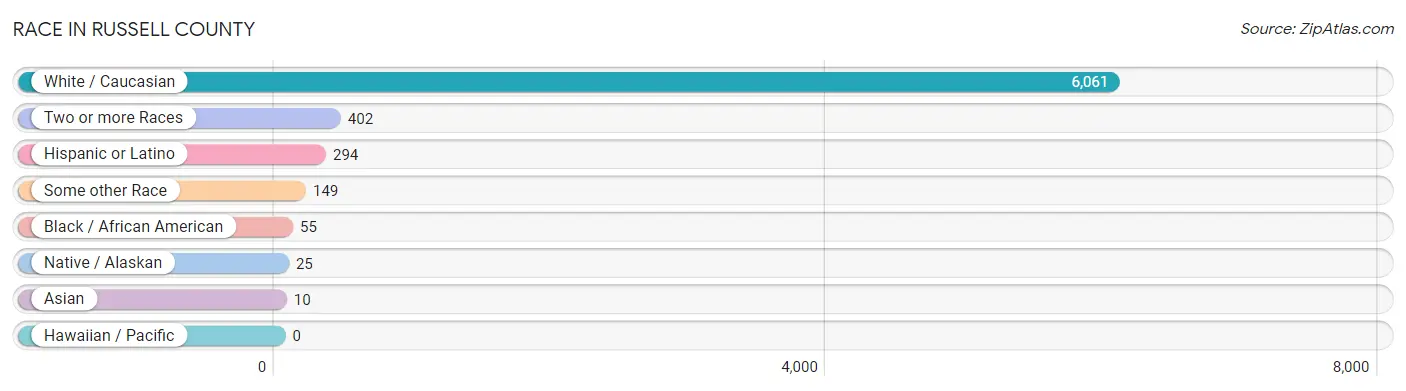
| Race | # Population | % Population |
| Asian | 10 | 0.2% |
| Black / African American | 55 | 0.8% |
| Hawaiian / Pacific | 0 | 0.0% |
| Hispanic or Latino | 294 | 4.4% |
| Native / Alaskan | 25 | 0.4% |
| White / Caucasian | 6,061 | 90.4% |
| Two or more Races | 402 | 6.0% |
| Some other Race | 149 | 2.2% |
| Total | 6,702 | 100.0% |
Ancestry in Russell County
The most populous ancestries reported in Russell County are German (2,637 | 39.4%), English (702 | 10.5%), Irish (474 | 7.1%), American (324 | 4.8%), and French (281 | 4.2%), together accounting for 65.9% of all Russell County residents.
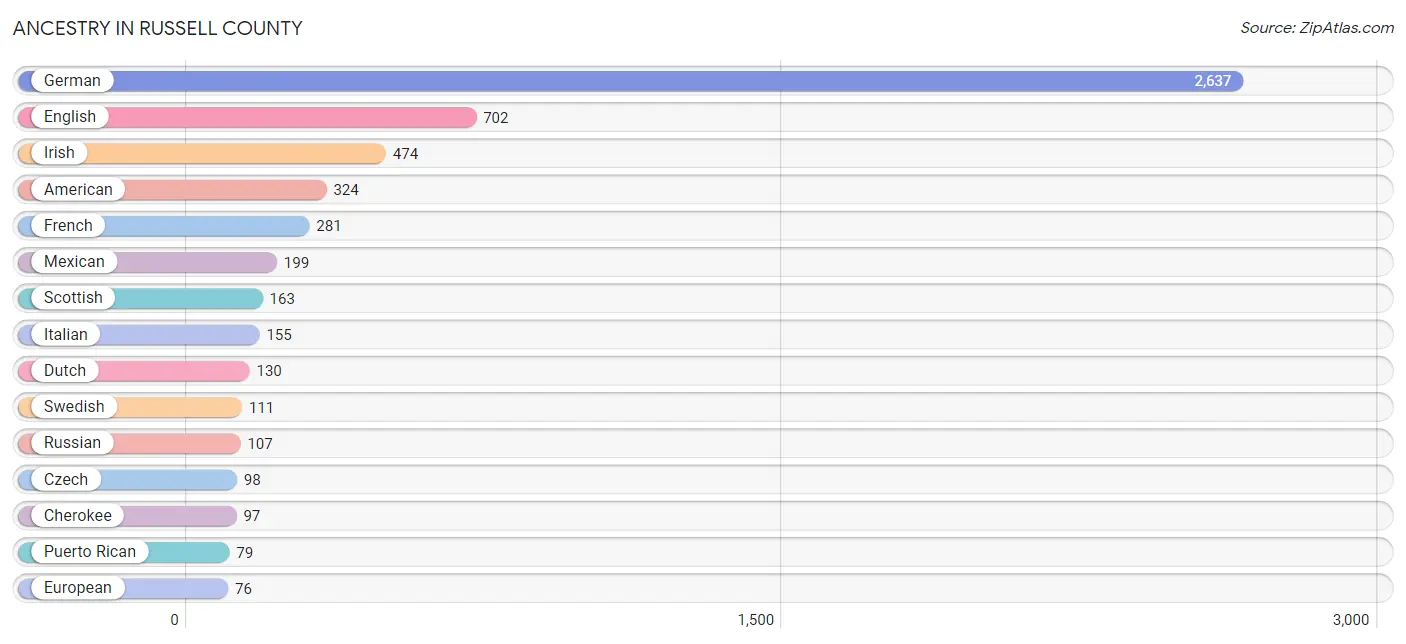
| Ancestry | # Population | % Population |
| American | 324 | 4.8% |
| Austrian | 6 | 0.1% |
| Belgian | 2 | 0.0% |
| Bhutanese | 10 | 0.2% |
| Blackfeet | 2 | 0.0% |
| Brazilian | 4 | 0.1% |
| British | 2 | 0.0% |
| Central American | 3 | 0.0% |
| Cherokee | 97 | 1.5% |
| Comanche | 59 | 0.9% |
| Czech | 98 | 1.5% |
| Czechoslovakian | 21 | 0.3% |
| Danish | 7 | 0.1% |
| Dutch | 130 | 1.9% |
| English | 702 | 10.5% |
| European | 76 | 1.1% |
| French | 281 | 4.2% |
| French Canadian | 1 | 0.0% |
| German | 2,637 | 39.4% |
| German Russian | 3 | 0.0% |
| Guamanian / Chamorro | 16 | 0.2% |
| Honduran | 3 | 0.0% |
| Indian (Asian) | 15 | 0.2% |
| Irish | 474 | 7.1% |
| Iroquois | 4 | 0.1% |
| Italian | 155 | 2.3% |
| Mexican | 199 | 3.0% |
| Native Hawaiian | 15 | 0.2% |
| Northern European | 1 | 0.0% |
| Norwegian | 4 | 0.1% |
| Polish | 23 | 0.3% |
| Potawatomi | 1 | 0.0% |
| Puerto Rican | 79 | 1.2% |
| Russian | 107 | 1.6% |
| Scandinavian | 4 | 0.1% |
| Scotch-Irish | 13 | 0.2% |
| Scottish | 163 | 2.4% |
| Spanish | 10 | 0.2% |
| Swedish | 111 | 1.7% |
| Swiss | 28 | 0.4% |
| Thai | 8 | 0.1% |
| Welsh | 45 | 0.7% | View All 42 Rows |
Immigrants in Russell County
The most numerous immigrant groups reported in Russell County came from Europe (70 | 1.0%), Germany (37 | 0.5%), Western Europe (37 | 0.5%), England (26 | 0.4%), and Northern Europe (26 | 0.4%), together accounting for 2.9% of all Russell County residents.
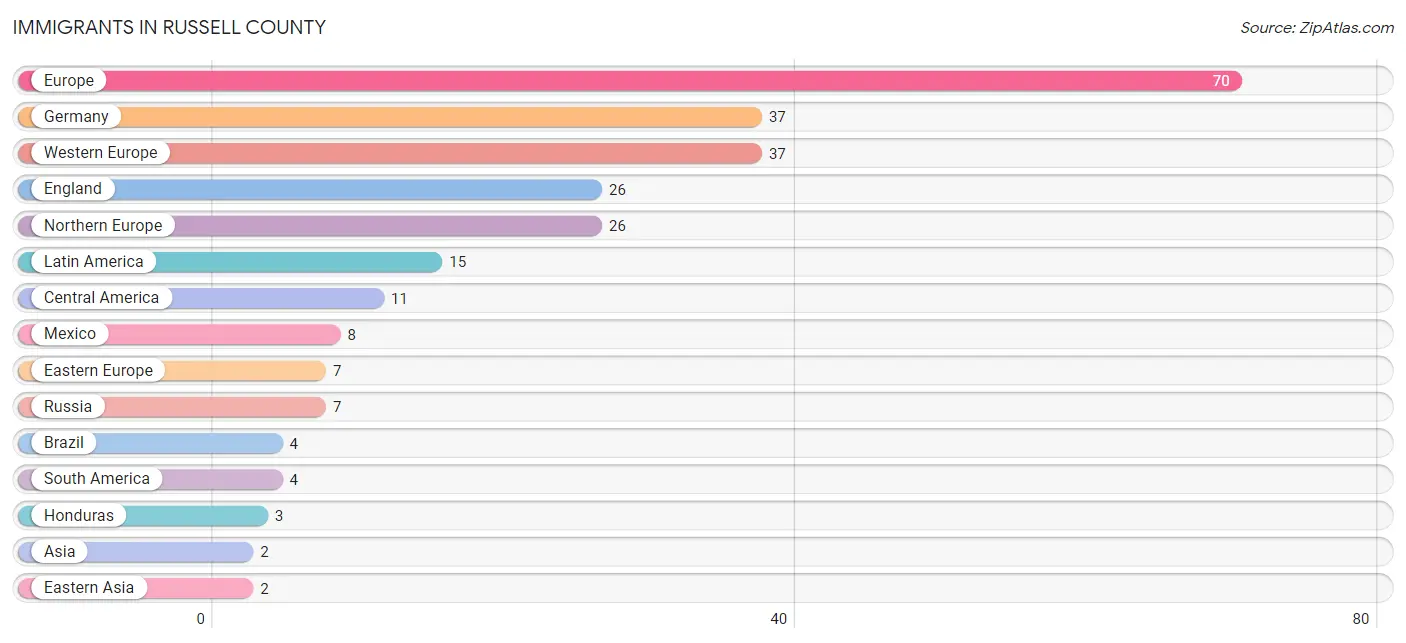
| Immigration Origin | # Population | % Population |
| Asia | 2 | 0.0% |
| Brazil | 4 | 0.1% |
| Central America | 11 | 0.2% |
| Eastern Asia | 2 | 0.0% |
| Eastern Europe | 7 | 0.1% |
| England | 26 | 0.4% |
| Europe | 70 | 1.0% |
| Germany | 37 | 0.5% |
| Honduras | 3 | 0.0% |
| Japan | 2 | 0.0% |
| Latin America | 15 | 0.2% |
| Mexico | 8 | 0.1% |
| Northern Europe | 26 | 0.4% |
| Russia | 7 | 0.1% |
| South America | 4 | 0.1% |
| Western Europe | 37 | 0.5% | View All 16 Rows |
Sex and Age in Russell County
Sex and Age in Russell County
The most populous age groups in Russell County are 55 to 59 Years (280 | 8.5%) for men and 65 to 69 Years (299 | 8.8%) for women.
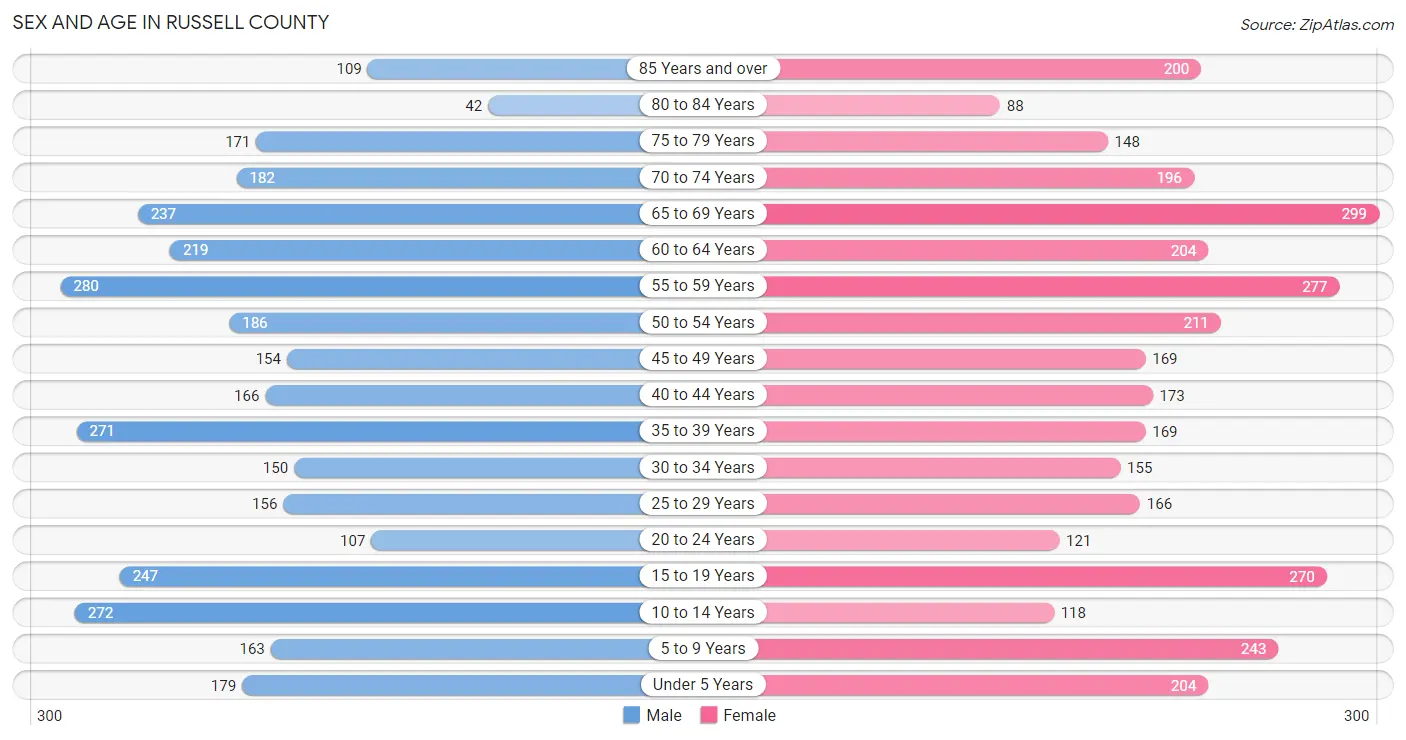
| Age Bracket | Male | Female |
| Under 5 Years | 179 (5.4%) | 204 (6.0%) |
| 5 to 9 Years | 163 (5.0%) | 243 (7.1%) |
| 10 to 14 Years | 272 (8.3%) | 118 (3.5%) |
| 15 to 19 Years | 247 (7.5%) | 270 (7.9%) |
| 20 to 24 Years | 107 (3.3%) | 121 (3.5%) |
| 25 to 29 Years | 156 (4.7%) | 166 (4.9%) |
| 30 to 34 Years | 150 (4.6%) | 155 (4.5%) |
| 35 to 39 Years | 271 (8.2%) | 169 (5.0%) |
| 40 to 44 Years | 166 (5.0%) | 173 (5.1%) |
| 45 to 49 Years | 154 (4.7%) | 169 (5.0%) |
| 50 to 54 Years | 186 (5.7%) | 211 (6.2%) |
| 55 to 59 Years | 280 (8.5%) | 277 (8.1%) |
| 60 to 64 Years | 219 (6.7%) | 204 (6.0%) |
| 65 to 69 Years | 237 (7.2%) | 299 (8.8%) |
| 70 to 74 Years | 182 (5.5%) | 196 (5.8%) |
| 75 to 79 Years | 171 (5.2%) | 148 (4.3%) |
| 80 to 84 Years | 42 (1.3%) | 88 (2.6%) |
| 85 Years and over | 109 (3.3%) | 200 (5.9%) |
| Total | 3,291 (100.0%) | 3,411 (100.0%) |
Families and Households in Russell County
Median Family Size in Russell County
The median family size in Russell County is 2.86 persons per family, with single female/mother families (217 | 12.9%) accounting for the largest median family size of 3.18 persons per family. On the other hand, single male/father families (150 | 8.9%) represent the smallest median family size with 2.77 persons per family.
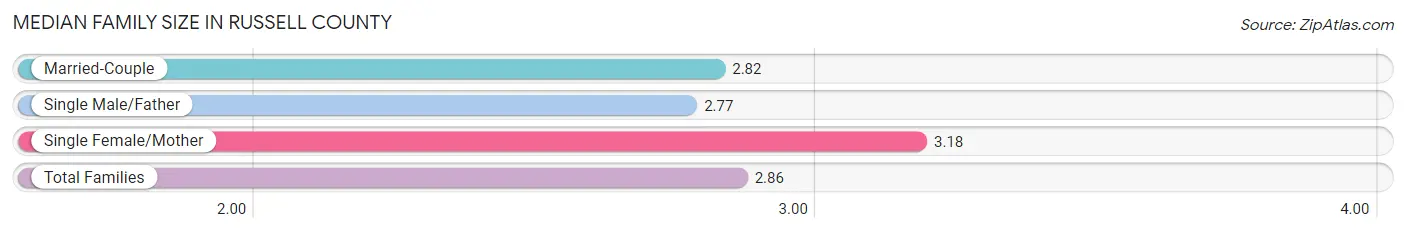
| Family Type | # Families | Family Size |
| Married-Couple | 1,320 (78.2%) | 2.82 |
| Single Male/Father | 150 (8.9%) | 2.77 |
| Single Female/Mother | 217 (12.9%) | 3.18 |
| Total Families | 1,687 (100.0%) | 2.86 |
Median Household Size in Russell County
The median household size in Russell County is 2.20 persons per household, with single female/mother households (217 | 7.2%) accounting for the largest median household size of 3.47 persons per household. non-family households (1,308 | 43.7%) represent the smallest median household size with 1.22 persons per household.
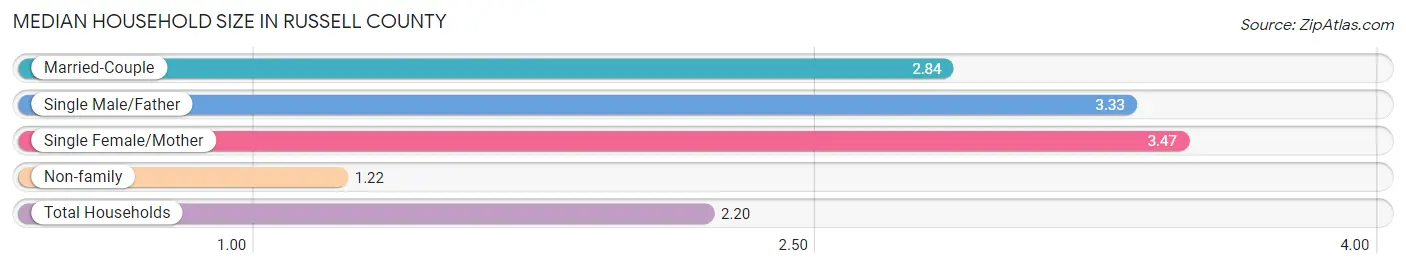
| Household Type | # Households | Household Size |
| Married-Couple | 1,320 (44.1%) | 2.84 |
| Single Male/Father | 150 (5.0%) | 3.33 |
| Single Female/Mother | 217 (7.2%) | 3.47 |
| Non-family | 1,308 (43.7%) | 1.22 |
| Total Households | 2,995 (100.0%) | 2.20 |
Household Size by Marriage Status in Russell County
Out of a total of 2,995 households in Russell County, 1,687 (56.3%) are family households, while 1,308 (43.7%) are nonfamily households. The most numerous type of family households are 2-person households, comprising 937, and the most common type of nonfamily households are 1-person households, comprising 1,167.
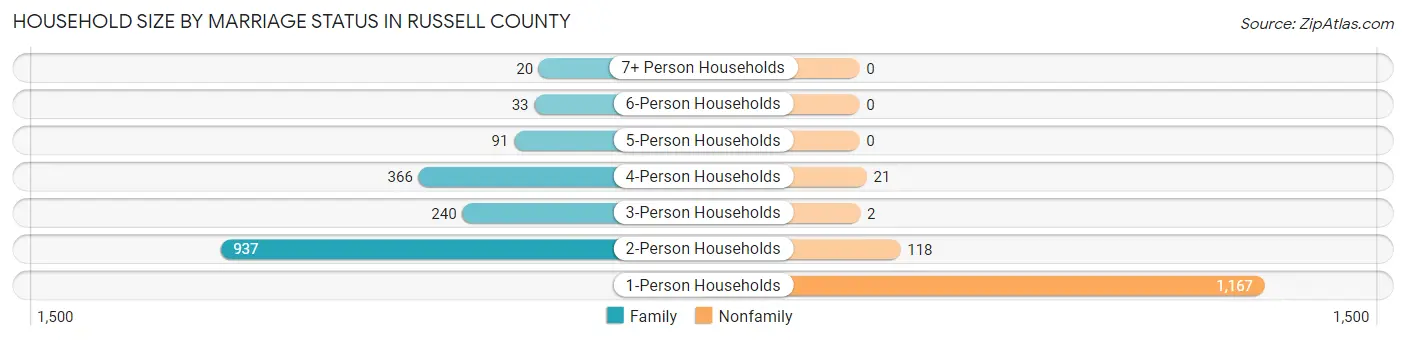
| Household Size | Family Households | Nonfamily Households |
| 1-Person Households | - | 1,167 (39.0%) |
| 2-Person Households | 937 (31.3%) | 118 (3.9%) |
| 3-Person Households | 240 (8.0%) | 2 (0.1%) |
| 4-Person Households | 366 (12.2%) | 21 (0.7%) |
| 5-Person Households | 91 (3.0%) | 0 (0.0%) |
| 6-Person Households | 33 (1.1%) | 0 (0.0%) |
| 7+ Person Households | 20 (0.7%) | 0 (0.0%) |
| Total | 1,687 (56.3%) | 1,308 (43.7%) |
Female Fertility in Russell County
Fertility by Age in Russell County
Average fertility rate in Russell County is 32.0 births per 1,000 women. Women in the age bracket of 20 to 34 years have the highest fertility rate with 88.0 births per 1,000 women. Women in the age bracket of 20 to 34 years acount for 97.5% of all women with births.
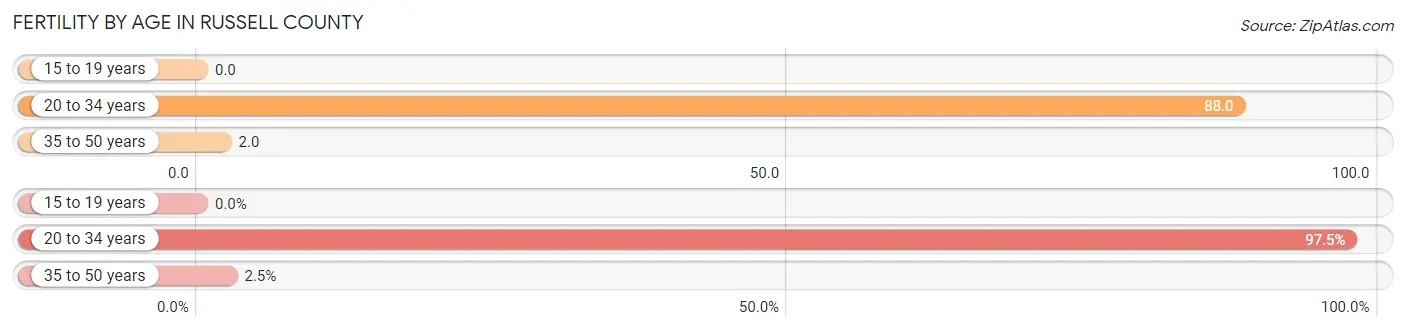
| Age Bracket | Women with Births | Births / 1,000 Women |
| 15 to 19 years | 0 (0.0%) | 0.0 |
| 20 to 34 years | 39 (97.5%) | 88.0 |
| 35 to 50 years | 1 (2.5%) | 2.0 |
| Total | 40 (100.0%) | 32.0 |
Fertility by Age by Marriage Status in Russell County
65.0% of women with births (40) in Russell County are married. The highest percentage of unmarried women with births falls into 20 to 34 years age bracket with 35.9% of them unmarried at the time of birth, while the lowest percentage of unmarried women with births belong to 35 to 50 years age bracket with 0.0% of them unmarried.
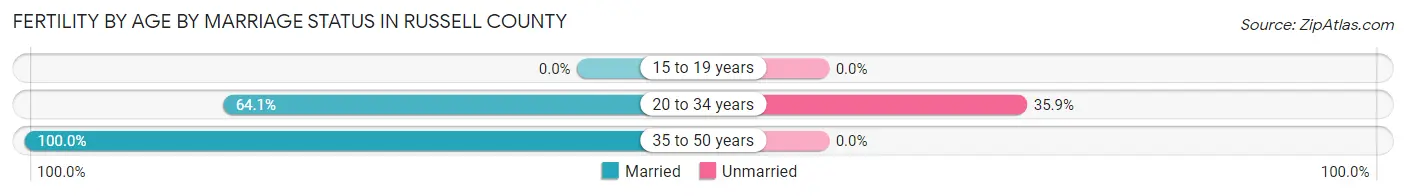
| Age Bracket | Married | Unmarried |
| 15 to 19 years | 0 (0.0%) | 0 (0.0%) |
| 20 to 34 years | 25 (64.1%) | 14 (35.9%) |
| 35 to 50 years | 1 (100.0%) | 0 (0.0%) |
| Total | 26 (65.0%) | 14 (35.0%) |
Fertility by Education in Russell County
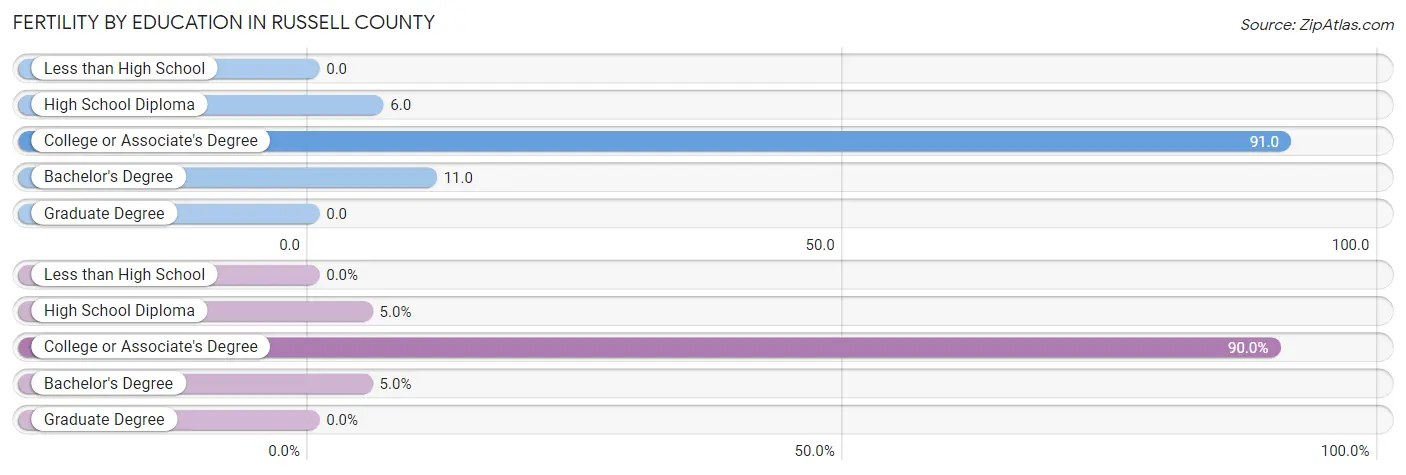
| Educational Attainment | Women with Births | Births / 1,000 Women |
| Less than High School | 0 (0.0%) | 0.0 |
| High School Diploma | 2 (5.0%) | 6.0 |
| College or Associate's Degree | 36 (90.0%) | 91.0 |
| Bachelor's Degree | 2 (5.0%) | 11.0 |
| Graduate Degree | 0 (0.0%) | 0.0 |
| Total | 40 (100.0%) | 32.0 |
Fertility by Education by Marriage Status in Russell County
35.0% of women with births in Russell County are unmarried. Women with the educational attainment of high school diploma are most likely to be married with 100.0% of them married at childbirth, while women with the educational attainment of college or associate's degree are least likely to be married with 38.9% of them unmarried at childbirth.
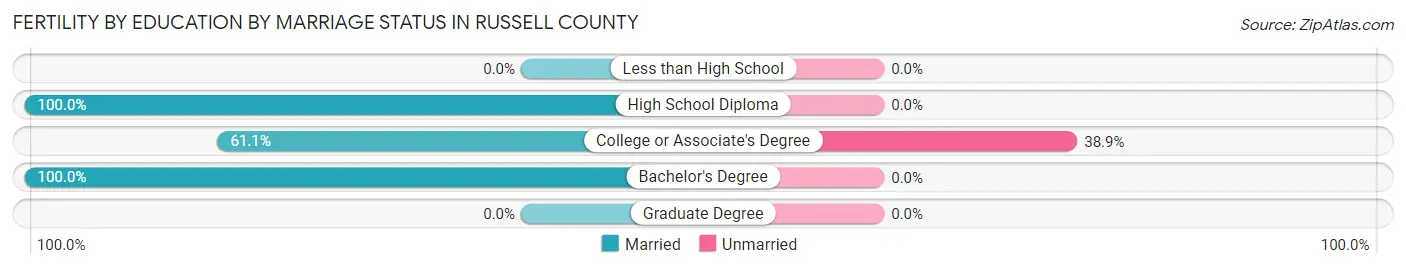
| Educational Attainment | Married | Unmarried |
| Less than High School | 0 (0.0%) | 0 (0.0%) |
| High School Diploma | 2 (100.0%) | 0 (0.0%) |
| College or Associate's Degree | 22 (61.1%) | 14 (38.9%) |
| Bachelor's Degree | 2 (100.0%) | 0 (0.0%) |
| Graduate Degree | 0 (0.0%) | 0 (0.0%) |
| Total | 26 (65.0%) | 14 (35.0%) |
Employment Characteristics in Russell County
Employment by Class of Employer in Russell County
Among the 3,123 employed individuals in Russell County, private company employees (2,083 | 66.7%), self-employed (not incorporated) (328 | 10.5%), and local government employees (287 | 9.2%) make up the most common classes of employment.
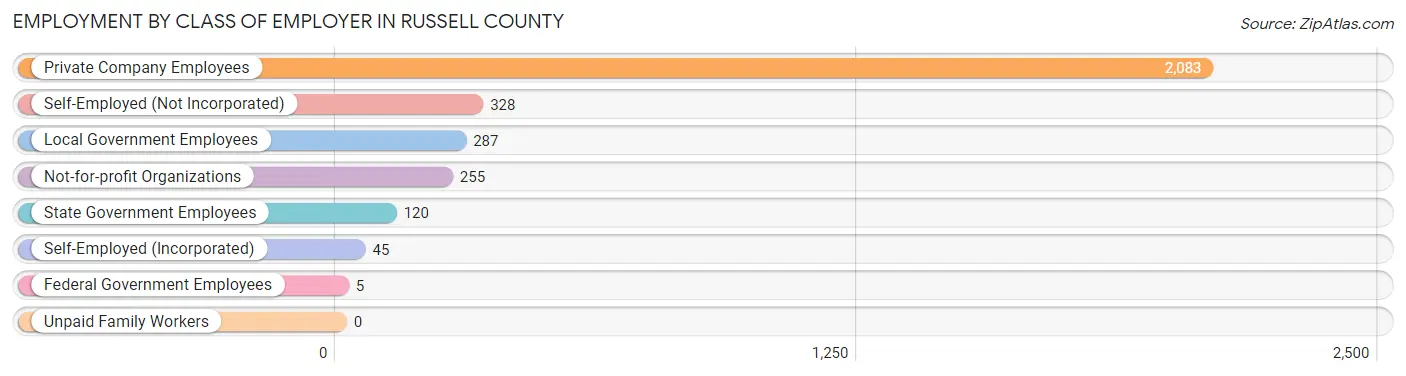
| Employer Class | # Employees | % Employees |
| Private Company Employees | 2,083 | 66.7% |
| Self-Employed (Incorporated) | 45 | 1.4% |
| Self-Employed (Not Incorporated) | 328 | 10.5% |
| Not-for-profit Organizations | 255 | 8.2% |
| Local Government Employees | 287 | 9.2% |
| State Government Employees | 120 | 3.8% |
| Federal Government Employees | 5 | 0.2% |
| Unpaid Family Workers | 0 | 0.0% |
| Total | 3,123 | 100.0% |
Employment Status by Age in Russell County
According to the labor force statistics for Russell County, out of the total population over 16 years of age (5,472), 61.1% or 3,343 individuals are in the labor force, with 3.9% or 130 of them unemployed. The age group with the highest labor force participation rate is 25 to 29 years, with 98.8% or 318 individuals in the labor force. Within the labor force, the 20 to 24 years age range has the highest percentage of unemployed individuals, with 15.3% or 29 of them being unemployed.
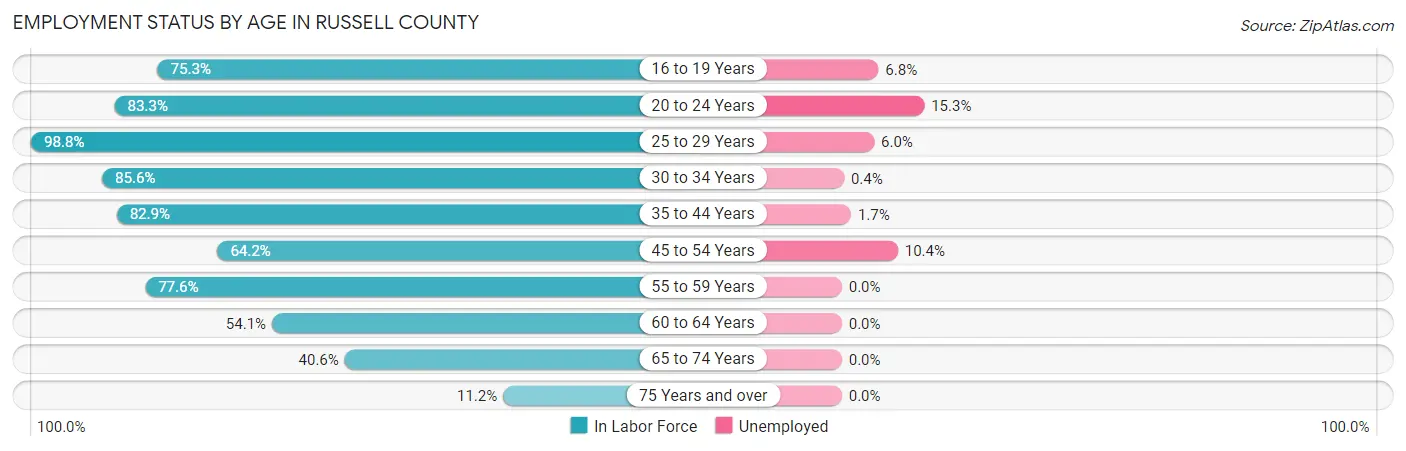
| Age Bracket | In Labor Force | Unemployed |
| 16 to 19 Years | 351 (75.3%) | 24 (6.8%) |
| 20 to 24 Years | 190 (83.3%) | 29 (15.3%) |
| 25 to 29 Years | 318 (98.8%) | 19 (6.0%) |
| 30 to 34 Years | 261 (85.6%) | 1 (0.4%) |
| 35 to 44 Years | 646 (82.9%) | 11 (1.7%) |
| 45 to 54 Years | 462 (64.2%) | 48 (10.4%) |
| 55 to 59 Years | 432 (77.6%) | 0 (0.0%) |
| 60 to 64 Years | 229 (54.1%) | 0 (0.0%) |
| 65 to 74 Years | 371 (40.6%) | 0 (0.0%) |
| 75 Years and over | 85 (11.2%) | 0 (0.0%) |
| Total | 3,343 (61.1%) | 130 (3.9%) |
Employment Status by Educational Attainment in Russell County
According to labor force statistics for Russell County, 75.6% of individuals (2,348) out of the total population between 25 and 64 years of age (3,106) are in the labor force, with 3.4% or 80 of them being unemployed. The group with the highest labor force participation rate are those with the educational attainment of bachelor's degree or higher, with 85.6% or 584 individuals in the labor force. Within the labor force, individuals with less than high school education have the highest percentage of unemployment, with 32.8% or 19 of them being unemployed.
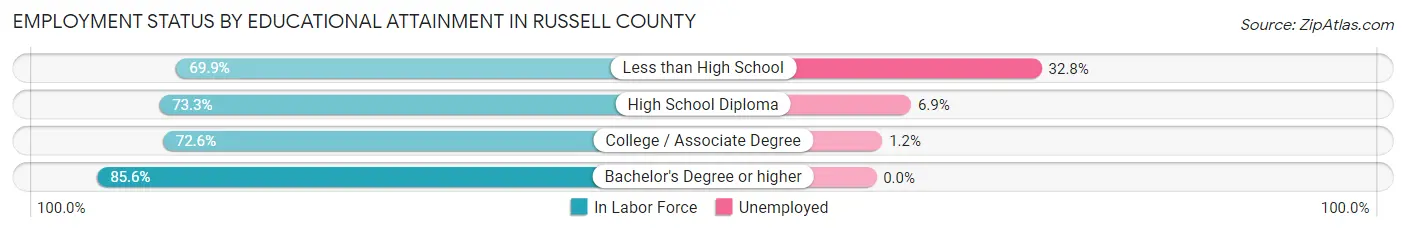
| Educational Attainment | In Labor Force | Unemployed |
| Less than High School | 58 (69.9%) | 27 (32.8%) |
| High School Diploma | 698 (73.3%) | 66 (6.9%) |
| College / Associate Degree | 1,008 (72.6%) | 17 (1.2%) |
| Bachelor's Degree or higher | 584 (85.6%) | 0 (0.0%) |
| Total | 2,348 (75.6%) | 106 (3.4%) |
Employment Occupations by Sex in Russell County
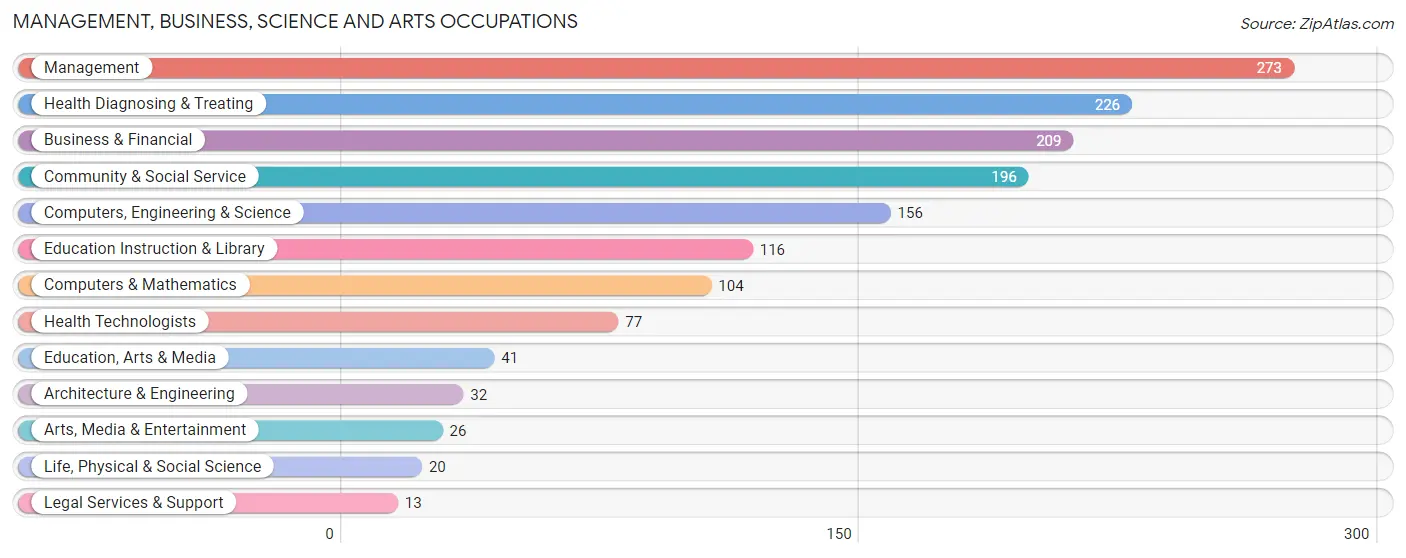
Management, Business, Science and Arts Occupations
The most common Management, Business, Science and Arts occupations in Russell County are Management (273 | 8.5%), Health Diagnosing & Treating (226 | 7.0%), Business & Financial (209 | 6.5%), Community & Social Service (196 | 6.1%), and Computers, Engineering & Science (156 | 4.9%).
Management, Business, Science and Arts Occupations by Sex
Within the Management, Business, Science and Arts occupations in Russell County, the most male-oriented occupations are Architecture & Engineering (100.0%), Legal Services & Support (92.3%), and Life, Physical & Social Science (90.0%), while the most female-oriented occupations are Health Diagnosing & Treating (92.9%), Education Instruction & Library (92.2%), and Health Technologists (79.2%).
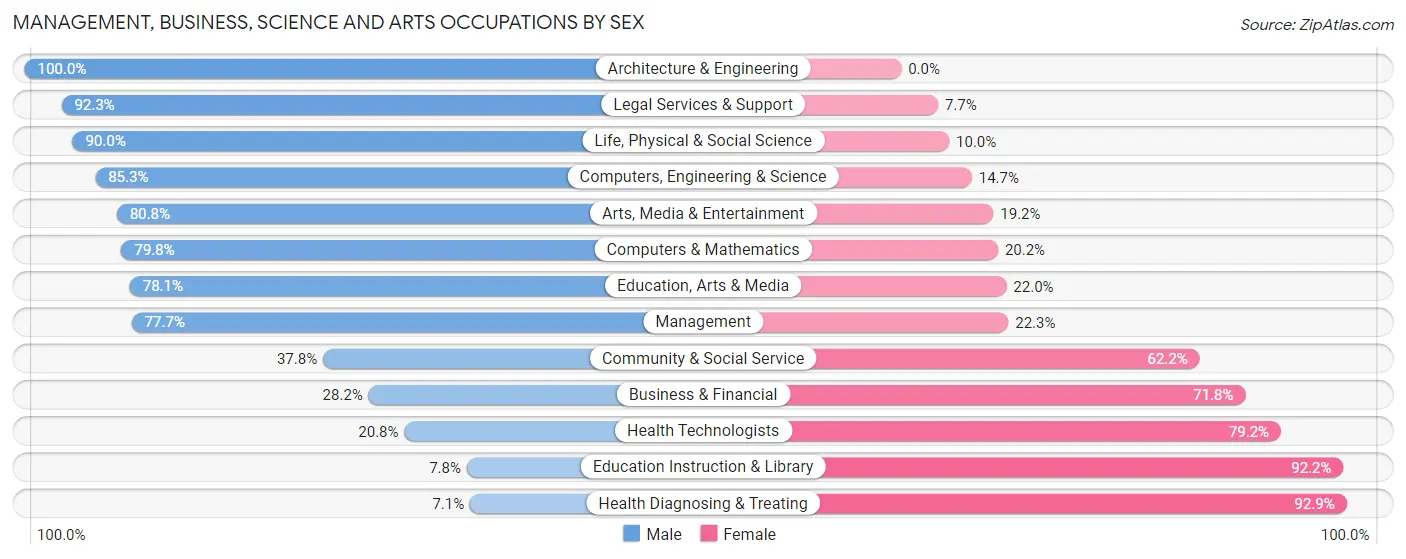
| Occupation | Male | Female |
| Management | 212 (77.7%) | 61 (22.3%) |
| Business & Financial | 59 (28.2%) | 150 (71.8%) |
| Computers, Engineering & Science | 133 (85.3%) | 23 (14.7%) |
| Computers & Mathematics | 83 (79.8%) | 21 (20.2%) |
| Architecture & Engineering | 32 (100.0%) | 0 (0.0%) |
| Life, Physical & Social Science | 18 (90.0%) | 2 (10.0%) |
| Community & Social Service | 74 (37.8%) | 122 (62.2%) |
| Education, Arts & Media | 32 (78.0%) | 9 (22.0%) |
| Legal Services & Support | 12 (92.3%) | 1 (7.7%) |
| Education Instruction & Library | 9 (7.8%) | 107 (92.2%) |
| Arts, Media & Entertainment | 21 (80.8%) | 5 (19.2%) |
| Health Diagnosing & Treating | 16 (7.1%) | 210 (92.9%) |
| Health Technologists | 16 (20.8%) | 61 (79.2%) |
| Total (Category) | 494 (46.6%) | 566 (53.4%) |
| Total (Overall) | 1,663 (51.8%) | 1,550 (48.2%) |
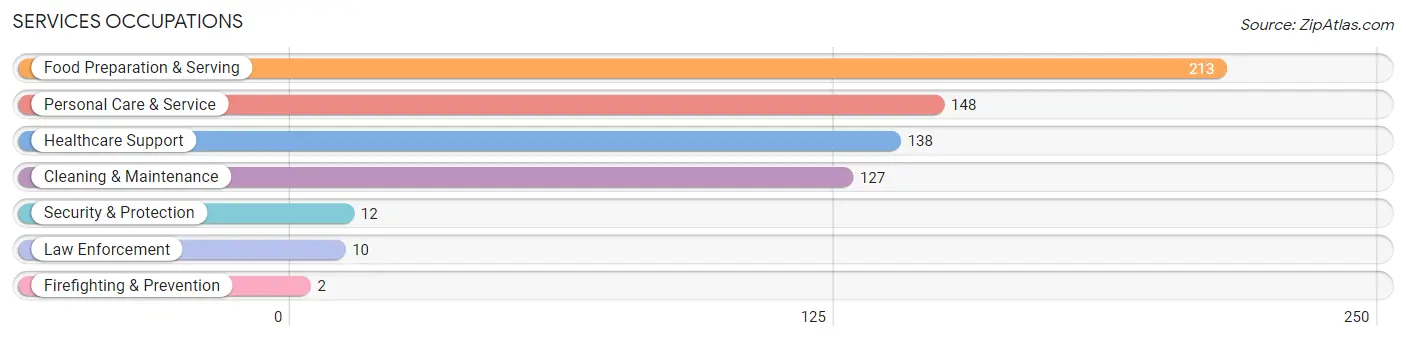
Services Occupations
The most common Services occupations in Russell County are Food Preparation & Serving (213 | 6.6%), Personal Care & Service (148 | 4.6%), Healthcare Support (138 | 4.3%), Cleaning & Maintenance (127 | 4.0%), and Security & Protection (12 | 0.4%).
Services Occupations by Sex
Within the Services occupations in Russell County, the most male-oriented occupations are Security & Protection (100.0%), Firefighting & Prevention (100.0%), and Law Enforcement (100.0%), while the most female-oriented occupations are Personal Care & Service (99.3%), Healthcare Support (94.2%), and Food Preparation & Serving (64.8%).
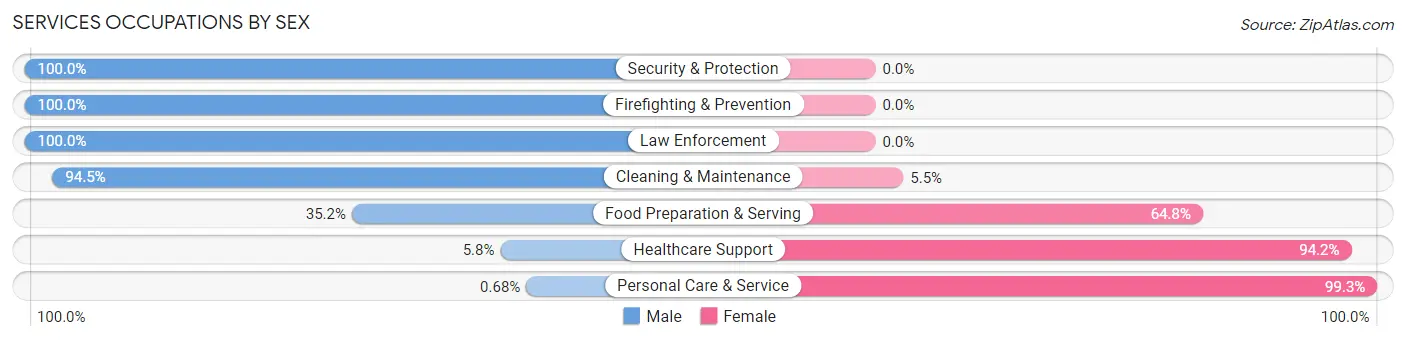
| Occupation | Male | Female |
| Healthcare Support | 8 (5.8%) | 130 (94.2%) |
| Security & Protection | 12 (100.0%) | 0 (0.0%) |
| Firefighting & Prevention | 2 (100.0%) | 0 (0.0%) |
| Law Enforcement | 10 (100.0%) | 0 (0.0%) |
| Food Preparation & Serving | 75 (35.2%) | 138 (64.8%) |
| Cleaning & Maintenance | 120 (94.5%) | 7 (5.5%) |
| Personal Care & Service | 1 (0.7%) | 147 (99.3%) |
| Total (Category) | 216 (33.9%) | 422 (66.1%) |
| Total (Overall) | 1,663 (51.8%) | 1,550 (48.2%) |
Sales and Office Occupations
The most common Sales and Office occupations in Russell County are Sales & Related (383 | 11.9%), and Office & Administration (365 | 11.4%).
Sales and Office Occupations by Sex
| Occupation | Male | Female |
| Sales & Related | 101 (26.4%) | 282 (73.6%) |
| Office & Administration | 90 (24.7%) | 275 (75.3%) |
| Total (Category) | 191 (25.5%) | 557 (74.5%) |
| Total (Overall) | 1,663 (51.8%) | 1,550 (48.2%) |
Natural Resources, Construction and Maintenance Occupations
The most common Natural Resources, Construction and Maintenance occupations in Russell County are Construction & Extraction (116 | 3.6%), Installation, Maintenance & Repair (50 | 1.6%), and Farming, Fishing & Forestry (30 | 0.9%).
Natural Resources, Construction and Maintenance Occupations by Sex
| Occupation | Male | Female |
| Farming, Fishing & Forestry | 30 (100.0%) | 0 (0.0%) |
| Construction & Extraction | 116 (100.0%) | 0 (0.0%) |
| Installation, Maintenance & Repair | 50 (100.0%) | 0 (0.0%) |
| Total (Category) | 196 (100.0%) | 0 (0.0%) |
| Total (Overall) | 1,663 (51.8%) | 1,550 (48.2%) |
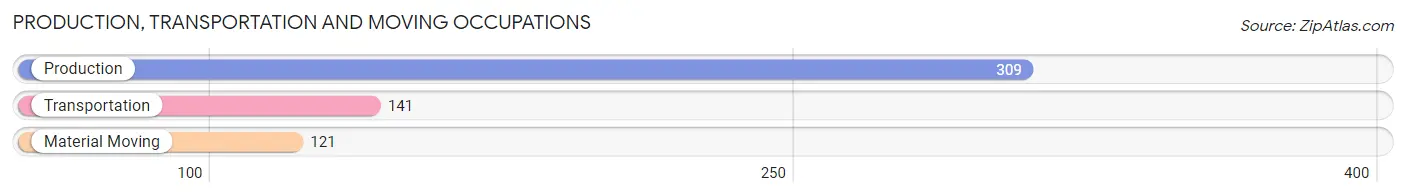
Production, Transportation and Moving Occupations
The most common Production, Transportation and Moving occupations in Russell County are Production (309 | 9.6%), Transportation (141 | 4.4%), and Material Moving (121 | 3.8%).
Production, Transportation and Moving Occupations by Sex
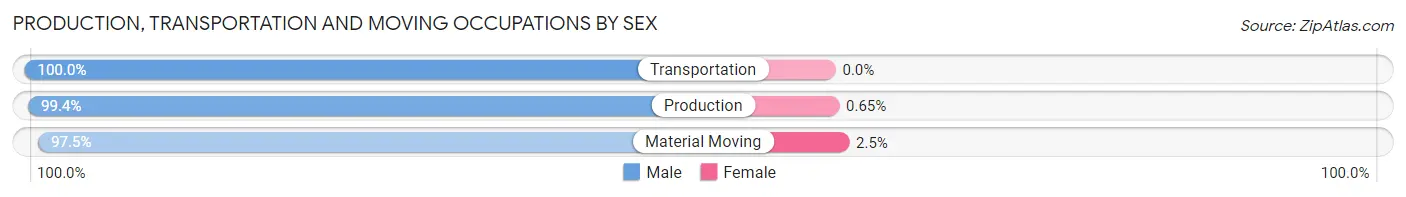
| Occupation | Male | Female |
| Production | 307 (99.4%) | 2 (0.6%) |
| Transportation | 141 (100.0%) | 0 (0.0%) |
| Material Moving | 118 (97.5%) | 3 (2.5%) |
| Total (Category) | 566 (99.1%) | 5 (0.9%) |
| Total (Overall) | 1,663 (51.8%) | 1,550 (48.2%) |
Employment Industries by Sex in Russell County
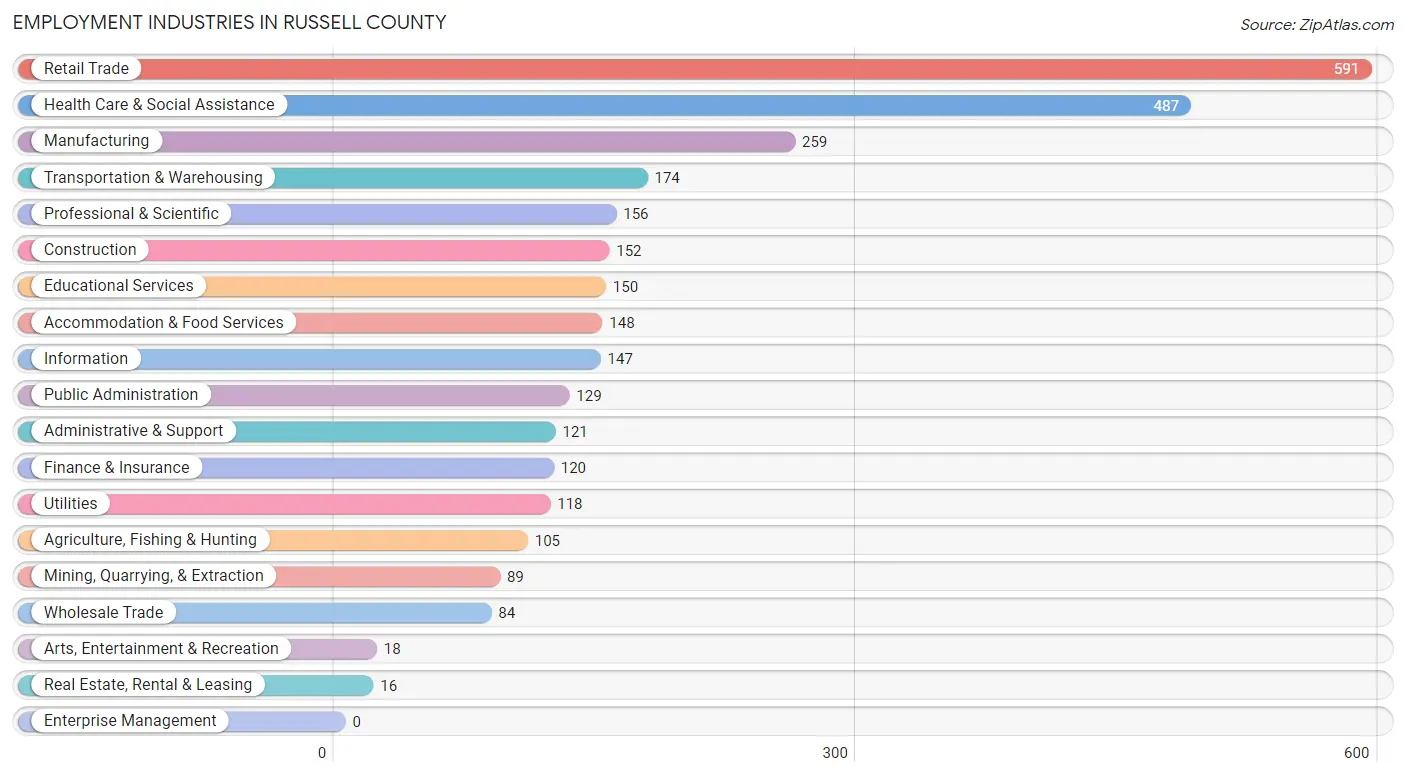
Employment Industries in Russell County
The major employment industries in Russell County include Retail Trade (591 | 18.4%), Health Care & Social Assistance (487 | 15.2%), Manufacturing (259 | 8.1%), Transportation & Warehousing (174 | 5.4%), and Professional & Scientific (156 | 4.9%).
Employment Industries by Sex in Russell County
The Russell County industries that see more men than women are Construction (100.0%), Utilities (99.2%), and Transportation & Warehousing (98.9%), whereas the industries that tend to have a higher number of women are Real Estate, Rental & Leasing (100.0%), Health Care & Social Assistance (91.4%), and Educational Services (76.0%).
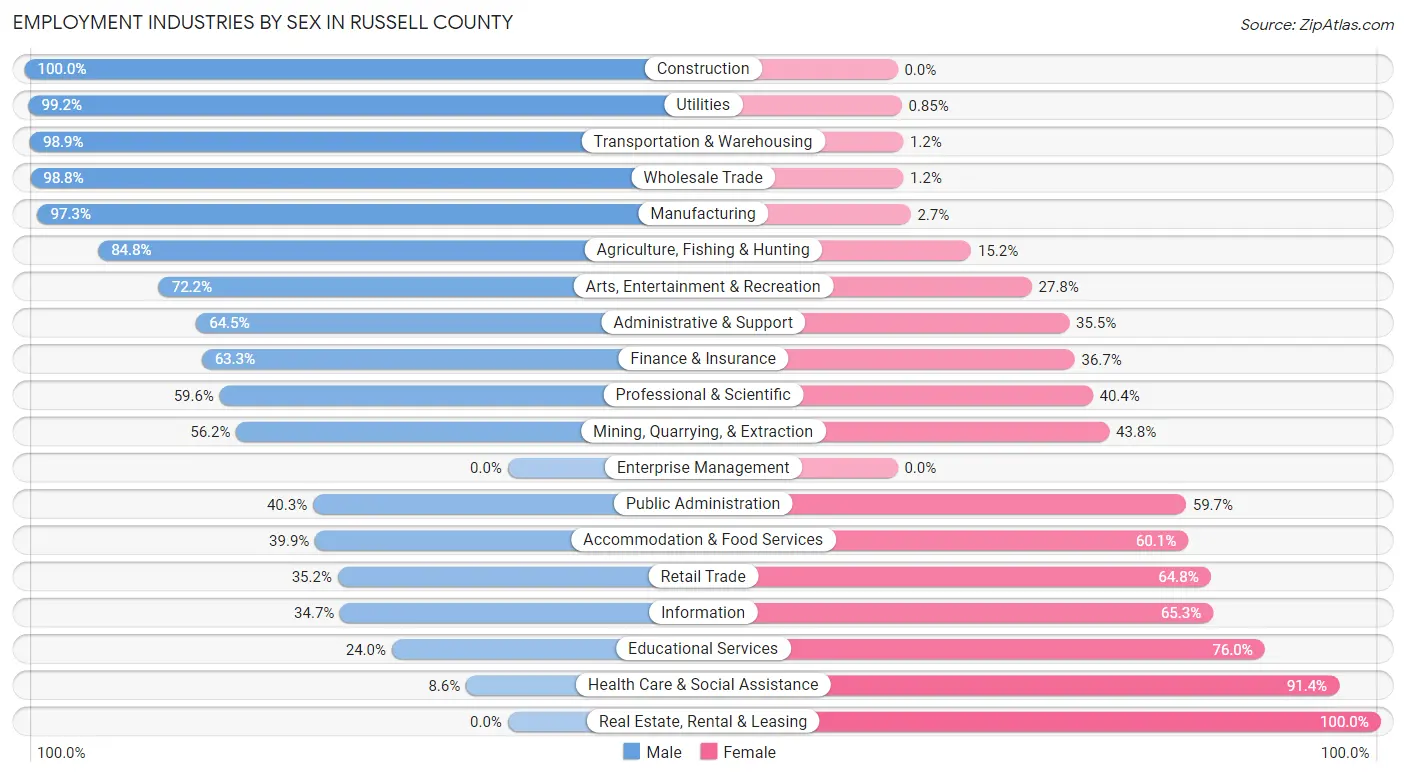
| Industry | Male | Female |
| Agriculture, Fishing & Hunting | 89 (84.8%) | 16 (15.2%) |
| Mining, Quarrying, & Extraction | 50 (56.2%) | 39 (43.8%) |
| Construction | 152 (100.0%) | 0 (0.0%) |
| Manufacturing | 252 (97.3%) | 7 (2.7%) |
| Wholesale Trade | 83 (98.8%) | 1 (1.2%) |
| Retail Trade | 208 (35.2%) | 383 (64.8%) |
| Transportation & Warehousing | 172 (98.9%) | 2 (1.1%) |
| Utilities | 117 (99.2%) | 1 (0.9%) |
| Information | 51 (34.7%) | 96 (65.3%) |
| Finance & Insurance | 76 (63.3%) | 44 (36.7%) |
| Real Estate, Rental & Leasing | 0 (0.0%) | 16 (100.0%) |
| Professional & Scientific | 93 (59.6%) | 63 (40.4%) |
| Enterprise Management | 0 (0.0%) | 0 (0.0%) |
| Administrative & Support | 78 (64.5%) | 43 (35.5%) |
| Educational Services | 36 (24.0%) | 114 (76.0%) |
| Health Care & Social Assistance | 42 (8.6%) | 445 (91.4%) |
| Arts, Entertainment & Recreation | 13 (72.2%) | 5 (27.8%) |
| Accommodation & Food Services | 59 (39.9%) | 89 (60.1%) |
| Public Administration | 52 (40.3%) | 77 (59.7%) |
| Total | 1,663 (51.8%) | 1,550 (48.2%) |
Education in Russell County
School Enrollment in Russell County
The most common levels of schooling among the 1,381 students in Russell County are high school (401 | 29.0%), middle school (366 | 26.5%), and elementary school (246 | 17.8%).
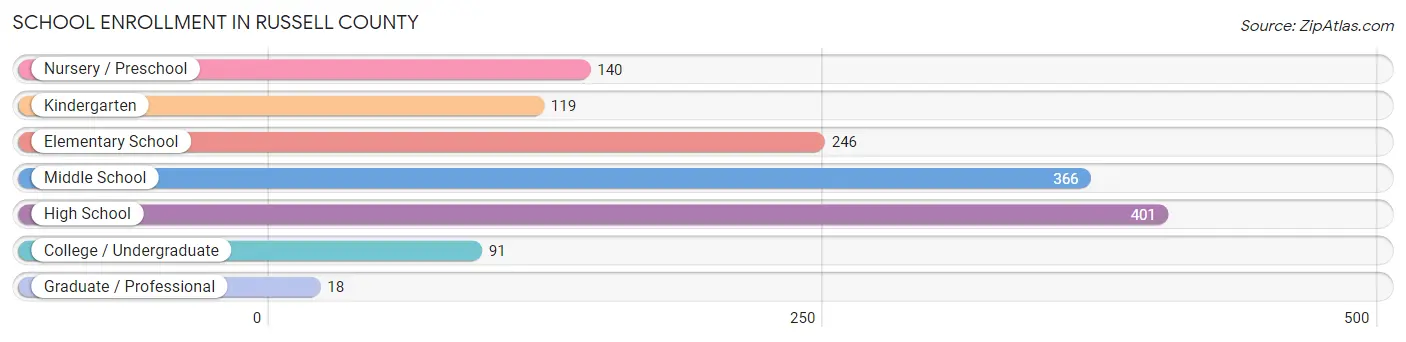
| School Level | # Students | % Students |
| Nursery / Preschool | 140 | 10.1% |
| Kindergarten | 119 | 8.6% |
| Elementary School | 246 | 17.8% |
| Middle School | 366 | 26.5% |
| High School | 401 | 29.0% |
| College / Undergraduate | 91 | 6.6% |
| Graduate / Professional | 18 | 1.3% |
| Total | 1,381 | 100.0% |
School Enrollment by Age by Funding Source in Russell County
Out of a total of 1,381 students who are enrolled in schools in Russell County, 47 (3.4%) attend a private institution, while the remaining 1,334 (96.6%) are enrolled in public schools. The age group of 35 years and over has the highest likelihood of being enrolled in private schools, with 3 (21.4% in the age bracket) enrolled. Conversely, the age group of 3 to 4 year olds has the lowest likelihood of being enrolled in a private school, with 96 (100.0% in the age bracket) attending a public institution.
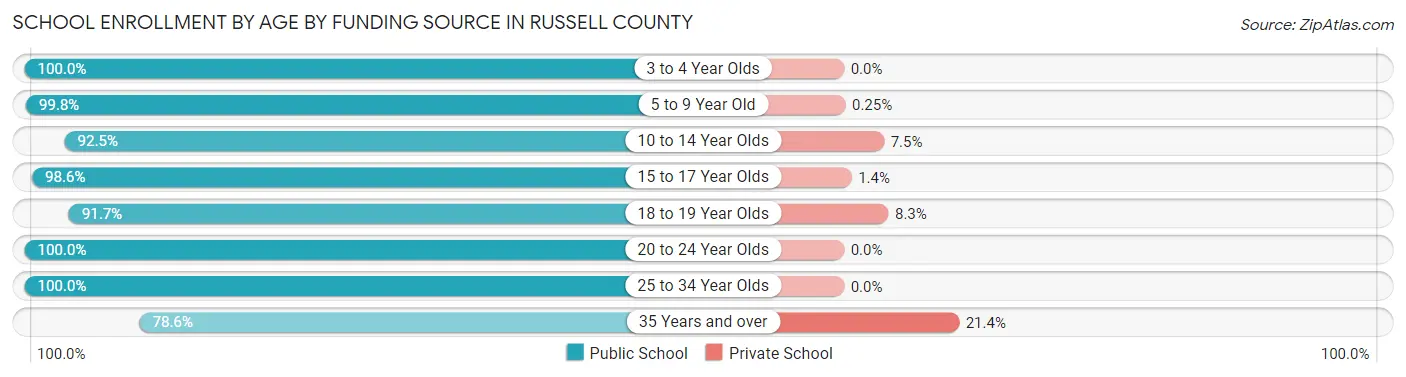
| Age Bracket | Public School | Private School |
| 3 to 4 Year Olds | 96 (100.0%) | 0 (0.0%) |
| 5 to 9 Year Old | 404 (99.8%) | 1 (0.3%) |
| 10 to 14 Year Olds | 360 (92.5%) | 29 (7.5%) |
| 15 to 17 Year Olds | 280 (98.6%) | 4 (1.4%) |
| 18 to 19 Year Olds | 111 (91.7%) | 10 (8.3%) |
| 20 to 24 Year Olds | 56 (100.0%) | 0 (0.0%) |
| 25 to 34 Year Olds | 16 (100.0%) | 0 (0.0%) |
| 35 Years and over | 11 (78.6%) | 3 (21.4%) |
| Total | 1,334 (96.6%) | 47 (3.4%) |
Educational Attainment by Field of Study in Russell County
Education (284 | 25.2%), business (278 | 24.6%), bio, nature & agricultural (105 | 9.3%), arts & humanities (90 | 8.0%), and science & technology (89 | 7.9%) are the most common fields of study among 1,128 individuals in Russell County who have obtained a bachelor's degree or higher.
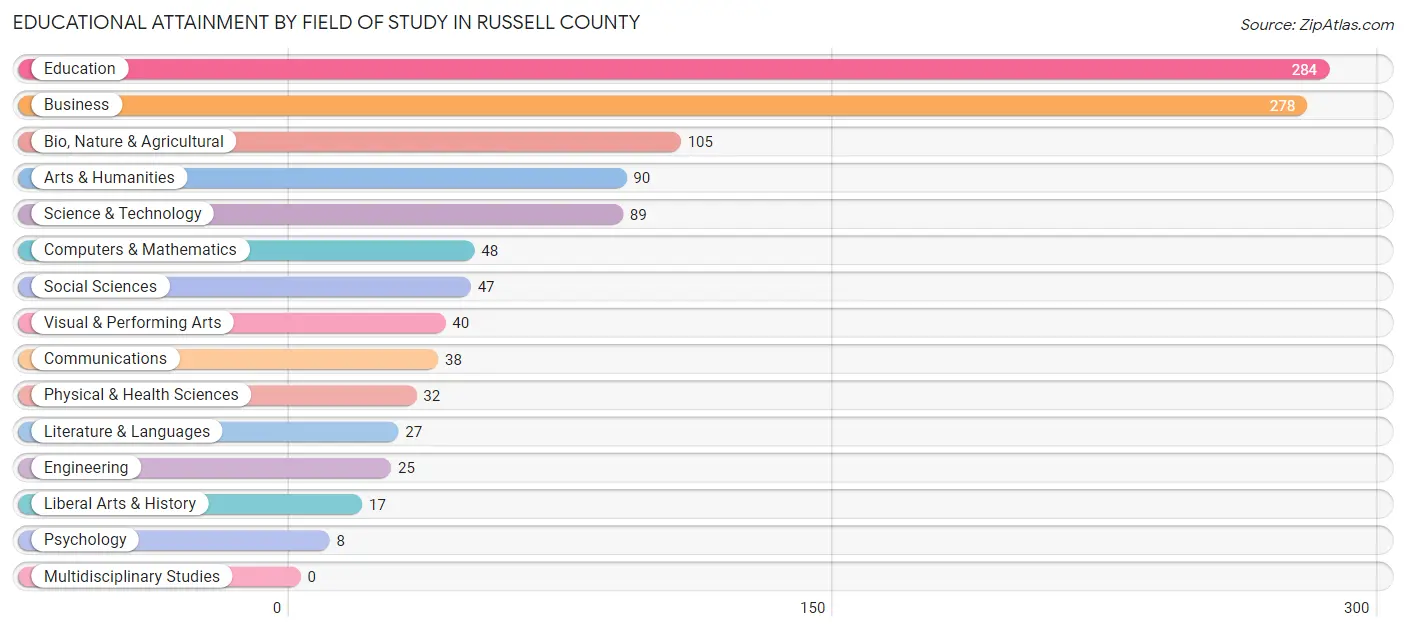
| Field of Study | # Graduates | % Graduates |
| Computers & Mathematics | 48 | 4.3% |
| Bio, Nature & Agricultural | 105 | 9.3% |
| Physical & Health Sciences | 32 | 2.8% |
| Psychology | 8 | 0.7% |
| Social Sciences | 47 | 4.2% |
| Engineering | 25 | 2.2% |
| Multidisciplinary Studies | 0 | 0.0% |
| Science & Technology | 89 | 7.9% |
| Business | 278 | 24.6% |
| Education | 284 | 25.2% |
| Literature & Languages | 27 | 2.4% |
| Liberal Arts & History | 17 | 1.5% |
| Visual & Performing Arts | 40 | 3.5% |
| Communications | 38 | 3.4% |
| Arts & Humanities | 90 | 8.0% |
| Total | 1,128 | 100.0% |
Transportation & Commute in Russell County
Vehicle Availability by Sex in Russell County
The most prevalent vehicle ownership categories in Russell County are males with 2 vehicles (749, accounting for 47.2%) and females with 2 vehicles (434, making up 49.0%).
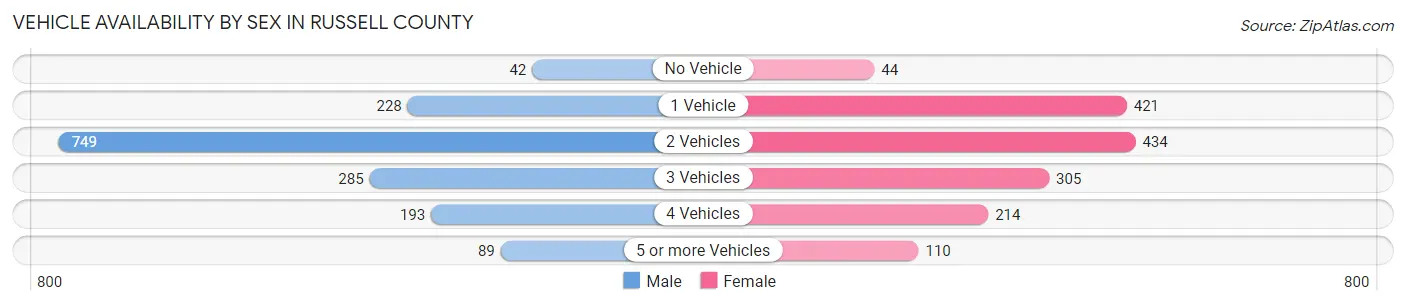
| Vehicles Available | Male | Female |
| No Vehicle | 42 (2.6%) | 44 (2.9%) |
| 1 Vehicle | 228 (14.4%) | 421 (27.6%) |
| 2 Vehicles | 749 (47.2%) | 434 (28.4%) |
| 3 Vehicles | 285 (18.0%) | 305 (20.0%) |
| 4 Vehicles | 193 (12.2%) | 214 (14.0%) |
| 5 or more Vehicles | 89 (5.6%) | 110 (7.2%) |
| Total | 1,586 (100.0%) | 1,528 (100.0%) |
Commute Time in Russell County
The most frequently occuring commute durations in Russell County are 5 to 9 minutes (821 commuters, 28.4%), 10 to 14 minutes (599 commuters, 20.7%), and less than 5 minutes (388 commuters, 13.4%).
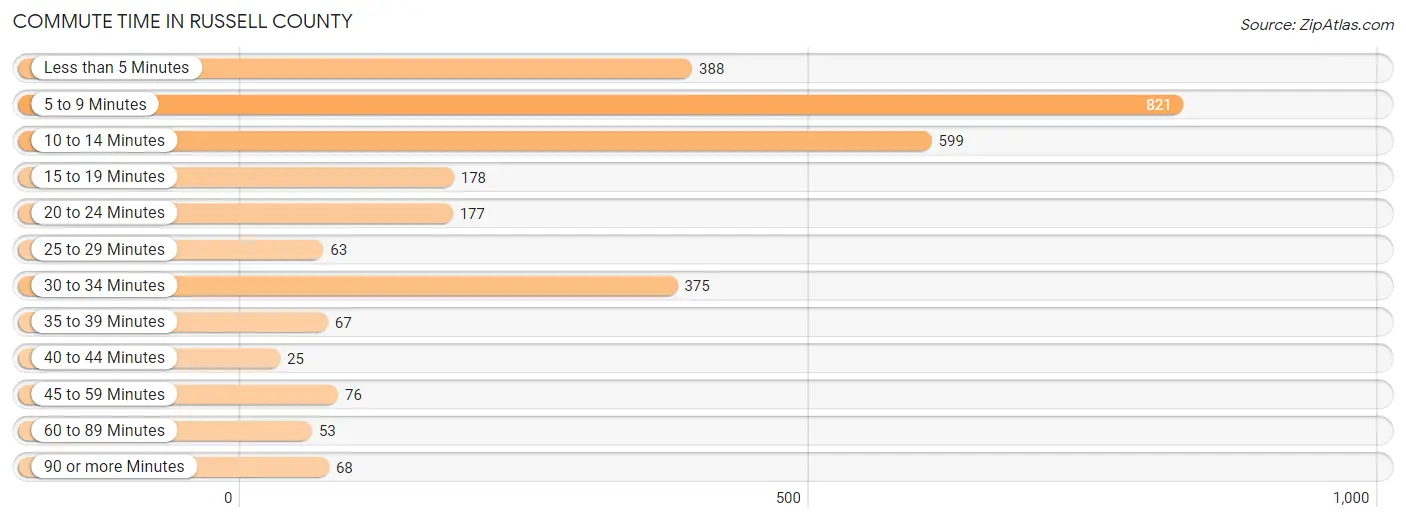
| Commute Time | # Commuters | % Commuters |
| Less than 5 Minutes | 388 | 13.4% |
| 5 to 9 Minutes | 821 | 28.4% |
| 10 to 14 Minutes | 599 | 20.7% |
| 15 to 19 Minutes | 178 | 6.2% |
| 20 to 24 Minutes | 177 | 6.1% |
| 25 to 29 Minutes | 63 | 2.2% |
| 30 to 34 Minutes | 375 | 13.0% |
| 35 to 39 Minutes | 67 | 2.3% |
| 40 to 44 Minutes | 25 | 0.9% |
| 45 to 59 Minutes | 76 | 2.6% |
| 60 to 89 Minutes | 53 | 1.8% |
| 90 or more Minutes | 68 | 2.4% |
Commute Time by Sex in Russell County
The most common commute times in Russell County are 10 to 14 minutes (385 commuters, 24.8%) for males and 5 to 9 minutes (563 commuters, 42.0%) for females.
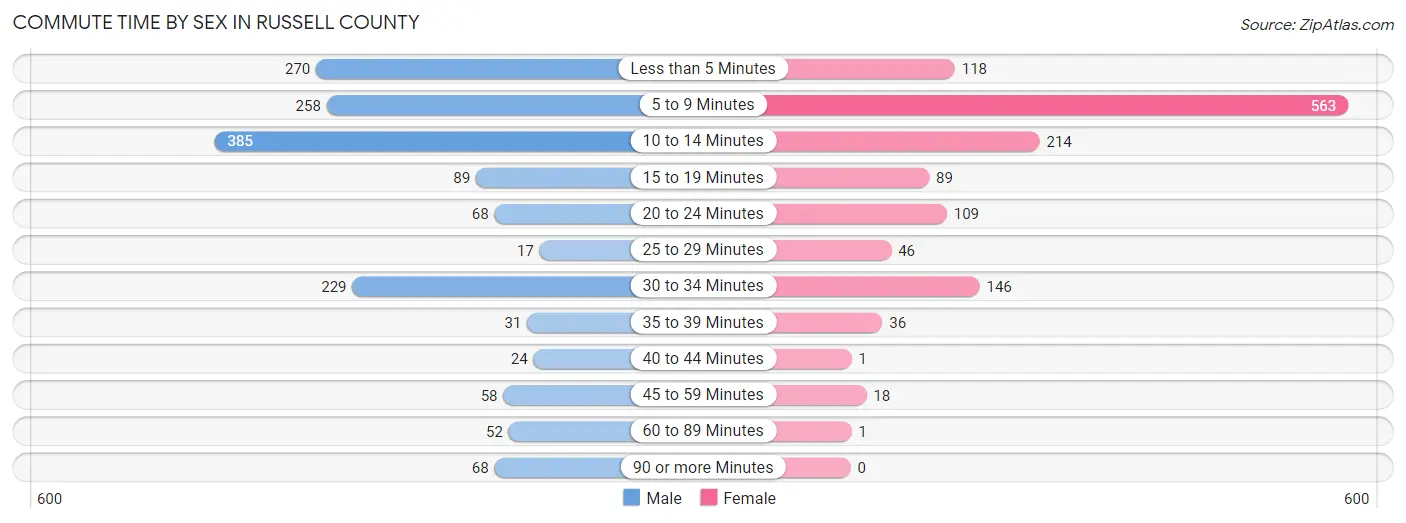
| Commute Time | Male | Female |
| Less than 5 Minutes | 270 (17.4%) | 118 (8.8%) |
| 5 to 9 Minutes | 258 (16.7%) | 563 (42.0%) |
| 10 to 14 Minutes | 385 (24.8%) | 214 (16.0%) |
| 15 to 19 Minutes | 89 (5.8%) | 89 (6.6%) |
| 20 to 24 Minutes | 68 (4.4%) | 109 (8.1%) |
| 25 to 29 Minutes | 17 (1.1%) | 46 (3.4%) |
| 30 to 34 Minutes | 229 (14.8%) | 146 (10.9%) |
| 35 to 39 Minutes | 31 (2.0%) | 36 (2.7%) |
| 40 to 44 Minutes | 24 (1.5%) | 1 (0.1%) |
| 45 to 59 Minutes | 58 (3.7%) | 18 (1.3%) |
| 60 to 89 Minutes | 52 (3.4%) | 1 (0.1%) |
| 90 or more Minutes | 68 (4.4%) | 0 (0.0%) |
Time of Departure to Work by Sex in Russell County
The most frequent times of departure to work in Russell County are 7:30 AM to 7:59 AM (431, 27.8%) for males and 7:30 AM to 7:59 AM (280, 20.9%) for females.
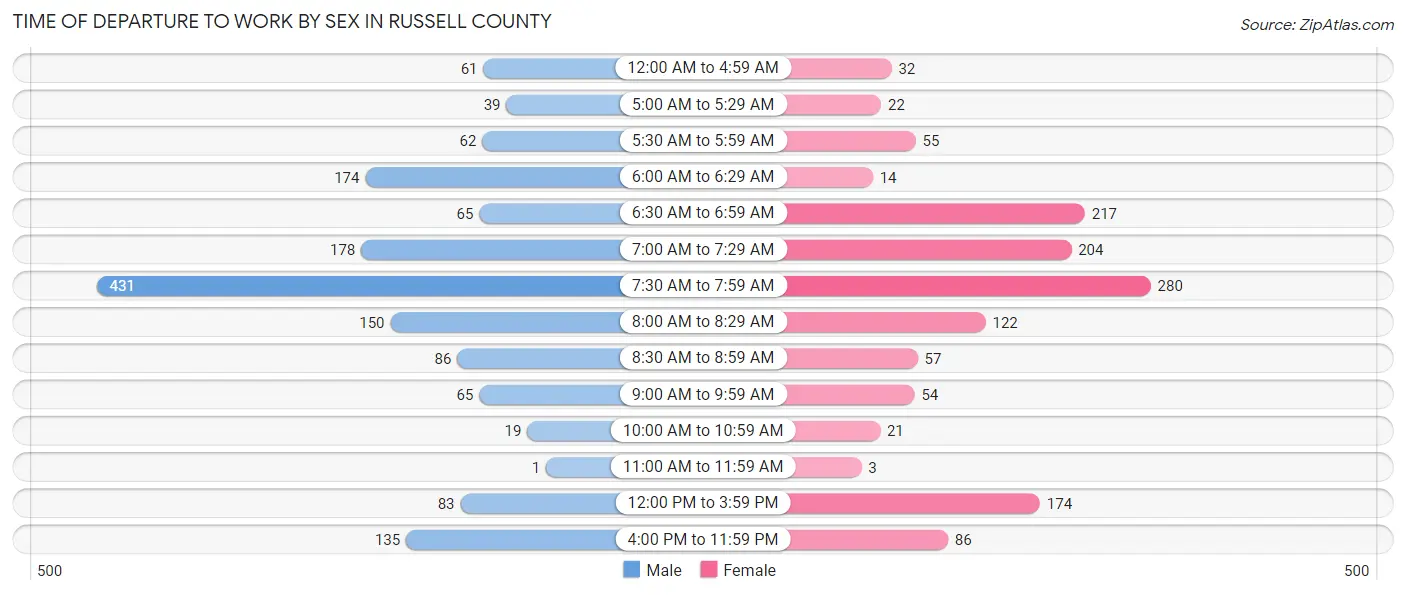
| Time of Departure | Male | Female |
| 12:00 AM to 4:59 AM | 61 (3.9%) | 32 (2.4%) |
| 5:00 AM to 5:29 AM | 39 (2.5%) | 22 (1.6%) |
| 5:30 AM to 5:59 AM | 62 (4.0%) | 55 (4.1%) |
| 6:00 AM to 6:29 AM | 174 (11.2%) | 14 (1.0%) |
| 6:30 AM to 6:59 AM | 65 (4.2%) | 217 (16.2%) |
| 7:00 AM to 7:29 AM | 178 (11.5%) | 204 (15.2%) |
| 7:30 AM to 7:59 AM | 431 (27.8%) | 280 (20.9%) |
| 8:00 AM to 8:29 AM | 150 (9.7%) | 122 (9.1%) |
| 8:30 AM to 8:59 AM | 86 (5.6%) | 57 (4.3%) |
| 9:00 AM to 9:59 AM | 65 (4.2%) | 54 (4.0%) |
| 10:00 AM to 10:59 AM | 19 (1.2%) | 21 (1.6%) |
| 11:00 AM to 11:59 AM | 1 (0.1%) | 3 (0.2%) |
| 12:00 PM to 3:59 PM | 83 (5.4%) | 174 (13.0%) |
| 4:00 PM to 11:59 PM | 135 (8.7%) | 86 (6.4%) |
| Total | 1,549 (100.0%) | 1,341 (100.0%) |
Housing Occupancy in Russell County
Occupancy by Ownership in Russell County
Of the total 2,995 dwellings in Russell County, owner-occupied units account for 2,281 (76.2%), while renter-occupied units make up 714 (23.8%).
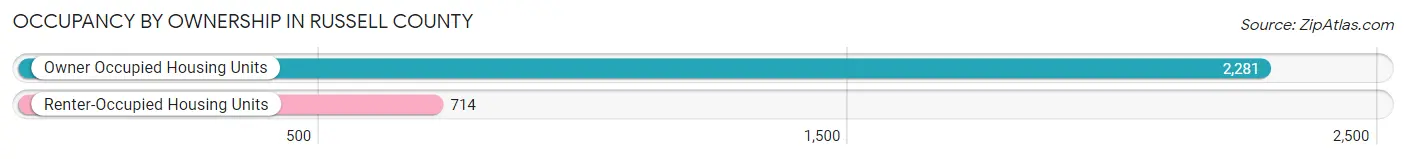
| Occupancy | # Housing Units | % Housing Units |
| Owner Occupied Housing Units | 2,281 | 76.2% |
| Renter-Occupied Housing Units | 714 | 23.8% |
| Total Occupied Housing Units | 2,995 | 100.0% |
Occupancy by Household Size in Russell County
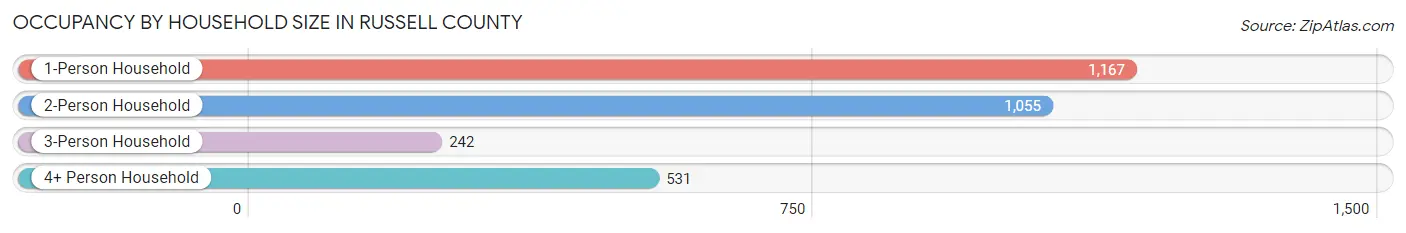
| Household Size | # Housing Units | % Housing Units |
| 1-Person Household | 1,167 | 39.0% |
| 2-Person Household | 1,055 | 35.2% |
| 3-Person Household | 242 | 8.1% |
| 4+ Person Household | 531 | 17.7% |
| Total Housing Units | 2,995 | 100.0% |
Occupancy by Ownership by Household Size in Russell County
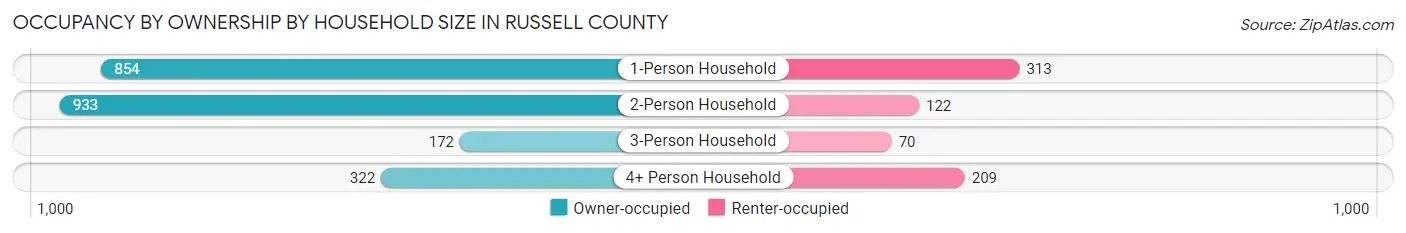
| Household Size | Owner-occupied | Renter-occupied |
| 1-Person Household | 854 (73.2%) | 313 (26.8%) |
| 2-Person Household | 933 (88.4%) | 122 (11.6%) |
| 3-Person Household | 172 (71.1%) | 70 (28.9%) |
| 4+ Person Household | 322 (60.6%) | 209 (39.4%) |
| Total Housing Units | 2,281 (76.2%) | 714 (23.8%) |
Occupancy by Educational Attainment in Russell County
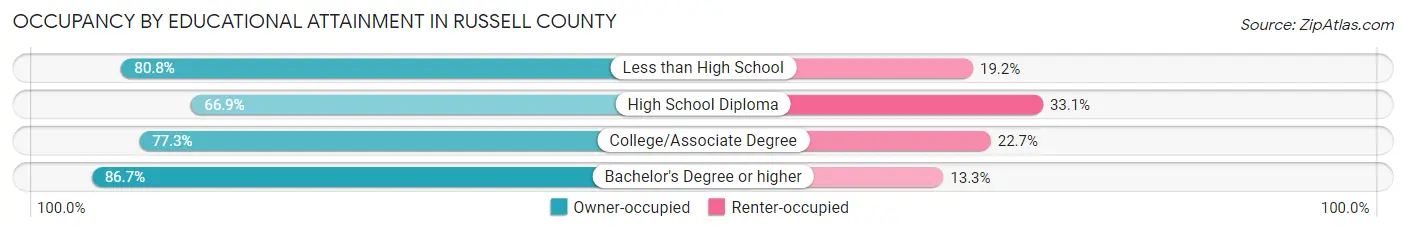
| Household Size | Owner-occupied | Renter-occupied |
| Less than High School | 223 (80.8%) | 53 (19.2%) |
| High School Diploma | 676 (66.9%) | 334 (33.1%) |
| College/Associate Degree | 816 (77.3%) | 240 (22.7%) |
| Bachelor's Degree or higher | 566 (86.7%) | 87 (13.3%) |
Occupancy by Age of Householder in Russell County
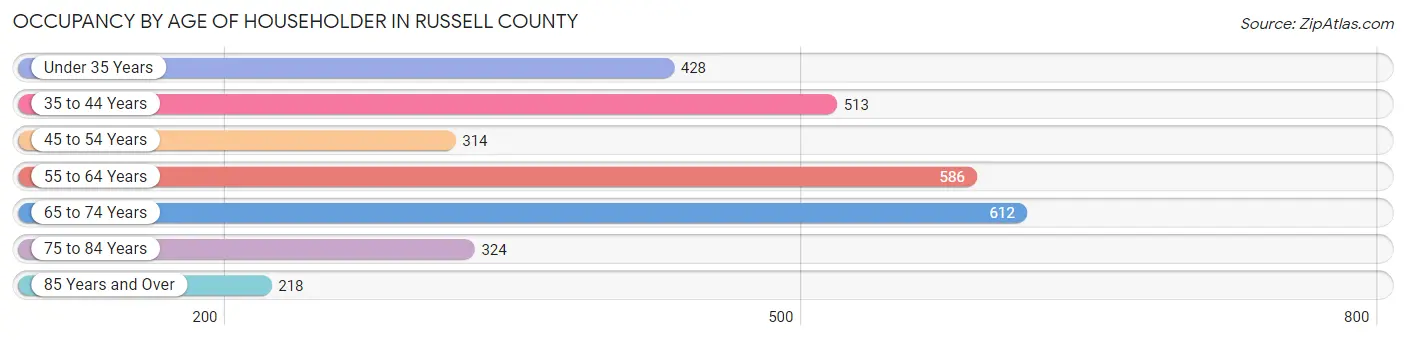
| Age Bracket | # Households | % Households |
| Under 35 Years | 428 | 14.3% |
| 35 to 44 Years | 513 | 17.1% |
| 45 to 54 Years | 314 | 10.5% |
| 55 to 64 Years | 586 | 19.6% |
| 65 to 74 Years | 612 | 20.4% |
| 75 to 84 Years | 324 | 10.8% |
| 85 Years and Over | 218 | 7.3% |
| Total | 2,995 | 100.0% |
Housing Finances in Russell County
Median Income by Occupancy in Russell County
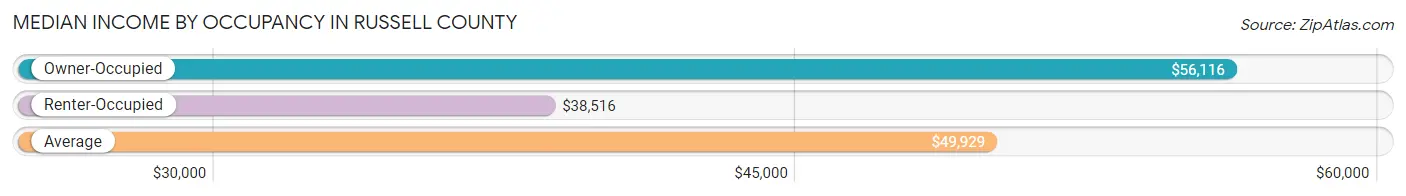
| Occupancy Type | # Households | Median Income |
| Owner-Occupied | 2,281 (76.2%) | $56,116 |
| Renter-Occupied | 714 (23.8%) | $38,516 |
| Average | 2,995 (100.0%) | $49,929 |
Occupancy by Householder Income Bracket in Russell County
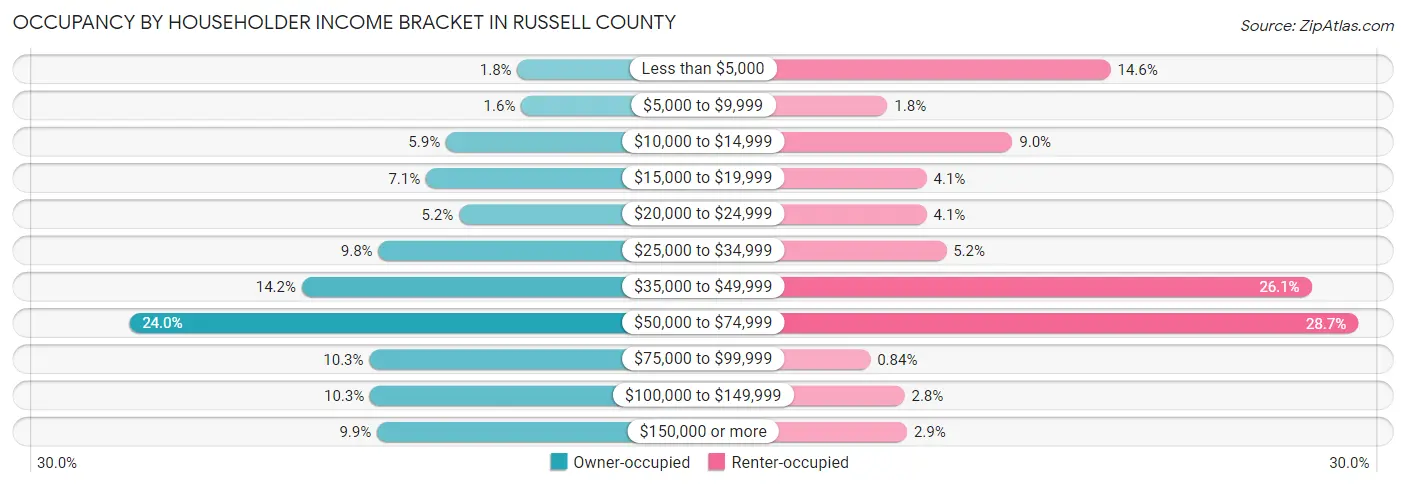
| Income Bracket | Owner-occupied | Renter-occupied |
| Less than $5,000 | 42 (1.8%) | 104 (14.6%) |
| $5,000 to $9,999 | 37 (1.6%) | 13 (1.8%) |
| $10,000 to $14,999 | 135 (5.9%) | 64 (9.0%) |
| $15,000 to $19,999 | 161 (7.1%) | 29 (4.1%) |
| $20,000 to $24,999 | 118 (5.2%) | 29 (4.1%) |
| $25,000 to $34,999 | 223 (9.8%) | 37 (5.2%) |
| $35,000 to $49,999 | 323 (14.2%) | 186 (26.1%) |
| $50,000 to $74,999 | 548 (24.0%) | 205 (28.7%) |
| $75,000 to $99,999 | 235 (10.3%) | 6 (0.8%) |
| $100,000 to $149,999 | 234 (10.3%) | 20 (2.8%) |
| $150,000 or more | 225 (9.9%) | 21 (2.9%) |
| Total | 2,281 (100.0%) | 714 (100.0%) |
Monthly Housing Cost Tiers in Russell County
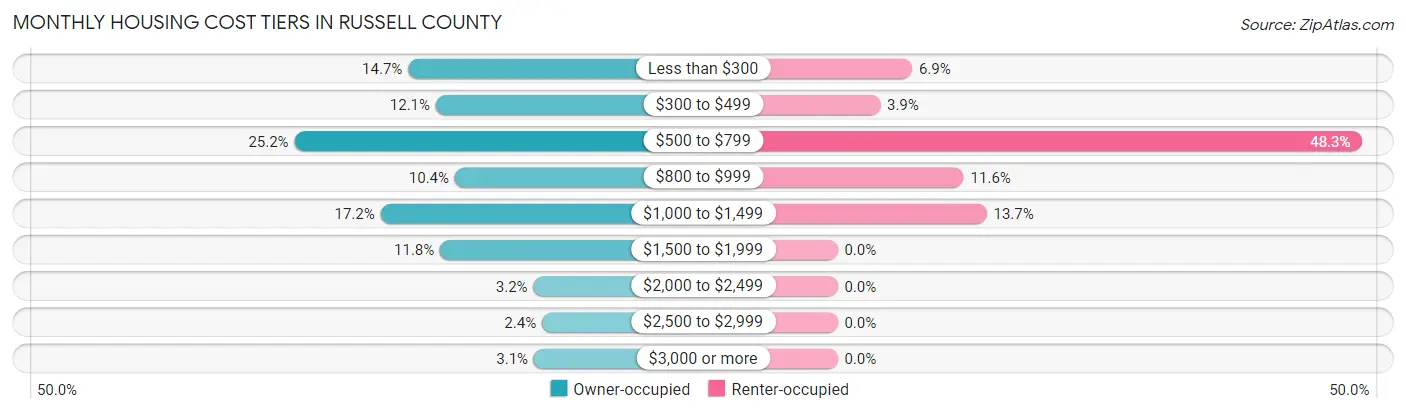
| Monthly Cost | Owner-occupied | Renter-occupied |
| Less than $300 | 335 (14.7%) | 49 (6.9%) |
| $300 to $499 | 277 (12.1%) | 28 (3.9%) |
| $500 to $799 | 574 (25.2%) | 345 (48.3%) |
| $800 to $999 | 237 (10.4%) | 83 (11.6%) |
| $1,000 to $1,499 | 393 (17.2%) | 98 (13.7%) |
| $1,500 to $1,999 | 268 (11.7%) | 0 (0.0%) |
| $2,000 to $2,499 | 72 (3.2%) | 0 (0.0%) |
| $2,500 to $2,999 | 54 (2.4%) | 0 (0.0%) |
| $3,000 or more | 71 (3.1%) | 0 (0.0%) |
| Total | 2,281 (100.0%) | 714 (100.0%) |
Physical Housing Characteristics in Russell County
Housing Structures in Russell County
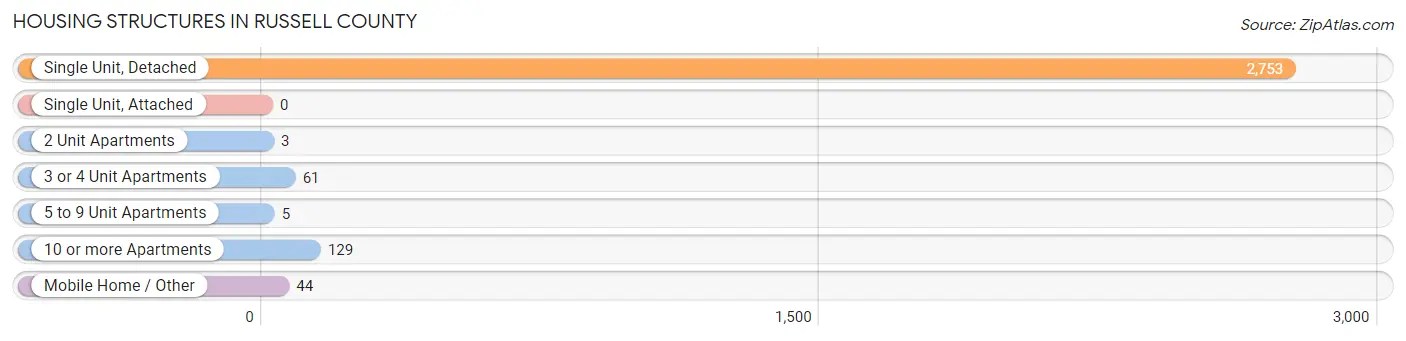
| Structure Type | # Housing Units | % Housing Units |
| Single Unit, Detached | 2,753 | 91.9% |
| Single Unit, Attached | 0 | 0.0% |
| 2 Unit Apartments | 3 | 0.1% |
| 3 or 4 Unit Apartments | 61 | 2.0% |
| 5 to 9 Unit Apartments | 5 | 0.2% |
| 10 or more Apartments | 129 | 4.3% |
| Mobile Home / Other | 44 | 1.5% |
| Total | 2,995 | 100.0% |
Housing Structures by Occupancy in Russell County
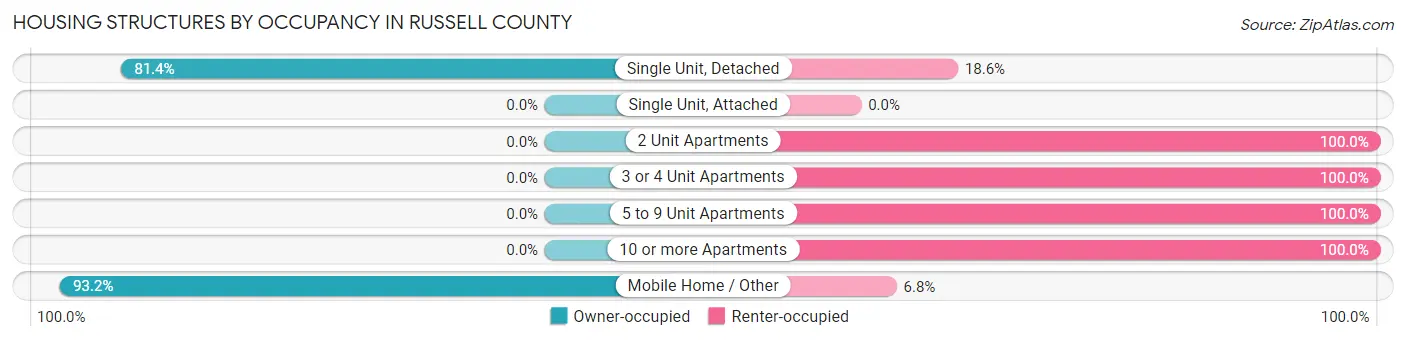
| Structure Type | Owner-occupied | Renter-occupied |
| Single Unit, Detached | 2,240 (81.4%) | 513 (18.6%) |
| Single Unit, Attached | 0 (0.0%) | 0 (0.0%) |
| 2 Unit Apartments | 0 (0.0%) | 3 (100.0%) |
| 3 or 4 Unit Apartments | 0 (0.0%) | 61 (100.0%) |
| 5 to 9 Unit Apartments | 0 (0.0%) | 5 (100.0%) |
| 10 or more Apartments | 0 (0.0%) | 129 (100.0%) |
| Mobile Home / Other | 41 (93.2%) | 3 (6.8%) |
| Total | 2,281 (76.2%) | 714 (23.8%) |
Housing Structures by Number of Rooms in Russell County
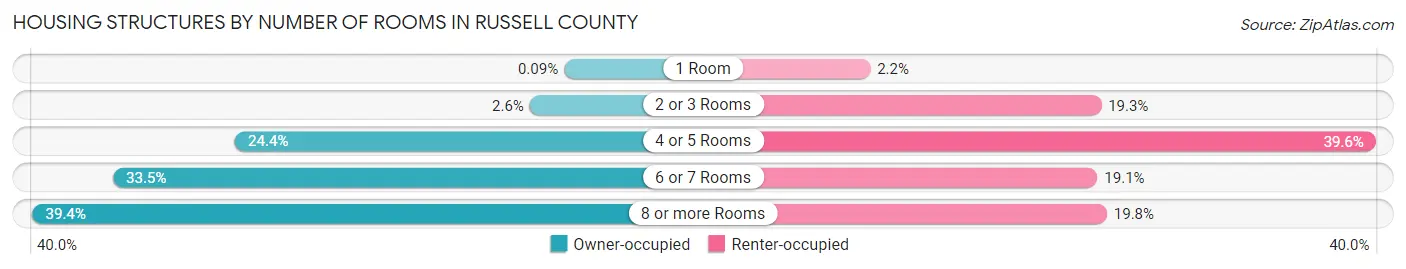
| Number of Rooms | Owner-occupied | Renter-occupied |
| 1 Room | 2 (0.1%) | 16 (2.2%) |
| 2 or 3 Rooms | 60 (2.6%) | 138 (19.3%) |
| 4 or 5 Rooms | 557 (24.4%) | 283 (39.6%) |
| 6 or 7 Rooms | 763 (33.5%) | 136 (19.1%) |
| 8 or more Rooms | 899 (39.4%) | 141 (19.8%) |
| Total | 2,281 (100.0%) | 714 (100.0%) |
Housing Structure by Heating Type in Russell County
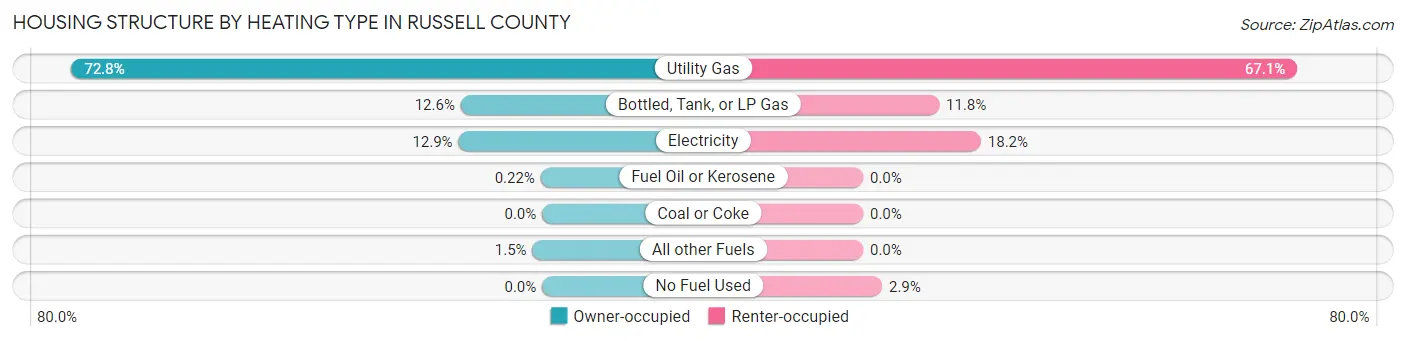
| Heating Type | Owner-occupied | Renter-occupied |
| Utility Gas | 1,660 (72.8%) | 479 (67.1%) |
| Bottled, Tank, or LP Gas | 287 (12.6%) | 84 (11.8%) |
| Electricity | 295 (12.9%) | 130 (18.2%) |
| Fuel Oil or Kerosene | 5 (0.2%) | 0 (0.0%) |
| Coal or Coke | 0 (0.0%) | 0 (0.0%) |
| All other Fuels | 34 (1.5%) | 0 (0.0%) |
| No Fuel Used | 0 (0.0%) | 21 (2.9%) |
| Total | 2,281 (100.0%) | 714 (100.0%) |
Household Vehicle Usage in Russell County
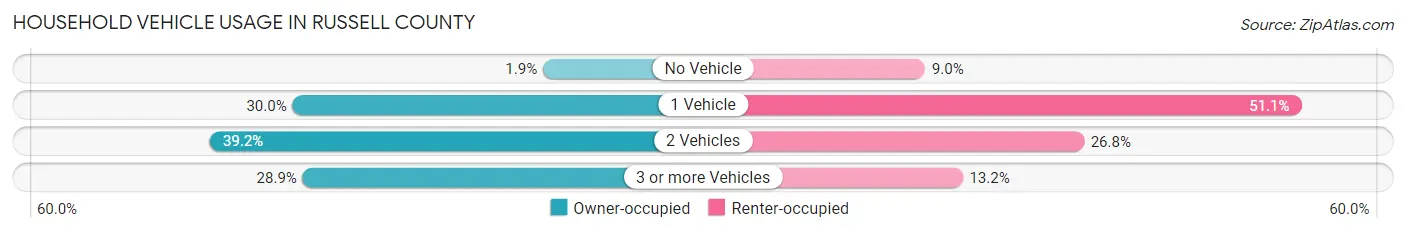
| Vehicles per Household | Owner-occupied | Renter-occupied |
| No Vehicle | 44 (1.9%) | 64 (9.0%) |
| 1 Vehicle | 684 (30.0%) | 365 (51.1%) |
| 2 Vehicles | 895 (39.2%) | 191 (26.8%) |
| 3 or more Vehicles | 658 (28.8%) | 94 (13.2%) |
| Total | 2,281 (100.0%) | 714 (100.0%) |
Real Estate & Mortgages in Russell County
Real Estate and Mortgage Overview in Russell County
| Characteristic | Without Mortgage | With Mortgage |
| Housing Units | 1,260 | 1,021 |
| Median Property Value | $73,300 | $144,600 |
| Median Household Income | $43,676 | $173 |
| Monthly Housing Costs | $510 | $71 |
| Real Estate Taxes | $1,569 | $0 |
Property Value by Mortgage Status in Russell County
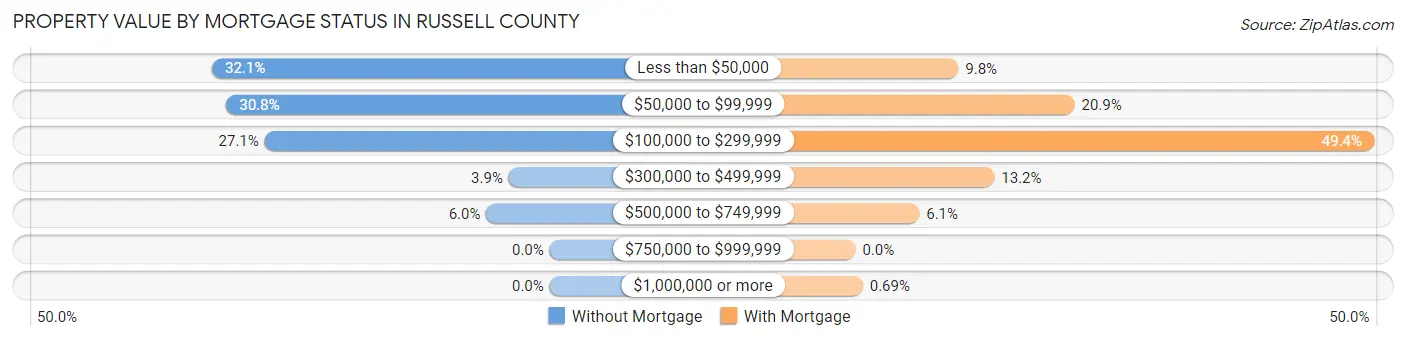
| Property Value | Without Mortgage | With Mortgage |
| Less than $50,000 | 405 (32.1%) | 100 (9.8%) |
| $50,000 to $99,999 | 388 (30.8%) | 213 (20.9%) |
| $100,000 to $299,999 | 342 (27.1%) | 504 (49.4%) |
| $300,000 to $499,999 | 49 (3.9%) | 135 (13.2%) |
| $500,000 to $749,999 | 76 (6.0%) | 62 (6.1%) |
| $750,000 to $999,999 | 0 (0.0%) | 0 (0.0%) |
| $1,000,000 or more | 0 (0.0%) | 7 (0.7%) |
| Total | 1,260 (100.0%) | 1,021 (100.0%) |
Household Income by Mortgage Status in Russell County
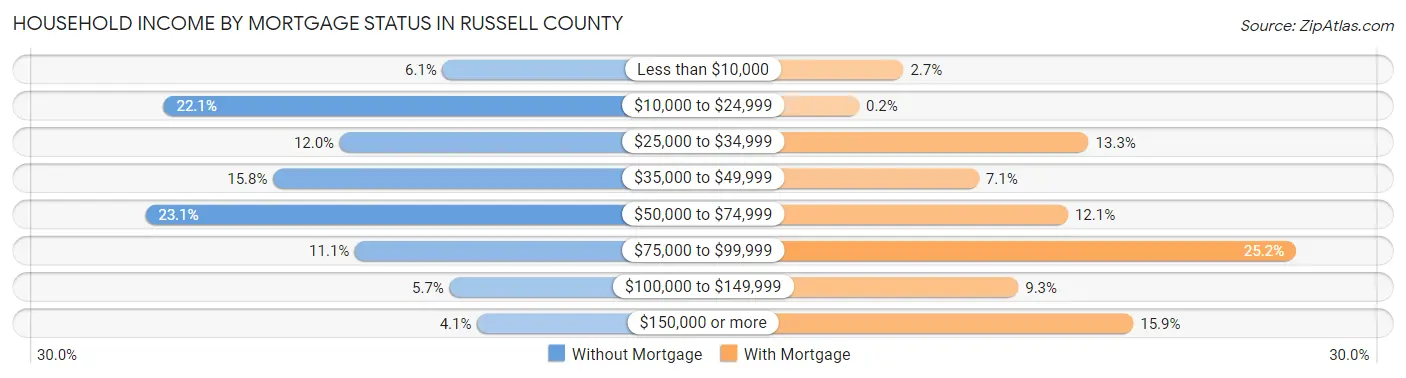
| Household Income | Without Mortgage | With Mortgage |
| Less than $10,000 | 77 (6.1%) | 28 (2.7%) |
| $10,000 to $24,999 | 278 (22.1%) | 2 (0.2%) |
| $25,000 to $34,999 | 151 (12.0%) | 136 (13.3%) |
| $35,000 to $49,999 | 199 (15.8%) | 72 (7.0%) |
| $50,000 to $74,999 | 291 (23.1%) | 124 (12.1%) |
| $75,000 to $99,999 | 140 (11.1%) | 257 (25.2%) |
| $100,000 to $149,999 | 72 (5.7%) | 95 (9.3%) |
| $150,000 or more | 52 (4.1%) | 162 (15.9%) |
| Total | 1,260 (100.0%) | 1,021 (100.0%) |
Property Value to Household Income Ratio in Russell County
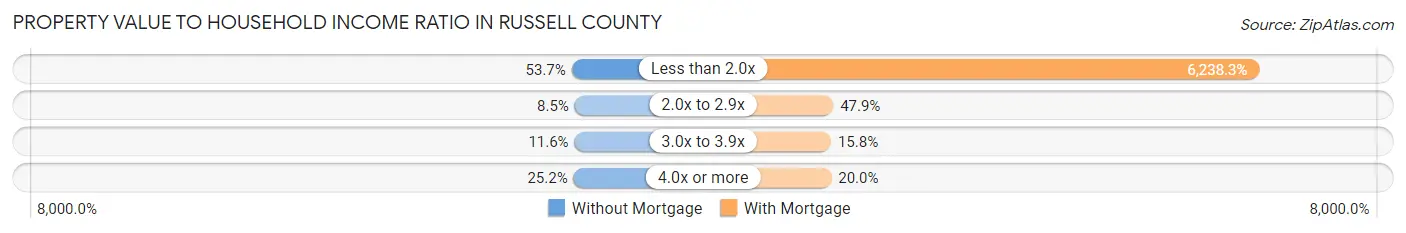
| Value-to-Income Ratio | Without Mortgage | With Mortgage |
| Less than 2.0x | 677 (53.7%) | 63,693 (6,238.3%) |
| 2.0x to 2.9x | 107 (8.5%) | 489 (47.9%) |
| 3.0x to 3.9x | 146 (11.6%) | 161 (15.8%) |
| 4.0x or more | 318 (25.2%) | 204 (20.0%) |
| Total | 1,260 (100.0%) | 1,021 (100.0%) |
Real Estate Taxes by Mortgage Status in Russell County
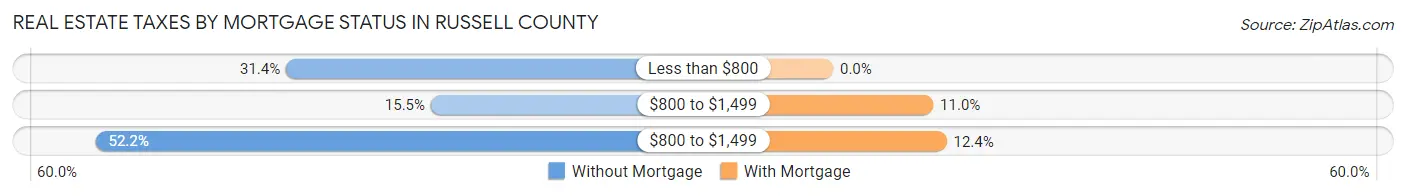
| Property Taxes | Without Mortgage | With Mortgage |
| Less than $800 | 395 (31.4%) | 0 (0.0%) |
| $800 to $1,499 | 195 (15.5%) | 112 (11.0%) |
| $800 to $1,499 | 658 (52.2%) | 127 (12.4%) |
| Total | 1,260 (100.0%) | 1,021 (100.0%) |
Health & Disability in Russell County
Health Insurance Coverage by Age in Russell County
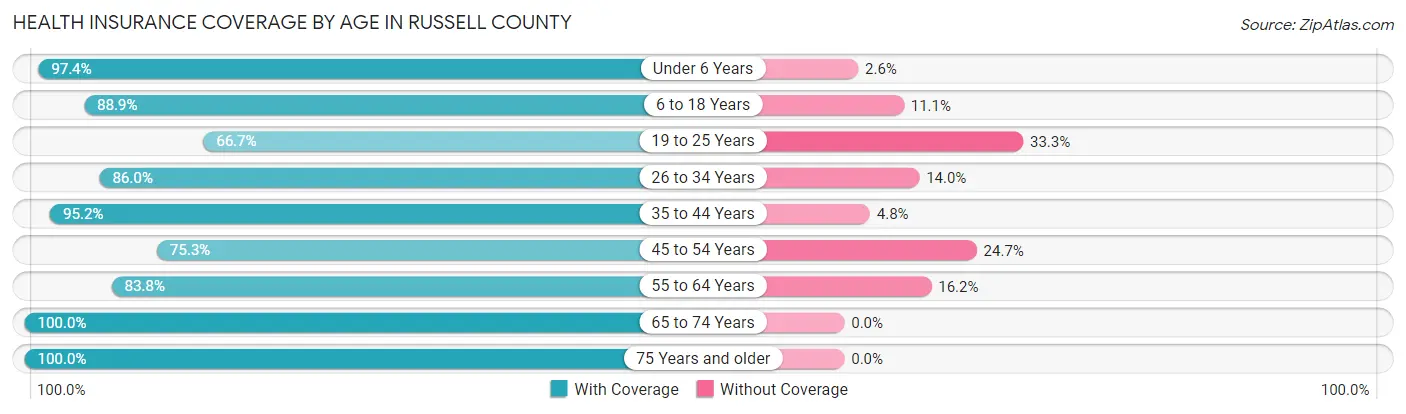
| Age Bracket | With Coverage | Without Coverage |
| Under 6 Years | 493 (97.4%) | 13 (2.6%) |
| 6 to 18 Years | 1,001 (88.9%) | 125 (11.1%) |
| 19 to 25 Years | 220 (66.7%) | 110 (33.3%) |
| 26 to 34 Years | 499 (86.0%) | 81 (14.0%) |
| 35 to 44 Years | 739 (95.2%) | 37 (4.8%) |
| 45 to 54 Years | 531 (75.3%) | 174 (24.7%) |
| 55 to 64 Years | 821 (83.8%) | 159 (16.2%) |
| 65 to 74 Years | 895 (100.0%) | 0 (0.0%) |
| 75 Years and older | 698 (100.0%) | 0 (0.0%) |
| Total | 5,897 (89.4%) | 699 (10.6%) |
Health Insurance Coverage by Citizenship Status in Russell County
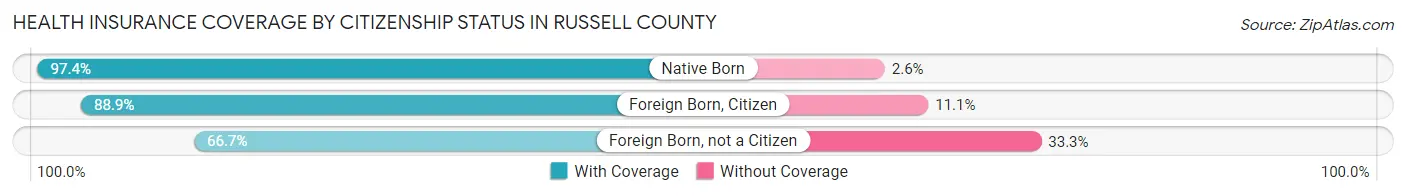
| Citizenship Status | With Coverage | Without Coverage |
| Native Born | 493 (97.4%) | 13 (2.6%) |
| Foreign Born, Citizen | 1,001 (88.9%) | 125 (11.1%) |
| Foreign Born, not a Citizen | 220 (66.7%) | 110 (33.3%) |
Health Insurance Coverage by Household Income in Russell County
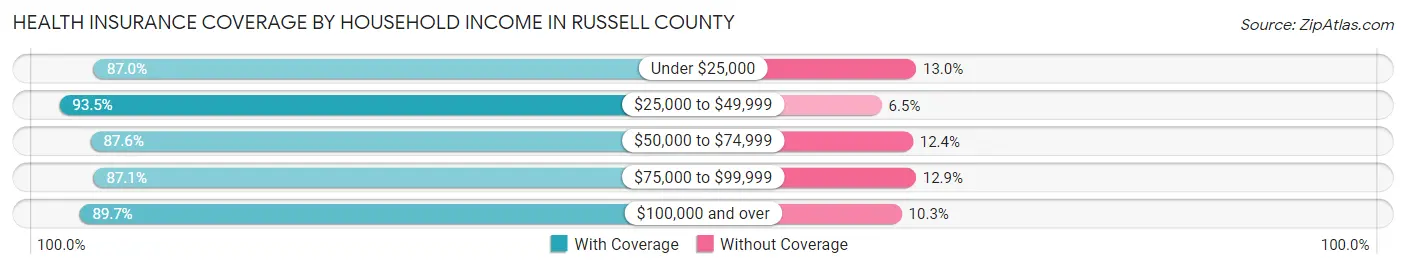
| Household Income | With Coverage | Without Coverage |
| Under $25,000 | 852 (87.0%) | 127 (13.0%) |
| $25,000 to $49,999 | 1,502 (93.5%) | 105 (6.5%) |
| $50,000 to $74,999 | 1,560 (87.6%) | 220 (12.4%) |
| $75,000 to $99,999 | 586 (87.1%) | 87 (12.9%) |
| $100,000 and over | 1,387 (89.7%) | 159 (10.3%) |
Public vs Private Health Insurance Coverage by Age in Russell County
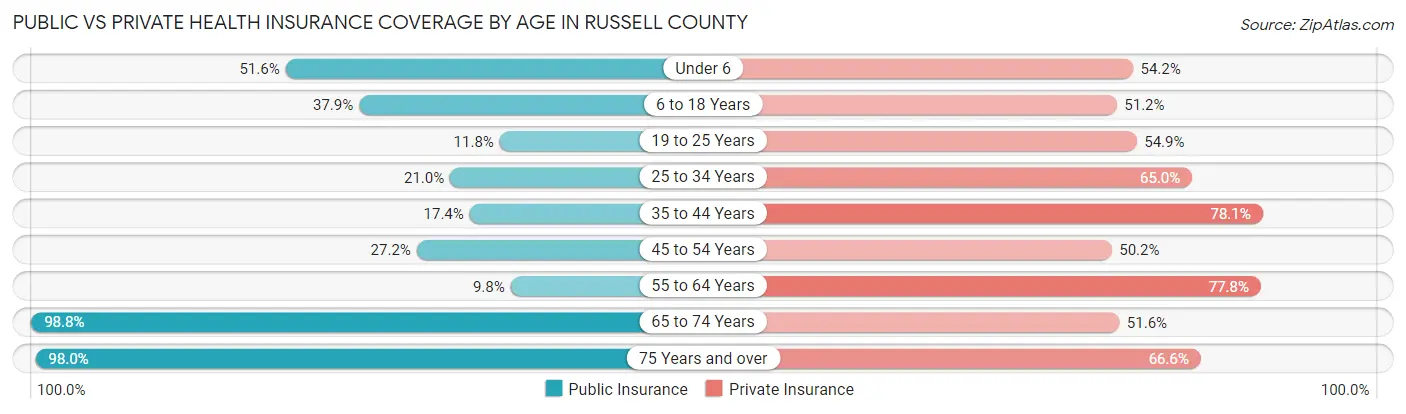
| Age Bracket | Public Insurance | Private Insurance |
| Under 6 | 261 (51.6%) | 274 (54.1%) |
| 6 to 18 Years | 427 (37.9%) | 576 (51.1%) |
| 19 to 25 Years | 39 (11.8%) | 181 (54.8%) |
| 25 to 34 Years | 122 (21.0%) | 377 (65.0%) |
| 35 to 44 Years | 135 (17.4%) | 606 (78.1%) |
| 45 to 54 Years | 192 (27.2%) | 354 (50.2%) |
| 55 to 64 Years | 96 (9.8%) | 762 (77.8%) |
| 65 to 74 Years | 884 (98.8%) | 462 (51.6%) |
| 75 Years and over | 684 (98.0%) | 465 (66.6%) |
| Total | 2,840 (43.1%) | 4,057 (61.5%) |
Disability Status by Sex by Age in Russell County
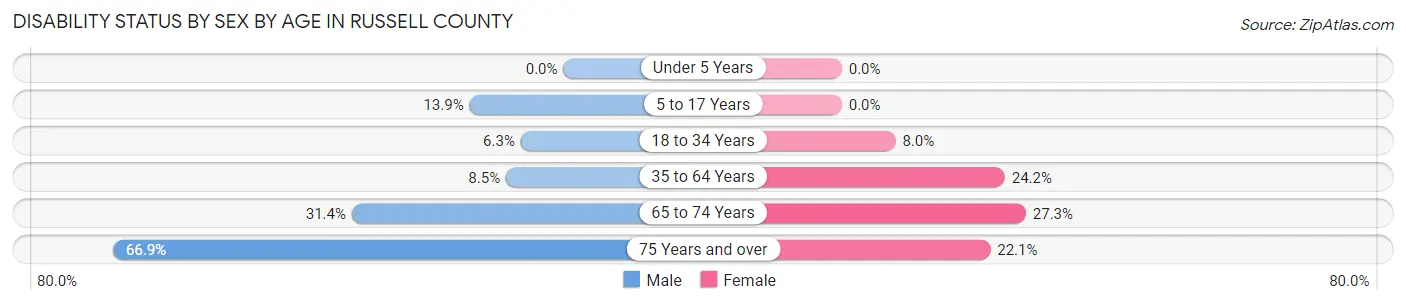
| Age Bracket | Male | Female |
| Under 5 Years | 0 (0.0%) | 0 (0.0%) |
| 5 to 17 Years | 75 (13.9%) | 0 (0.0%) |
| 18 to 34 Years | 35 (6.3%) | 42 (8.0%) |
| 35 to 64 Years | 108 (8.5%) | 289 (24.2%) |
| 65 to 74 Years | 126 (31.4%) | 135 (27.3%) |
| 75 Years and over | 206 (66.9%) | 86 (22.1%) |
Disability Class by Sex by Age in Russell County
Disability Class: Hearing Difficulty
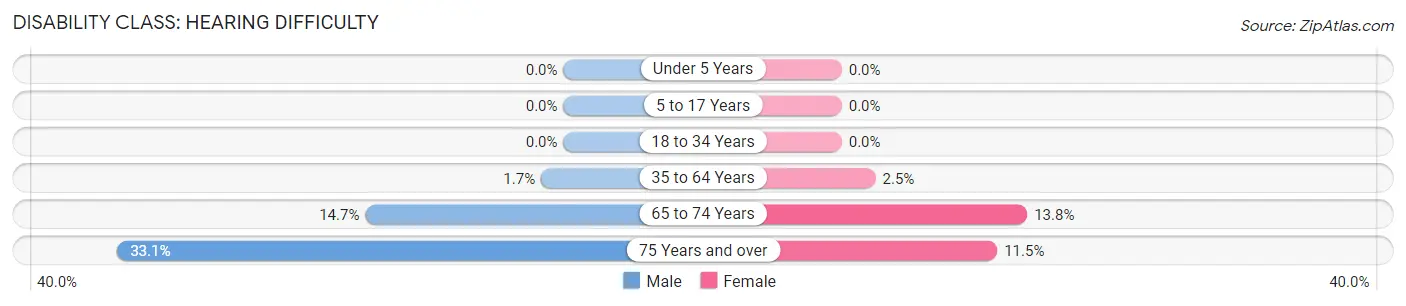
| Age Bracket | Male | Female |
| Under 5 Years | 0 (0.0%) | 0 (0.0%) |
| 5 to 17 Years | 0 (0.0%) | 0 (0.0%) |
| 18 to 34 Years | 0 (0.0%) | 0 (0.0%) |
| 35 to 64 Years | 21 (1.7%) | 30 (2.5%) |
| 65 to 74 Years | 59 (14.7%) | 68 (13.8%) |
| 75 Years and over | 102 (33.1%) | 45 (11.5%) |
Disability Class: Vision Difficulty
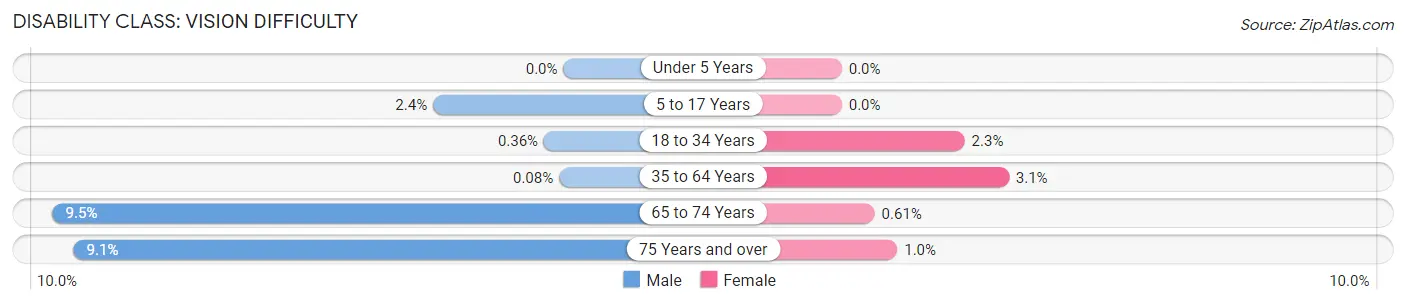
| Age Bracket | Male | Female |
| Under 5 Years | 0 (0.0%) | 0 (0.0%) |
| 5 to 17 Years | 13 (2.4%) | 0 (0.0%) |
| 18 to 34 Years | 2 (0.4%) | 12 (2.3%) |
| 35 to 64 Years | 1 (0.1%) | 37 (3.1%) |
| 65 to 74 Years | 38 (9.5%) | 3 (0.6%) |
| 75 Years and over | 28 (9.1%) | 4 (1.0%) |
Disability Class: Cognitive Difficulty
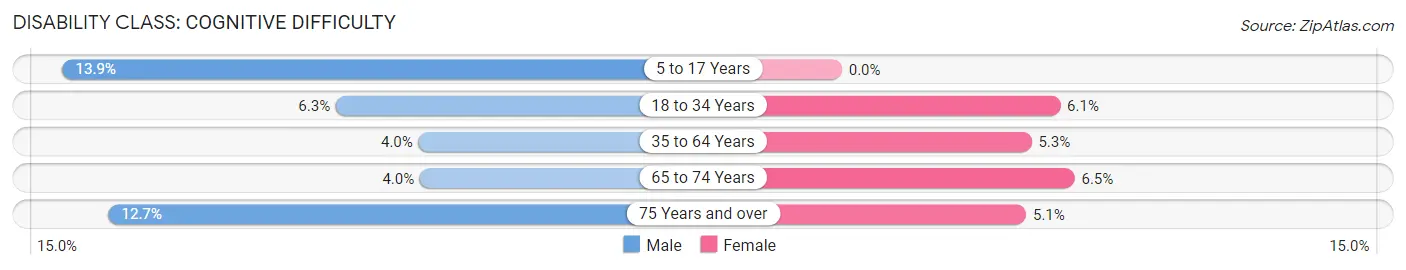
| Age Bracket | Male | Female |
| 5 to 17 Years | 75 (13.9%) | 0 (0.0%) |
| 18 to 34 Years | 35 (6.3%) | 32 (6.1%) |
| 35 to 64 Years | 51 (4.0%) | 63 (5.3%) |
| 65 to 74 Years | 16 (4.0%) | 32 (6.5%) |
| 75 Years and over | 39 (12.7%) | 20 (5.1%) |
Disability Class: Ambulatory Difficulty
| Age Bracket | Male | Female |
| 5 to 17 Years | 29 (5.4%) | 0 (0.0%) |
| 18 to 34 Years | 0 (0.0%) | 0 (0.0%) |
| 35 to 64 Years | 64 (5.1%) | 233 (19.5%) |
| 65 to 74 Years | 84 (20.9%) | 35 (7.1%) |
| 75 Years and over | 167 (54.2%) | 59 (15.1%) |
Disability Class: Self-Care Difficulty
| Age Bracket | Male | Female |
| 5 to 17 Years | 42 (7.8%) | 0 (0.0%) |
| 18 to 34 Years | 16 (2.9%) | 0 (0.0%) |
| 35 to 64 Years | 5 (0.4%) | 35 (2.9%) |
| 65 to 74 Years | 16 (4.0%) | 9 (1.8%) |
| 75 Years and over | 72 (23.4%) | 14 (3.6%) |
Technology Access in Russell County
Computing Device Access in Russell County
| Device Type | # Households | % Households |
| Desktop or Laptop | 2,126 | 71.0% |
| Smartphone | 2,474 | 82.6% |
| Tablet | 1,598 | 53.4% |
| No Computing Device | 201 | 6.7% |
| Total | 2,995 | 100.0% |
Internet Access in Russell County
| Internet Type | # Households | % Households |
| Dial-Up Internet | 47 | 1.6% |
| Broadband Home | 1,968 | 65.7% |
| Cellular Data Only | 546 | 18.2% |
| Satellite Internet | 226 | 7.5% |
| No Internet | 395 | 13.2% |
| Total | 2,995 | 100.0% |
Russell County Summary
Introduction
Russell County, Kansas is located in the north-central part of the state and is part of the Great Plains region. It is bordered by Lincoln County to the north, Ellsworth County to the east, Barton County to the south, and Ness County to the west. The county seat is Russell, and the largest city is Russell. The county was established in 1872 and named after William Alexander Russell, a prominent early settler.
History
The area that is now Russell County was originally inhabited by the Kansa and Pawnee Native American tribes. The first white settlers arrived in the area in the late 1860s, and the county was officially established in 1872. The county was named after William Alexander Russell, a prominent early settseler who had served in the Union Army during the Civil War.
The county was largely agricultural in its early years, with wheat, corn, and other grains being the primary crops. In the late 19th century, the county began to diversify its economy with the introduction of cattle ranching and oil production. The county also became a major center for the production of salt, which was mined from the nearby Saline River.
In the early 20th century, the county experienced a period of rapid growth and development. The population increased from just over 4,000 in 1900 to nearly 10,000 by 1930. This growth was largely due to the introduction of new industries, such as the Russell Manufacturing Company, which produced farm equipment, and the Russell Oil Company, which produced oil and gas.
Geography
Russell County is located in the north-central part of Kansas and is part of the Great Plains region. It is bordered by Lincoln County to the north, Ellsworth County to the east, Barton County to the south, and Ness County to the west. The county covers an area of 890 square miles and has an average elevation of 1,890 feet.
The county is mostly flat, with rolling hills in the east and south. The Saline River runs through the county, and there are several small lakes and ponds scattered throughout the area. The climate is semi-arid, with hot summers and cold winters.
Economy
The economy of Russell County is largely based on agriculture and oil production. The county is home to several large farms, which produce wheat, corn, soybeans, and other grains. Cattle ranching is also an important part of the local economy.
Oil production is also a major industry in the county. The Russell Oil Company is the largest producer of oil and gas in the area, and there are several smaller companies that also operate in the county.
In addition to agriculture and oil production, the county is also home to several manufacturing companies, including the Russell Manufacturing Company, which produces farm equipment, and the Russell Oil Company, which produces oil and gas.
Demographics
As of the 2010 census, the population of Russell County was 6,845. The population is largely white (94.3%), with small percentages of African American (2.2%), Native American (0.7%), Asian (0.4%), and other races (2.4%). The median household income is $45,813, and the median age is 40.7 years.
Conclusion
Russell County, Kansas is located in the north-central part of the state and is part of the Great Plains region. It is bordered by Lincoln County to the north, Ellsworth County to the east, Barton County to the south, and Ness County to the west. The county was established in 1872 and named after William Alexander Russell, a prominent early settler. The economy of Russell County is largely based on agriculture and oil production, and the population is largely white. The county is home to several large farms, which produce wheat, corn, soybeans, and other grains, as well as several manufacturing companies and oil production companies.
Common Questions
What is Per Capita Income in Russell County?
Per Capita income in Russell County is $30,680.
What is the Median Family Income in Russell County?
Median Family Income in Russell County is $66,153.
What is the Median Household income in Russell County?
Median Household Income in Russell County is $49,929.
What is Income or Wage Gap in Russell County?
Income or Wage Gap in Russell County is 33.0%.
Women in Russell County earn 67.0 cents for every dollar earned by a man.
What is Family Income Deficit in Russell County?
Family Income Deficit in Russell County is $9,118.
Families that are below poverty line in Russell County earn $9,118 less on average than the poverty threshold level.
What is Inequality or Gini Index in Russell County?
Inequality or Gini Index in Russell County is 0.47.
What is the Total Population of Russell County?
Total Population of Russell County is 6,702.
What is the Total Male Population of Russell County?
Total Male Population of Russell County is 3,291.
What is the Total Female Population of Russell County?
Total Female Population of Russell County is 3,411.
What is the Ratio of Males per 100 Females in Russell County?
There are 96.48 Males per 100 Females in Russell County.
What is the Ratio of Females per 100 Males in Russell County?
There are 103.65 Females per 100 Males in Russell County.
What is the Median Population Age in Russell County?
Median Population Age in Russell County is 45.3 Years.
What is the Average Family Size in Russell County
Average Family Size in Russell County is 2.9 People.
What is the Average Household Size in Russell County
Average Household Size in Russell County is 2.2 People.
How Large is the Labor Force in Russell County?
There are 3,343 People in the Labor Forcein in Russell County.
What is the Percentage of People in the Labor Force in Russell County?
61.1% of People are in the Labor Force in Russell County.
What is the Unemployment Rate in Russell County?
Unemployment Rate in Russell County is 3.9%.