Rice County, KS Map & Demographics
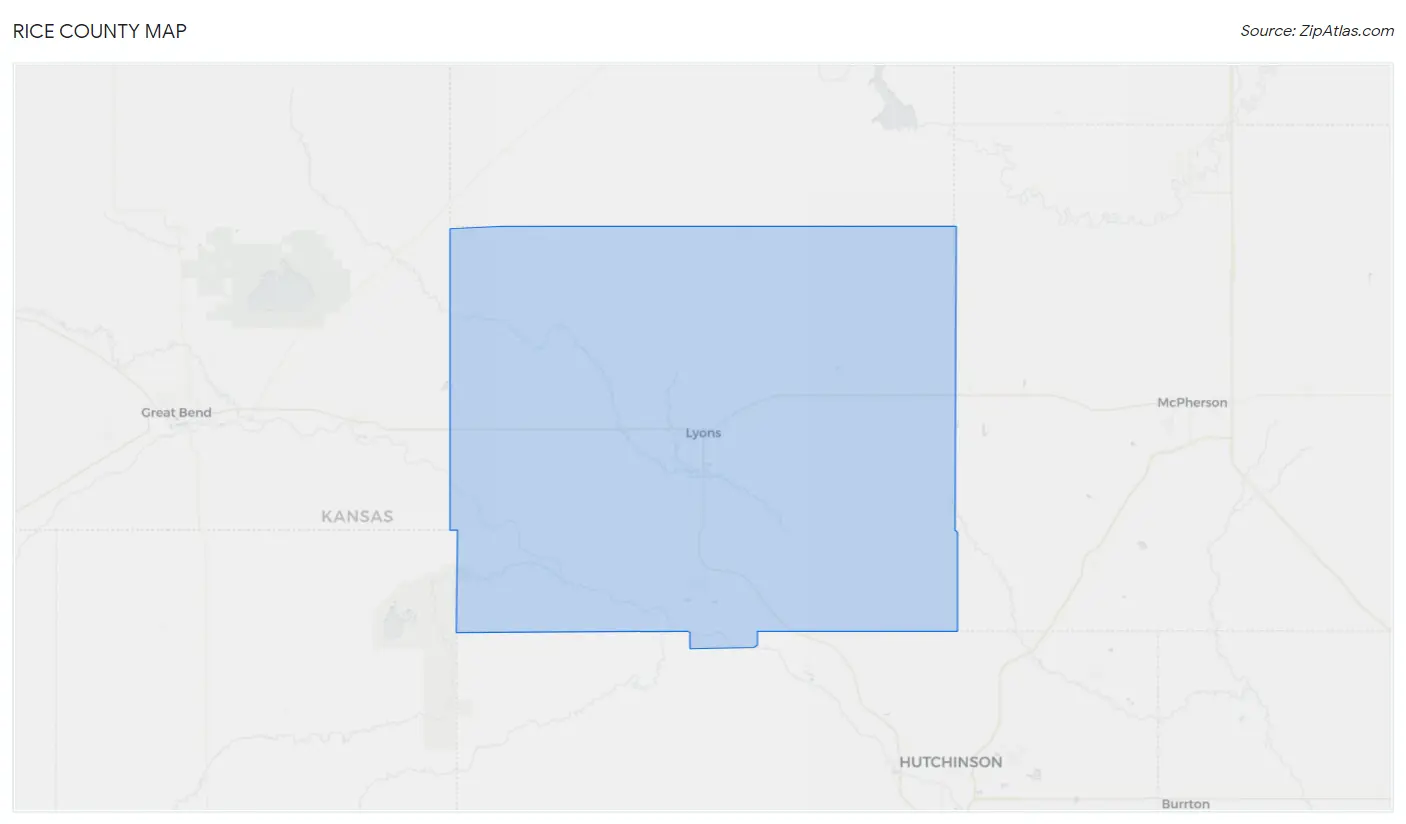
Rice County Map
Rice County Overview
$32,074
PER CAPITA INCOME
$71,782
AVG FAMILY INCOME
$58,523
AVG HOUSEHOLD INCOME
37.8%
WAGE / INCOME GAP [ % ]
62.2¢/ $1
WAGE / INCOME GAP [ $ ]
$9,435
FAMILY INCOME DEFICIT
0.42
INEQUALITY / GINI INDEX
9,441
TOTAL POPULATION
4,857
MALE POPULATION
4,584
FEMALE POPULATION
105.96
MALES / 100 FEMALES
94.38
FEMALES / 100 MALES
39.0
MEDIAN AGE
3.0
AVG FAMILY SIZE
2.3
AVG HOUSEHOLD SIZE
4,550
LABOR FORCE [ PEOPLE ]
60.5%
PERCENT IN LABOR FORCE
3.6%
UNEMPLOYMENT RATE
Rice County Area Codes
Income in Rice County
Income Overview in Rice County
Per Capita Income in Rice County is $32,074, while median incomes of families and households are $71,782 and $58,523 respectively.
| Characteristic | Number | Measure |
| Per Capita Income | 9,441 | $32,074 |
| Median Family Income | 2,441 | $71,782 |
| Mean Family Income | 2,441 | $92,536 |
| Median Household Income | 3,763 | $58,523 |
| Mean Household Income | 3,763 | $74,985 |
| Income Deficit | 2,441 | $9,435 |
| Wage / Income Gap (%) | 9,441 | 37.82% |
| Wage / Income Gap ($) | 9,441 | 62.18¢ per $1 |
| Gini / Inequality Index | 9,441 | 0.42 |
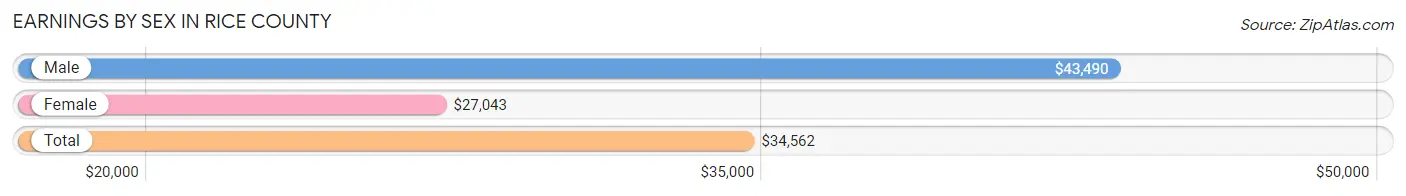
Earnings by Sex in Rice County
Average Earnings in Rice County are $34,562, $43,490 for men and $27,043 for women, a difference of 37.8%.
| Sex | Number | Average Earnings |
| Male | 2,823 (55.4%) | $43,490 |
| Female | 2,271 (44.6%) | $27,043 |
| Total | 5,094 (100.0%) | $34,562 |
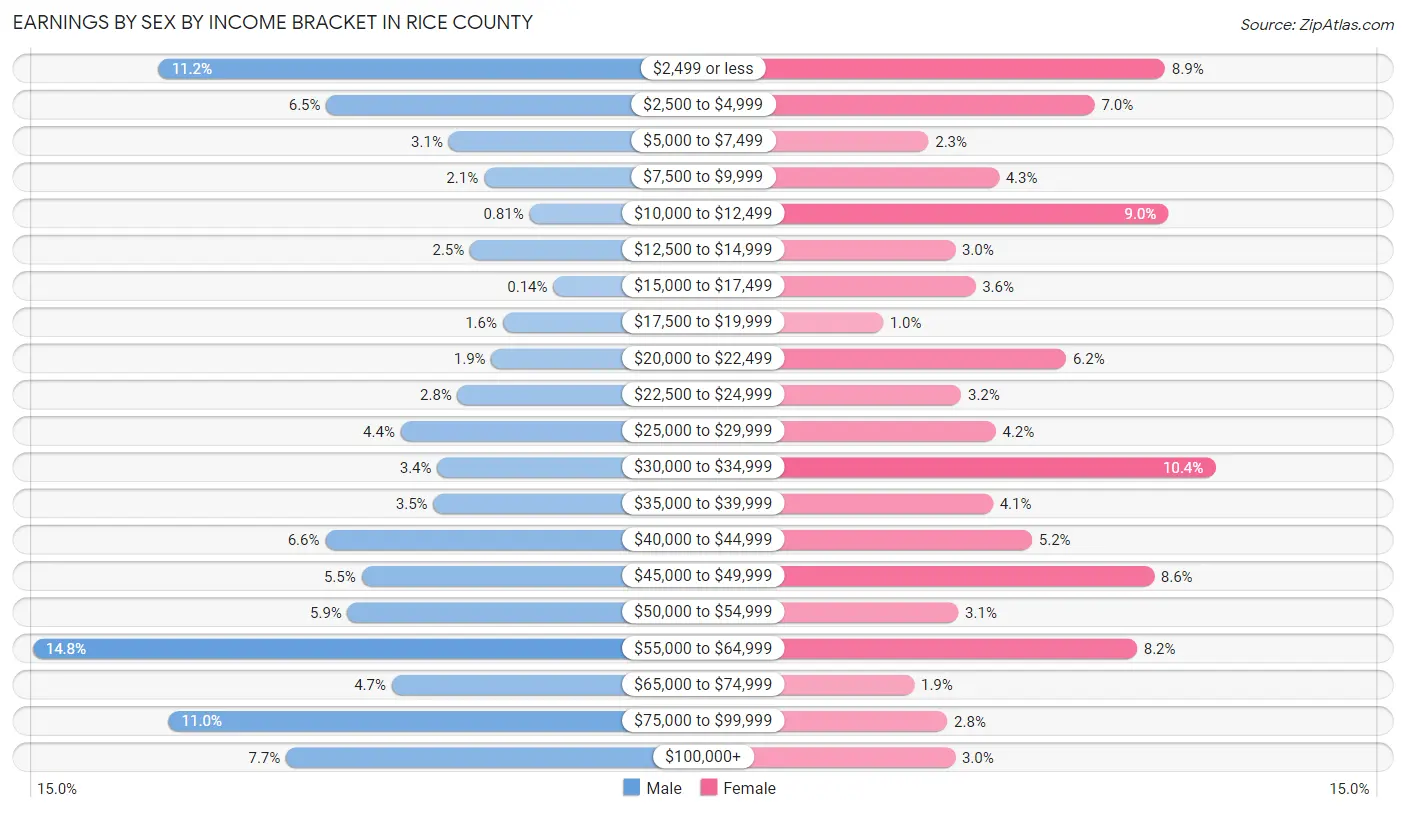
Earnings by Sex by Income Bracket in Rice County
The most common earnings brackets in Rice County are $55,000 to $64,999 for men (417 | 14.8%) and $30,000 to $34,999 for women (235 | 10.3%).
| Income | Male | Female |
| $2,499 or less | 317 (11.2%) | 203 (8.9%) |
| $2,500 to $4,999 | 184 (6.5%) | 158 (7.0%) |
| $5,000 to $7,499 | 87 (3.1%) | 52 (2.3%) |
| $7,500 to $9,999 | 59 (2.1%) | 97 (4.3%) |
| $10,000 to $12,499 | 23 (0.8%) | 205 (9.0%) |
| $12,500 to $14,999 | 70 (2.5%) | 69 (3.0%) |
| $15,000 to $17,499 | 4 (0.1%) | 82 (3.6%) |
| $17,500 to $19,999 | 44 (1.6%) | 23 (1.0%) |
| $20,000 to $22,499 | 53 (1.9%) | 140 (6.2%) |
| $22,500 to $24,999 | 80 (2.8%) | 73 (3.2%) |
| $25,000 to $29,999 | 125 (4.4%) | 95 (4.2%) |
| $30,000 to $34,999 | 96 (3.4%) | 235 (10.3%) |
| $35,000 to $39,999 | 99 (3.5%) | 93 (4.1%) |
| $40,000 to $44,999 | 185 (6.6%) | 118 (5.2%) |
| $45,000 to $49,999 | 156 (5.5%) | 196 (8.6%) |
| $50,000 to $54,999 | 167 (5.9%) | 71 (3.1%) |
| $55,000 to $64,999 | 417 (14.8%) | 185 (8.2%) |
| $65,000 to $74,999 | 132 (4.7%) | 43 (1.9%) |
| $75,000 to $99,999 | 309 (11.0%) | 64 (2.8%) |
| $100,000+ | 216 (7.6%) | 69 (3.0%) |
| Total | 2,823 (100.0%) | 2,271 (100.0%) |
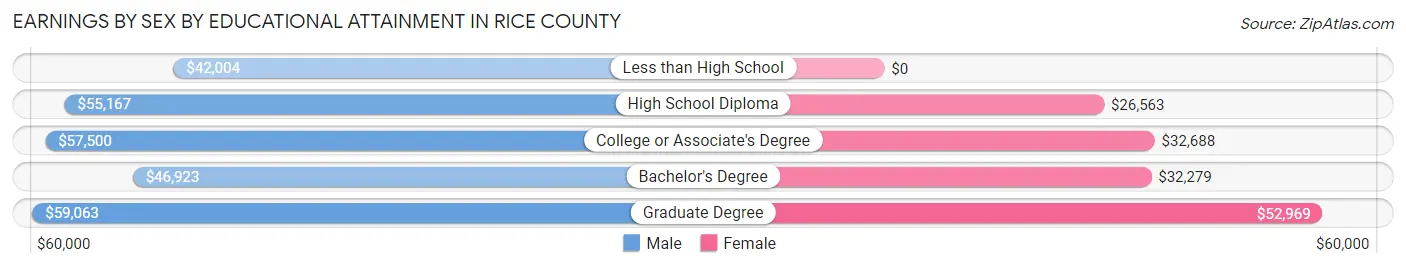
Earnings by Sex by Educational Attainment in Rice County
Average earnings in Rice County are $54,306 for men and $32,530 for women, a difference of 40.1%. Men with an educational attainment of graduate degree enjoy the highest average annual earnings of $59,063, while those with less than high school education earn the least with $42,004. Women with an educational attainment of graduate degree earn the most with the average annual earnings of $52,969, while those with high school diploma education have the smallest earnings of $26,563.
| Educational Attainment | Male Income | Female Income |
| Less than High School | $42,004 | $0 |
| High School Diploma | $55,167 | $26,563 |
| College or Associate's Degree | $57,500 | $32,688 |
| Bachelor's Degree | $46,923 | $32,279 |
| Graduate Degree | $59,063 | $52,969 |
| Total | $54,306 | $32,530 |
Family Income in Rice County
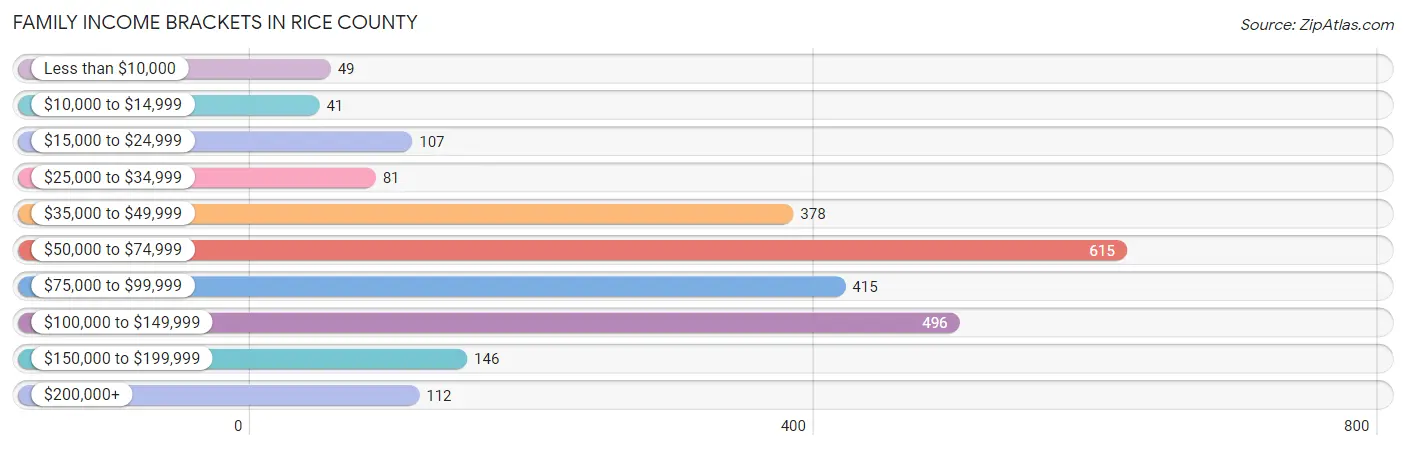
Family Income Brackets in Rice County
According to the Rice County family income data, there are 615 families falling into the $50,000 to $74,999 income range, which is the most common income bracket and makes up 25.2% of all families. Conversely, the $10,000 to $14,999 income bracket is the least frequent group with only 41 families (1.7%) belonging to this category.
| Income Bracket | # Families | % Families |
| Less than $10,000 | 49 | 2.0% |
| $10,000 to $14,999 | 41 | 1.7% |
| $15,000 to $24,999 | 107 | 4.4% |
| $25,000 to $34,999 | 81 | 3.3% |
| $35,000 to $49,999 | 378 | 15.5% |
| $50,000 to $74,999 | 615 | 25.2% |
| $75,000 to $99,999 | 415 | 17.0% |
| $100,000 to $149,999 | 496 | 20.3% |
| $150,000 to $199,999 | 146 | 6.0% |
| $200,000+ | 112 | 4.6% |
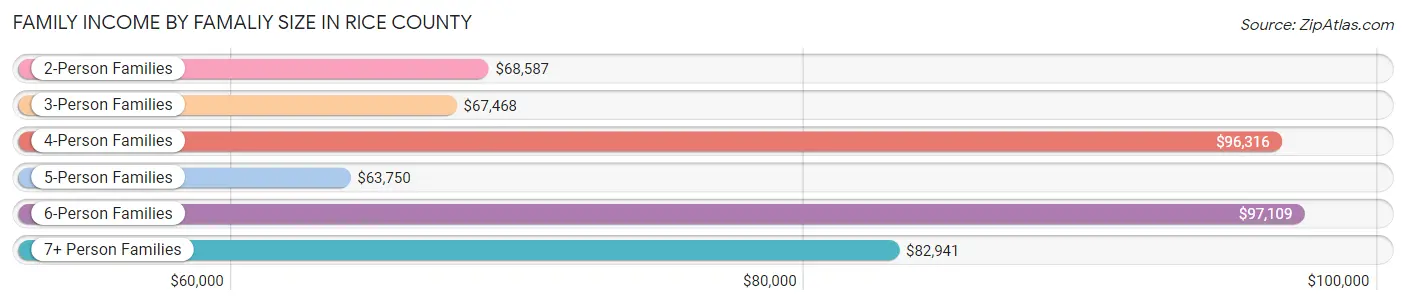
Family Income by Famaliy Size in Rice County
6-person families (73 | 3.0%) account for the highest median family income in Rice County with $97,109 per family, while 2-person families (1,230 | 50.4%) have the highest median income of $34,294 per family member.
| Income Bracket | # Families | Median Income |
| 2-Person Families | 1,230 (50.4%) | $68,587 |
| 3-Person Families | 554 (22.7%) | $67,468 |
| 4-Person Families | 348 (14.3%) | $96,316 |
| 5-Person Families | 208 (8.5%) | $63,750 |
| 6-Person Families | 73 (3.0%) | $97,109 |
| 7+ Person Families | 28 (1.1%) | $82,941 |
| Total | 2,441 (100.0%) | $71,782 |
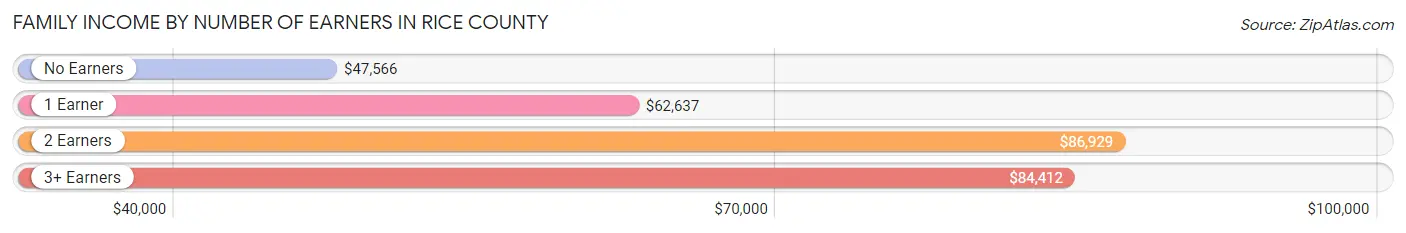
Family Income by Number of Earners in Rice County
The median family income in Rice County is $71,782, with families comprising 2 earners (1,129) having the highest median family income of $86,929, while families with no earners (339) have the lowest median family income of $47,566, accounting for 46.3% and 13.9% of families, respectively.
| Number of Earners | # Families | Median Income |
| No Earners | 339 (13.9%) | $47,566 |
| 1 Earner | 711 (29.1%) | $62,637 |
| 2 Earners | 1,129 (46.3%) | $86,929 |
| 3+ Earners | 262 (10.7%) | $84,412 |
| Total | 2,441 (100.0%) | $71,782 |
Household Income in Rice County
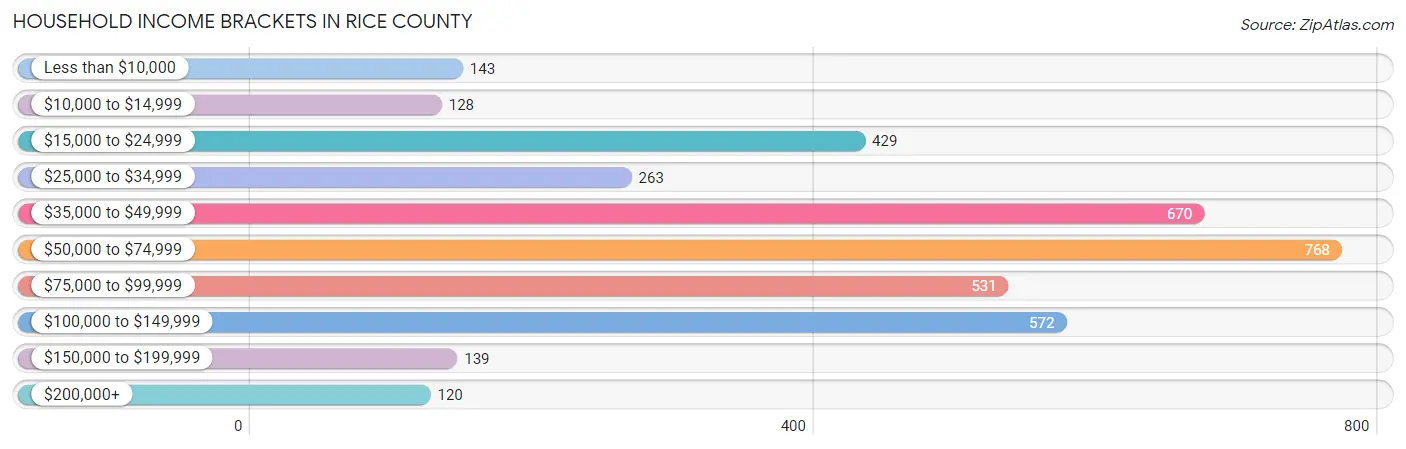
Household Income Brackets in Rice County
With 768 households falling in the category, the $50,000 to $74,999 income range is the most frequent in Rice County, accounting for 20.4% of all households. In contrast, only 120 households (3.2%) fall into the $200,000+ income bracket, making it the least populous group.
| Income Bracket | # Households | % Households |
| Less than $10,000 | 143 | 3.8% |
| $10,000 to $14,999 | 128 | 3.4% |
| $15,000 to $24,999 | 429 | 11.4% |
| $25,000 to $34,999 | 263 | 7.0% |
| $35,000 to $49,999 | 670 | 17.8% |
| $50,000 to $74,999 | 768 | 20.4% |
| $75,000 to $99,999 | 531 | 14.1% |
| $100,000 to $149,999 | 572 | 15.2% |
| $150,000 to $199,999 | 139 | 3.7% |
| $200,000+ | 120 | 3.2% |
Household Income by Householder Age in Rice County
The median household income in Rice County is $58,523, with the highest median household income of $67,500 found in the 25 to 44 years age bracket for the primary householder. A total of 1,124 households (29.9%) fall into this category. Meanwhile, the 15 to 24 years age bracket for the primary householder has the lowest median household income of $33,250, with 181 households (4.8%) in this group.
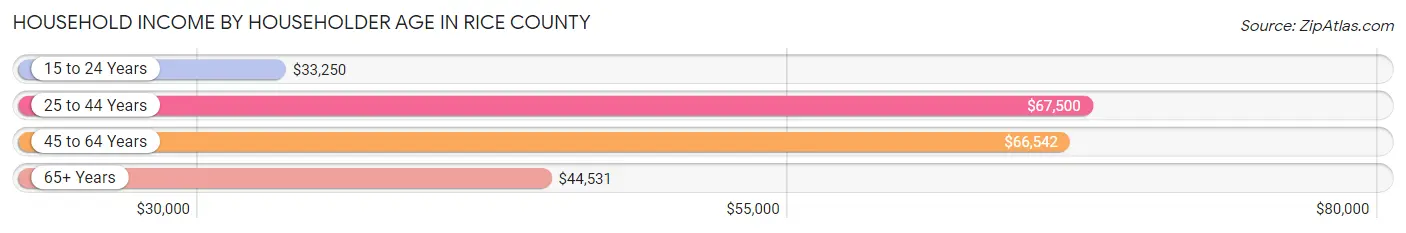
| Income Bracket | # Households | Median Income |
| 15 to 24 Years | 181 (4.8%) | $33,250 |
| 25 to 44 Years | 1,124 (29.9%) | $67,500 |
| 45 to 64 Years | 1,345 (35.7%) | $66,542 |
| 65+ Years | 1,113 (29.6%) | $44,531 |
| Total | 3,763 (100.0%) | $58,523 |
Poverty in Rice County
Income Below Poverty by Sex and Age in Rice County
With 9.8% poverty level for males and 9.7% for females among the residents of Rice County, 6 to 11 year old males and under 5 year old females are the most vulnerable to poverty, with 79 males (18.2%) and 59 females (25.0%) in their respective age groups living below the poverty level.
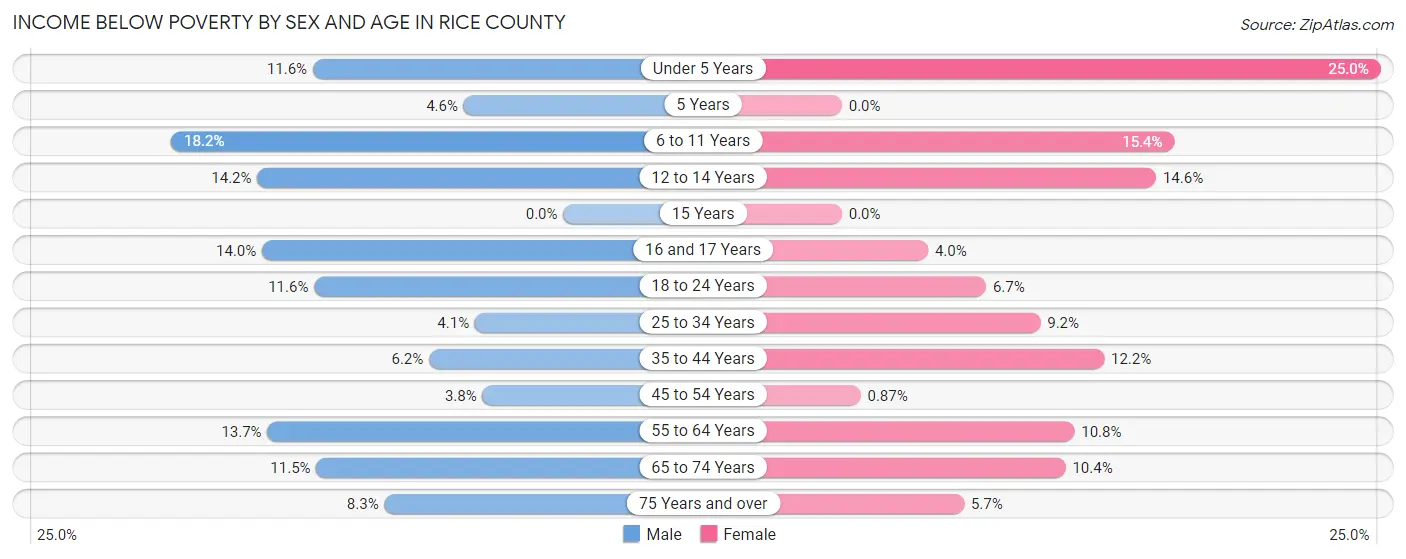
| Age Bracket | Male | Female |
| Under 5 Years | 28 (11.6%) | 59 (25.0%) |
| 5 Years | 3 (4.6%) | 0 (0.0%) |
| 6 to 11 Years | 79 (18.2%) | 56 (15.4%) |
| 12 to 14 Years | 23 (14.2%) | 28 (14.6%) |
| 15 Years | 0 (0.0%) | 0 (0.0%) |
| 16 and 17 Years | 26 (14.0%) | 3 (4.0%) |
| 18 to 24 Years | 40 (11.6%) | 19 (6.7%) |
| 25 to 34 Years | 22 (4.1%) | 44 (9.2%) |
| 35 to 44 Years | 34 (6.2%) | 56 (12.2%) |
| 45 to 54 Years | 19 (3.7%) | 4 (0.9%) |
| 55 to 64 Years | 85 (13.7%) | 68 (10.8%) |
| 65 to 74 Years | 55 (11.5%) | 55 (10.4%) |
| 75 Years and over | 24 (8.3%) | 24 (5.7%) |
| Total | 438 (9.8%) | 416 (9.7%) |
Income Above Poverty by Sex and Age in Rice County
According to the poverty statistics in Rice County, males aged 15 years and females aged 5 years are the age groups that are most secure financially, with 100.0% of males and 100.0% of females in these age groups living above the poverty line.
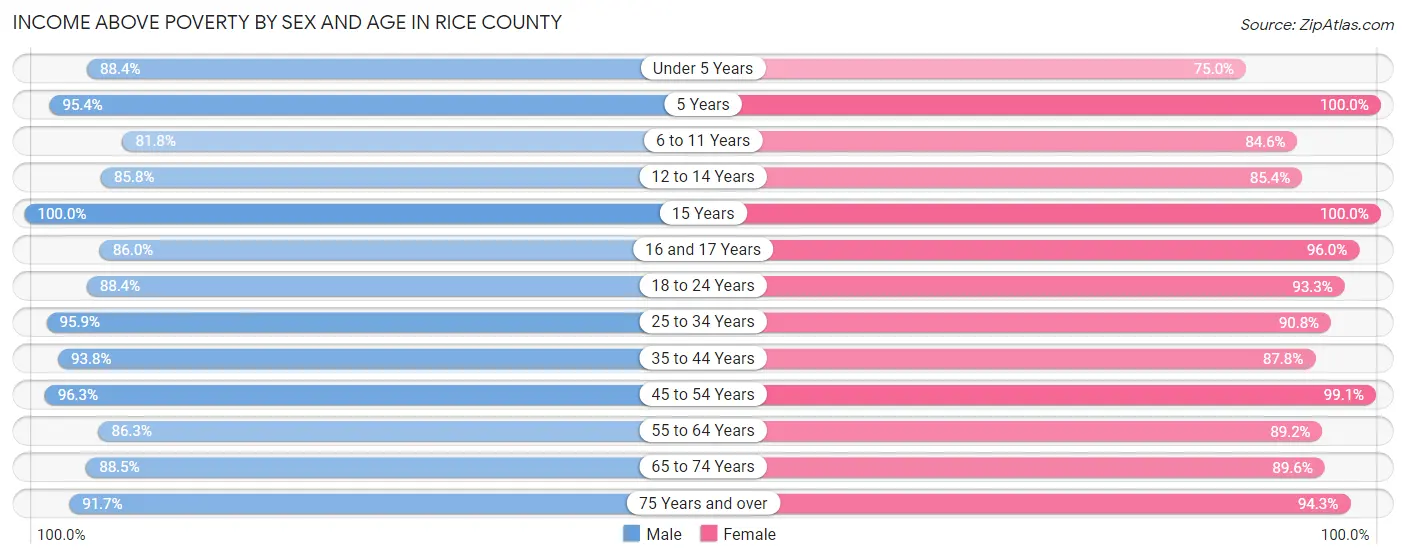
| Age Bracket | Male | Female |
| Under 5 Years | 213 (88.4%) | 177 (75.0%) |
| 5 Years | 62 (95.4%) | 60 (100.0%) |
| 6 to 11 Years | 355 (81.8%) | 307 (84.6%) |
| 12 to 14 Years | 139 (85.8%) | 164 (85.4%) |
| 15 Years | 56 (100.0%) | 81 (100.0%) |
| 16 and 17 Years | 160 (86.0%) | 72 (96.0%) |
| 18 to 24 Years | 306 (88.4%) | 265 (93.3%) |
| 25 to 34 Years | 514 (95.9%) | 434 (90.8%) |
| 35 to 44 Years | 512 (93.8%) | 404 (87.8%) |
| 45 to 54 Years | 487 (96.3%) | 456 (99.1%) |
| 55 to 64 Years | 534 (86.3%) | 562 (89.2%) |
| 65 to 74 Years | 425 (88.5%) | 475 (89.6%) |
| 75 Years and over | 265 (91.7%) | 399 (94.3%) |
| Total | 4,028 (90.2%) | 3,856 (90.3%) |
Income Below Poverty Among Married-Couple Families in Rice County
The poverty statistics for married-couple families in Rice County show that 2.6% or 54 of the total 2,042 families live below the poverty line. Families with no children have the highest poverty rate of 3.4%, comprising of 39 families. On the other hand, families with 3 or 4 children have the lowest poverty rate of 0.0%, which includes 0 families.
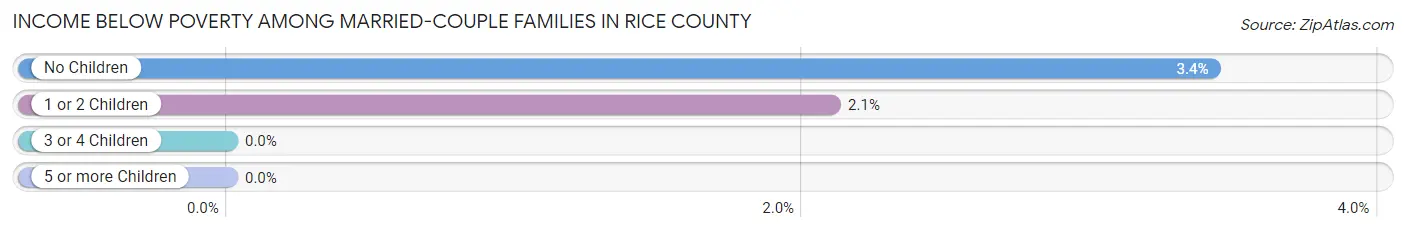
| Children | Above Poverty | Below Poverty |
| No Children | 1,103 (96.6%) | 39 (3.4%) |
| 1 or 2 Children | 699 (97.9%) | 15 (2.1%) |
| 3 or 4 Children | 186 (100.0%) | 0 (0.0%) |
| 5 or more Children | 0 (0.0%) | 0 (0.0%) |
| Total | 1,988 (97.4%) | 54 (2.6%) |
Income Below Poverty Among Single-Parent Households in Rice County
According to the poverty data in Rice County, 21.3% or 20 single-father households and 28.5% or 87 single-mother households are living below the poverty line. Among single-father households, those with 5 or more children have the highest poverty rate, with 8 households (53.3%) experiencing poverty. Likewise, among single-mother households, those with 3 or 4 children have the highest poverty rate, with 33 households (68.8%) falling below the poverty line.
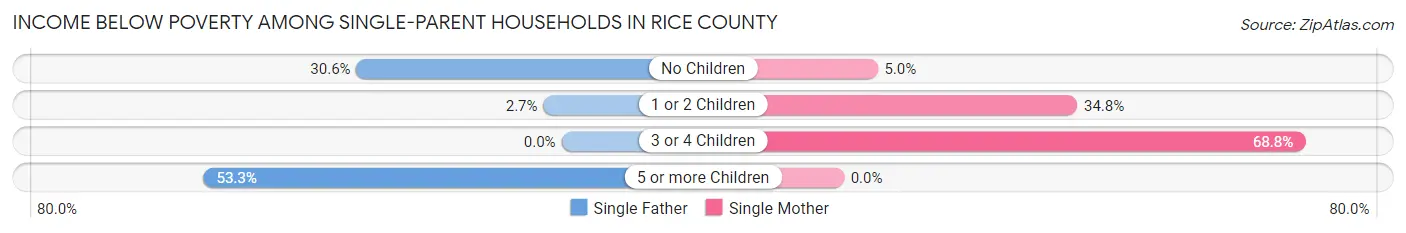
| Children | Single Father | Single Mother |
| No Children | 11 (30.6%) | 6 (5.0%) |
| 1 or 2 Children | 1 (2.7%) | 48 (34.8%) |
| 3 or 4 Children | 0 (0.0%) | 33 (68.8%) |
| 5 or more Children | 8 (53.3%) | 0 (0.0%) |
| Total | 20 (21.3%) | 87 (28.5%) |
Income Below Poverty Among Married-Couple vs Single-Parent Households in Rice County
The poverty data for Rice County shows that 54 of the married-couple family households (2.6%) and 107 of the single-parent households (26.8%) are living below the poverty level. Within the married-couple family households, those with no children have the highest poverty rate, with 39 households (3.4%) falling below the poverty line. Among the single-parent households, those with 3 or 4 children have the highest poverty rate, with 33 household (61.1%) living below poverty.
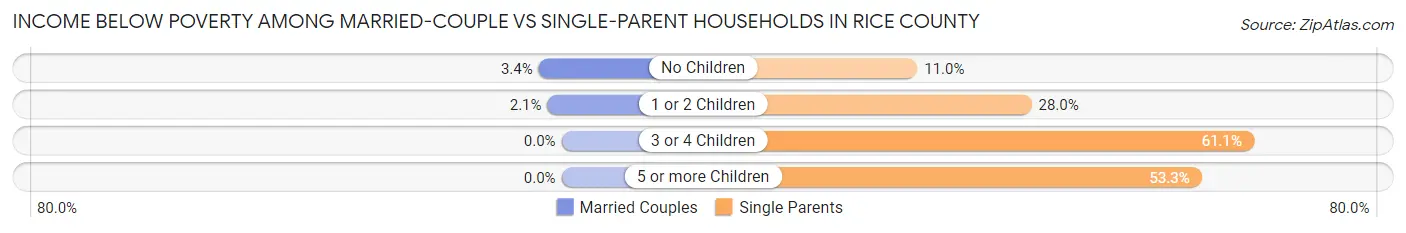
| Children | Married-Couple Families | Single-Parent Households |
| No Children | 39 (3.4%) | 17 (11.0%) |
| 1 or 2 Children | 15 (2.1%) | 49 (28.0%) |
| 3 or 4 Children | 0 (0.0%) | 33 (61.1%) |
| 5 or more Children | 0 (0.0%) | 8 (53.3%) |
| Total | 54 (2.6%) | 107 (26.8%) |
Race in Rice County
The most populous races in Rice County are White / Caucasian (8,066 | 85.4%), Hispanic or Latino (1,111 | 11.8%), and Two or more Races (646 | 6.8%).
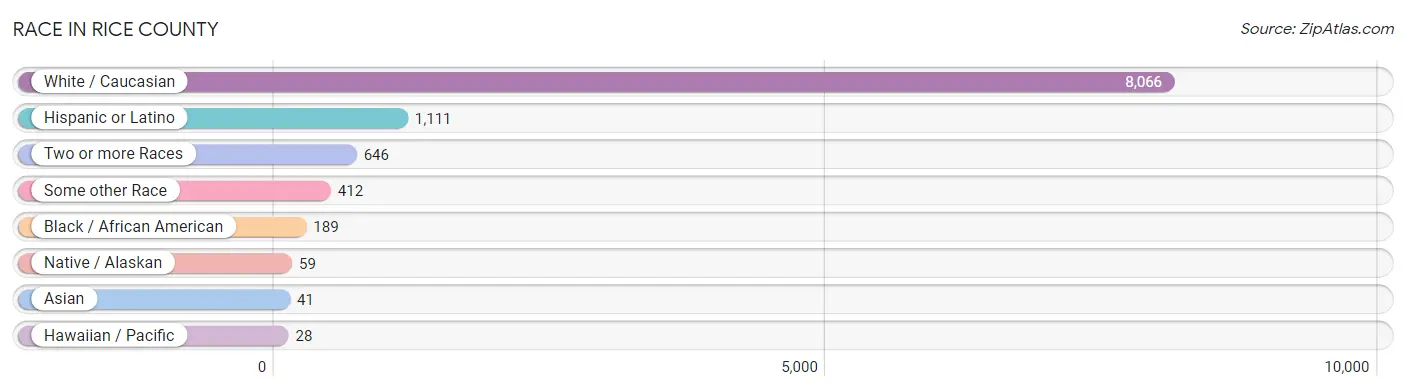
| Race | # Population | % Population |
| Asian | 41 | 0.4% |
| Black / African American | 189 | 2.0% |
| Hawaiian / Pacific | 28 | 0.3% |
| Hispanic or Latino | 1,111 | 11.8% |
| Native / Alaskan | 59 | 0.6% |
| White / Caucasian | 8,066 | 85.4% |
| Two or more Races | 646 | 6.8% |
| Some other Race | 412 | 4.4% |
| Total | 9,441 | 100.0% |
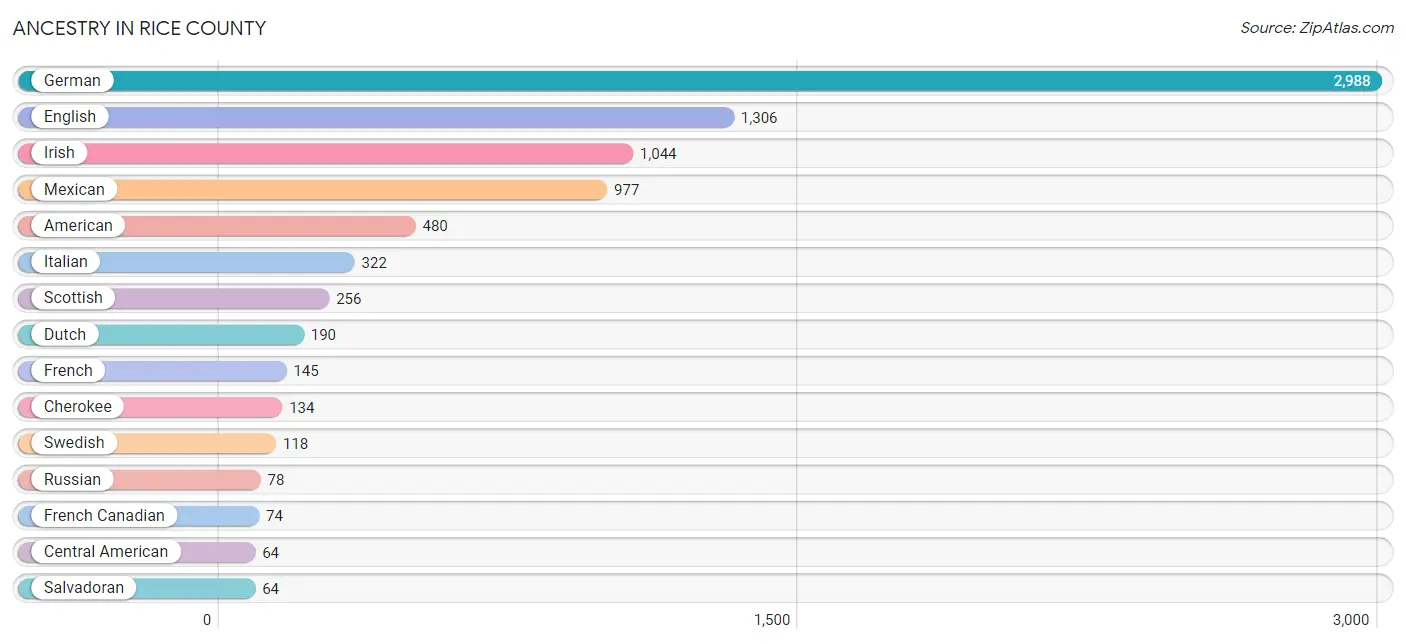
Ancestry in Rice County
The most populous ancestries reported in Rice County are German (2,988 | 31.7%), English (1,306 | 13.8%), Irish (1,044 | 11.1%), Mexican (977 | 10.3%), and American (480 | 5.1%), together accounting for 72.0% of all Rice County residents.
| Ancestry | # Population | % Population |
| African | 21 | 0.2% |
| American | 480 | 5.1% |
| Austrian | 35 | 0.4% |
| Bangladeshi | 11 | 0.1% |
| Belgian | 11 | 0.1% |
| Bhutanese | 11 | 0.1% |
| Blackfeet | 21 | 0.2% |
| Brazilian | 2 | 0.0% |
| British | 31 | 0.3% |
| Canadian | 15 | 0.2% |
| Central American | 64 | 0.7% |
| Cherokee | 134 | 1.4% |
| Choctaw | 3 | 0.0% |
| Colombian | 9 | 0.1% |
| Comanche | 5 | 0.1% |
| Creek | 4 | 0.0% |
| Cuban | 21 | 0.2% |
| Czech | 30 | 0.3% |
| Czechoslovakian | 14 | 0.2% |
| Danish | 32 | 0.3% |
| Dutch | 190 | 2.0% |
| Eastern European | 3 | 0.0% |
| Ecuadorian | 10 | 0.1% |
| English | 1,306 | 13.8% |
| European | 30 | 0.3% |
| Finnish | 5 | 0.1% |
| French | 145 | 1.5% |
| French Canadian | 74 | 0.8% |
| German | 2,988 | 31.7% |
| Greek | 4 | 0.0% |
| Guamanian / Chamorro | 21 | 0.2% |
| Haitian | 7 | 0.1% |
| Hungarian | 8 | 0.1% |
| Indian (Asian) | 3 | 0.0% |
| Irish | 1,044 | 11.1% |
| Iroquois | 11 | 0.1% |
| Italian | 322 | 3.4% |
| Kenyan | 6 | 0.1% |
| Korean | 38 | 0.4% |
| Mexican | 977 | 10.3% |
| Native Hawaiian | 3 | 0.0% |
| Northern European | 11 | 0.1% |
| Norwegian | 30 | 0.3% |
| Pakistani | 46 | 0.5% |
| Pennsylvania German | 10 | 0.1% |
| Polish | 50 | 0.5% |
| Puerto Rican | 16 | 0.2% |
| Romanian | 7 | 0.1% |
| Russian | 78 | 0.8% |
| Salvadoran | 64 | 0.7% |
| Samoan | 7 | 0.1% |
| Scandinavian | 27 | 0.3% |
| Scotch-Irish | 59 | 0.6% |
| Scottish | 256 | 2.7% |
| Slovak | 4 | 0.0% |
| South African | 10 | 0.1% |
| South American | 19 | 0.2% |
| Spaniard | 2 | 0.0% |
| Spanish American | 3 | 0.0% |
| Sri Lankan | 12 | 0.1% |
| Subsaharan African | 37 | 0.4% |
| Swedish | 118 | 1.3% |
| Swiss | 36 | 0.4% |
| Welsh | 38 | 0.4% | View All 64 Rows |
Immigrants in Rice County
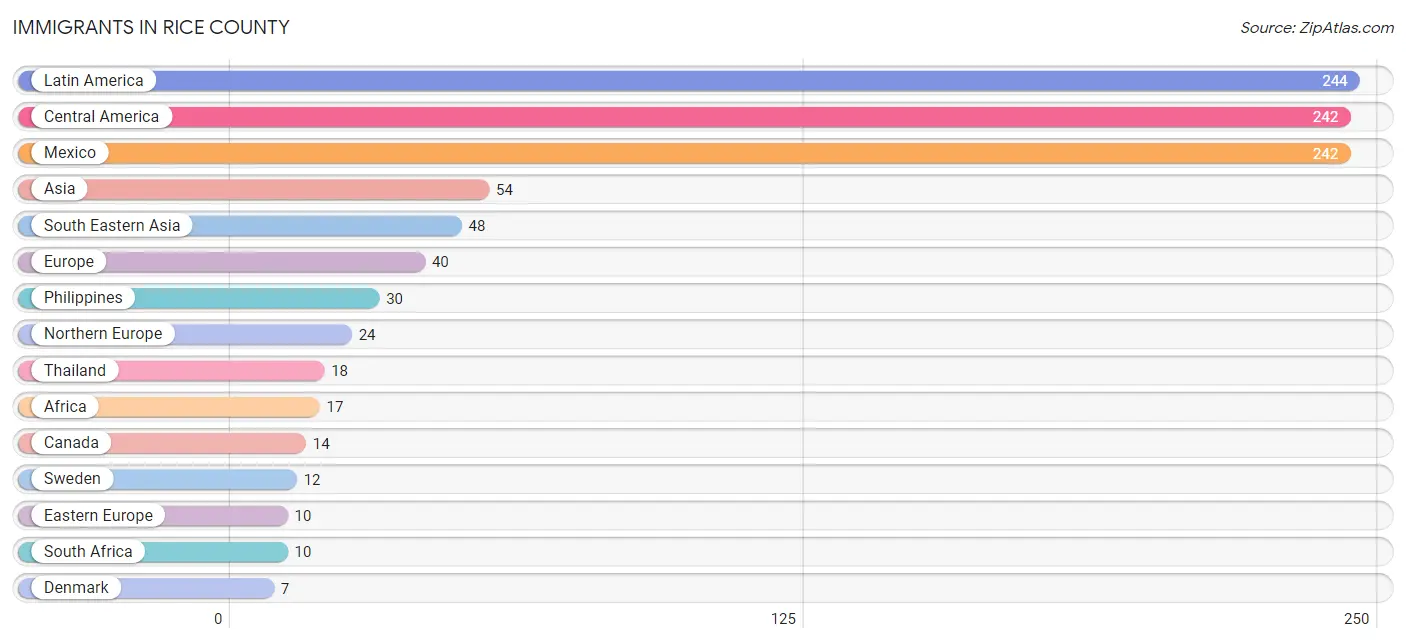
The most numerous immigrant groups reported in Rice County came from Latin America (244 | 2.6%), Central America (242 | 2.6%), Mexico (242 | 2.6%), Asia (54 | 0.6%), and South Eastern Asia (48 | 0.5%), together accounting for 8.8% of all Rice County residents.
| Immigration Origin | # Population | % Population |
| Africa | 17 | 0.2% |
| Asia | 54 | 0.6% |
| Belarus | 3 | 0.0% |
| Brazil | 2 | 0.0% |
| Canada | 14 | 0.2% |
| Central America | 242 | 2.6% |
| Denmark | 7 | 0.1% |
| Eastern Africa | 4 | 0.0% |
| Eastern Asia | 6 | 0.1% |
| Eastern Europe | 10 | 0.1% |
| Europe | 40 | 0.4% |
| Italy | 4 | 0.0% |
| Japan | 6 | 0.1% |
| Kenya | 4 | 0.0% |
| Latin America | 244 | 2.6% |
| Mexico | 242 | 2.6% |
| Northern Europe | 24 | 0.3% |
| Philippines | 30 | 0.3% |
| Romania | 7 | 0.1% |
| South Africa | 10 | 0.1% |
| South America | 2 | 0.0% |
| South Eastern Asia | 48 | 0.5% |
| Southern Europe | 6 | 0.1% |
| Spain | 2 | 0.0% |
| Sweden | 12 | 0.1% |
| Thailand | 18 | 0.2% | View All 26 Rows |
Sex and Age in Rice County
Sex and Age in Rice County
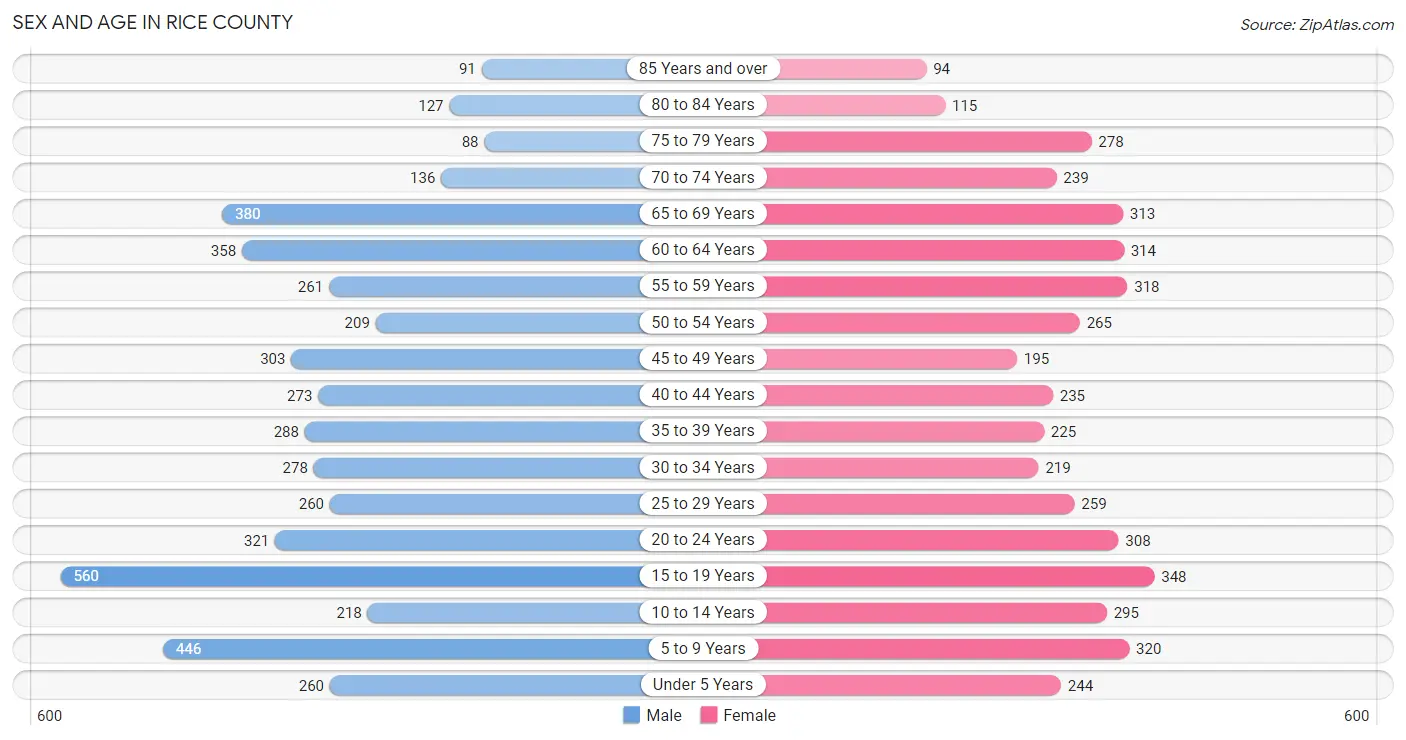
The most populous age groups in Rice County are 15 to 19 Years (560 | 11.5%) for men and 15 to 19 Years (348 | 7.6%) for women.
| Age Bracket | Male | Female |
| Under 5 Years | 260 (5.3%) | 244 (5.3%) |
| 5 to 9 Years | 446 (9.2%) | 320 (7.0%) |
| 10 to 14 Years | 218 (4.5%) | 295 (6.4%) |
| 15 to 19 Years | 560 (11.5%) | 348 (7.6%) |
| 20 to 24 Years | 321 (6.6%) | 308 (6.7%) |
| 25 to 29 Years | 260 (5.3%) | 259 (5.7%) |
| 30 to 34 Years | 278 (5.7%) | 219 (4.8%) |
| 35 to 39 Years | 288 (5.9%) | 225 (4.9%) |
| 40 to 44 Years | 273 (5.6%) | 235 (5.1%) |
| 45 to 49 Years | 303 (6.2%) | 195 (4.3%) |
| 50 to 54 Years | 209 (4.3%) | 265 (5.8%) |
| 55 to 59 Years | 261 (5.4%) | 318 (6.9%) |
| 60 to 64 Years | 358 (7.4%) | 314 (6.9%) |
| 65 to 69 Years | 380 (7.8%) | 313 (6.8%) |
| 70 to 74 Years | 136 (2.8%) | 239 (5.2%) |
| 75 to 79 Years | 88 (1.8%) | 278 (6.1%) |
| 80 to 84 Years | 127 (2.6%) | 115 (2.5%) |
| 85 Years and over | 91 (1.9%) | 94 (2.1%) |
| Total | 4,857 (100.0%) | 4,584 (100.0%) |
Families and Households in Rice County
Median Family Size in Rice County
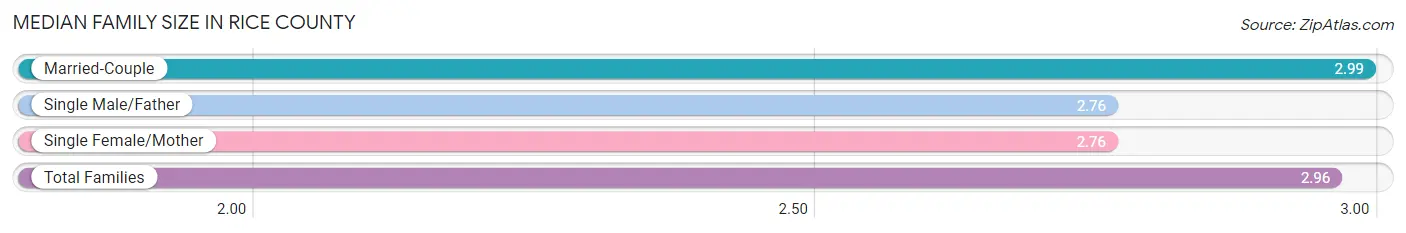
The median family size in Rice County is 2.96 persons per family, with married-couple families (2,042 | 83.7%) accounting for the largest median family size of 2.99 persons per family. On the other hand, single male/father families (94 | 3.8%) represent the smallest median family size with 2.76 persons per family.
| Family Type | # Families | Family Size |
| Married-Couple | 2,042 (83.7%) | 2.99 |
| Single Male/Father | 94 (3.8%) | 2.76 |
| Single Female/Mother | 305 (12.5%) | 2.76 |
| Total Families | 2,441 (100.0%) | 2.96 |
Median Household Size in Rice County
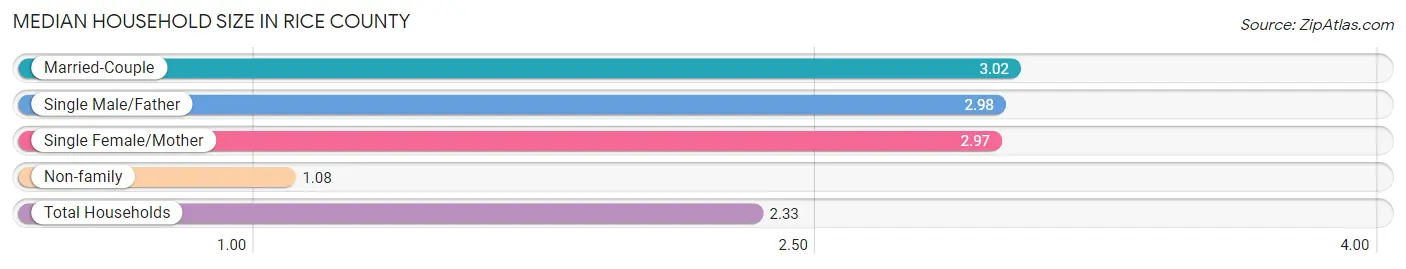
The median household size in Rice County is 2.33 persons per household, with married-couple households (2,042 | 54.3%) accounting for the largest median household size of 3.02 persons per household. non-family households (1,322 | 35.1%) represent the smallest median household size with 1.08 persons per household.
| Household Type | # Households | Household Size |
| Married-Couple | 2,042 (54.3%) | 3.02 |
| Single Male/Father | 94 (2.5%) | 2.98 |
| Single Female/Mother | 305 (8.1%) | 2.97 |
| Non-family | 1,322 (35.1%) | 1.08 |
| Total Households | 3,763 (100.0%) | 2.33 |
Household Size by Marriage Status in Rice County
Out of a total of 3,763 households in Rice County, 2,441 (64.9%) are family households, while 1,322 (35.1%) are nonfamily households. The most numerous type of family households are 2-person households, comprising 1,193, and the most common type of nonfamily households are 1-person households, comprising 1,212.
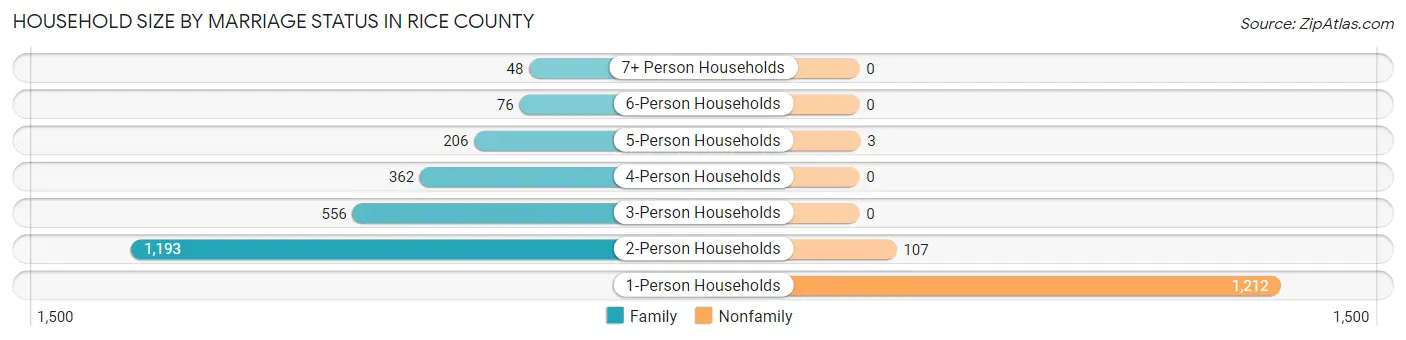
| Household Size | Family Households | Nonfamily Households |
| 1-Person Households | - | 1,212 (32.2%) |
| 2-Person Households | 1,193 (31.7%) | 107 (2.8%) |
| 3-Person Households | 556 (14.8%) | 0 (0.0%) |
| 4-Person Households | 362 (9.6%) | 0 (0.0%) |
| 5-Person Households | 206 (5.5%) | 3 (0.1%) |
| 6-Person Households | 76 (2.0%) | 0 (0.0%) |
| 7+ Person Households | 48 (1.3%) | 0 (0.0%) |
| Total | 2,441 (64.9%) | 1,322 (35.1%) |
Female Fertility in Rice County
Fertility by Age in Rice County
Average fertility rate in Rice County is 103.0 births per 1,000 women. Women in the age bracket of 20 to 34 years have the highest fertility rate with 159.0 births per 1,000 women. Women in the age bracket of 20 to 34 years acount for 65.8% of all women with births.
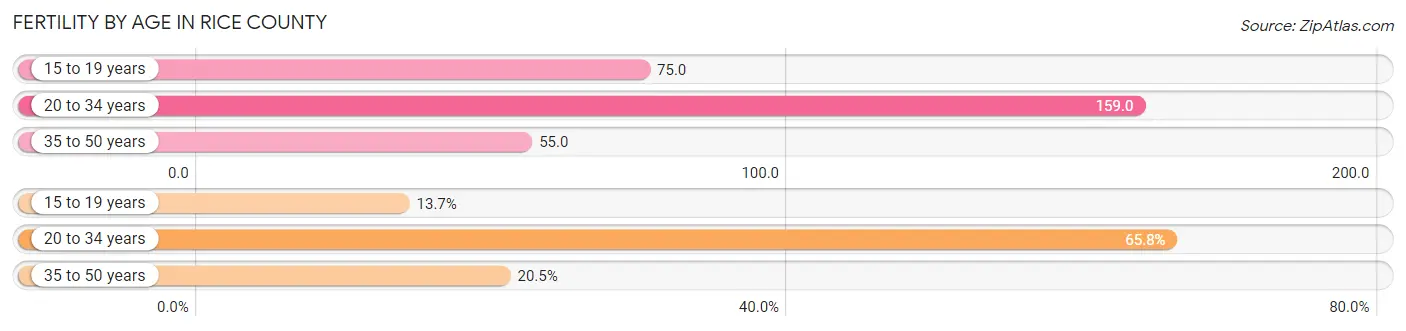
| Age Bracket | Women with Births | Births / 1,000 Women |
| 15 to 19 years | 26 (13.7%) | 75.0 |
| 20 to 34 years | 125 (65.8%) | 159.0 |
| 35 to 50 years | 39 (20.5%) | 55.0 |
| Total | 190 (100.0%) | 103.0 |
Fertility by Age by Marriage Status in Rice County
82.1% of women with births (190) in Rice County are married. The highest percentage of unmarried women with births falls into 15 to 19 years age bracket with 65.4% of them unmarried at the time of birth, while the lowest percentage of unmarried women with births belong to 20 to 34 years age bracket with 1.6% of them unmarried.
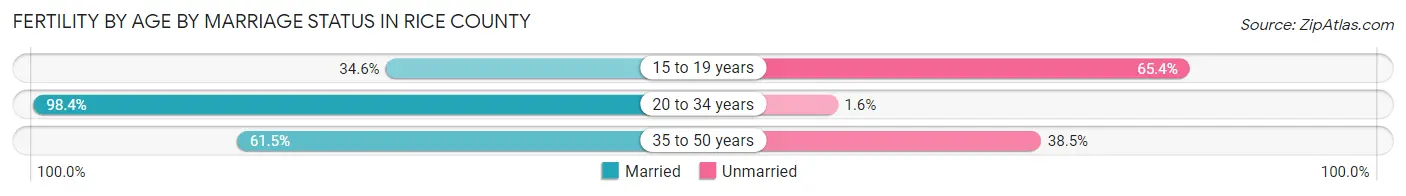
| Age Bracket | Married | Unmarried |
| 15 to 19 years | 9 (34.6%) | 17 (65.4%) |
| 20 to 34 years | 123 (98.4%) | 2 (1.6%) |
| 35 to 50 years | 24 (61.5%) | 15 (38.5%) |
| Total | 156 (82.1%) | 34 (17.9%) |
Fertility by Education in Rice County
Average fertility rate in Rice County is 103.0 births per 1,000 women. Women with the education attainment of graduate degree have the highest fertility rate of 269.0 births per 1,000 women, while women with the education attainment of college or associate's degree have the lowest fertility at 35.0 births per 1,000 women. Women with the education attainment of bachelor's degree represent 40.0% of all women with births.
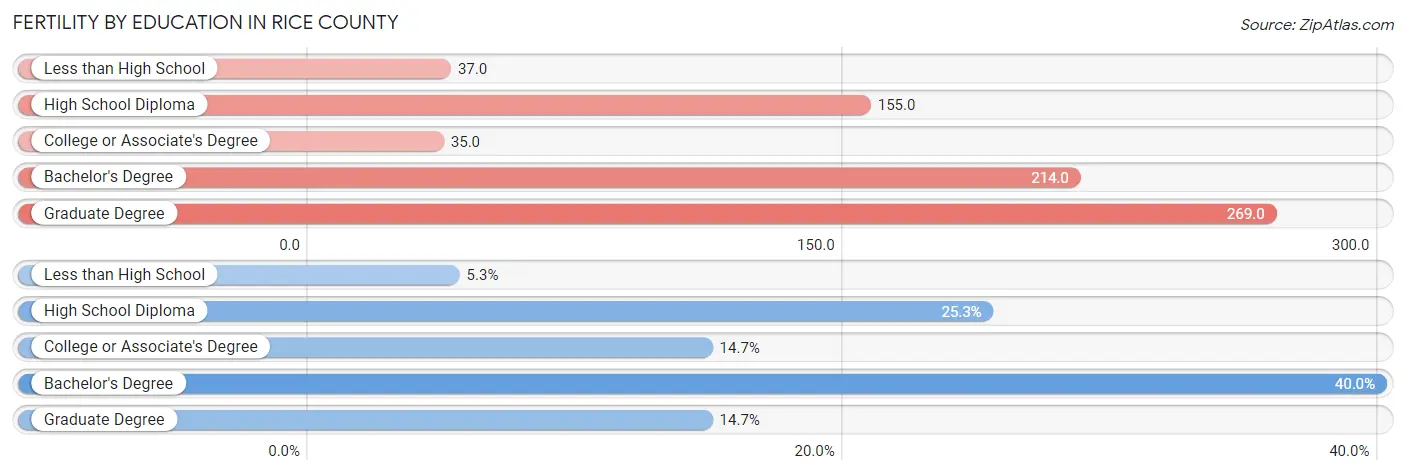
| Educational Attainment | Women with Births | Births / 1,000 Women |
| Less than High School | 10 (5.3%) | 37.0 |
| High School Diploma | 48 (25.3%) | 155.0 |
| College or Associate's Degree | 28 (14.7%) | 35.0 |
| Bachelor's Degree | 76 (40.0%) | 214.0 |
| Graduate Degree | 28 (14.7%) | 269.0 |
| Total | 190 (100.0%) | 103.0 |
Fertility by Education by Marriage Status in Rice County
17.9% of women with births in Rice County are unmarried. Women with the educational attainment of college or associate's degree are most likely to be married with 100.0% of them married at childbirth, while women with the educational attainment of high school diploma are least likely to be married with 37.5% of them unmarried at childbirth.
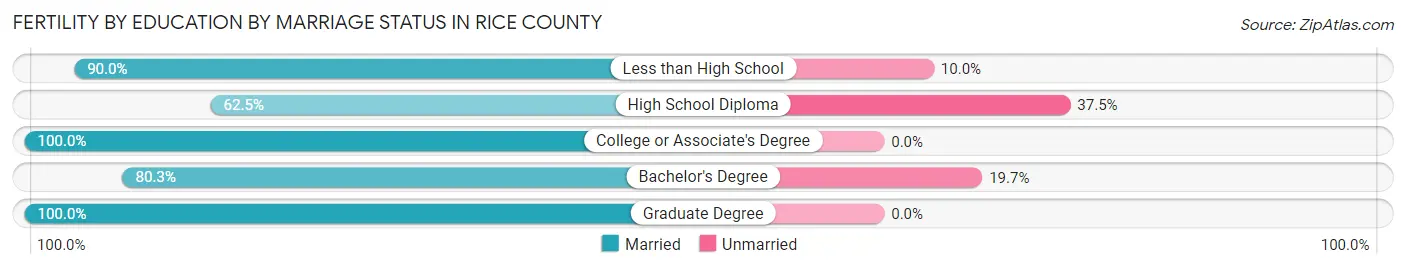
| Educational Attainment | Married | Unmarried |
| Less than High School | 9 (90.0%) | 1 (10.0%) |
| High School Diploma | 30 (62.5%) | 18 (37.5%) |
| College or Associate's Degree | 28 (100.0%) | 0 (0.0%) |
| Bachelor's Degree | 61 (80.3%) | 15 (19.7%) |
| Graduate Degree | 28 (100.0%) | 0 (0.0%) |
| Total | 156 (82.1%) | 34 (17.9%) |
Employment Characteristics in Rice County
Employment by Class of Employer in Rice County
Among the 4,323 employed individuals in Rice County, private company employees (2,636 | 61.0%), local government employees (554 | 12.8%), and not-for-profit organizations (397 | 9.2%) make up the most common classes of employment.
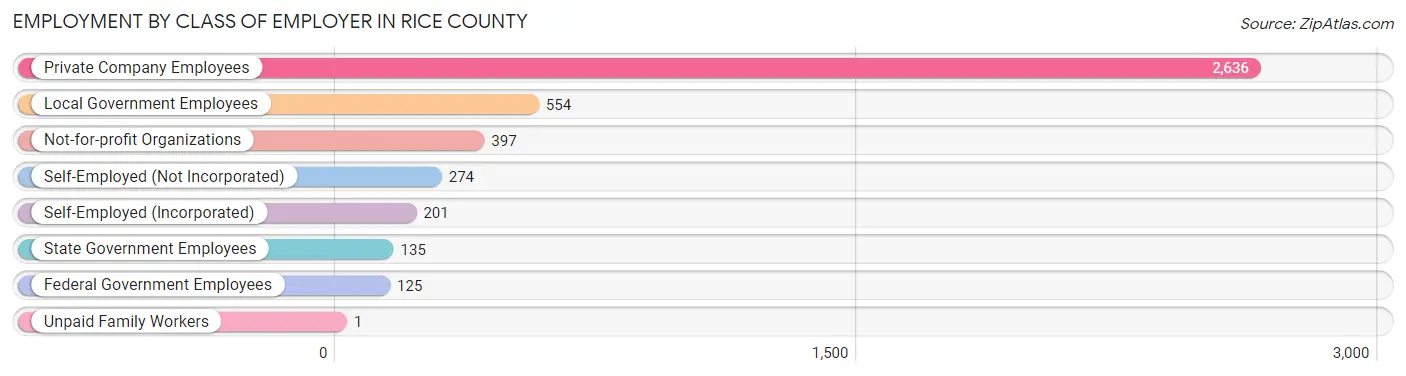
| Employer Class | # Employees | % Employees |
| Private Company Employees | 2,636 | 61.0% |
| Self-Employed (Incorporated) | 201 | 4.6% |
| Self-Employed (Not Incorporated) | 274 | 6.3% |
| Not-for-profit Organizations | 397 | 9.2% |
| Local Government Employees | 554 | 12.8% |
| State Government Employees | 135 | 3.1% |
| Federal Government Employees | 125 | 2.9% |
| Unpaid Family Workers | 1 | 0.0% |
| Total | 4,323 | 100.0% |
Employment Status by Age in Rice County
According to the labor force statistics for Rice County, out of the total population over 16 years of age (7,521), 60.5% or 4,550 individuals are in the labor force, with 3.6% or 164 of them unemployed. The age group with the highest labor force participation rate is 25 to 29 years, with 91.9% or 477 individuals in the labor force. Within the labor force, the 16 to 19 years age range has the highest percentage of unemployed individuals, with 15.3% or 41 of them being unemployed.
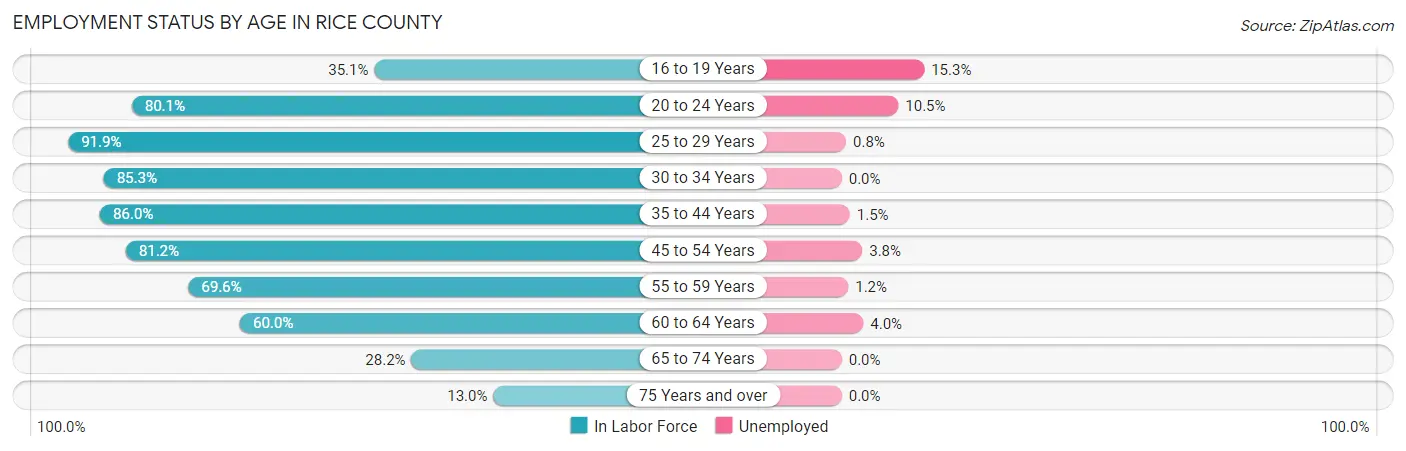
| Age Bracket | In Labor Force | Unemployed |
| 16 to 19 Years | 271 (35.1%) | 41 (15.3%) |
| 20 to 24 Years | 504 (80.1%) | 53 (10.5%) |
| 25 to 29 Years | 477 (91.9%) | 4 (0.8%) |
| 30 to 34 Years | 424 (85.3%) | 0 (0.0%) |
| 35 to 44 Years | 878 (86.0%) | 13 (1.5%) |
| 45 to 54 Years | 789 (81.2%) | 30 (3.8%) |
| 55 to 59 Years | 403 (69.6%) | 5 (1.2%) |
| 60 to 64 Years | 403 (60.0%) | 16 (4.0%) |
| 65 to 74 Years | 301 (28.2%) | 0 (0.0%) |
| 75 Years and over | 103 (13.0%) | 0 (0.0%) |
| Total | 4,550 (60.5%) | 164 (3.6%) |
Employment Status by Educational Attainment in Rice County
According to labor force statistics for Rice County, 79.2% of individuals (3,374) out of the total population between 25 and 64 years of age (4,260) are in the labor force, with 2.0% or 67 of them being unemployed. The group with the highest labor force participation rate are those with the educational attainment of bachelor's degree or higher, with 86.5% or 898 individuals in the labor force. Within the labor force, individuals with less than high school education have the highest percentage of unemployment, with 16.4% or 32 of them being unemployed.
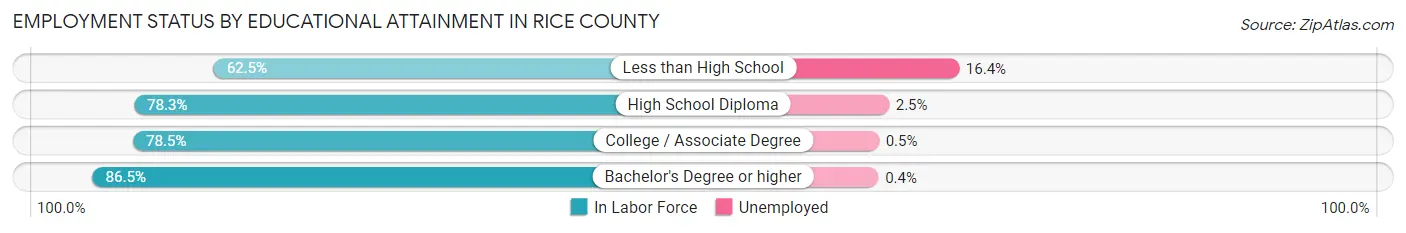
| Educational Attainment | In Labor Force | Unemployed |
| Less than High School | 195 (62.5%) | 51 (16.4%) |
| High School Diploma | 988 (78.3%) | 32 (2.5%) |
| College / Associate Degree | 1,294 (78.5%) | 8 (0.5%) |
| Bachelor's Degree or higher | 898 (86.5%) | 4 (0.4%) |
| Total | 3,374 (79.2%) | 85 (2.0%) |
Employment Occupations by Sex in Rice County
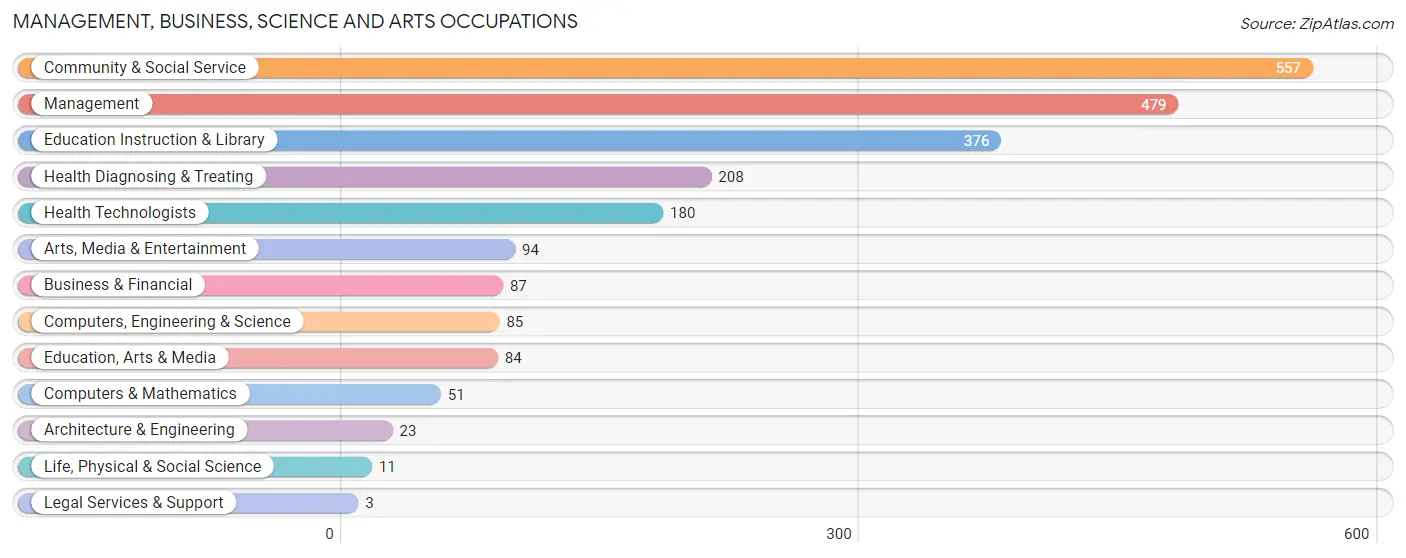
Management, Business, Science and Arts Occupations
The most common Management, Business, Science and Arts occupations in Rice County are Community & Social Service (557 | 12.7%), Management (479 | 10.9%), Education Instruction & Library (376 | 8.6%), Health Diagnosing & Treating (208 | 4.7%), and Health Technologists (180 | 4.1%).
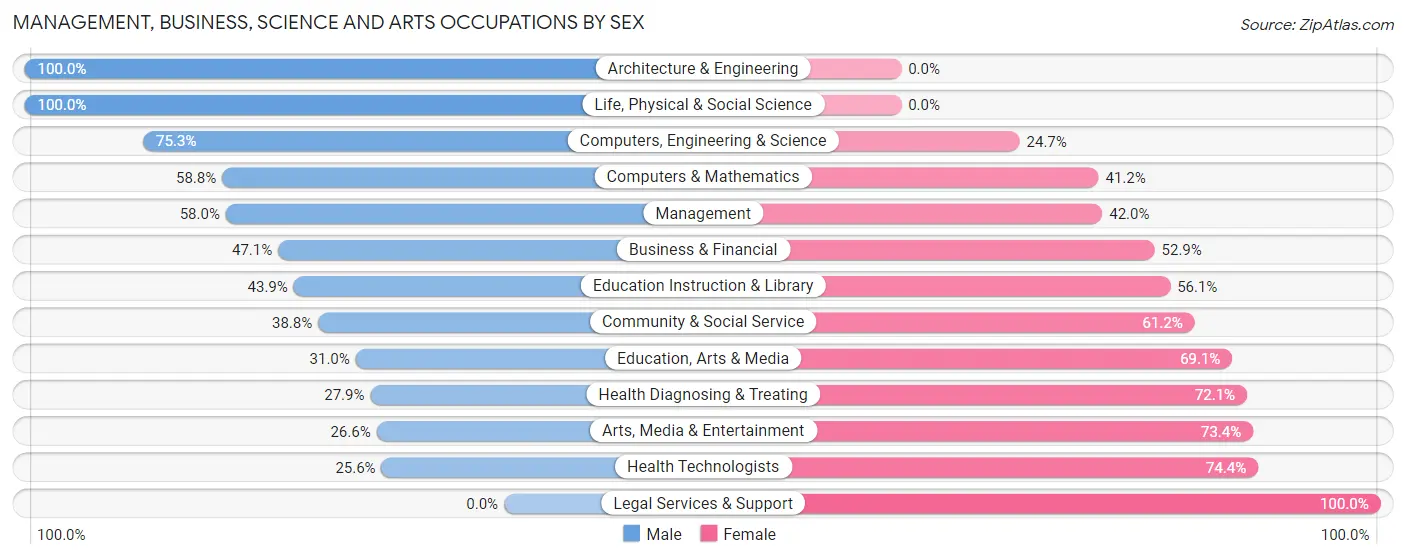
Management, Business, Science and Arts Occupations by Sex
Within the Management, Business, Science and Arts occupations in Rice County, the most male-oriented occupations are Architecture & Engineering (100.0%), Life, Physical & Social Science (100.0%), and Computers, Engineering & Science (75.3%), while the most female-oriented occupations are Legal Services & Support (100.0%), Health Technologists (74.4%), and Arts, Media & Entertainment (73.4%).
| Occupation | Male | Female |
| Management | 278 (58.0%) | 201 (42.0%) |
| Business & Financial | 41 (47.1%) | 46 (52.9%) |
| Computers, Engineering & Science | 64 (75.3%) | 21 (24.7%) |
| Computers & Mathematics | 30 (58.8%) | 21 (41.2%) |
| Architecture & Engineering | 23 (100.0%) | 0 (0.0%) |
| Life, Physical & Social Science | 11 (100.0%) | 0 (0.0%) |
| Community & Social Service | 216 (38.8%) | 341 (61.2%) |
| Education, Arts & Media | 26 (30.9%) | 58 (69.1%) |
| Legal Services & Support | 0 (0.0%) | 3 (100.0%) |
| Education Instruction & Library | 165 (43.9%) | 211 (56.1%) |
| Arts, Media & Entertainment | 25 (26.6%) | 69 (73.4%) |
| Health Diagnosing & Treating | 58 (27.9%) | 150 (72.1%) |
| Health Technologists | 46 (25.6%) | 134 (74.4%) |
| Total (Category) | 657 (46.4%) | 759 (53.6%) |
| Total (Overall) | 2,383 (54.3%) | 2,005 (45.7%) |
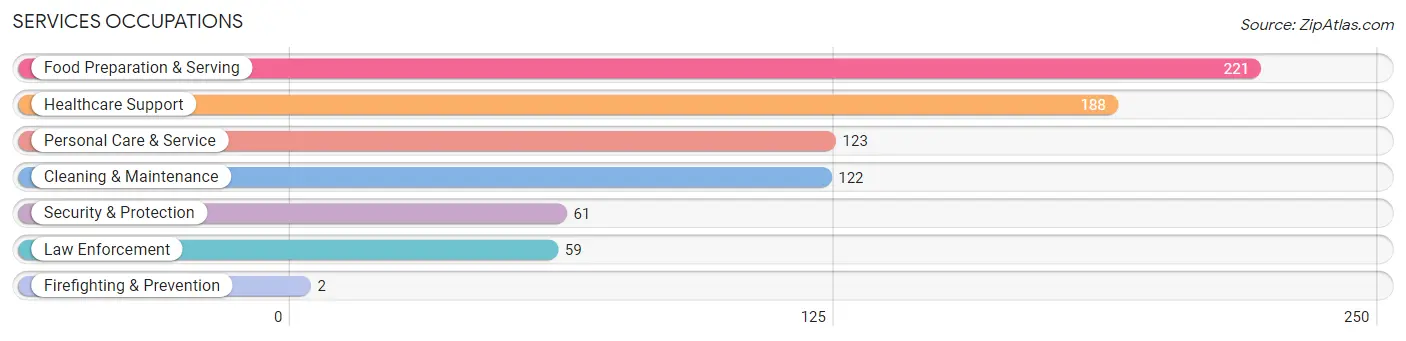
Services Occupations
The most common Services occupations in Rice County are Food Preparation & Serving (221 | 5.0%), Healthcare Support (188 | 4.3%), Personal Care & Service (123 | 2.8%), Cleaning & Maintenance (122 | 2.8%), and Security & Protection (61 | 1.4%).
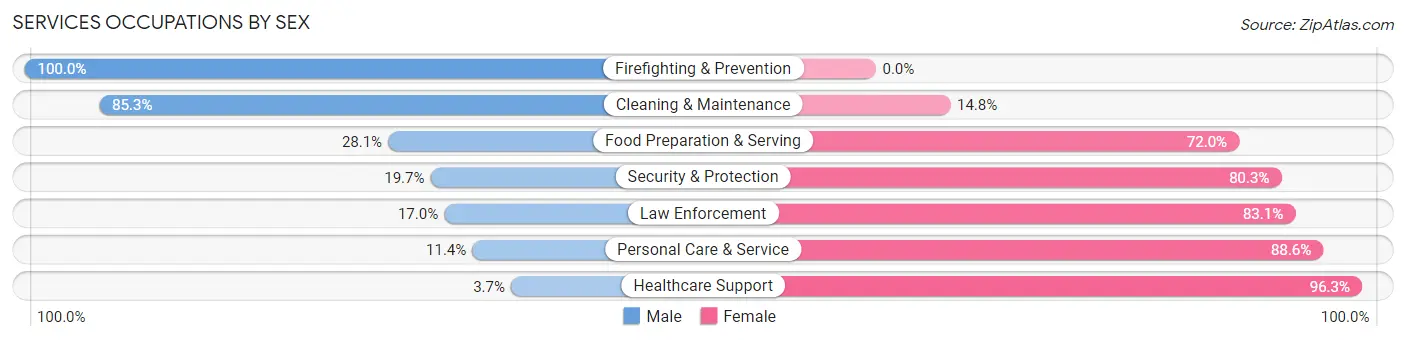
Services Occupations by Sex
Within the Services occupations in Rice County, the most male-oriented occupations are Firefighting & Prevention (100.0%), Cleaning & Maintenance (85.3%), and Food Preparation & Serving (28.1%), while the most female-oriented occupations are Healthcare Support (96.3%), Personal Care & Service (88.6%), and Law Enforcement (83.1%).
| Occupation | Male | Female |
| Healthcare Support | 7 (3.7%) | 181 (96.3%) |
| Security & Protection | 12 (19.7%) | 49 (80.3%) |
| Firefighting & Prevention | 2 (100.0%) | 0 (0.0%) |
| Law Enforcement | 10 (17.0%) | 49 (83.1%) |
| Food Preparation & Serving | 62 (28.1%) | 159 (72.0%) |
| Cleaning & Maintenance | 104 (85.3%) | 18 (14.7%) |
| Personal Care & Service | 14 (11.4%) | 109 (88.6%) |
| Total (Category) | 199 (27.8%) | 516 (72.2%) |
| Total (Overall) | 2,383 (54.3%) | 2,005 (45.7%) |
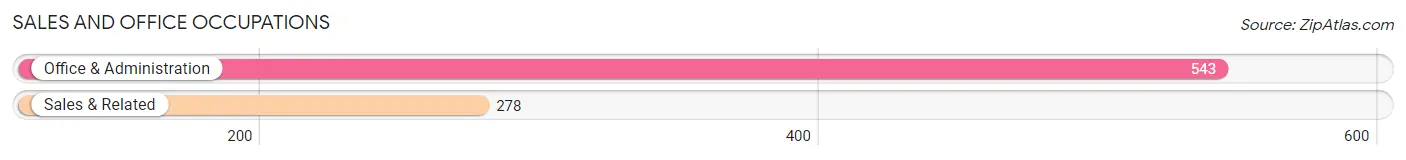
Sales and Office Occupations
The most common Sales and Office occupations in Rice County are Office & Administration (543 | 12.4%), and Sales & Related (278 | 6.3%).
Sales and Office Occupations by Sex
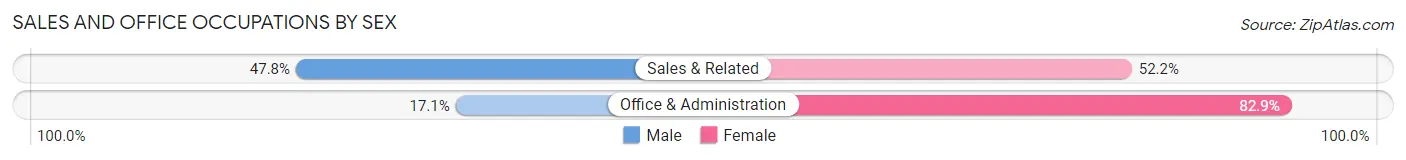
| Occupation | Male | Female |
| Sales & Related | 133 (47.8%) | 145 (52.2%) |
| Office & Administration | 93 (17.1%) | 450 (82.9%) |
| Total (Category) | 226 (27.5%) | 595 (72.5%) |
| Total (Overall) | 2,383 (54.3%) | 2,005 (45.7%) |
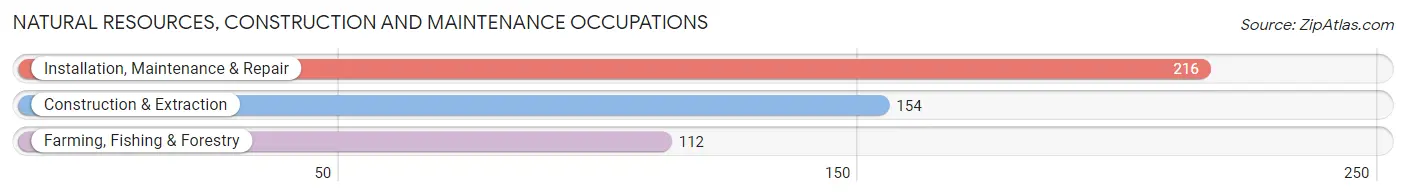
Natural Resources, Construction and Maintenance Occupations
The most common Natural Resources, Construction and Maintenance occupations in Rice County are Installation, Maintenance & Repair (216 | 4.9%), Construction & Extraction (154 | 3.5%), and Farming, Fishing & Forestry (112 | 2.5%).
Natural Resources, Construction and Maintenance Occupations by Sex
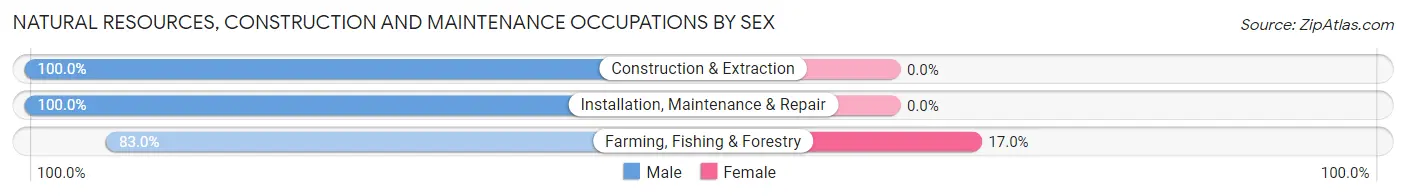
| Occupation | Male | Female |
| Farming, Fishing & Forestry | 93 (83.0%) | 19 (17.0%) |
| Construction & Extraction | 154 (100.0%) | 0 (0.0%) |
| Installation, Maintenance & Repair | 216 (100.0%) | 0 (0.0%) |
| Total (Category) | 463 (96.1%) | 19 (3.9%) |
| Total (Overall) | 2,383 (54.3%) | 2,005 (45.7%) |
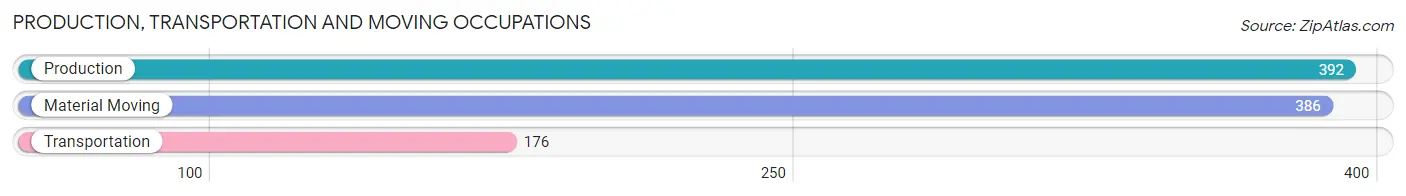
Production, Transportation and Moving Occupations
The most common Production, Transportation and Moving occupations in Rice County are Production (392 | 8.9%), Material Moving (386 | 8.8%), and Transportation (176 | 4.0%).
Production, Transportation and Moving Occupations by Sex
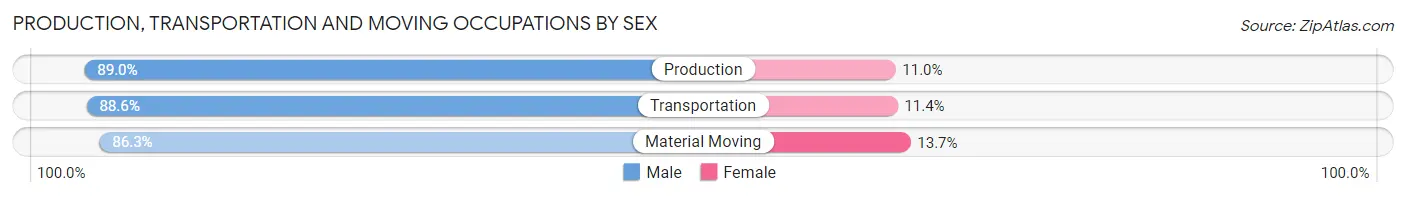
| Occupation | Male | Female |
| Production | 349 (89.0%) | 43 (11.0%) |
| Transportation | 156 (88.6%) | 20 (11.4%) |
| Material Moving | 333 (86.3%) | 53 (13.7%) |
| Total (Category) | 838 (87.8%) | 116 (12.2%) |
| Total (Overall) | 2,383 (54.3%) | 2,005 (45.7%) |
Employment Industries by Sex in Rice County
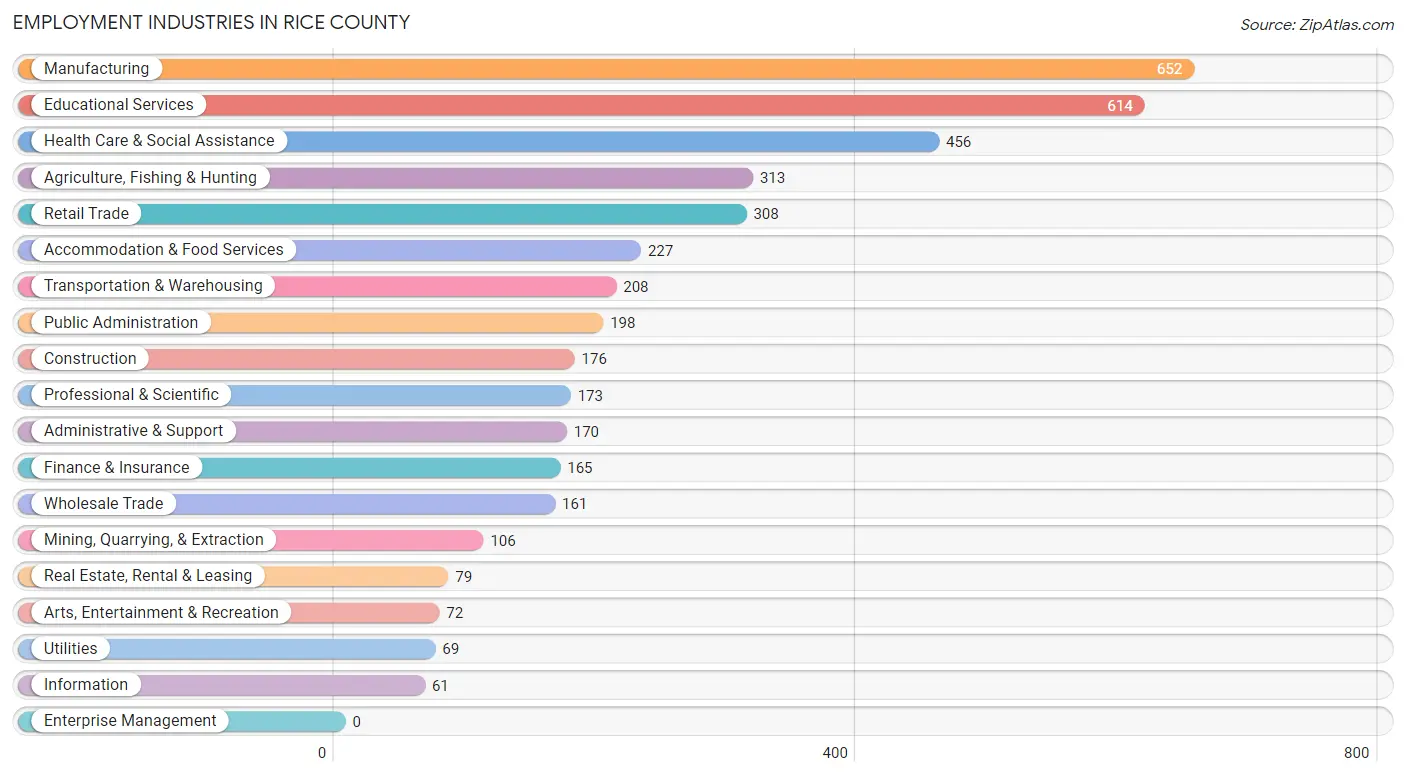
Employment Industries in Rice County
The major employment industries in Rice County include Manufacturing (652 | 14.9%), Educational Services (614 | 14.0%), Health Care & Social Assistance (456 | 10.4%), Agriculture, Fishing & Hunting (313 | 7.1%), and Retail Trade (308 | 7.0%).
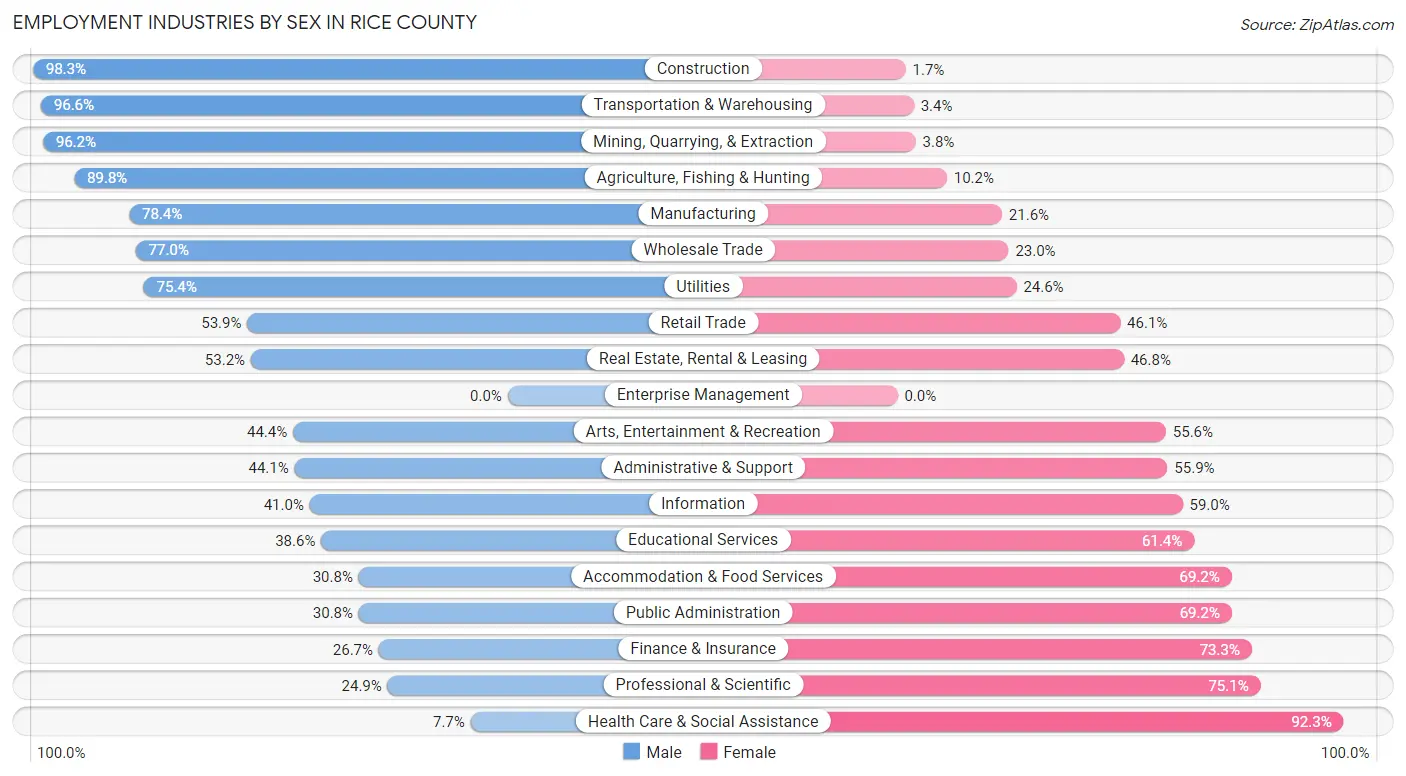
Employment Industries by Sex in Rice County
The Rice County industries that see more men than women are Construction (98.3%), Transportation & Warehousing (96.6%), and Mining, Quarrying, & Extraction (96.2%), whereas the industries that tend to have a higher number of women are Health Care & Social Assistance (92.3%), Professional & Scientific (75.1%), and Finance & Insurance (73.3%).
| Industry | Male | Female |
| Agriculture, Fishing & Hunting | 281 (89.8%) | 32 (10.2%) |
| Mining, Quarrying, & Extraction | 102 (96.2%) | 4 (3.8%) |
| Construction | 173 (98.3%) | 3 (1.7%) |
| Manufacturing | 511 (78.4%) | 141 (21.6%) |
| Wholesale Trade | 124 (77.0%) | 37 (23.0%) |
| Retail Trade | 166 (53.9%) | 142 (46.1%) |
| Transportation & Warehousing | 201 (96.6%) | 7 (3.4%) |
| Utilities | 52 (75.4%) | 17 (24.6%) |
| Information | 25 (41.0%) | 36 (59.0%) |
| Finance & Insurance | 44 (26.7%) | 121 (73.3%) |
| Real Estate, Rental & Leasing | 42 (53.2%) | 37 (46.8%) |
| Professional & Scientific | 43 (24.9%) | 130 (75.1%) |
| Enterprise Management | 0 (0.0%) | 0 (0.0%) |
| Administrative & Support | 75 (44.1%) | 95 (55.9%) |
| Educational Services | 237 (38.6%) | 377 (61.4%) |
| Health Care & Social Assistance | 35 (7.7%) | 421 (92.3%) |
| Arts, Entertainment & Recreation | 32 (44.4%) | 40 (55.6%) |
| Accommodation & Food Services | 70 (30.8%) | 157 (69.2%) |
| Public Administration | 61 (30.8%) | 137 (69.2%) |
| Total | 2,383 (54.3%) | 2,005 (45.7%) |
Education in Rice County
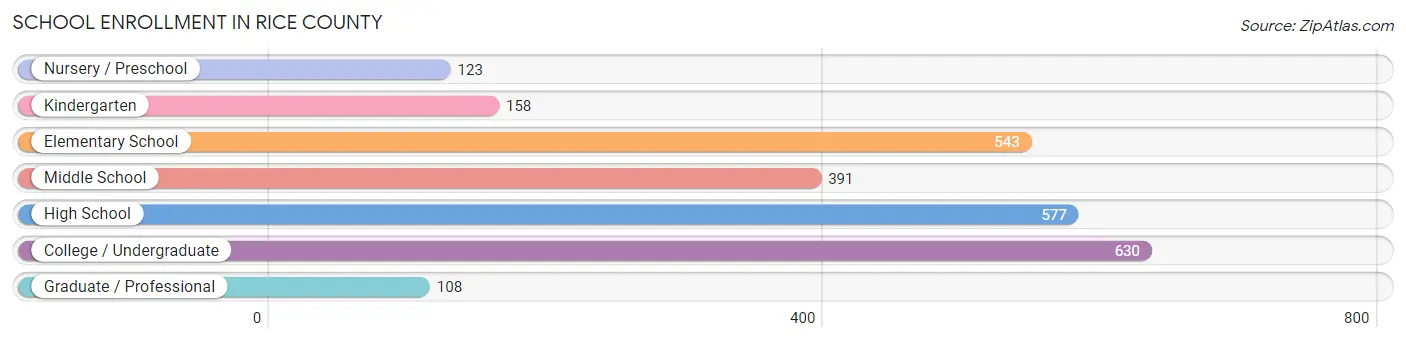
School Enrollment in Rice County
The most common levels of schooling among the 2,530 students in Rice County are college / undergraduate (630 | 24.9%), high school (577 | 22.8%), and elementary school (543 | 21.5%).
| School Level | # Students | % Students |
| Nursery / Preschool | 123 | 4.9% |
| Kindergarten | 158 | 6.2% |
| Elementary School | 543 | 21.5% |
| Middle School | 391 | 15.4% |
| High School | 577 | 22.8% |
| College / Undergraduate | 630 | 24.9% |
| Graduate / Professional | 108 | 4.3% |
| Total | 2,530 | 100.0% |
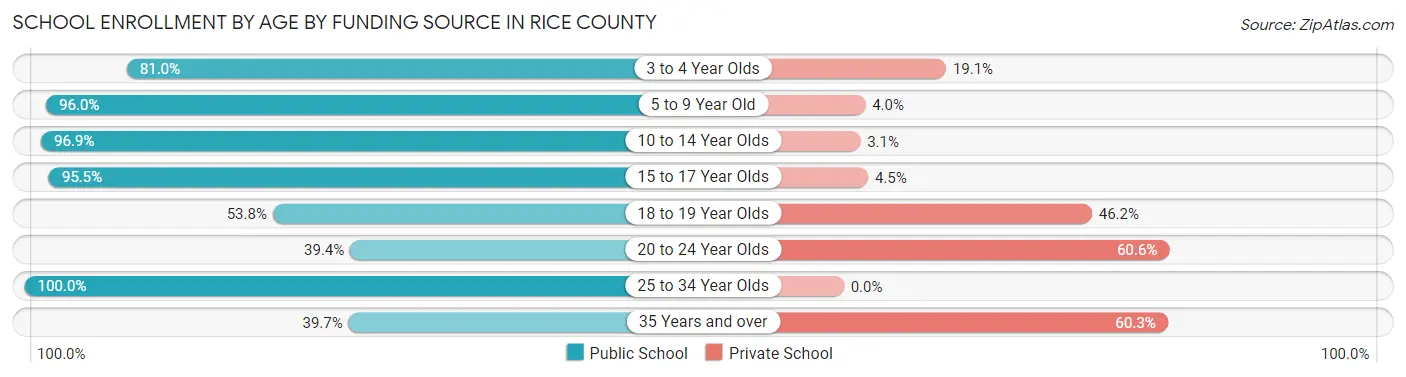
School Enrollment by Age by Funding Source in Rice County
Out of a total of 2,530 students who are enrolled in schools in Rice County, 493 (19.5%) attend a private institution, while the remaining 2,037 (80.5%) are enrolled in public schools. The age group of 20 to 24 year olds has the highest likelihood of being enrolled in private schools, with 174 (60.6% in the age bracket) enrolled. Conversely, the age group of 25 to 34 year olds has the lowest likelihood of being enrolled in a private school, with 69 (100.0% in the age bracket) attending a public institution.
| Age Bracket | Public School | Private School |
| 3 to 4 Year Olds | 34 (80.9%) | 8 (19.1%) |
| 5 to 9 Year Old | 718 (96.0%) | 30 (4.0%) |
| 10 to 14 Year Olds | 472 (96.9%) | 15 (3.1%) |
| 15 to 17 Year Olds | 359 (95.5%) | 17 (4.5%) |
| 18 to 19 Year Olds | 249 (53.8%) | 214 (46.2%) |
| 20 to 24 Year Olds | 113 (39.4%) | 174 (60.6%) |
| 25 to 34 Year Olds | 69 (100.0%) | 0 (0.0%) |
| 35 Years and over | 23 (39.7%) | 35 (60.3%) |
| Total | 2,037 (80.5%) | 493 (19.5%) |
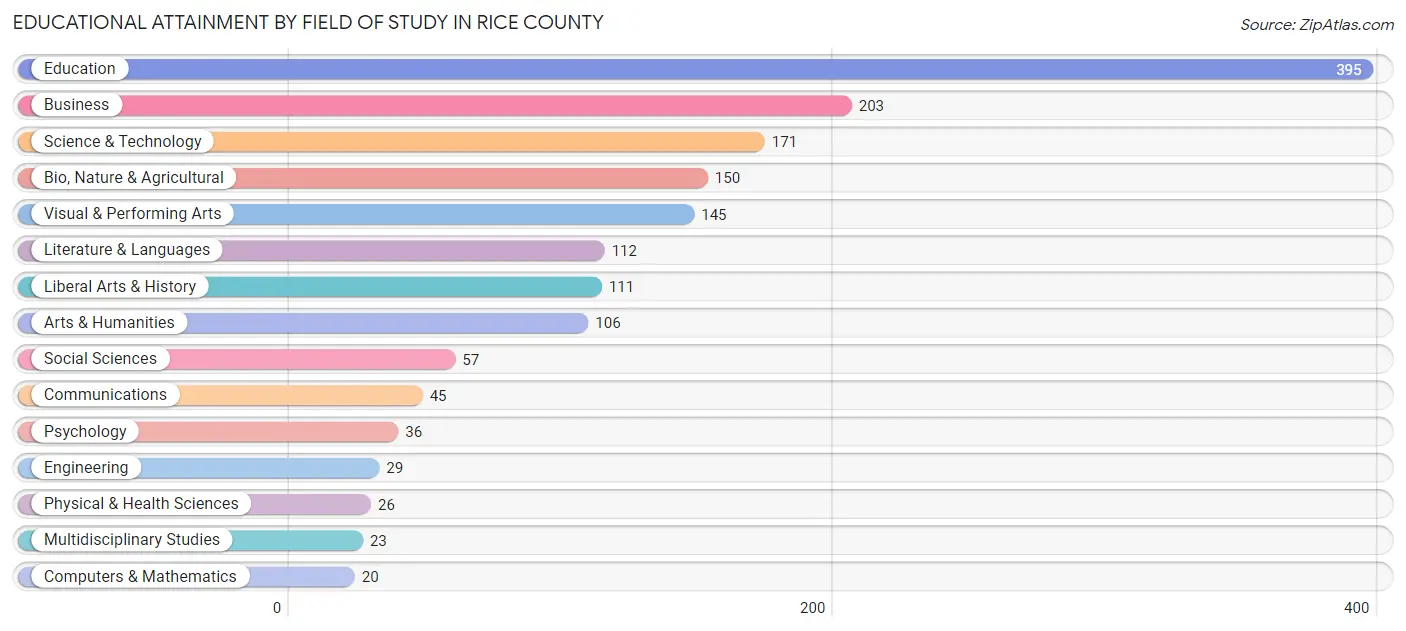
Educational Attainment by Field of Study in Rice County
Education (395 | 24.2%), business (203 | 12.5%), science & technology (171 | 10.5%), bio, nature & agricultural (150 | 9.2%), and visual & performing arts (145 | 8.9%) are the most common fields of study among 1,629 individuals in Rice County who have obtained a bachelor's degree or higher.
| Field of Study | # Graduates | % Graduates |
| Computers & Mathematics | 20 | 1.2% |
| Bio, Nature & Agricultural | 150 | 9.2% |
| Physical & Health Sciences | 26 | 1.6% |
| Psychology | 36 | 2.2% |
| Social Sciences | 57 | 3.5% |
| Engineering | 29 | 1.8% |
| Multidisciplinary Studies | 23 | 1.4% |
| Science & Technology | 171 | 10.5% |
| Business | 203 | 12.5% |
| Education | 395 | 24.2% |
| Literature & Languages | 112 | 6.9% |
| Liberal Arts & History | 111 | 6.8% |
| Visual & Performing Arts | 145 | 8.9% |
| Communications | 45 | 2.8% |
| Arts & Humanities | 106 | 6.5% |
| Total | 1,629 | 100.0% |
Transportation & Commute in Rice County
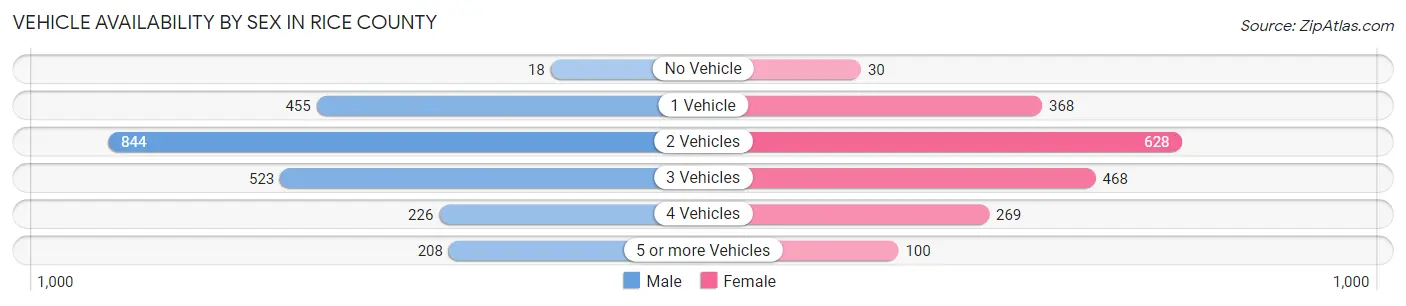
Vehicle Availability by Sex in Rice County
The most prevalent vehicle ownership categories in Rice County are males with 2 vehicles (844, accounting for 37.1%) and females with 2 vehicles (628, making up 45.3%).
| Vehicles Available | Male | Female |
| No Vehicle | 18 (0.8%) | 30 (1.6%) |
| 1 Vehicle | 455 (20.0%) | 368 (19.8%) |
| 2 Vehicles | 844 (37.1%) | 628 (33.7%) |
| 3 Vehicles | 523 (23.0%) | 468 (25.1%) |
| 4 Vehicles | 226 (9.9%) | 269 (14.4%) |
| 5 or more Vehicles | 208 (9.1%) | 100 (5.4%) |
| Total | 2,274 (100.0%) | 1,863 (100.0%) |
Commute Time in Rice County
The most frequently occuring commute durations in Rice County are 5 to 9 minutes (1,100 commuters, 26.6%), less than 5 minutes (680 commuters, 16.4%), and 30 to 34 minutes (470 commuters, 11.3%).
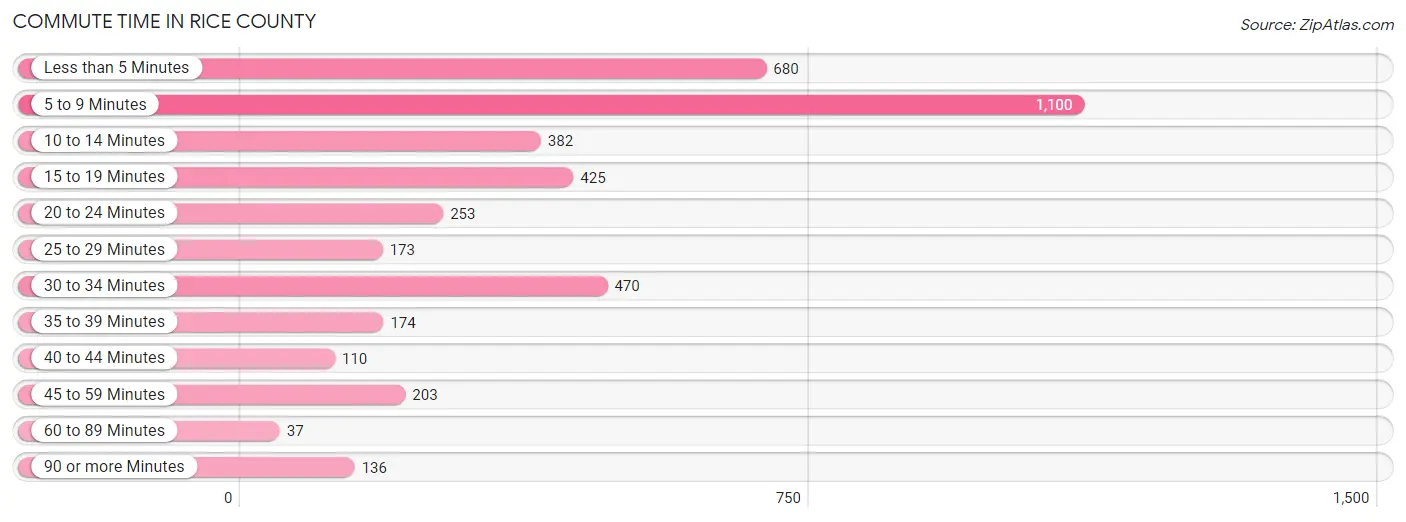
| Commute Time | # Commuters | % Commuters |
| Less than 5 Minutes | 680 | 16.4% |
| 5 to 9 Minutes | 1,100 | 26.6% |
| 10 to 14 Minutes | 382 | 9.2% |
| 15 to 19 Minutes | 425 | 10.3% |
| 20 to 24 Minutes | 253 | 6.1% |
| 25 to 29 Minutes | 173 | 4.2% |
| 30 to 34 Minutes | 470 | 11.3% |
| 35 to 39 Minutes | 174 | 4.2% |
| 40 to 44 Minutes | 110 | 2.7% |
| 45 to 59 Minutes | 203 | 4.9% |
| 60 to 89 Minutes | 37 | 0.9% |
| 90 or more Minutes | 136 | 3.3% |
Commute Time by Sex in Rice County
The most common commute times in Rice County are 5 to 9 minutes (458 commuters, 20.2%) for males and 5 to 9 minutes (642 commuters, 34.2%) for females.
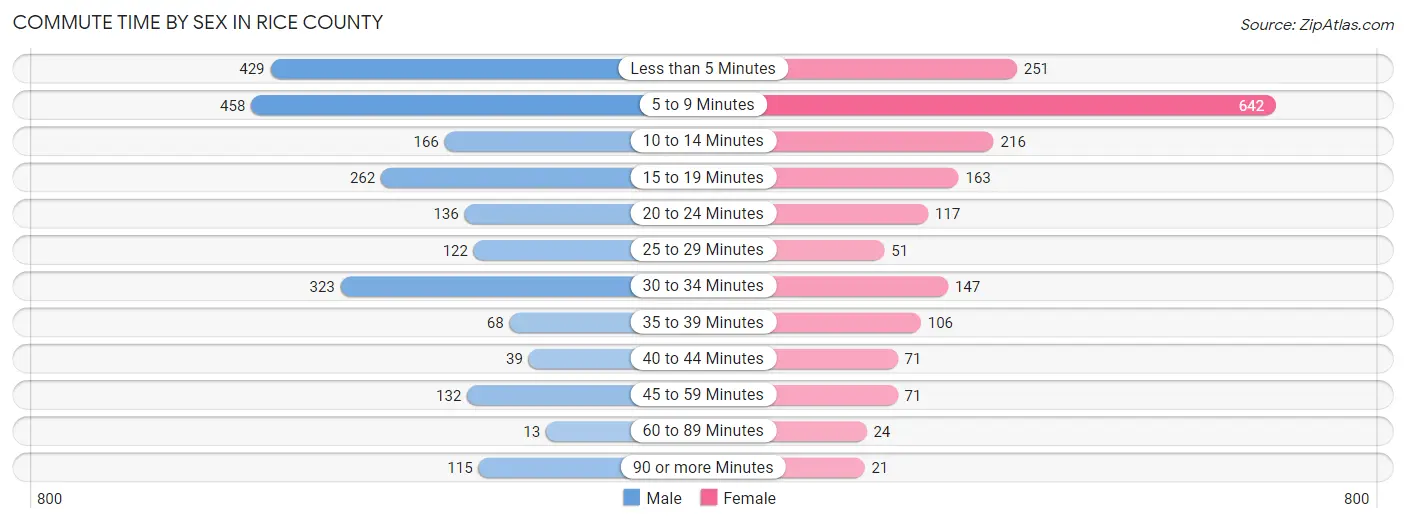
| Commute Time | Male | Female |
| Less than 5 Minutes | 429 (19.0%) | 251 (13.4%) |
| 5 to 9 Minutes | 458 (20.2%) | 642 (34.2%) |
| 10 to 14 Minutes | 166 (7.3%) | 216 (11.5%) |
| 15 to 19 Minutes | 262 (11.6%) | 163 (8.7%) |
| 20 to 24 Minutes | 136 (6.0%) | 117 (6.2%) |
| 25 to 29 Minutes | 122 (5.4%) | 51 (2.7%) |
| 30 to 34 Minutes | 323 (14.3%) | 147 (7.8%) |
| 35 to 39 Minutes | 68 (3.0%) | 106 (5.6%) |
| 40 to 44 Minutes | 39 (1.7%) | 71 (3.8%) |
| 45 to 59 Minutes | 132 (5.8%) | 71 (3.8%) |
| 60 to 89 Minutes | 13 (0.6%) | 24 (1.3%) |
| 90 or more Minutes | 115 (5.1%) | 21 (1.1%) |
Time of Departure to Work by Sex in Rice County
The most frequent times of departure to work in Rice County are 7:00 AM to 7:29 AM (474, 20.9%) for males and 7:30 AM to 7:59 AM (549, 29.2%) for females.
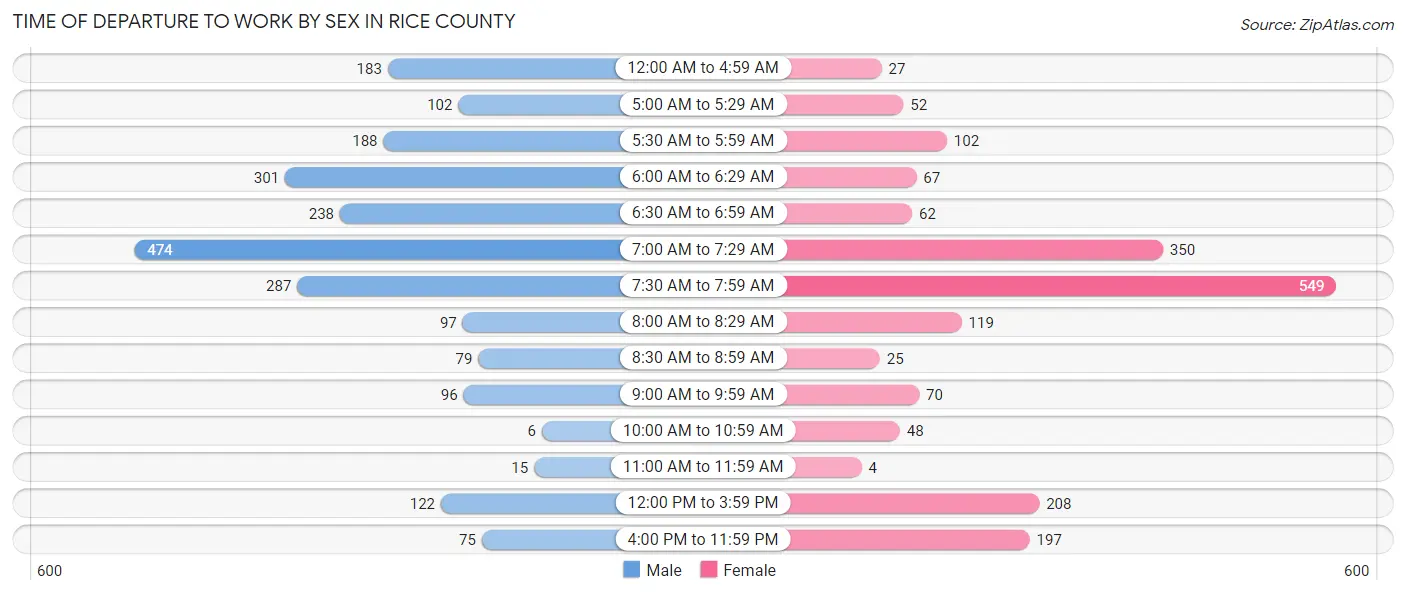
| Time of Departure | Male | Female |
| 12:00 AM to 4:59 AM | 183 (8.1%) | 27 (1.4%) |
| 5:00 AM to 5:29 AM | 102 (4.5%) | 52 (2.8%) |
| 5:30 AM to 5:59 AM | 188 (8.3%) | 102 (5.4%) |
| 6:00 AM to 6:29 AM | 301 (13.3%) | 67 (3.6%) |
| 6:30 AM to 6:59 AM | 238 (10.5%) | 62 (3.3%) |
| 7:00 AM to 7:29 AM | 474 (20.9%) | 350 (18.6%) |
| 7:30 AM to 7:59 AM | 287 (12.7%) | 549 (29.2%) |
| 8:00 AM to 8:29 AM | 97 (4.3%) | 119 (6.3%) |
| 8:30 AM to 8:59 AM | 79 (3.5%) | 25 (1.3%) |
| 9:00 AM to 9:59 AM | 96 (4.2%) | 70 (3.7%) |
| 10:00 AM to 10:59 AM | 6 (0.3%) | 48 (2.5%) |
| 11:00 AM to 11:59 AM | 15 (0.7%) | 4 (0.2%) |
| 12:00 PM to 3:59 PM | 122 (5.4%) | 208 (11.1%) |
| 4:00 PM to 11:59 PM | 75 (3.3%) | 197 (10.5%) |
| Total | 2,263 (100.0%) | 1,880 (100.0%) |
Housing Occupancy in Rice County
Occupancy by Ownership in Rice County
Of the total 3,763 dwellings in Rice County, owner-occupied units account for 2,847 (75.7%), while renter-occupied units make up 916 (24.3%).
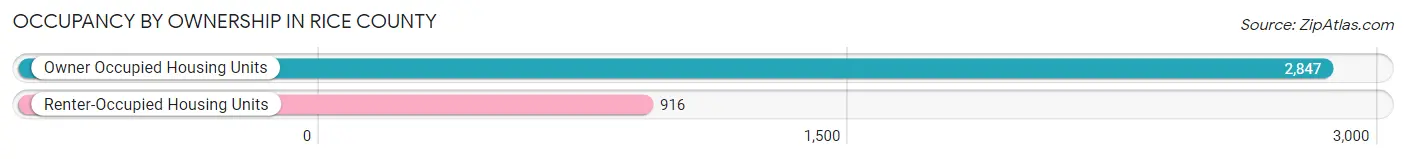
| Occupancy | # Housing Units | % Housing Units |
| Owner Occupied Housing Units | 2,847 | 75.7% |
| Renter-Occupied Housing Units | 916 | 24.3% |
| Total Occupied Housing Units | 3,763 | 100.0% |
Occupancy by Household Size in Rice County
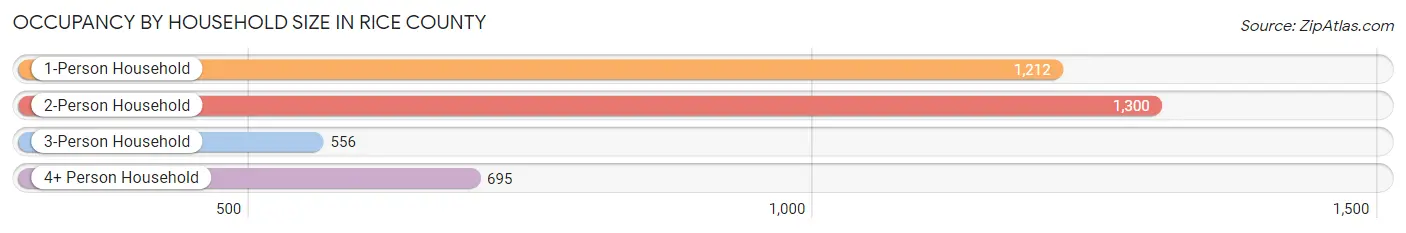
| Household Size | # Housing Units | % Housing Units |
| 1-Person Household | 1,212 | 32.2% |
| 2-Person Household | 1,300 | 34.5% |
| 3-Person Household | 556 | 14.8% |
| 4+ Person Household | 695 | 18.5% |
| Total Housing Units | 3,763 | 100.0% |
Occupancy by Ownership by Household Size in Rice County
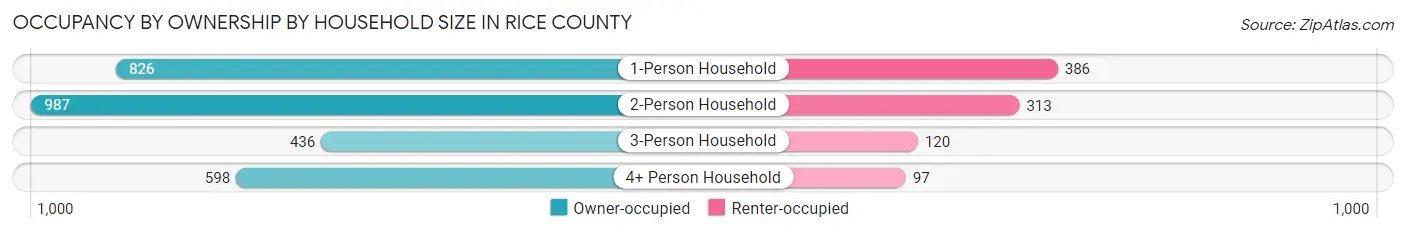
| Household Size | Owner-occupied | Renter-occupied |
| 1-Person Household | 826 (68.1%) | 386 (31.9%) |
| 2-Person Household | 987 (75.9%) | 313 (24.1%) |
| 3-Person Household | 436 (78.4%) | 120 (21.6%) |
| 4+ Person Household | 598 (86.0%) | 97 (14.0%) |
| Total Housing Units | 2,847 (75.7%) | 916 (24.3%) |
Occupancy by Educational Attainment in Rice County
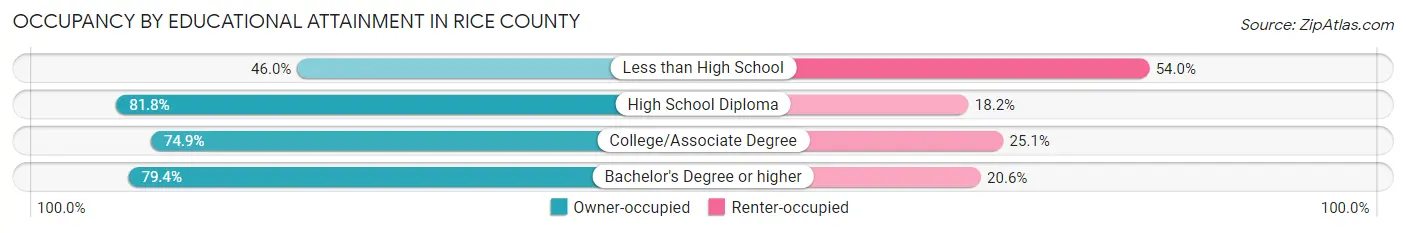
| Household Size | Owner-occupied | Renter-occupied |
| Less than High School | 125 (46.0%) | 147 (54.0%) |
| High School Diploma | 823 (81.8%) | 183 (18.2%) |
| College/Associate Degree | 1,237 (74.9%) | 414 (25.1%) |
| Bachelor's Degree or higher | 662 (79.4%) | 172 (20.6%) |
Occupancy by Age of Householder in Rice County
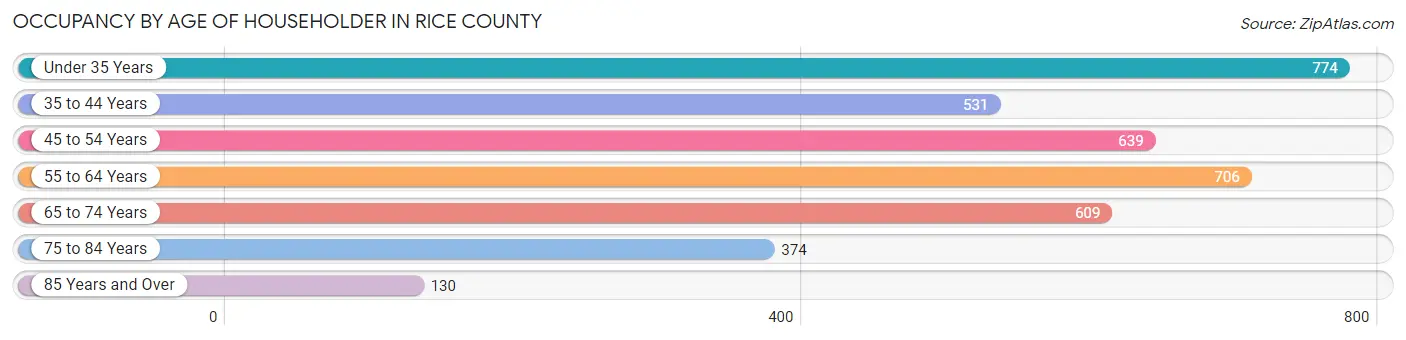
| Age Bracket | # Households | % Households |
| Under 35 Years | 774 | 20.6% |
| 35 to 44 Years | 531 | 14.1% |
| 45 to 54 Years | 639 | 17.0% |
| 55 to 64 Years | 706 | 18.8% |
| 65 to 74 Years | 609 | 16.2% |
| 75 to 84 Years | 374 | 9.9% |
| 85 Years and Over | 130 | 3.5% |
| Total | 3,763 | 100.0% |
Housing Finances in Rice County
Median Income by Occupancy in Rice County
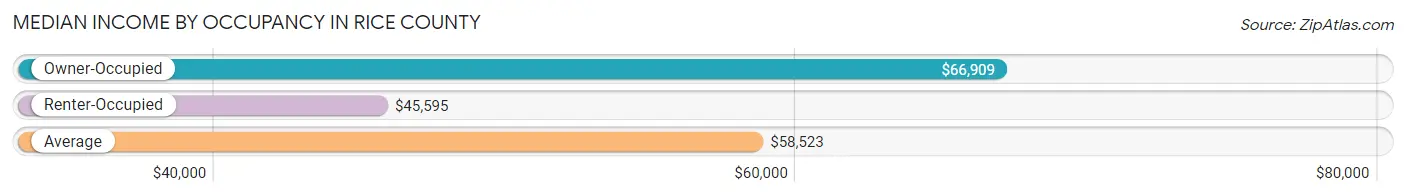
| Occupancy Type | # Households | Median Income |
| Owner-Occupied | 2,847 (75.7%) | $66,909 |
| Renter-Occupied | 916 (24.3%) | $45,595 |
| Average | 3,763 (100.0%) | $58,523 |
Occupancy by Householder Income Bracket in Rice County
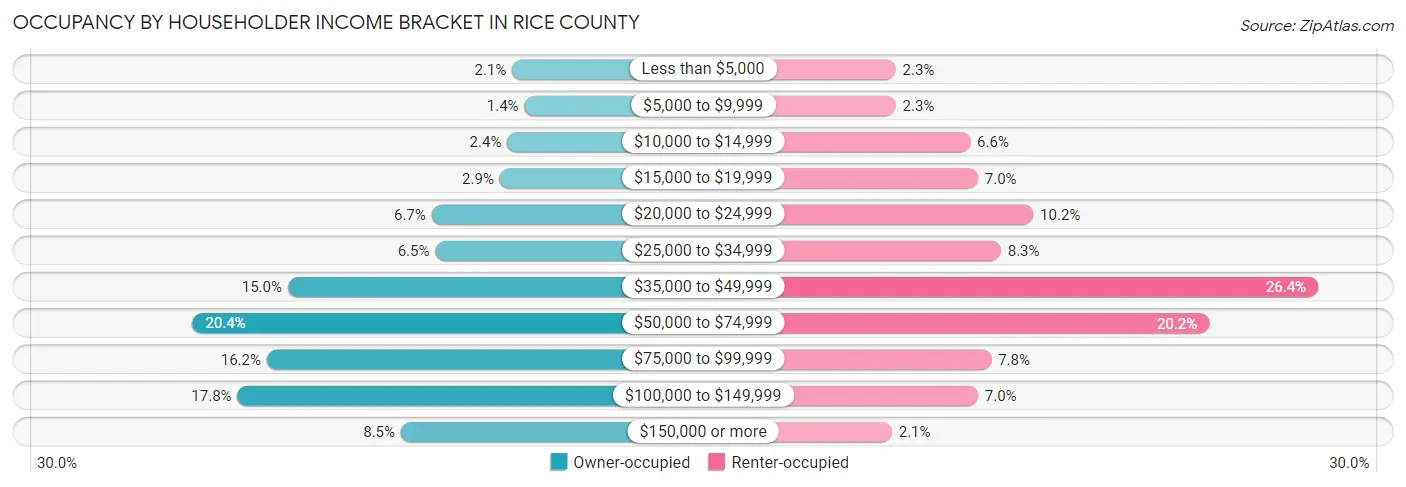
| Income Bracket | Owner-occupied | Renter-occupied |
| Less than $5,000 | 61 (2.1%) | 21 (2.3%) |
| $5,000 to $9,999 | 41 (1.4%) | 21 (2.3%) |
| $10,000 to $14,999 | 69 (2.4%) | 60 (6.6%) |
| $15,000 to $19,999 | 81 (2.9%) | 64 (7.0%) |
| $20,000 to $24,999 | 192 (6.7%) | 93 (10.2%) |
| $25,000 to $34,999 | 186 (6.5%) | 76 (8.3%) |
| $35,000 to $49,999 | 426 (15.0%) | 242 (26.4%) |
| $50,000 to $74,999 | 581 (20.4%) | 185 (20.2%) |
| $75,000 to $99,999 | 460 (16.2%) | 71 (7.7%) |
| $100,000 to $149,999 | 508 (17.8%) | 64 (7.0%) |
| $150,000 or more | 242 (8.5%) | 19 (2.1%) |
| Total | 2,847 (100.0%) | 916 (100.0%) |
Monthly Housing Cost Tiers in Rice County
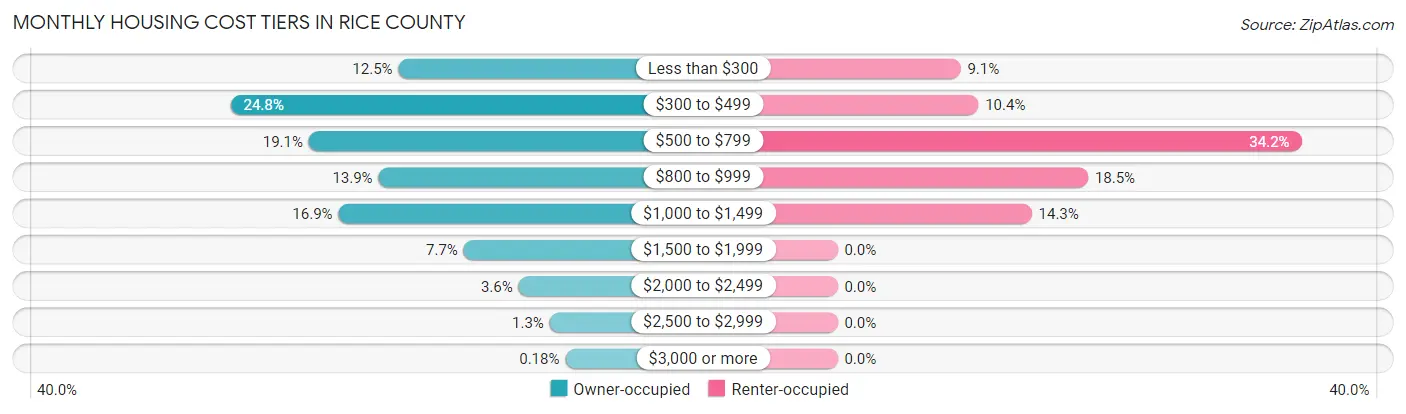
| Monthly Cost | Owner-occupied | Renter-occupied |
| Less than $300 | 355 (12.5%) | 83 (9.1%) |
| $300 to $499 | 707 (24.8%) | 95 (10.4%) |
| $500 to $799 | 543 (19.1%) | 313 (34.2%) |
| $800 to $999 | 397 (13.9%) | 169 (18.4%) |
| $1,000 to $1,499 | 481 (16.9%) | 131 (14.3%) |
| $1,500 to $1,999 | 218 (7.7%) | 0 (0.0%) |
| $2,000 to $2,499 | 103 (3.6%) | 0 (0.0%) |
| $2,500 to $2,999 | 38 (1.3%) | 0 (0.0%) |
| $3,000 or more | 5 (0.2%) | 0 (0.0%) |
| Total | 2,847 (100.0%) | 916 (100.0%) |
Physical Housing Characteristics in Rice County
Housing Structures in Rice County
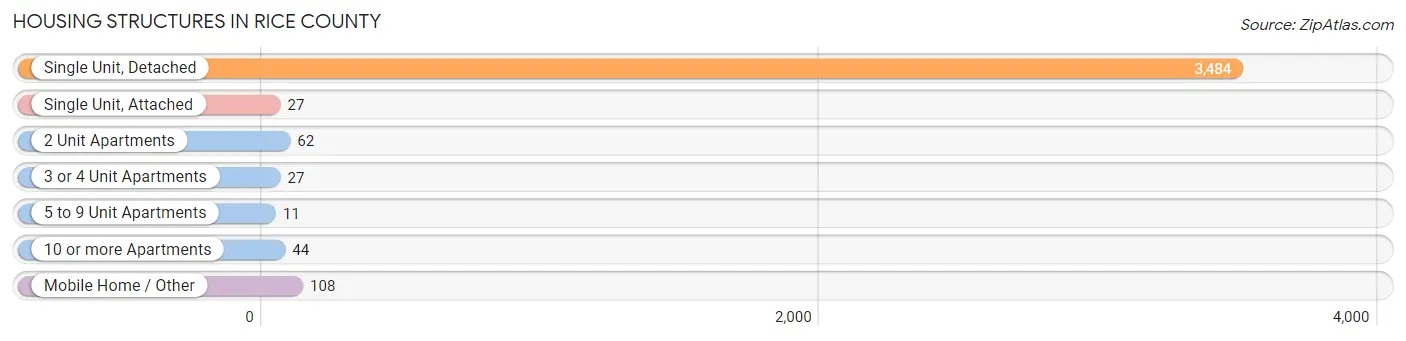
| Structure Type | # Housing Units | % Housing Units |
| Single Unit, Detached | 3,484 | 92.6% |
| Single Unit, Attached | 27 | 0.7% |
| 2 Unit Apartments | 62 | 1.7% |
| 3 or 4 Unit Apartments | 27 | 0.7% |
| 5 to 9 Unit Apartments | 11 | 0.3% |
| 10 or more Apartments | 44 | 1.2% |
| Mobile Home / Other | 108 | 2.9% |
| Total | 3,763 | 100.0% |
Housing Structures by Occupancy in Rice County
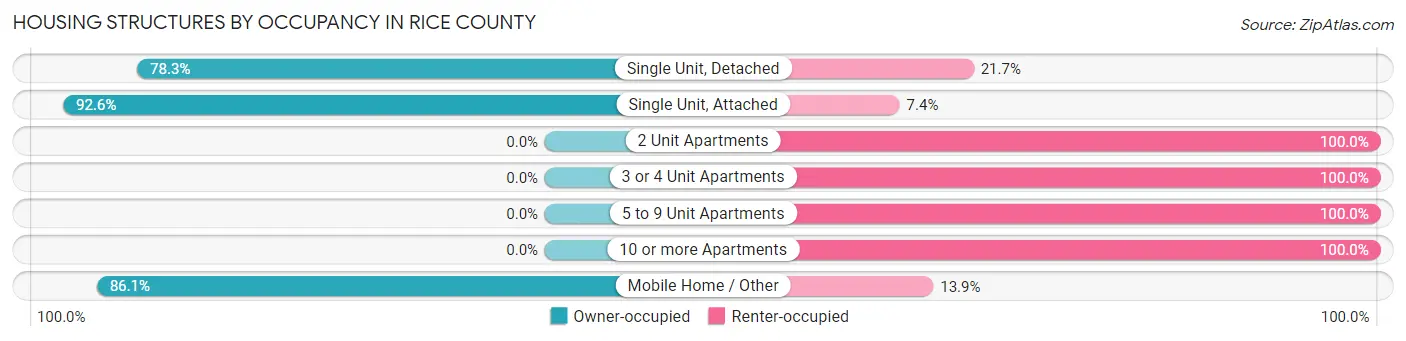
| Structure Type | Owner-occupied | Renter-occupied |
| Single Unit, Detached | 2,729 (78.3%) | 755 (21.7%) |
| Single Unit, Attached | 25 (92.6%) | 2 (7.4%) |
| 2 Unit Apartments | 0 (0.0%) | 62 (100.0%) |
| 3 or 4 Unit Apartments | 0 (0.0%) | 27 (100.0%) |
| 5 to 9 Unit Apartments | 0 (0.0%) | 11 (100.0%) |
| 10 or more Apartments | 0 (0.0%) | 44 (100.0%) |
| Mobile Home / Other | 93 (86.1%) | 15 (13.9%) |
| Total | 2,847 (75.7%) | 916 (24.3%) |
Housing Structures by Number of Rooms in Rice County
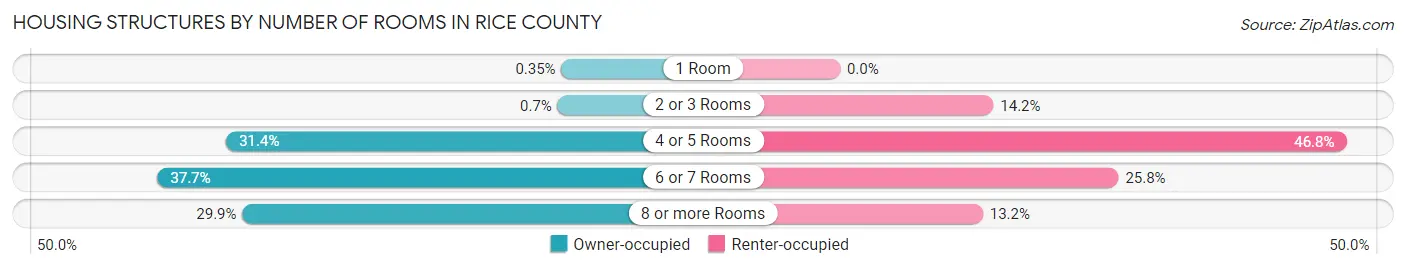
| Number of Rooms | Owner-occupied | Renter-occupied |
| 1 Room | 10 (0.4%) | 0 (0.0%) |
| 2 or 3 Rooms | 20 (0.7%) | 130 (14.2%) |
| 4 or 5 Rooms | 893 (31.4%) | 429 (46.8%) |
| 6 or 7 Rooms | 1,074 (37.7%) | 236 (25.8%) |
| 8 or more Rooms | 850 (29.9%) | 121 (13.2%) |
| Total | 2,847 (100.0%) | 916 (100.0%) |
Housing Structure by Heating Type in Rice County
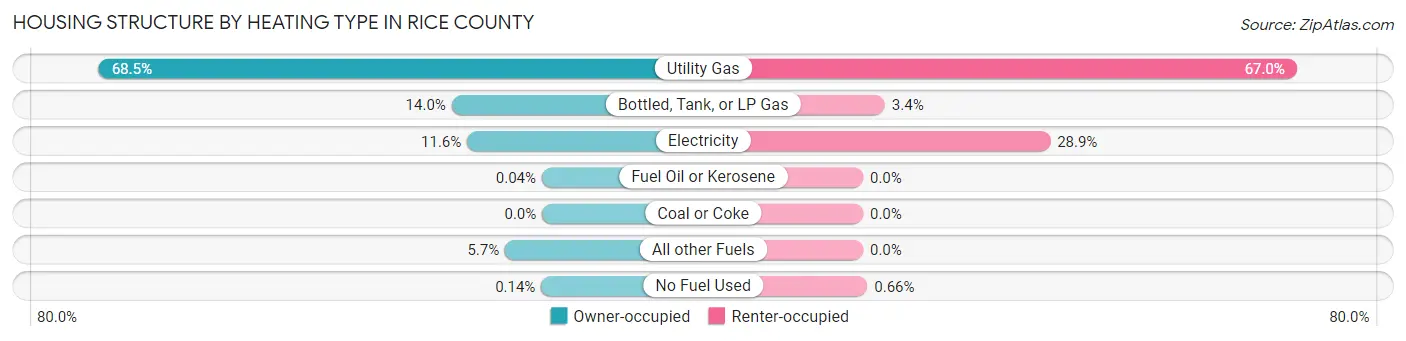
| Heating Type | Owner-occupied | Renter-occupied |
| Utility Gas | 1,951 (68.5%) | 614 (67.0%) |
| Bottled, Tank, or LP Gas | 398 (14.0%) | 31 (3.4%) |
| Electricity | 330 (11.6%) | 265 (28.9%) |
| Fuel Oil or Kerosene | 1 (0.0%) | 0 (0.0%) |
| Coal or Coke | 0 (0.0%) | 0 (0.0%) |
| All other Fuels | 163 (5.7%) | 0 (0.0%) |
| No Fuel Used | 4 (0.1%) | 6 (0.7%) |
| Total | 2,847 (100.0%) | 916 (100.0%) |
Household Vehicle Usage in Rice County
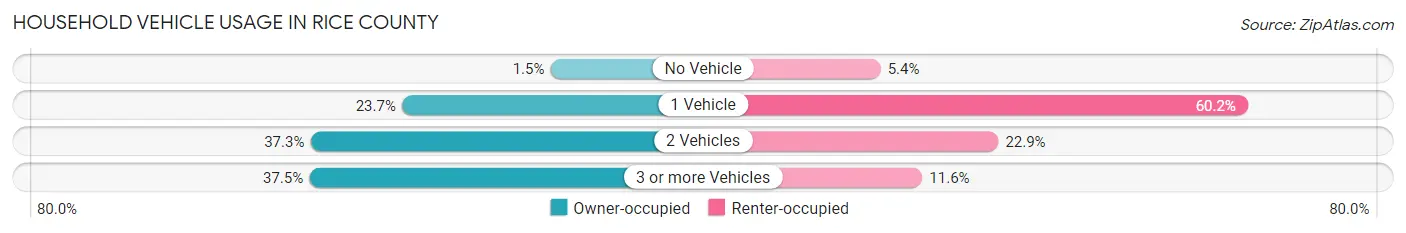
| Vehicles per Household | Owner-occupied | Renter-occupied |
| No Vehicle | 42 (1.5%) | 49 (5.3%) |
| 1 Vehicle | 674 (23.7%) | 551 (60.2%) |
| 2 Vehicles | 1,063 (37.3%) | 210 (22.9%) |
| 3 or more Vehicles | 1,068 (37.5%) | 106 (11.6%) |
| Total | 2,847 (100.0%) | 916 (100.0%) |
Real Estate & Mortgages in Rice County
Real Estate and Mortgage Overview in Rice County
| Characteristic | Without Mortgage | With Mortgage |
| Housing Units | 1,525 | 1,322 |
| Median Property Value | $64,800 | $110,900 |
| Median Household Income | $52,775 | $161 |
| Monthly Housing Costs | $438 | $4 |
| Real Estate Taxes | $1,180 | $12 |
Property Value by Mortgage Status in Rice County
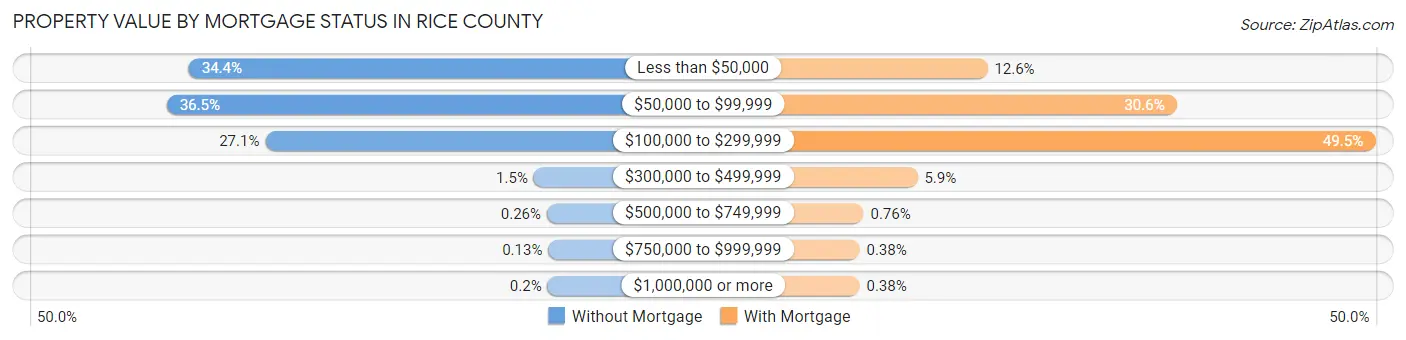
| Property Value | Without Mortgage | With Mortgage |
| Less than $50,000 | 524 (34.4%) | 166 (12.6%) |
| $50,000 to $99,999 | 556 (36.5%) | 404 (30.6%) |
| $100,000 to $299,999 | 413 (27.1%) | 654 (49.5%) |
| $300,000 to $499,999 | 23 (1.5%) | 78 (5.9%) |
| $500,000 to $749,999 | 4 (0.3%) | 10 (0.8%) |
| $750,000 to $999,999 | 2 (0.1%) | 5 (0.4%) |
| $1,000,000 or more | 3 (0.2%) | 5 (0.4%) |
| Total | 1,525 (100.0%) | 1,322 (100.0%) |
Household Income by Mortgage Status in Rice County
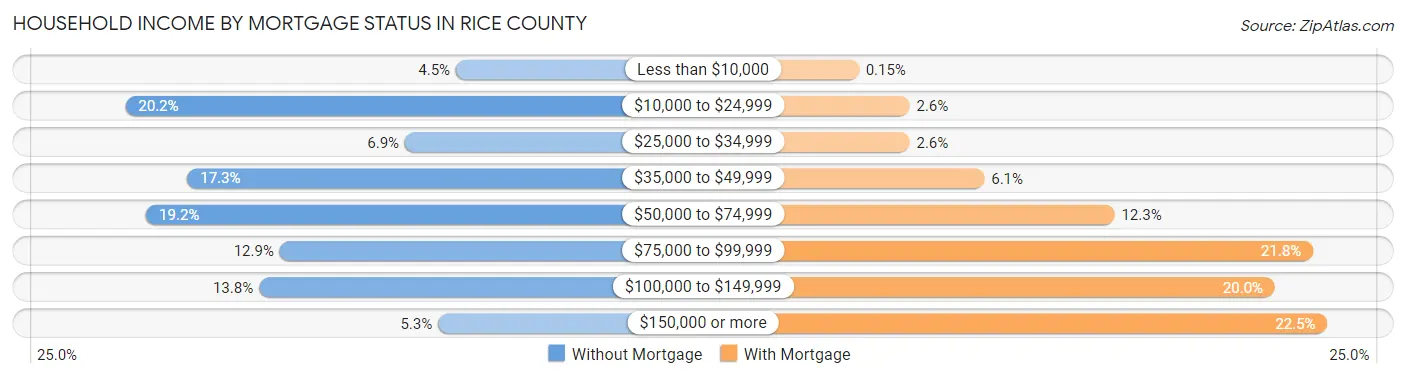
| Household Income | Without Mortgage | With Mortgage |
| Less than $10,000 | 68 (4.5%) | 2 (0.2%) |
| $10,000 to $24,999 | 308 (20.2%) | 34 (2.6%) |
| $25,000 to $34,999 | 105 (6.9%) | 34 (2.6%) |
| $35,000 to $49,999 | 263 (17.2%) | 81 (6.1%) |
| $50,000 to $74,999 | 293 (19.2%) | 163 (12.3%) |
| $75,000 to $99,999 | 196 (12.9%) | 288 (21.8%) |
| $100,000 to $149,999 | 211 (13.8%) | 264 (20.0%) |
| $150,000 or more | 81 (5.3%) | 297 (22.5%) |
| Total | 1,525 (100.0%) | 1,322 (100.0%) |
Property Value to Household Income Ratio in Rice County
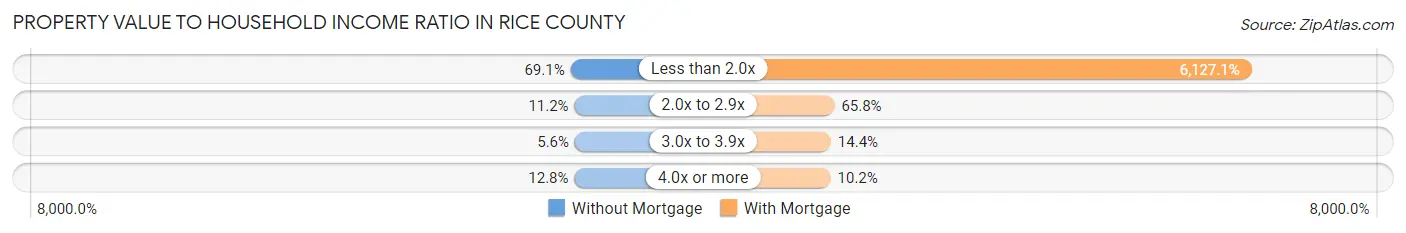
| Value-to-Income Ratio | Without Mortgage | With Mortgage |
| Less than 2.0x | 1,054 (69.1%) | 81,000 (6,127.1%) |
| 2.0x to 2.9x | 171 (11.2%) | 870 (65.8%) |
| 3.0x to 3.9x | 85 (5.6%) | 190 (14.4%) |
| 4.0x or more | 195 (12.8%) | 135 (10.2%) |
| Total | 1,525 (100.0%) | 1,322 (100.0%) |
Real Estate Taxes by Mortgage Status in Rice County
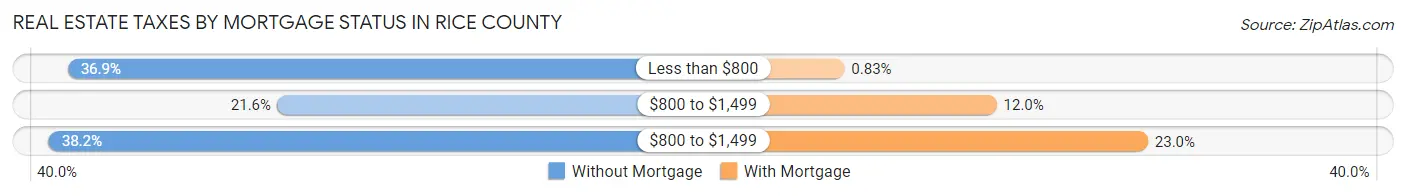
| Property Taxes | Without Mortgage | With Mortgage |
| Less than $800 | 562 (36.8%) | 11 (0.8%) |
| $800 to $1,499 | 329 (21.6%) | 158 (11.9%) |
| $800 to $1,499 | 583 (38.2%) | 304 (23.0%) |
| Total | 1,525 (100.0%) | 1,322 (100.0%) |
Health & Disability in Rice County
Health Insurance Coverage by Age in Rice County
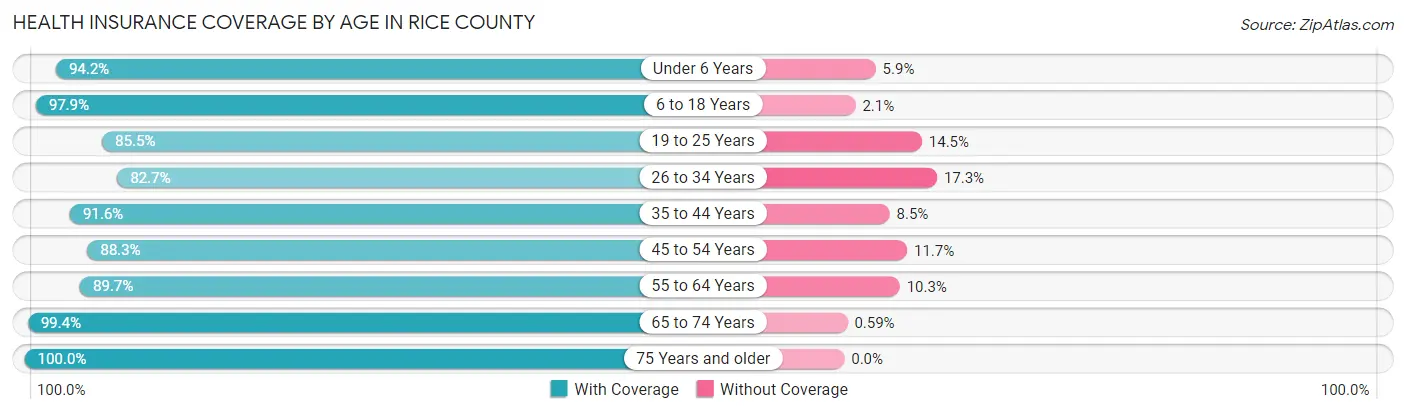
| Age Bracket | With Coverage | Without Coverage |
| Under 6 Years | 595 (94.2%) | 37 (5.9%) |
| 6 to 18 Years | 1,783 (97.9%) | 38 (2.1%) |
| 19 to 25 Years | 798 (85.5%) | 135 (14.5%) |
| 26 to 34 Years | 766 (82.7%) | 160 (17.3%) |
| 35 to 44 Years | 921 (91.5%) | 85 (8.5%) |
| 45 to 54 Years | 853 (88.3%) | 113 (11.7%) |
| 55 to 64 Years | 1,120 (89.7%) | 129 (10.3%) |
| 65 to 74 Years | 1,004 (99.4%) | 6 (0.6%) |
| 75 Years and older | 712 (100.0%) | 0 (0.0%) |
| Total | 8,552 (92.4%) | 703 (7.6%) |
Health Insurance Coverage by Citizenship Status in Rice County
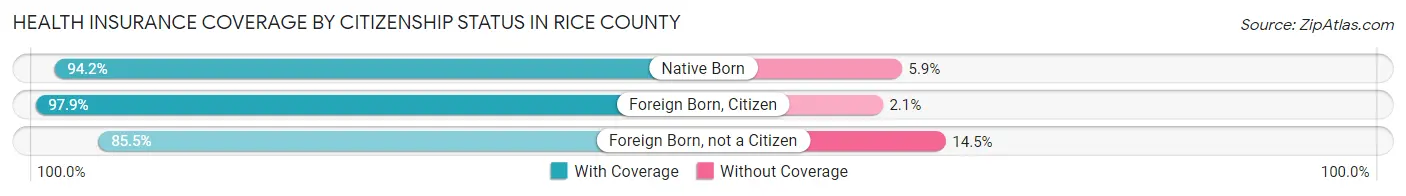
| Citizenship Status | With Coverage | Without Coverage |
| Native Born | 595 (94.2%) | 37 (5.9%) |
| Foreign Born, Citizen | 1,783 (97.9%) | 38 (2.1%) |
| Foreign Born, not a Citizen | 798 (85.5%) | 135 (14.5%) |
Health Insurance Coverage by Household Income in Rice County
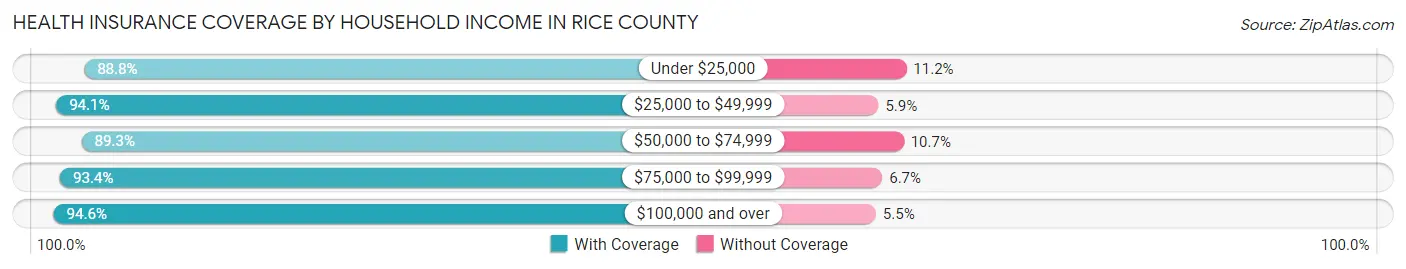
| Household Income | With Coverage | Without Coverage |
| Under $25,000 | 946 (88.8%) | 119 (11.2%) |
| $25,000 to $49,999 | 1,603 (94.1%) | 101 (5.9%) |
| $50,000 to $74,999 | 1,633 (89.3%) | 195 (10.7%) |
| $75,000 to $99,999 | 1,376 (93.3%) | 98 (6.7%) |
| $100,000 and over | 2,550 (94.6%) | 147 (5.4%) |
Public vs Private Health Insurance Coverage by Age in Rice County
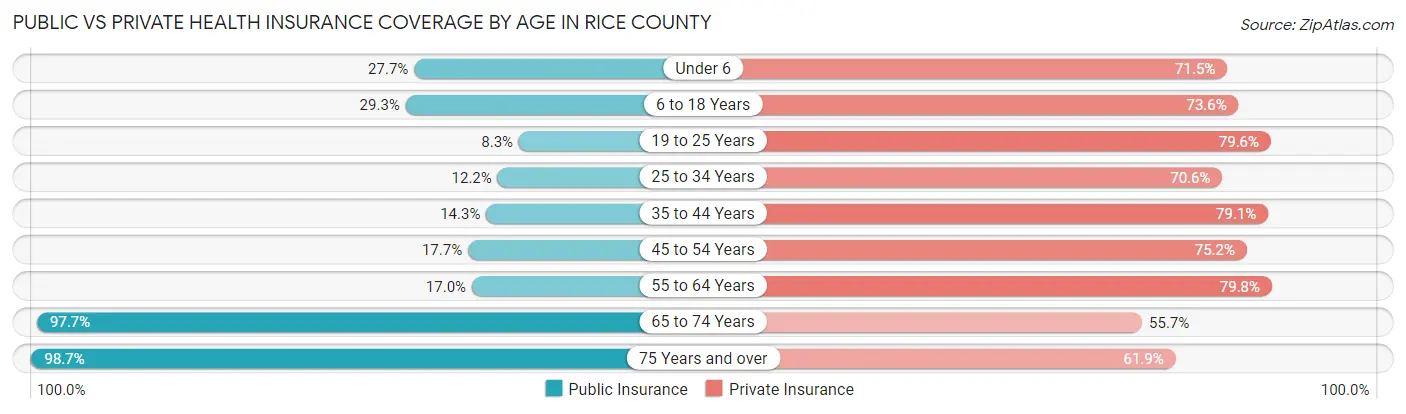
| Age Bracket | Public Insurance | Private Insurance |
| Under 6 | 175 (27.7%) | 452 (71.5%) |
| 6 to 18 Years | 533 (29.3%) | 1,341 (73.6%) |
| 19 to 25 Years | 77 (8.3%) | 743 (79.6%) |
| 25 to 34 Years | 113 (12.2%) | 654 (70.6%) |
| 35 to 44 Years | 144 (14.3%) | 796 (79.1%) |
| 45 to 54 Years | 171 (17.7%) | 726 (75.2%) |
| 55 to 64 Years | 212 (17.0%) | 997 (79.8%) |
| 65 to 74 Years | 987 (97.7%) | 563 (55.7%) |
| 75 Years and over | 703 (98.7%) | 441 (61.9%) |
| Total | 3,115 (33.7%) | 6,713 (72.5%) |
Disability Status by Sex by Age in Rice County
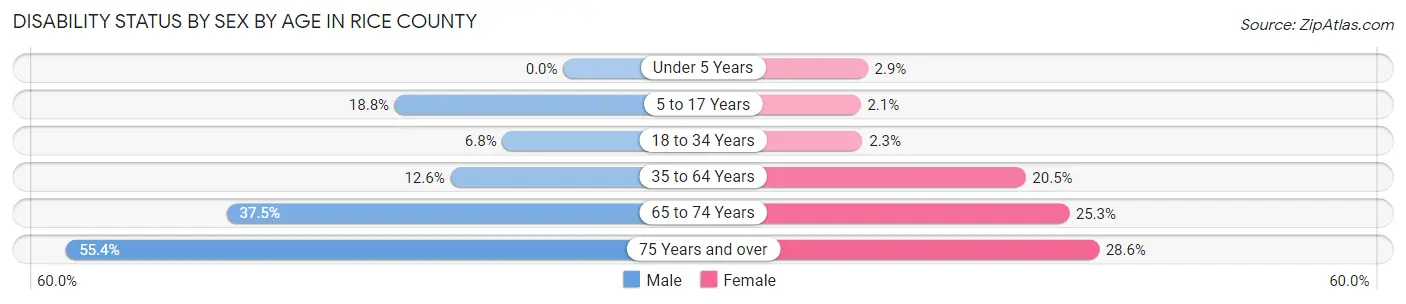
| Age Bracket | Male | Female |
| Under 5 Years | 0 (0.0%) | 7 (2.9%) |
| 5 to 17 Years | 170 (18.8%) | 16 (2.1%) |
| 18 to 34 Years | 79 (6.8%) | 22 (2.3%) |
| 35 to 64 Years | 210 (12.6%) | 317 (20.4%) |
| 65 to 74 Years | 180 (37.5%) | 134 (25.3%) |
| 75 Years and over | 160 (55.4%) | 121 (28.6%) |
Disability Class by Sex by Age in Rice County
Disability Class: Hearing Difficulty
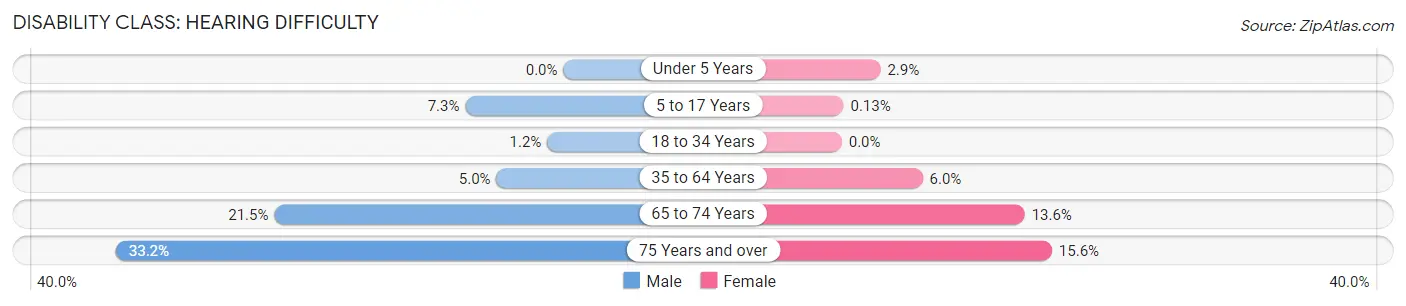
| Age Bracket | Male | Female |
| Under 5 Years | 0 (0.0%) | 7 (2.9%) |
| 5 to 17 Years | 66 (7.3%) | 1 (0.1%) |
| 18 to 34 Years | 14 (1.2%) | 0 (0.0%) |
| 35 to 64 Years | 83 (5.0%) | 93 (6.0%) |
| 65 to 74 Years | 103 (21.5%) | 72 (13.6%) |
| 75 Years and over | 96 (33.2%) | 66 (15.6%) |
Disability Class: Vision Difficulty
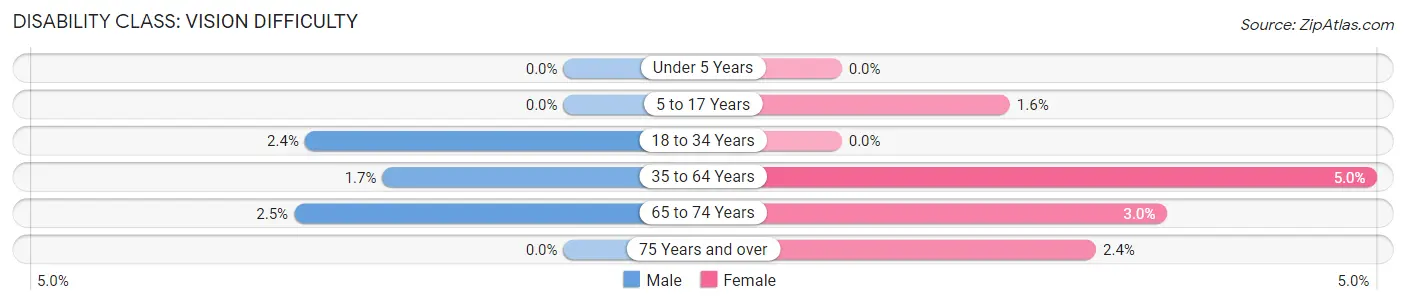
| Age Bracket | Male | Female |
| Under 5 Years | 0 (0.0%) | 0 (0.0%) |
| 5 to 17 Years | 0 (0.0%) | 12 (1.6%) |
| 18 to 34 Years | 28 (2.4%) | 0 (0.0%) |
| 35 to 64 Years | 28 (1.7%) | 77 (5.0%) |
| 65 to 74 Years | 12 (2.5%) | 16 (3.0%) |
| 75 Years and over | 0 (0.0%) | 10 (2.4%) |
Disability Class: Cognitive Difficulty
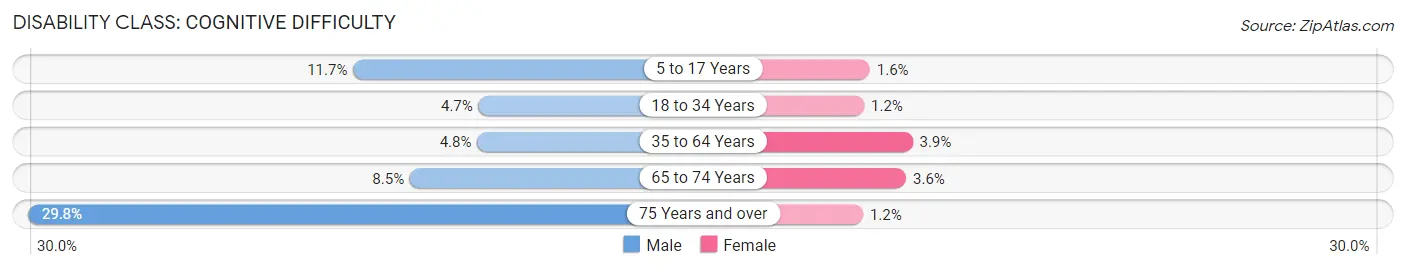
| Age Bracket | Male | Female |
| 5 to 17 Years | 106 (11.7%) | 12 (1.6%) |
| 18 to 34 Years | 55 (4.7%) | 12 (1.2%) |
| 35 to 64 Years | 80 (4.8%) | 61 (3.9%) |
| 65 to 74 Years | 41 (8.5%) | 19 (3.6%) |
| 75 Years and over | 86 (29.8%) | 5 (1.2%) |
Disability Class: Ambulatory Difficulty
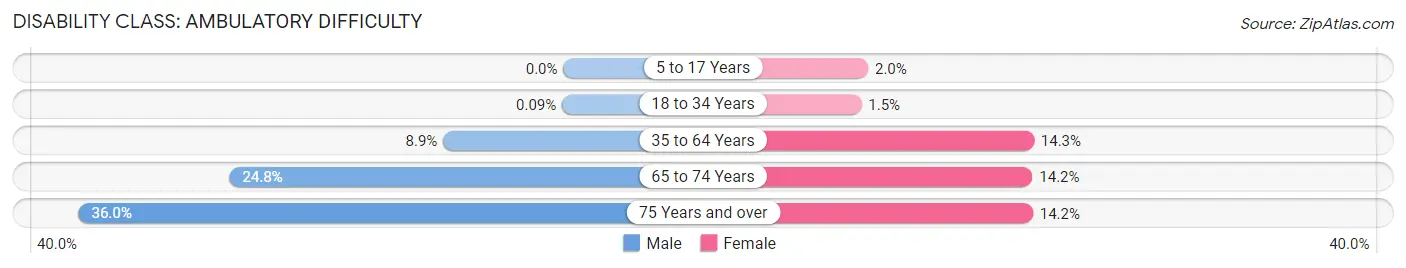
| Age Bracket | Male | Female |
| 5 to 17 Years | 0 (0.0%) | 15 (1.9%) |
| 18 to 34 Years | 1 (0.1%) | 14 (1.5%) |
| 35 to 64 Years | 149 (8.9%) | 221 (14.3%) |
| 65 to 74 Years | 119 (24.8%) | 75 (14.1%) |
| 75 Years and over | 104 (36.0%) | 60 (14.2%) |
Disability Class: Self-Care Difficulty
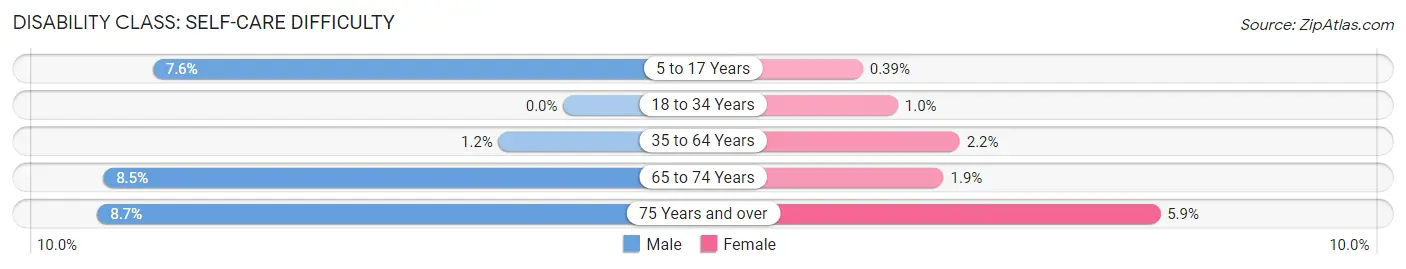
| Age Bracket | Male | Female |
| 5 to 17 Years | 69 (7.6%) | 3 (0.4%) |
| 18 to 34 Years | 0 (0.0%) | 10 (1.0%) |
| 35 to 64 Years | 20 (1.2%) | 34 (2.2%) |
| 65 to 74 Years | 41 (8.5%) | 10 (1.9%) |
| 75 Years and over | 25 (8.6%) | 25 (5.9%) |
Technology Access in Rice County
Computing Device Access in Rice County
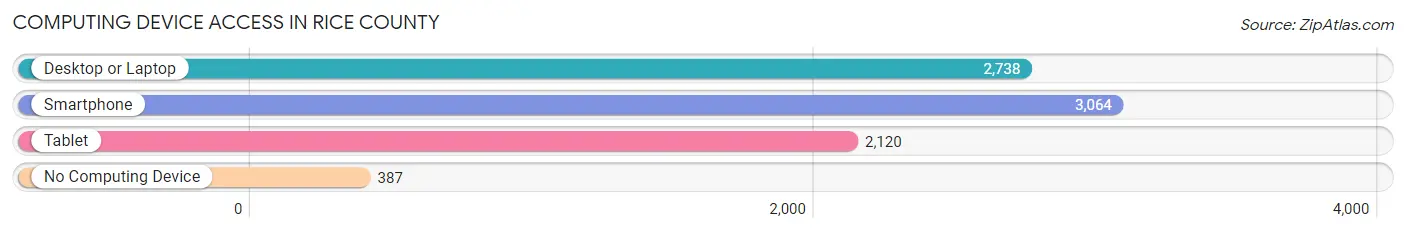
| Device Type | # Households | % Households |
| Desktop or Laptop | 2,738 | 72.8% |
| Smartphone | 3,064 | 81.4% |
| Tablet | 2,120 | 56.3% |
| No Computing Device | 387 | 10.3% |
| Total | 3,763 | 100.0% |
Internet Access in Rice County
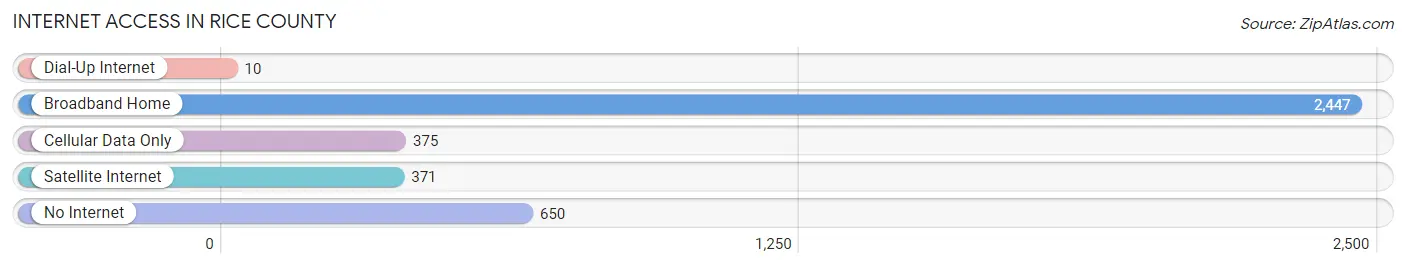
| Internet Type | # Households | % Households |
| Dial-Up Internet | 10 | 0.3% |
| Broadband Home | 2,447 | 65.0% |
| Cellular Data Only | 375 | 10.0% |
| Satellite Internet | 371 | 9.9% |
| No Internet | 650 | 17.3% |
| Total | 3,763 | 100.0% |
Rice County Summary
Rice County, Kansas is located in the north-central part of the state, and is bordered by Ellsworth, McPherson, Reno, Stafford, and Barton counties. The county seat is Lyons, and the largest city is Sterling. Rice County was established in 1867 and named after Samuel A. Rice, a Union Army officer who was killed in the Civil War.
Geography
Rice County is located in the Great Plains region of the United States. The county has a total area of 845 square miles, of which 844 square miles is land and 1 square mile is water. The county is mostly flat, with some rolling hills in the eastern part. The Arkansas River runs through the county, and there are several small creeks and streams. The climate is semi-arid, with hot summers and cold winters.
Demographics
As of the 2010 census, the population of Rice County was 10,183. The racial makeup of the county was 94.3% White, 0.7% Black or African American, 0.5% Native American, 0.3% Asian, 0.1% Pacific Islander, 2.7% from other races, and 1.4% from two or more races. Hispanic or Latino of any race were 5.3% of the population.
Economy
Rice County is primarily an agricultural county, with the main crops being wheat, corn, and sorghum. The county also has a strong manufacturing sector, with companies such as Cessna, John Deere, and Caterpillar having plants in the area. The county also has a growing tourism industry, with attractions such as the Rice County Historical Museum and the Rice County Fair.
History
Rice County was established in 1867 and named after Samuel A. Rice, a Union Army officer who was killed in the Civil War. The county was originally populated by Native Americans, and the first white settlers arrived in the late 1860s. The county was primarily an agricultural area, with wheat, corn, and sorghum being the main crops. The county also had a strong manufacturing sector, with companies such as Cessna, John Deere, and Caterpillar having plants in the area.
In the early 20th century, the county experienced a population boom, with the population increasing from 4,000 in 1900 to 10,000 in 1920. The county also experienced a period of economic growth, with the manufacturing sector expanding and new businesses opening. The county also experienced a period of cultural growth, with the opening of the Rice County Historical Museum in the 1920s.
Today, Rice County is a thriving agricultural and manufacturing county. The county has a strong tourism industry, with attractions such as the Rice County Historical Museum and the Rice County Fair. The county also has a growing population, with the population increasing from 10,000 in 2000 to 10,183 in 2010.
Common Questions
What is Per Capita Income in Rice County?
Per Capita income in Rice County is $32,074.
What is the Median Family Income in Rice County?
Median Family Income in Rice County is $71,782.
What is the Median Household income in Rice County?
Median Household Income in Rice County is $58,523.
What is Income or Wage Gap in Rice County?
Income or Wage Gap in Rice County is 37.8%.
Women in Rice County earn 62.2 cents for every dollar earned by a man.
What is Family Income Deficit in Rice County?
Family Income Deficit in Rice County is $9,435.
Families that are below poverty line in Rice County earn $9,435 less on average than the poverty threshold level.
What is Inequality or Gini Index in Rice County?
Inequality or Gini Index in Rice County is 0.42.
What is the Total Population of Rice County?
Total Population of Rice County is 9,441.
What is the Total Male Population of Rice County?
Total Male Population of Rice County is 4,857.
What is the Total Female Population of Rice County?
Total Female Population of Rice County is 4,584.
What is the Ratio of Males per 100 Females in Rice County?
There are 105.96 Males per 100 Females in Rice County.
What is the Ratio of Females per 100 Males in Rice County?
There are 94.38 Females per 100 Males in Rice County.
What is the Median Population Age in Rice County?
Median Population Age in Rice County is 39.0 Years.
What is the Average Family Size in Rice County
Average Family Size in Rice County is 3.0 People.
What is the Average Household Size in Rice County
Average Household Size in Rice County is 2.3 People.
How Large is the Labor Force in Rice County?
There are 4,550 People in the Labor Forcein in Rice County.
What is the Percentage of People in the Labor Force in Rice County?
60.5% of People are in the Labor Force in Rice County.
What is the Unemployment Rate in Rice County?
Unemployment Rate in Rice County is 3.6%.