Rawlins County, KS Map & Demographics
Rawlins County Map
Rawlins County Overview
$33,003
PER CAPITA INCOME
$77,847
AVG FAMILY INCOME
$61,827
AVG HOUSEHOLD INCOME
39.1%
WAGE / INCOME GAP [ % ]
60.9¢/ $1
WAGE / INCOME GAP [ $ ]
0.41
INEQUALITY / GINI INDEX
2,544
TOTAL POPULATION
1,304
MALE POPULATION
1,240
FEMALE POPULATION
105.16
MALES / 100 FEMALES
95.09
FEMALES / 100 MALES
46.2
MEDIAN AGE
2.7
AVG FAMILY SIZE
2.1
AVG HOUSEHOLD SIZE
1,357
LABOR FORCE [ PEOPLE ]
66.9%
PERCENT IN LABOR FORCE
1.0%
UNEMPLOYMENT RATE
Rawlins County Area Codes
Income in Rawlins County
Income Overview in Rawlins County
Per Capita Income in Rawlins County is $33,003, while median incomes of families and households are $77,847 and $61,827 respectively.
| Characteristic | Number | Measure |
| Per Capita Income | 2,544 | $33,003 |
| Median Family Income | 741 | $77,847 |
| Mean Family Income | 741 | $84,604 |
| Median Household Income | 1,165 | $61,827 |
| Mean Household Income | 1,165 | $71,305 |
| Income Deficit | 741 | $0 |
| Wage / Income Gap (%) | 2,544 | 39.08% |
| Wage / Income Gap ($) | 2,544 | 60.92¢ per $1 |
| Gini / Inequality Index | 2,544 | 0.41 |
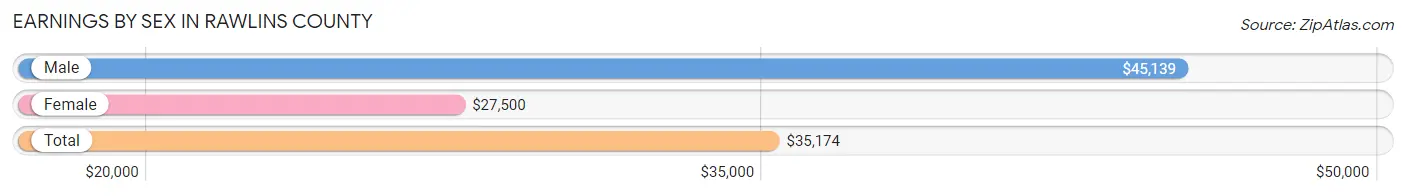
Earnings by Sex in Rawlins County
Average Earnings in Rawlins County are $35,174, $45,139 for men and $27,500 for women, a difference of 39.1%.
| Sex | Number | Average Earnings |
| Male | 792 (55.8%) | $45,139 |
| Female | 626 (44.2%) | $27,500 |
| Total | 1,418 (100.0%) | $35,174 |
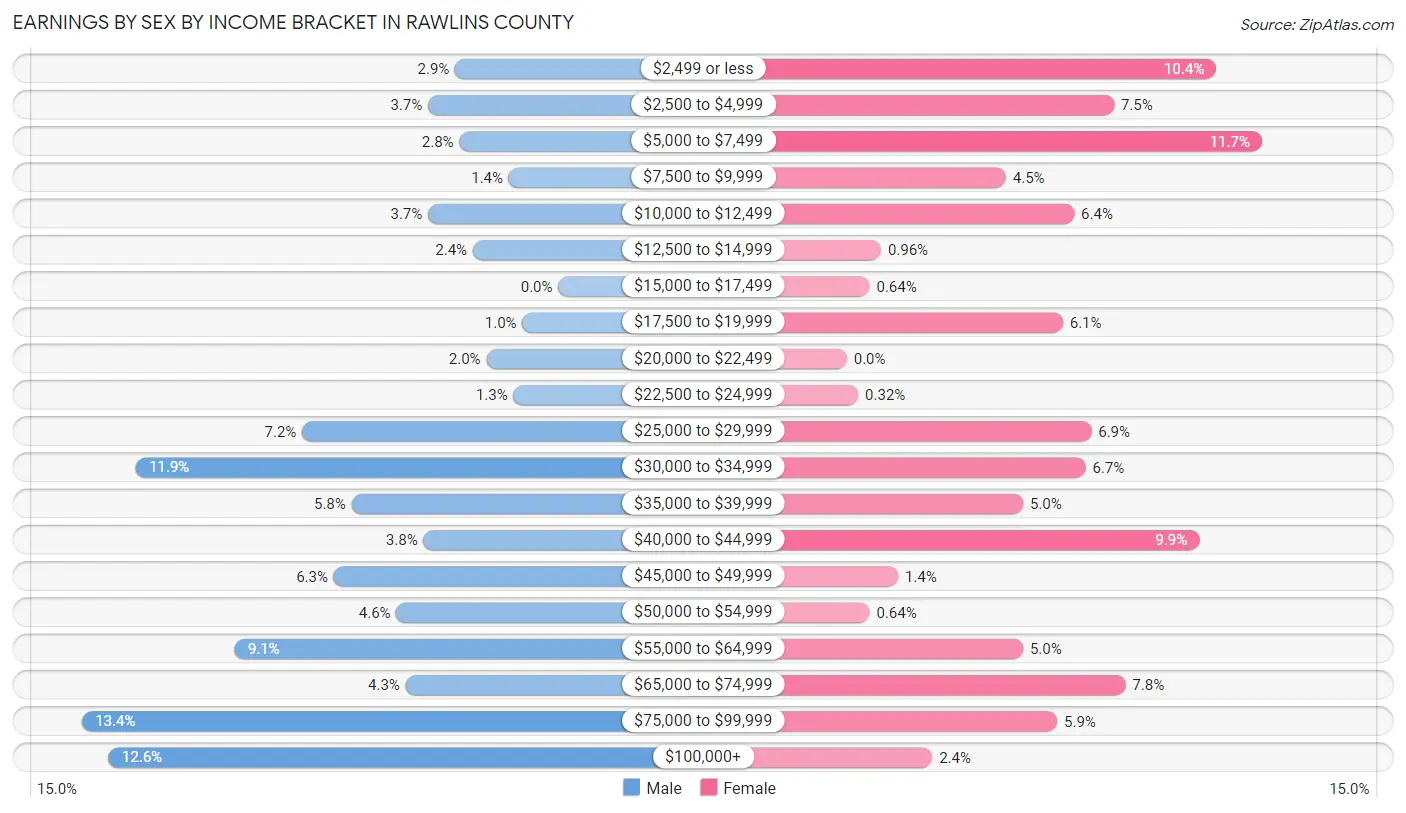
Earnings by Sex by Income Bracket in Rawlins County
The most common earnings brackets in Rawlins County are $75,000 to $99,999 for men (106 | 13.4%) and $5,000 to $7,499 for women (73 | 11.7%).
| Income | Male | Female |
| $2,499 or less | 23 (2.9%) | 65 (10.4%) |
| $2,500 to $4,999 | 29 (3.7%) | 47 (7.5%) |
| $5,000 to $7,499 | 22 (2.8%) | 73 (11.7%) |
| $7,500 to $9,999 | 11 (1.4%) | 28 (4.5%) |
| $10,000 to $12,499 | 29 (3.7%) | 40 (6.4%) |
| $12,500 to $14,999 | 19 (2.4%) | 6 (1.0%) |
| $15,000 to $17,499 | 0 (0.0%) | 4 (0.6%) |
| $17,500 to $19,999 | 8 (1.0%) | 38 (6.1%) |
| $20,000 to $22,499 | 16 (2.0%) | 0 (0.0%) |
| $22,500 to $24,999 | 10 (1.3%) | 2 (0.3%) |
| $25,000 to $29,999 | 57 (7.2%) | 43 (6.9%) |
| $30,000 to $34,999 | 94 (11.9%) | 42 (6.7%) |
| $35,000 to $39,999 | 46 (5.8%) | 31 (5.0%) |
| $40,000 to $44,999 | 30 (3.8%) | 62 (9.9%) |
| $45,000 to $49,999 | 50 (6.3%) | 9 (1.4%) |
| $50,000 to $54,999 | 36 (4.5%) | 4 (0.6%) |
| $55,000 to $64,999 | 72 (9.1%) | 31 (5.0%) |
| $65,000 to $74,999 | 34 (4.3%) | 49 (7.8%) |
| $75,000 to $99,999 | 106 (13.4%) | 37 (5.9%) |
| $100,000+ | 100 (12.6%) | 15 (2.4%) |
| Total | 792 (100.0%) | 626 (100.0%) |
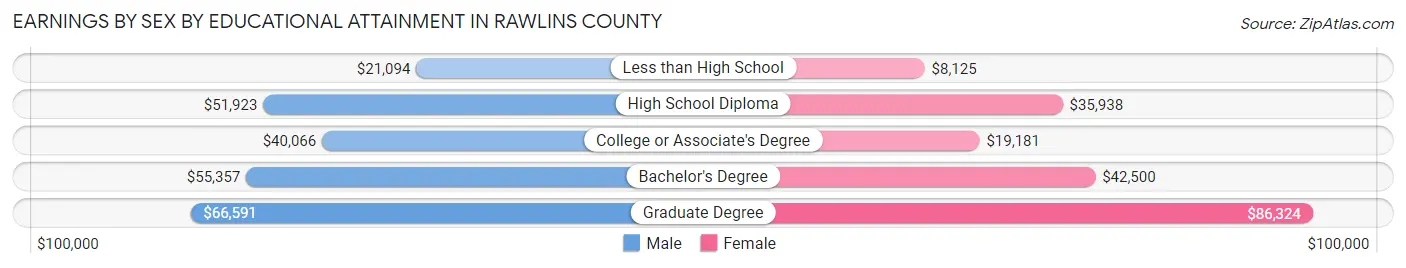
Earnings by Sex by Educational Attainment in Rawlins County
Average earnings in Rawlins County are $46,424 for men and $28,295 for women, a difference of 39.1%. Men with an educational attainment of graduate degree enjoy the highest average annual earnings of $66,591, while those with less than high school education earn the least with $21,094. Women with an educational attainment of graduate degree earn the most with the average annual earnings of $86,324, while those with less than high school education have the smallest earnings of $8,125.
| Educational Attainment | Male Income | Female Income |
| Less than High School | $21,094 | $8,125 |
| High School Diploma | $51,923 | $35,938 |
| College or Associate's Degree | $40,066 | $19,181 |
| Bachelor's Degree | $55,357 | $42,500 |
| Graduate Degree | $66,591 | $86,324 |
| Total | $46,424 | $28,295 |
Family Income in Rawlins County
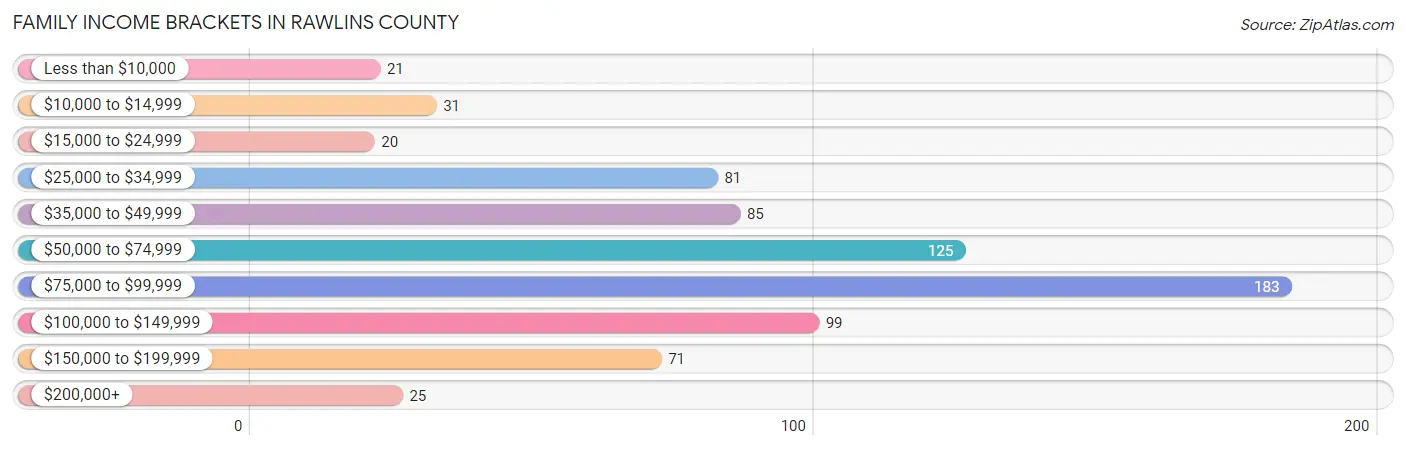
Family Income Brackets in Rawlins County
According to the Rawlins County family income data, there are 183 families falling into the $75,000 to $99,999 income range, which is the most common income bracket and makes up 24.7% of all families. Conversely, the $15,000 to $24,999 income bracket is the least frequent group with only 20 families (2.7%) belonging to this category.
| Income Bracket | # Families | % Families |
| Less than $10,000 | 21 | 2.8% |
| $10,000 to $14,999 | 31 | 4.2% |
| $15,000 to $24,999 | 20 | 2.7% |
| $25,000 to $34,999 | 81 | 10.9% |
| $35,000 to $49,999 | 85 | 11.5% |
| $50,000 to $74,999 | 125 | 16.9% |
| $75,000 to $99,999 | 183 | 24.7% |
| $100,000 to $149,999 | 99 | 13.4% |
| $150,000 to $199,999 | 71 | 9.6% |
| $200,000+ | 25 | 3.4% |
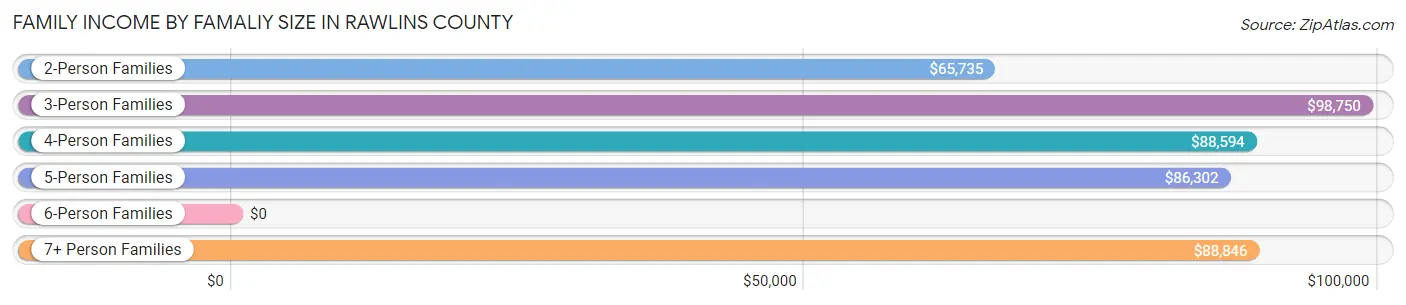
Family Income by Famaliy Size in Rawlins County
3-person families (109 | 14.7%) account for the highest median family income in Rawlins County with $98,750 per family, while 3-person families (109 | 14.7%) have the highest median income of $32,917 per family member.
| Income Bracket | # Families | Median Income |
| 2-Person Families | 430 (58.0%) | $65,735 |
| 3-Person Families | 109 (14.7%) | $98,750 |
| 4-Person Families | 93 (12.6%) | $88,594 |
| 5-Person Families | 63 (8.5%) | $86,302 |
| 6-Person Families | 0 (0.0%) | $0 |
| 7+ Person Families | 46 (6.2%) | $88,846 |
| Total | 741 (100.0%) | $77,847 |
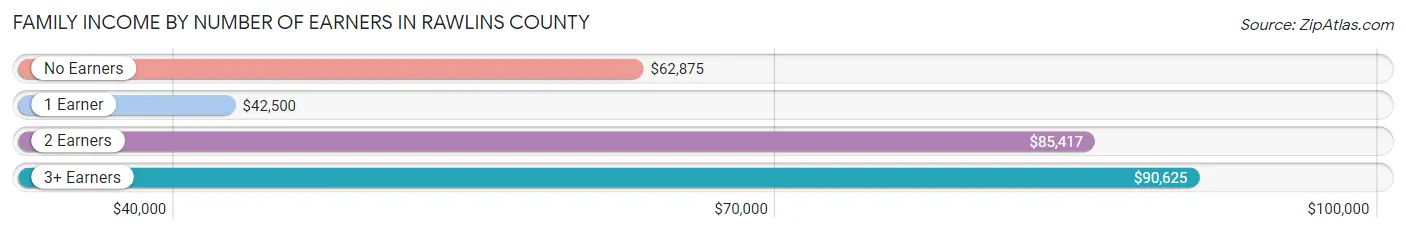
Family Income by Number of Earners in Rawlins County
The median family income in Rawlins County is $77,847, with families comprising 3+ earners (43) having the highest median family income of $90,625, while families with 1 earner (190) have the lowest median family income of $42,500, accounting for 5.8% and 25.6% of families, respectively.
| Number of Earners | # Families | Median Income |
| No Earners | 111 (15.0%) | $62,875 |
| 1 Earner | 190 (25.6%) | $42,500 |
| 2 Earners | 397 (53.6%) | $85,417 |
| 3+ Earners | 43 (5.8%) | $90,625 |
| Total | 741 (100.0%) | $77,847 |
Household Income in Rawlins County
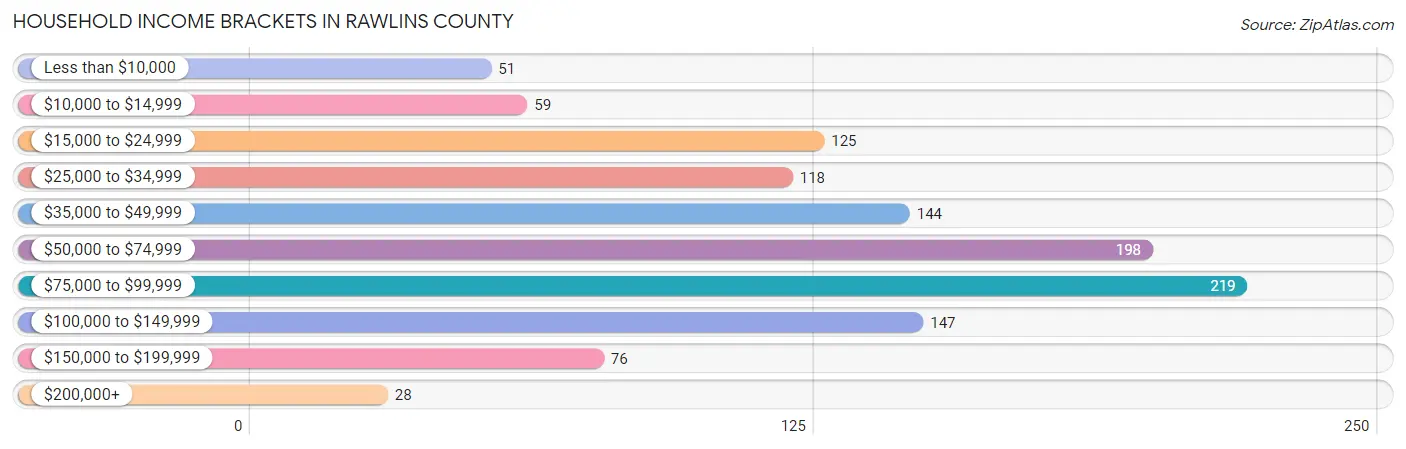
Household Income Brackets in Rawlins County
With 219 households falling in the category, the $75,000 to $99,999 income range is the most frequent in Rawlins County, accounting for 18.8% of all households. In contrast, only 28 households (2.4%) fall into the $200,000+ income bracket, making it the least populous group.
| Income Bracket | # Households | % Households |
| Less than $10,000 | 51 | 4.4% |
| $10,000 to $14,999 | 59 | 5.1% |
| $15,000 to $24,999 | 125 | 10.7% |
| $25,000 to $34,999 | 118 | 10.1% |
| $35,000 to $49,999 | 144 | 12.4% |
| $50,000 to $74,999 | 198 | 17.0% |
| $75,000 to $99,999 | 219 | 18.8% |
| $100,000 to $149,999 | 147 | 12.6% |
| $150,000 to $199,999 | 76 | 6.5% |
| $200,000+ | 28 | 2.4% |
Household Income by Householder Age in Rawlins County
The median household income in Rawlins County is $61,827, with the highest median household income of $67,188 found in the 25 to 44 years age bracket for the primary householder. A total of 297 households (25.5%) fall into this category. Meanwhile, the 65+ years age bracket for the primary householder has the lowest median household income of $51,719, with 408 households (35.0%) in this group.
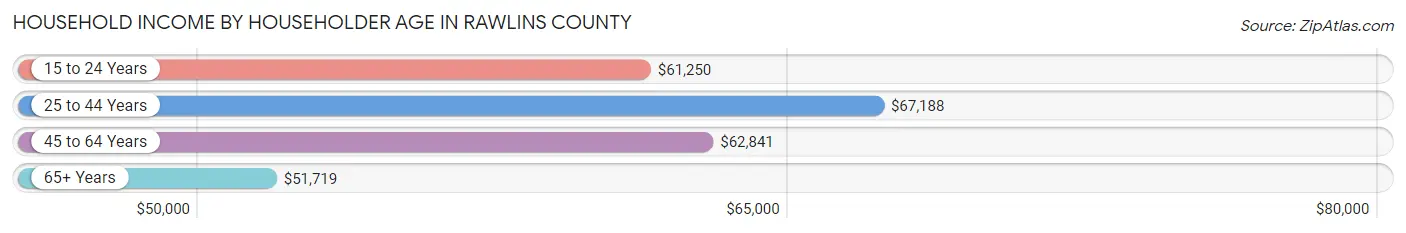
| Income Bracket | # Households | Median Income |
| 15 to 24 Years | 49 (4.2%) | $61,250 |
| 25 to 44 Years | 297 (25.5%) | $67,188 |
| 45 to 64 Years | 411 (35.3%) | $62,841 |
| 65+ Years | 408 (35.0%) | $51,719 |
| Total | 1,165 (100.0%) | $61,827 |
Poverty in Rawlins County
Income Below Poverty by Sex and Age in Rawlins County
With 10.5% poverty level for males and 11.3% for females among the residents of Rawlins County, 5 year old males and 5 year old females are the most vulnerable to poverty, with 8 males (80.0%) and 3 females (30.0%) in their respective age groups living below the poverty level.
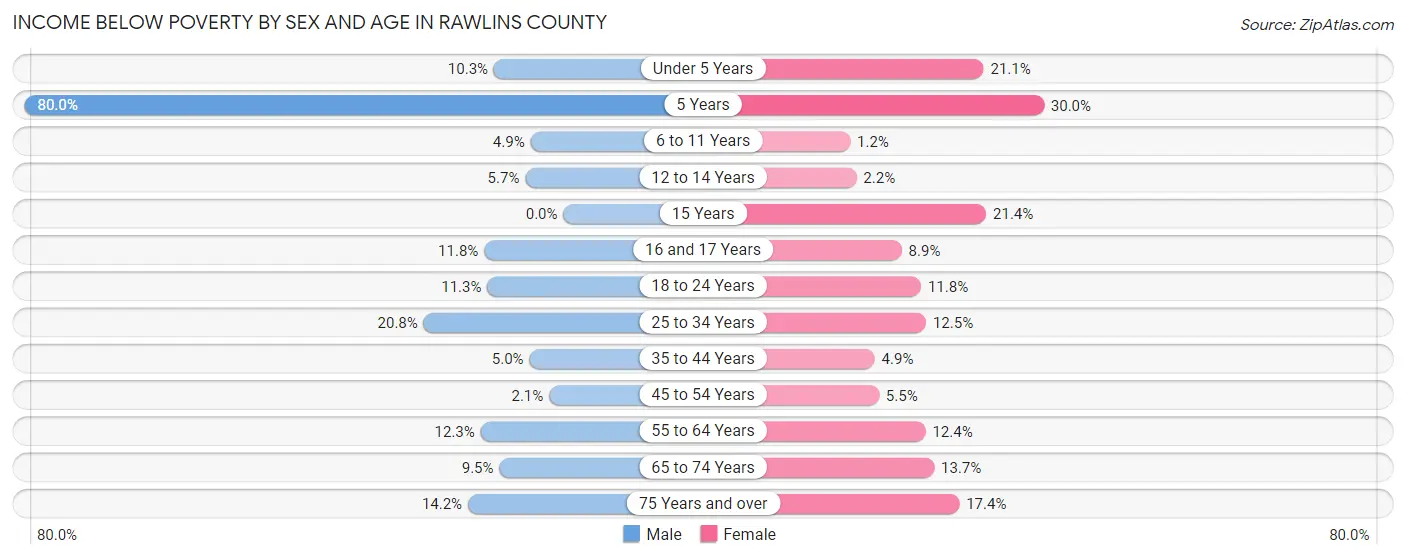
| Age Bracket | Male | Female |
| Under 5 Years | 10 (10.3%) | 16 (21.0%) |
| 5 Years | 8 (80.0%) | 3 (30.0%) |
| 6 to 11 Years | 6 (4.9%) | 1 (1.2%) |
| 12 to 14 Years | 3 (5.7%) | 1 (2.2%) |
| 15 Years | 0 (0.0%) | 3 (21.4%) |
| 16 and 17 Years | 2 (11.8%) | 4 (8.9%) |
| 18 to 24 Years | 7 (11.3%) | 6 (11.8%) |
| 25 to 34 Years | 33 (20.7%) | 16 (12.5%) |
| 35 to 44 Years | 7 (5.0%) | 6 (4.9%) |
| 45 to 54 Years | 3 (2.1%) | 7 (5.5%) |
| 55 to 64 Years | 22 (12.3%) | 21 (12.4%) |
| 65 to 74 Years | 17 (9.5%) | 24 (13.7%) |
| 75 Years and over | 18 (14.2%) | 30 (17.4%) |
| Total | 136 (10.5%) | 138 (11.3%) |
Income Above Poverty by Sex and Age in Rawlins County
According to the poverty statistics in Rawlins County, males aged 15 years and females aged 6 to 11 years are the age groups that are most secure financially, with 100.0% of males and 98.8% of females in these age groups living above the poverty line.
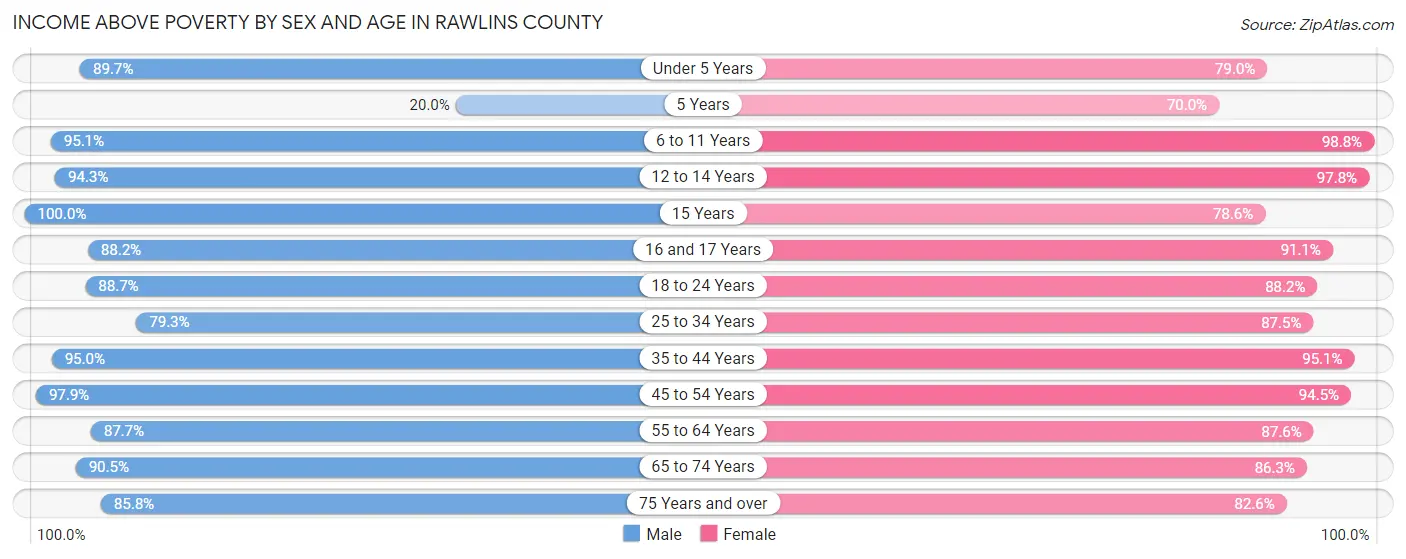
| Age Bracket | Male | Female |
| Under 5 Years | 87 (89.7%) | 60 (78.9%) |
| 5 Years | 2 (20.0%) | 7 (70.0%) |
| 6 to 11 Years | 117 (95.1%) | 80 (98.8%) |
| 12 to 14 Years | 50 (94.3%) | 45 (97.8%) |
| 15 Years | 5 (100.0%) | 11 (78.6%) |
| 16 and 17 Years | 15 (88.2%) | 41 (91.1%) |
| 18 to 24 Years | 55 (88.7%) | 45 (88.2%) |
| 25 to 34 Years | 126 (79.2%) | 112 (87.5%) |
| 35 to 44 Years | 132 (95.0%) | 117 (95.1%) |
| 45 to 54 Years | 139 (97.9%) | 120 (94.5%) |
| 55 to 64 Years | 157 (87.7%) | 148 (87.6%) |
| 65 to 74 Years | 162 (90.5%) | 151 (86.3%) |
| 75 Years and over | 109 (85.8%) | 142 (82.6%) |
| Total | 1,156 (89.5%) | 1,079 (88.7%) |
Income Below Poverty Among Married-Couple Families in Rawlins County
The poverty statistics for married-couple families in Rawlins County show that 7.2% or 44 of the total 611 families live below the poverty line. Families with no children have the highest poverty rate of 10.9%, comprising of 39 families. On the other hand, families with 1 or 2 children have the lowest poverty rate of 0.0%, which includes 0 families.
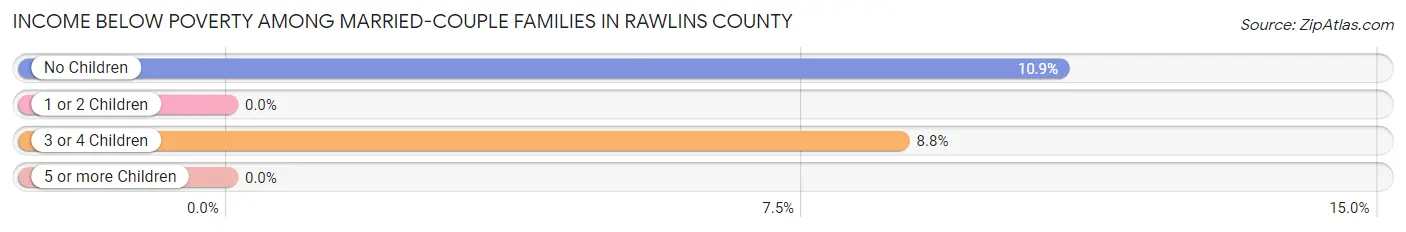
| Children | Above Poverty | Below Poverty |
| No Children | 320 (89.1%) | 39 (10.9%) |
| 1 or 2 Children | 151 (100.0%) | 0 (0.0%) |
| 3 or 4 Children | 52 (91.2%) | 5 (8.8%) |
| 5 or more Children | 44 (100.0%) | 0 (0.0%) |
| Total | 567 (92.8%) | 44 (7.2%) |
Income Below Poverty Among Single-Parent Households in Rawlins County
According to the poverty data in Rawlins County, 10.1% or 8 single-father households and 31.4% or 16 single-mother households are living below the poverty line. Among single-father households, those with no children have the highest poverty rate, with 3 households (27.3%) experiencing poverty. Likewise, among single-mother households, those with 3 or 4 children have the highest poverty rate, with 8 households (100.0%) falling below the poverty line.
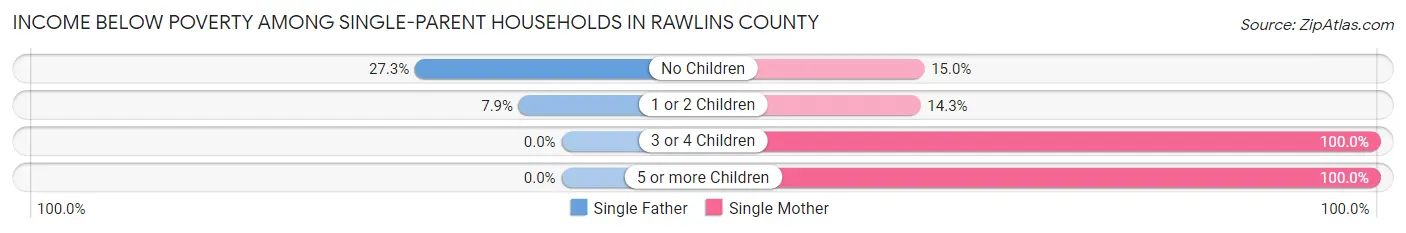
| Children | Single Father | Single Mother |
| No Children | 3 (27.3%) | 3 (15.0%) |
| 1 or 2 Children | 5 (7.9%) | 3 (14.3%) |
| 3 or 4 Children | 0 (0.0%) | 8 (100.0%) |
| 5 or more Children | 0 (0.0%) | 2 (100.0%) |
| Total | 8 (10.1%) | 16 (31.4%) |
Income Below Poverty Among Married-Couple vs Single-Parent Households in Rawlins County
The poverty data for Rawlins County shows that 44 of the married-couple family households (7.2%) and 24 of the single-parent households (18.5%) are living below the poverty level. Within the married-couple family households, those with no children have the highest poverty rate, with 39 households (10.9%) falling below the poverty line. Among the single-parent households, those with 5 or more children have the highest poverty rate, with 2 household (100.0%) living below poverty.
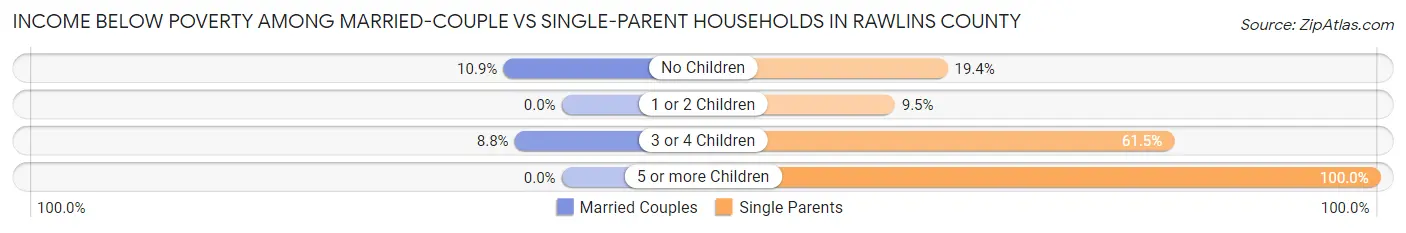
| Children | Married-Couple Families | Single-Parent Households |
| No Children | 39 (10.9%) | 6 (19.4%) |
| 1 or 2 Children | 0 (0.0%) | 8 (9.5%) |
| 3 or 4 Children | 5 (8.8%) | 8 (61.5%) |
| 5 or more Children | 0 (0.0%) | 2 (100.0%) |
| Total | 44 (7.2%) | 24 (18.5%) |
Race in Rawlins County
The most populous races in Rawlins County are White / Caucasian (2,362 | 92.8%), Hispanic or Latino (197 | 7.7%), and Some other Race (73 | 2.9%).
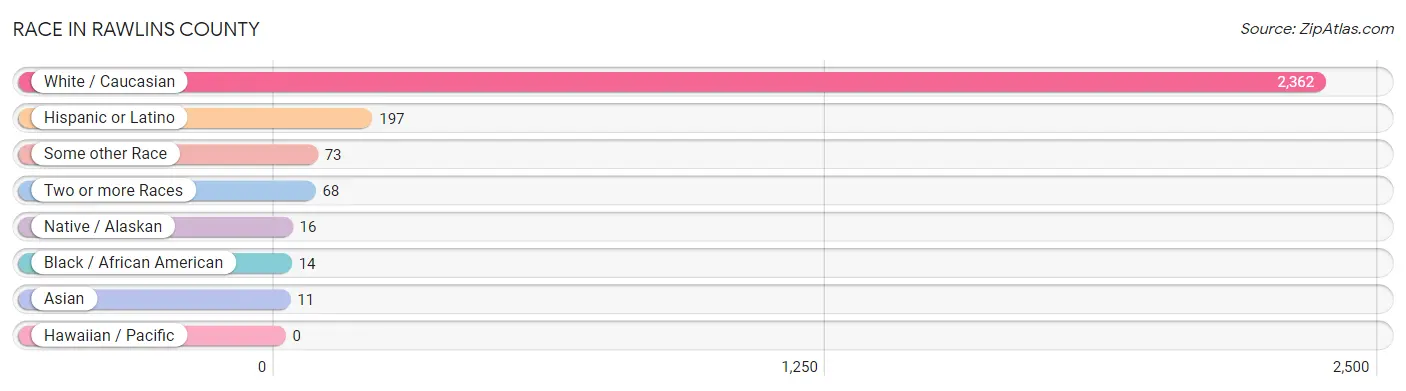
| Race | # Population | % Population |
| Asian | 11 | 0.4% |
| Black / African American | 14 | 0.5% |
| Hawaiian / Pacific | 0 | 0.0% |
| Hispanic or Latino | 197 | 7.7% |
| Native / Alaskan | 16 | 0.6% |
| White / Caucasian | 2,362 | 92.8% |
| Two or more Races | 68 | 2.7% |
| Some other Race | 73 | 2.9% |
| Total | 2,544 | 100.0% |
Ancestry in Rawlins County
The most populous ancestries reported in Rawlins County are German (945 | 37.1%), Czech (242 | 9.5%), English (220 | 8.6%), Irish (194 | 7.6%), and American (156 | 6.1%), together accounting for 69.1% of all Rawlins County residents.
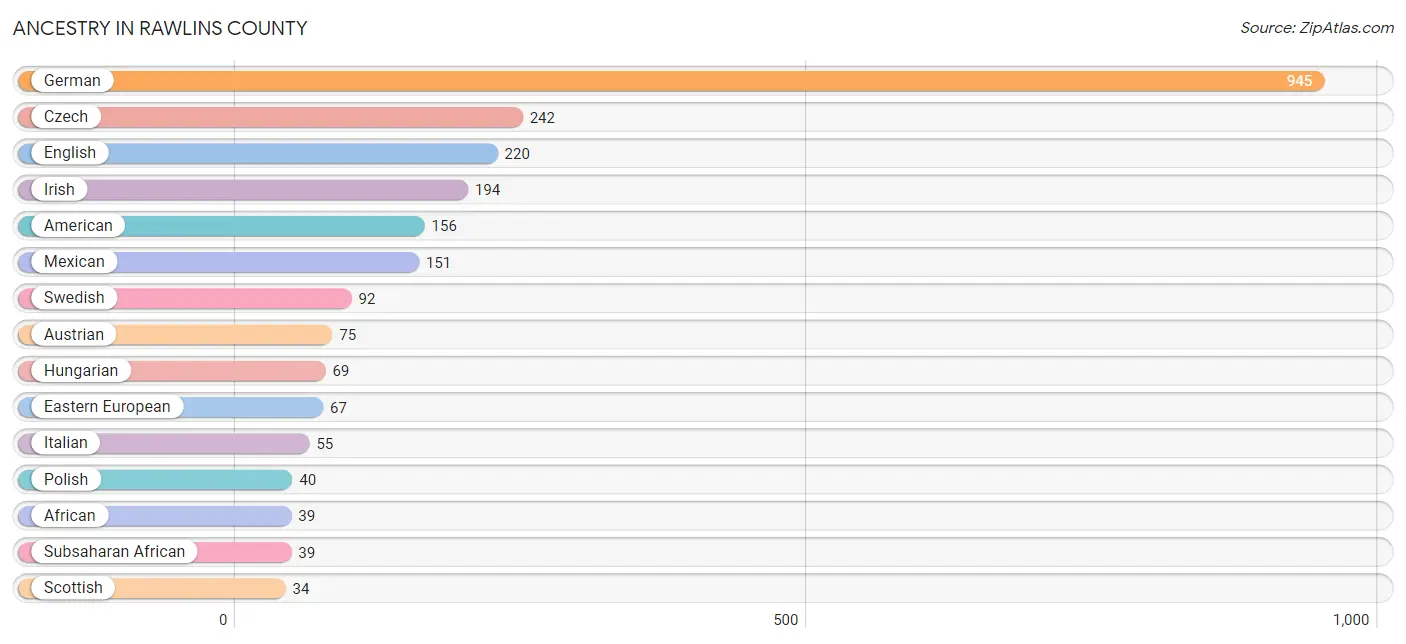
| Ancestry | # Population | % Population |
| African | 39 | 1.5% |
| American | 156 | 6.1% |
| Austrian | 75 | 2.9% |
| Belgian | 5 | 0.2% |
| British | 9 | 0.4% |
| Burmese | 1 | 0.0% |
| Central American | 4 | 0.2% |
| Cherokee | 9 | 0.4% |
| Cheyenne | 1 | 0.0% |
| Cuban | 6 | 0.2% |
| Czech | 242 | 9.5% |
| Czechoslovakian | 4 | 0.2% |
| Danish | 3 | 0.1% |
| Dutch | 24 | 0.9% |
| Eastern European | 67 | 2.6% |
| English | 220 | 8.6% |
| European | 5 | 0.2% |
| French | 28 | 1.1% |
| French Canadian | 2 | 0.1% |
| German | 945 | 37.1% |
| Greek | 3 | 0.1% |
| Guatemalan | 4 | 0.2% |
| Haitian | 1 | 0.0% |
| Hungarian | 69 | 2.7% |
| Indian (Asian) | 10 | 0.4% |
| Irish | 194 | 7.6% |
| Italian | 55 | 2.2% |
| Korean | 5 | 0.2% |
| Mexican | 151 | 5.9% |
| Navajo | 11 | 0.4% |
| Norwegian | 24 | 0.9% |
| Polish | 40 | 1.6% |
| Puerto Rican | 32 | 1.3% |
| Russian | 25 | 1.0% |
| Scandinavian | 5 | 0.2% |
| Scotch-Irish | 12 | 0.5% |
| Scottish | 34 | 1.3% |
| Subsaharan African | 39 | 1.5% |
| Swedish | 92 | 3.6% |
| Welsh | 28 | 1.1% | View All 40 Rows |
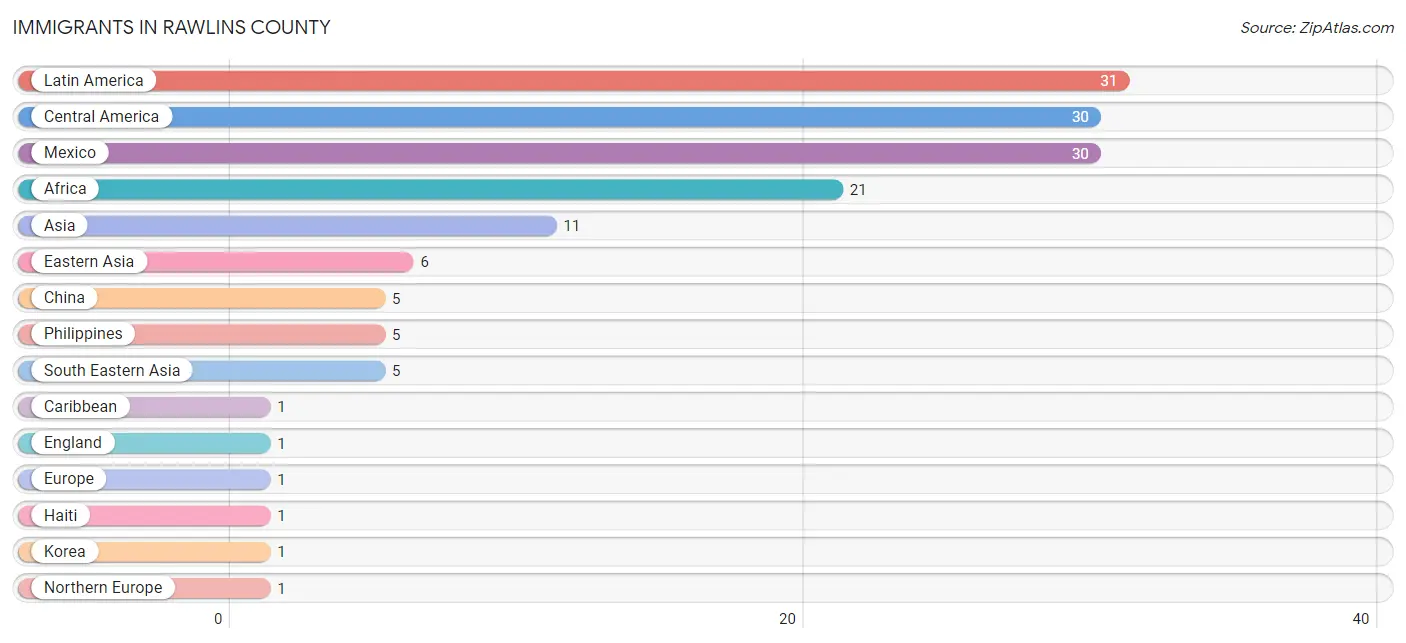
Immigrants in Rawlins County
The most numerous immigrant groups reported in Rawlins County came from Latin America (31 | 1.2%), Central America (30 | 1.2%), Mexico (30 | 1.2%), Africa (21 | 0.8%), and Asia (11 | 0.4%), together accounting for 4.8% of all Rawlins County residents.
| Immigration Origin | # Population | % Population |
| Africa | 21 | 0.8% |
| Asia | 11 | 0.4% |
| Caribbean | 1 | 0.0% |
| Central America | 30 | 1.2% |
| China | 5 | 0.2% |
| Eastern Asia | 6 | 0.2% |
| England | 1 | 0.0% |
| Europe | 1 | 0.0% |
| Haiti | 1 | 0.0% |
| Korea | 1 | 0.0% |
| Latin America | 31 | 1.2% |
| Mexico | 30 | 1.2% |
| Northern Europe | 1 | 0.0% |
| Philippines | 5 | 0.2% |
| South Eastern Asia | 5 | 0.2% | View All 15 Rows |
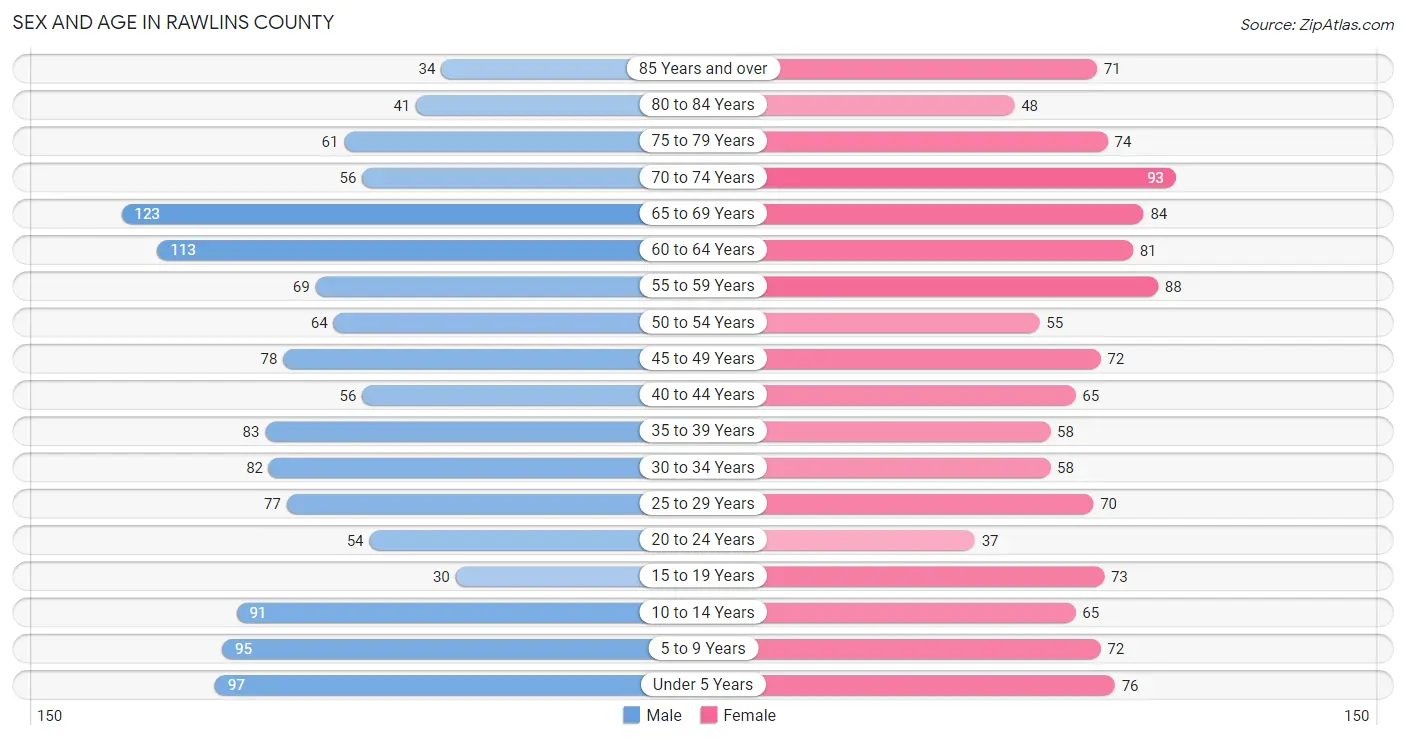
Sex and Age in Rawlins County
Sex and Age in Rawlins County
The most populous age groups in Rawlins County are 65 to 69 Years (123 | 9.4%) for men and 70 to 74 Years (93 | 7.5%) for women.
| Age Bracket | Male | Female |
| Under 5 Years | 97 (7.4%) | 76 (6.1%) |
| 5 to 9 Years | 95 (7.3%) | 72 (5.8%) |
| 10 to 14 Years | 91 (7.0%) | 65 (5.2%) |
| 15 to 19 Years | 30 (2.3%) | 73 (5.9%) |
| 20 to 24 Years | 54 (4.1%) | 37 (3.0%) |
| 25 to 29 Years | 77 (5.9%) | 70 (5.7%) |
| 30 to 34 Years | 82 (6.3%) | 58 (4.7%) |
| 35 to 39 Years | 83 (6.4%) | 58 (4.7%) |
| 40 to 44 Years | 56 (4.3%) | 65 (5.2%) |
| 45 to 49 Years | 78 (6.0%) | 72 (5.8%) |
| 50 to 54 Years | 64 (4.9%) | 55 (4.4%) |
| 55 to 59 Years | 69 (5.3%) | 88 (7.1%) |
| 60 to 64 Years | 113 (8.7%) | 81 (6.5%) |
| 65 to 69 Years | 123 (9.4%) | 84 (6.8%) |
| 70 to 74 Years | 56 (4.3%) | 93 (7.5%) |
| 75 to 79 Years | 61 (4.7%) | 74 (6.0%) |
| 80 to 84 Years | 41 (3.1%) | 48 (3.9%) |
| 85 Years and over | 34 (2.6%) | 71 (5.7%) |
| Total | 1,304 (100.0%) | 1,240 (100.0%) |
Families and Households in Rawlins County
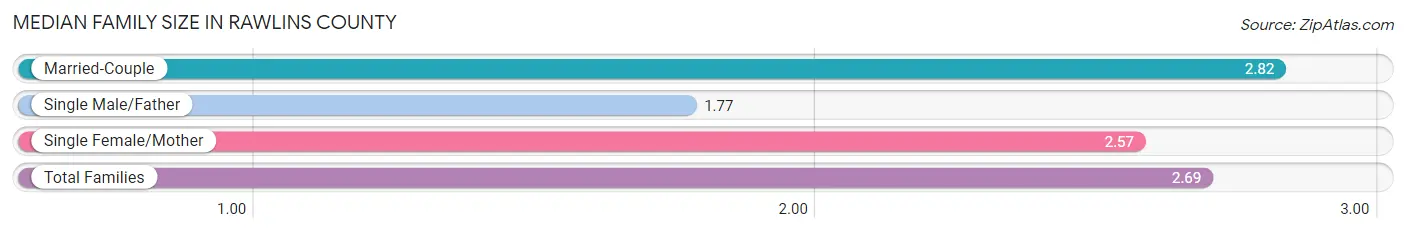
Median Family Size in Rawlins County
The median family size in Rawlins County is 2.69 persons per family, with married-couple families (611 | 82.5%) accounting for the largest median family size of 2.82 persons per family. On the other hand, single male/father families (79 | 10.7%) represent the smallest median family size with 1.77 persons per family.
| Family Type | # Families | Family Size |
| Married-Couple | 611 (82.5%) | 2.82 |
| Single Male/Father | 79 (10.7%) | 1.77 |
| Single Female/Mother | 51 (6.9%) | 2.57 |
| Total Families | 741 (100.0%) | 2.69 |
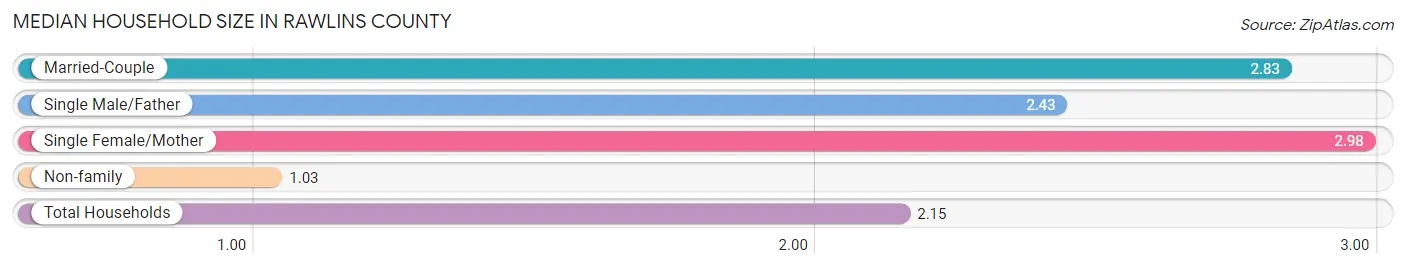
Median Household Size in Rawlins County
The median household size in Rawlins County is 2.15 persons per household, with single female/mother households (51 | 4.4%) accounting for the largest median household size of 2.98 persons per household. non-family households (424 | 36.4%) represent the smallest median household size with 1.03 persons per household.
| Household Type | # Households | Household Size |
| Married-Couple | 611 (52.4%) | 2.83 |
| Single Male/Father | 79 (6.8%) | 2.43 |
| Single Female/Mother | 51 (4.4%) | 2.98 |
| Non-family | 424 (36.4%) | 1.03 |
| Total Households | 1,165 (100.0%) | 2.15 |
Household Size by Marriage Status in Rawlins County
Out of a total of 1,165 households in Rawlins County, 741 (63.6%) are family households, while 424 (36.4%) are nonfamily households. The most numerous type of family households are 2-person households, comprising 379, and the most common type of nonfamily households are 1-person households, comprising 409.
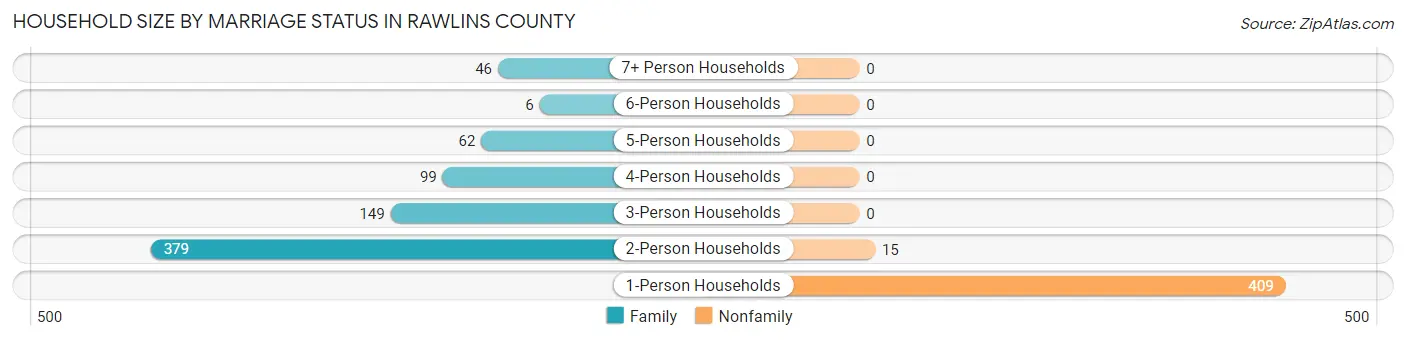
| Household Size | Family Households | Nonfamily Households |
| 1-Person Households | - | 409 (35.1%) |
| 2-Person Households | 379 (32.5%) | 15 (1.3%) |
| 3-Person Households | 149 (12.8%) | 0 (0.0%) |
| 4-Person Households | 99 (8.5%) | 0 (0.0%) |
| 5-Person Households | 62 (5.3%) | 0 (0.0%) |
| 6-Person Households | 6 (0.5%) | 0 (0.0%) |
| 7+ Person Households | 46 (4.0%) | 0 (0.0%) |
| Total | 741 (63.6%) | 424 (36.4%) |
Female Fertility in Rawlins County
Fertility by Age in Rawlins County
Average fertility rate in Rawlins County is 65.0 births per 1,000 women. Women in the age bracket of 20 to 34 years have the highest fertility rate with 176.0 births per 1,000 women. Women in the age bracket of 20 to 34 years acount for 100.0% of all women with births.
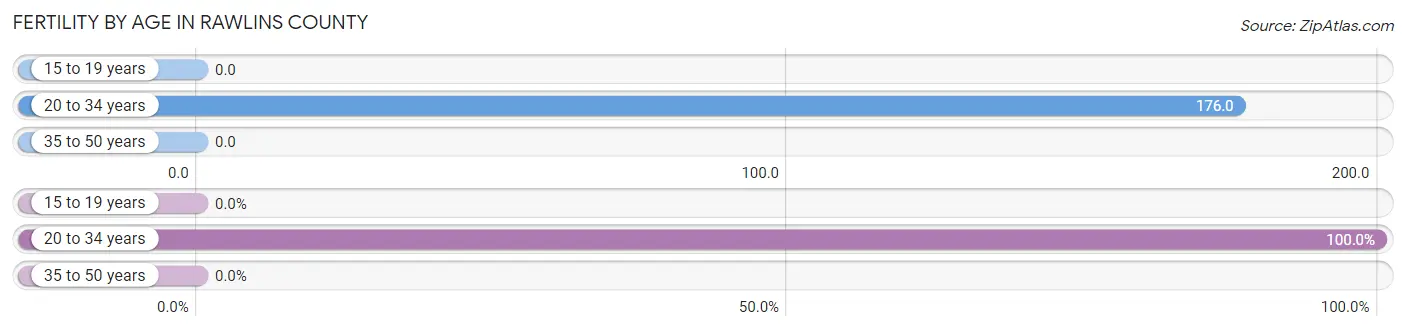
| Age Bracket | Women with Births | Births / 1,000 Women |
| 15 to 19 years | 0 (0.0%) | 0.0 |
| 20 to 34 years | 29 (100.0%) | 176.0 |
| 35 to 50 years | 0 (0.0%) | 0.0 |
| Total | 29 (100.0%) | 65.0 |
Fertility by Age by Marriage Status in Rawlins County
79.3% of women with births (29) in Rawlins County are married. The highest percentage of unmarried women with births falls into 20 to 34 years age bracket with 20.7% of them unmarried at the time of birth, while the lowest percentage of unmarried women with births belong to 20 to 34 years age bracket with 20.7% of them unmarried.
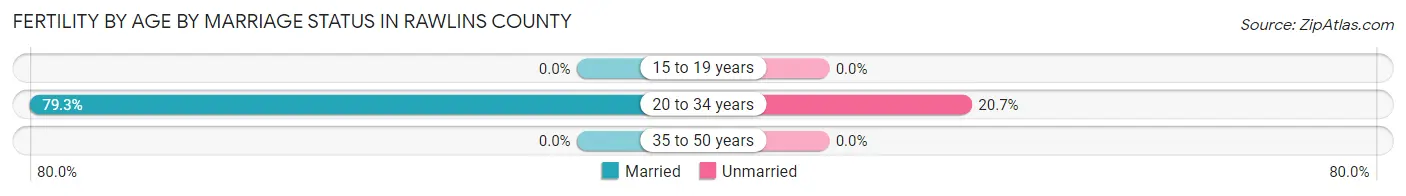
| Age Bracket | Married | Unmarried |
| 15 to 19 years | 0 (0.0%) | 0 (0.0%) |
| 20 to 34 years | 23 (79.3%) | 6 (20.7%) |
| 35 to 50 years | 0 (0.0%) | 0 (0.0%) |
| Total | 23 (79.3%) | 6 (20.7%) |
Fertility by Education in Rawlins County
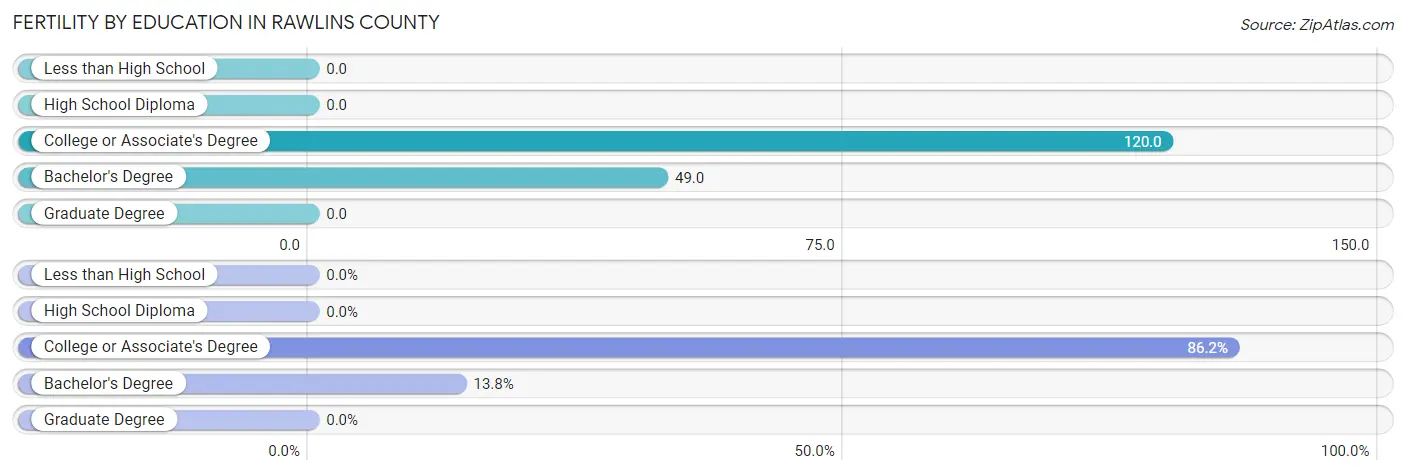
| Educational Attainment | Women with Births | Births / 1,000 Women |
| Less than High School | 0 (0.0%) | 0.0 |
| High School Diploma | 0 (0.0%) | 0.0 |
| College or Associate's Degree | 25 (86.2%) | 120.0 |
| Bachelor's Degree | 4 (13.8%) | 49.0 |
| Graduate Degree | 0 (0.0%) | 0.0 |
| Total | 29 (100.0%) | 65.0 |
Fertility by Education by Marriage Status in Rawlins County
20.7% of women with births in Rawlins County are unmarried. Women with the educational attainment of bachelor's degree are most likely to be married with 100.0% of them married at childbirth, while women with the educational attainment of college or associate's degree are least likely to be married with 24.0% of them unmarried at childbirth.
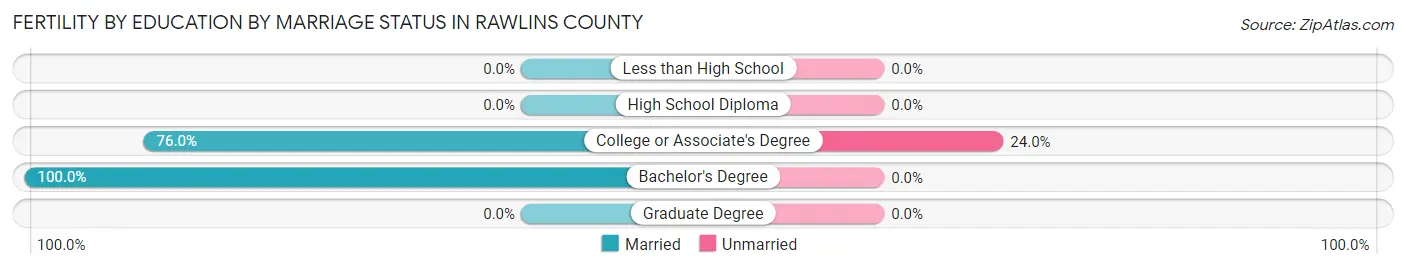
| Educational Attainment | Married | Unmarried |
| Less than High School | 0 (0.0%) | 0 (0.0%) |
| High School Diploma | 0 (0.0%) | 0 (0.0%) |
| College or Associate's Degree | 19 (76.0%) | 6 (24.0%) |
| Bachelor's Degree | 4 (100.0%) | 0 (0.0%) |
| Graduate Degree | 0 (0.0%) | 0 (0.0%) |
| Total | 23 (79.3%) | 6 (20.7%) |
Employment Characteristics in Rawlins County
Employment by Class of Employer in Rawlins County
Among the 1,294 employed individuals in Rawlins County, private company employees (739 | 57.1%), self-employed (not incorporated) (166 | 12.8%), and local government employees (157 | 12.1%) make up the most common classes of employment.
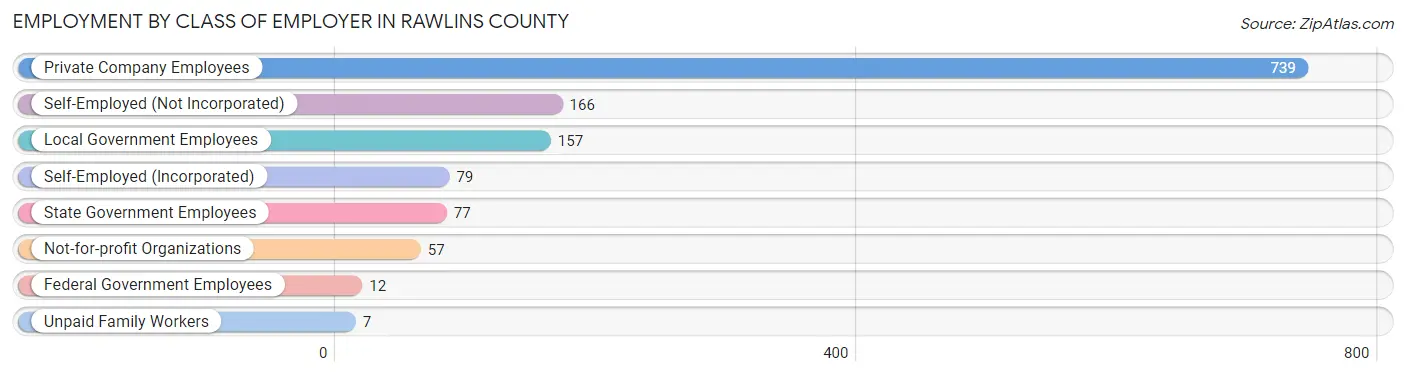
| Employer Class | # Employees | % Employees |
| Private Company Employees | 739 | 57.1% |
| Self-Employed (Incorporated) | 79 | 6.1% |
| Self-Employed (Not Incorporated) | 166 | 12.8% |
| Not-for-profit Organizations | 57 | 4.4% |
| Local Government Employees | 157 | 12.1% |
| State Government Employees | 77 | 5.9% |
| Federal Government Employees | 12 | 0.9% |
| Unpaid Family Workers | 7 | 0.5% |
| Total | 1,294 | 100.0% |
Employment Status by Age in Rawlins County
According to the labor force statistics for Rawlins County, out of the total population over 16 years of age (2,029), 66.9% or 1,357 individuals are in the labor force, with 1.0% or 14 of them unemployed. The age group with the highest labor force participation rate is 30 to 34 years, with 98.6% or 138 individuals in the labor force. Within the labor force, the 16 to 19 years age range has the highest percentage of unemployed individuals, with 37.0% or 10 of them being unemployed.
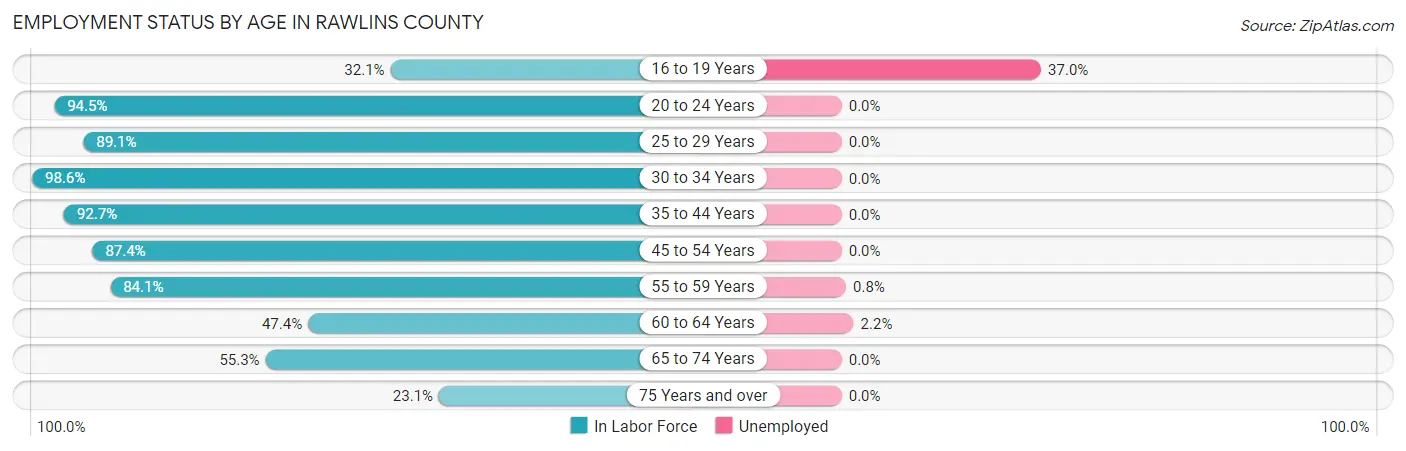
| Age Bracket | In Labor Force | Unemployed |
| 16 to 19 Years | 27 (32.1%) | 10 (37.0%) |
| 20 to 24 Years | 86 (94.5%) | 0 (0.0%) |
| 25 to 29 Years | 131 (89.1%) | 0 (0.0%) |
| 30 to 34 Years | 138 (98.6%) | 0 (0.0%) |
| 35 to 44 Years | 243 (92.7%) | 0 (0.0%) |
| 45 to 54 Years | 235 (87.4%) | 0 (0.0%) |
| 55 to 59 Years | 132 (84.1%) | 1 (0.8%) |
| 60 to 64 Years | 92 (47.4%) | 2 (2.2%) |
| 65 to 74 Years | 197 (55.3%) | 0 (0.0%) |
| 75 Years and over | 76 (23.1%) | 0 (0.0%) |
| Total | 1,357 (66.9%) | 14 (1.0%) |
Employment Status by Educational Attainment in Rawlins County
According to labor force statistics for Rawlins County, 83.1% of individuals (971) out of the total population between 25 and 64 years of age (1,169) are in the labor force, with 0.3% or 3 of them being unemployed. The group with the highest labor force participation rate are those with the educational attainment of bachelor's degree or higher, with 92.4% or 232 individuals in the labor force. Within the labor force, individuals with bachelor's degree or higher education have the highest percentage of unemployment, with 1.3% or 3 of them being unemployed.
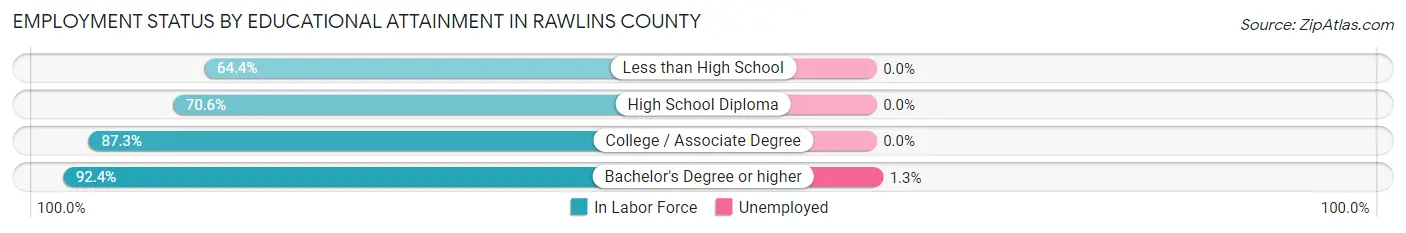
| Educational Attainment | In Labor Force | Unemployed |
| Less than High School | 38 (64.4%) | 0 (0.0%) |
| High School Diploma | 207 (70.6%) | 0 (0.0%) |
| College / Associate Degree | 494 (87.3%) | 0 (0.0%) |
| Bachelor's Degree or higher | 232 (92.4%) | 3 (1.3%) |
| Total | 971 (83.1%) | 4 (0.3%) |
Employment Occupations by Sex in Rawlins County
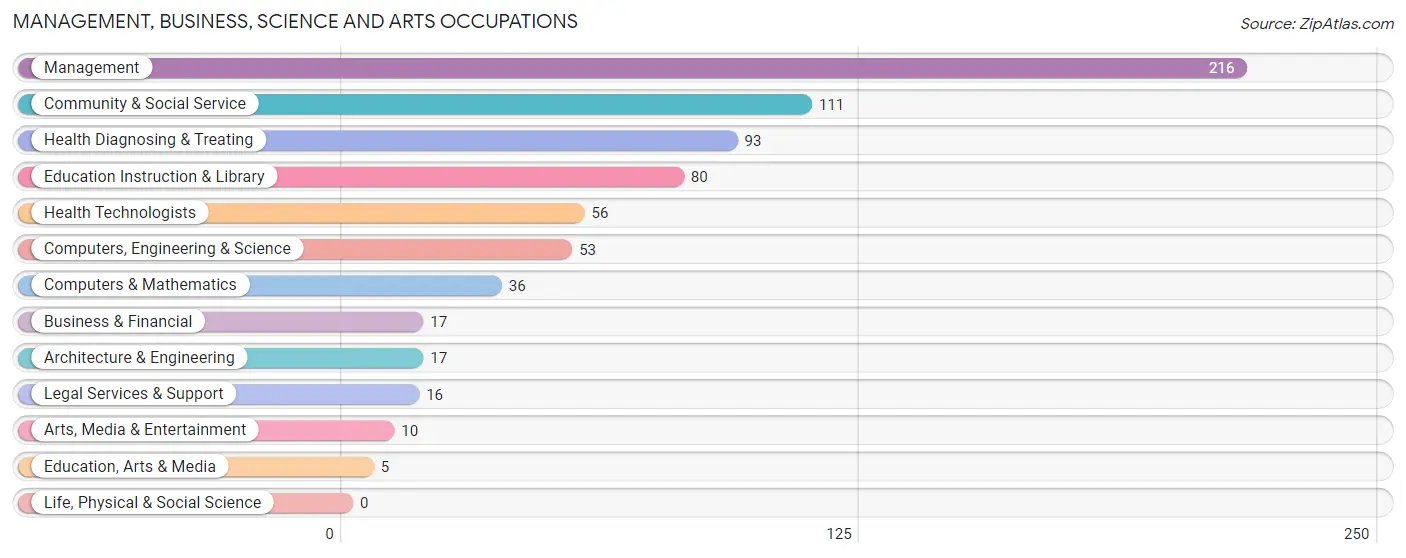
Management, Business, Science and Arts Occupations
The most common Management, Business, Science and Arts occupations in Rawlins County are Management (216 | 16.1%), Community & Social Service (111 | 8.3%), Health Diagnosing & Treating (93 | 6.9%), Education Instruction & Library (80 | 5.9%), and Health Technologists (56 | 4.2%).
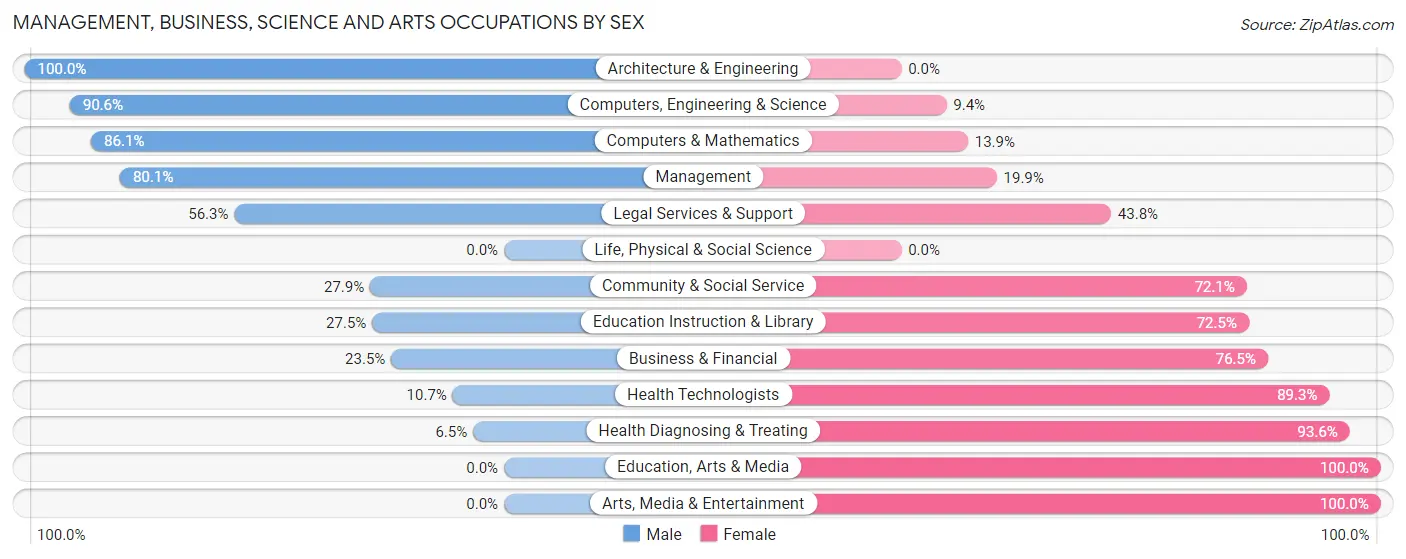
Management, Business, Science and Arts Occupations by Sex
Within the Management, Business, Science and Arts occupations in Rawlins County, the most male-oriented occupations are Architecture & Engineering (100.0%), Computers, Engineering & Science (90.6%), and Computers & Mathematics (86.1%), while the most female-oriented occupations are Education, Arts & Media (100.0%), Arts, Media & Entertainment (100.0%), and Health Diagnosing & Treating (93.5%).
| Occupation | Male | Female |
| Management | 173 (80.1%) | 43 (19.9%) |
| Business & Financial | 4 (23.5%) | 13 (76.5%) |
| Computers, Engineering & Science | 48 (90.6%) | 5 (9.4%) |
| Computers & Mathematics | 31 (86.1%) | 5 (13.9%) |
| Architecture & Engineering | 17 (100.0%) | 0 (0.0%) |
| Life, Physical & Social Science | 0 (0.0%) | 0 (0.0%) |
| Community & Social Service | 31 (27.9%) | 80 (72.1%) |
| Education, Arts & Media | 0 (0.0%) | 5 (100.0%) |
| Legal Services & Support | 9 (56.2%) | 7 (43.8%) |
| Education Instruction & Library | 22 (27.5%) | 58 (72.5%) |
| Arts, Media & Entertainment | 0 (0.0%) | 10 (100.0%) |
| Health Diagnosing & Treating | 6 (6.5%) | 87 (93.5%) |
| Health Technologists | 6 (10.7%) | 50 (89.3%) |
| Total (Category) | 262 (53.5%) | 228 (46.5%) |
| Total (Overall) | 753 (56.0%) | 591 (44.0%) |
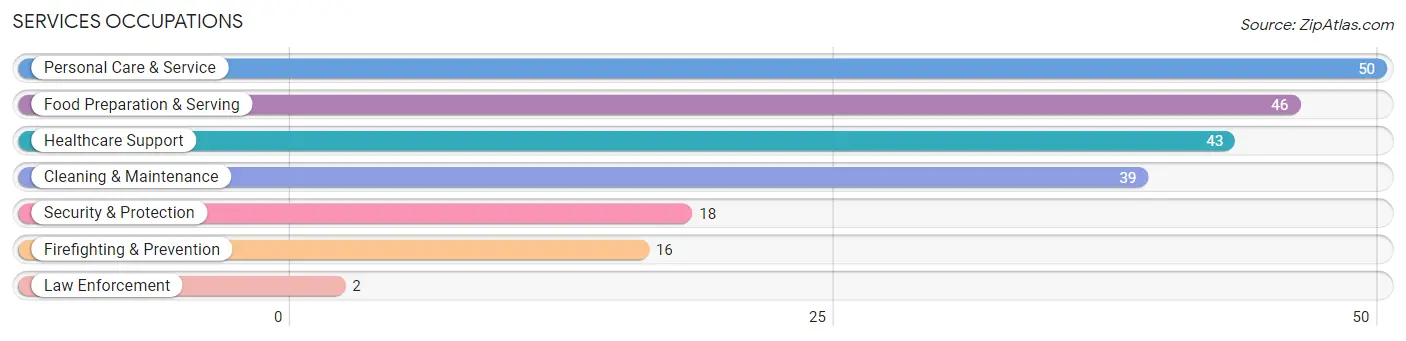
Services Occupations
The most common Services occupations in Rawlins County are Personal Care & Service (50 | 3.7%), Food Preparation & Serving (46 | 3.4%), Healthcare Support (43 | 3.2%), Cleaning & Maintenance (39 | 2.9%), and Security & Protection (18 | 1.3%).
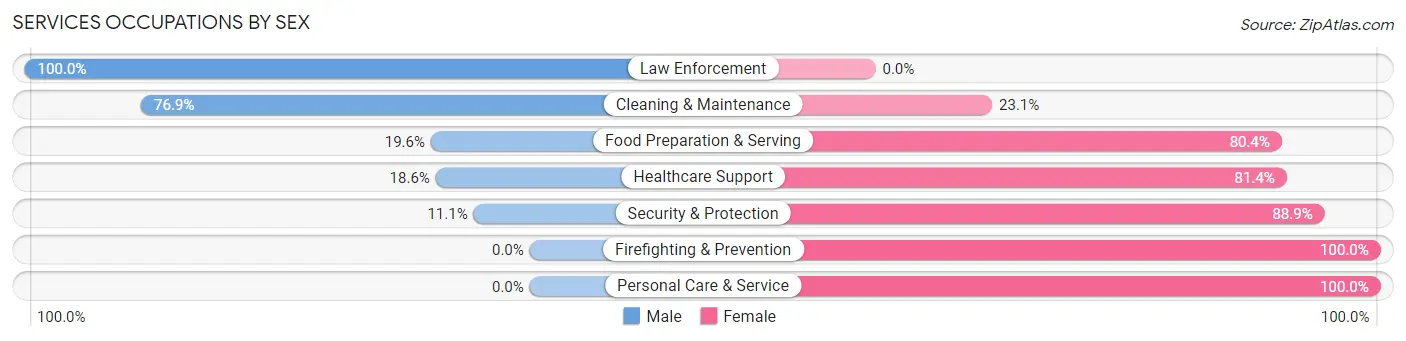
Services Occupations by Sex
Within the Services occupations in Rawlins County, the most male-oriented occupations are Law Enforcement (100.0%), Cleaning & Maintenance (76.9%), and Food Preparation & Serving (19.6%), while the most female-oriented occupations are Firefighting & Prevention (100.0%), Personal Care & Service (100.0%), and Security & Protection (88.9%).
| Occupation | Male | Female |
| Healthcare Support | 8 (18.6%) | 35 (81.4%) |
| Security & Protection | 2 (11.1%) | 16 (88.9%) |
| Firefighting & Prevention | 0 (0.0%) | 16 (100.0%) |
| Law Enforcement | 2 (100.0%) | 0 (0.0%) |
| Food Preparation & Serving | 9 (19.6%) | 37 (80.4%) |
| Cleaning & Maintenance | 30 (76.9%) | 9 (23.1%) |
| Personal Care & Service | 0 (0.0%) | 50 (100.0%) |
| Total (Category) | 49 (25.0%) | 147 (75.0%) |
| Total (Overall) | 753 (56.0%) | 591 (44.0%) |
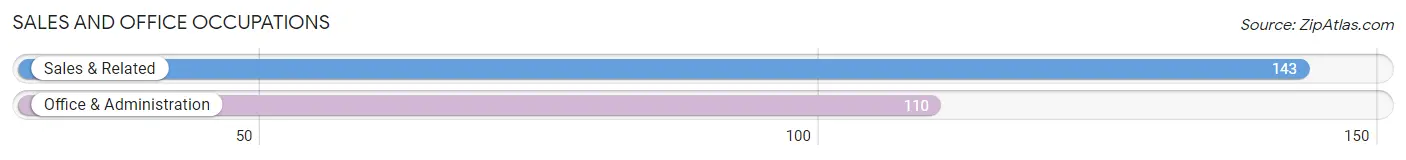
Sales and Office Occupations
The most common Sales and Office occupations in Rawlins County are Sales & Related (143 | 10.6%), and Office & Administration (110 | 8.2%).
Sales and Office Occupations by Sex
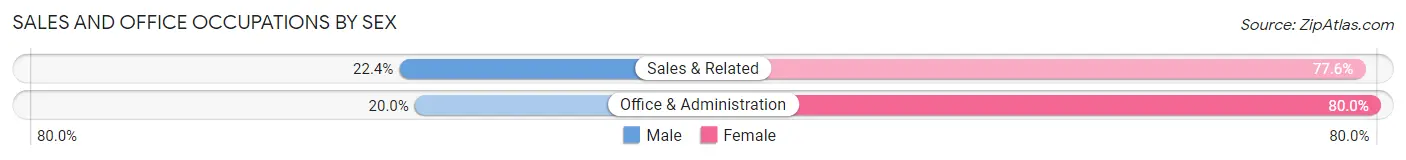
| Occupation | Male | Female |
| Sales & Related | 32 (22.4%) | 111 (77.6%) |
| Office & Administration | 22 (20.0%) | 88 (80.0%) |
| Total (Category) | 54 (21.3%) | 199 (78.7%) |
| Total (Overall) | 753 (56.0%) | 591 (44.0%) |
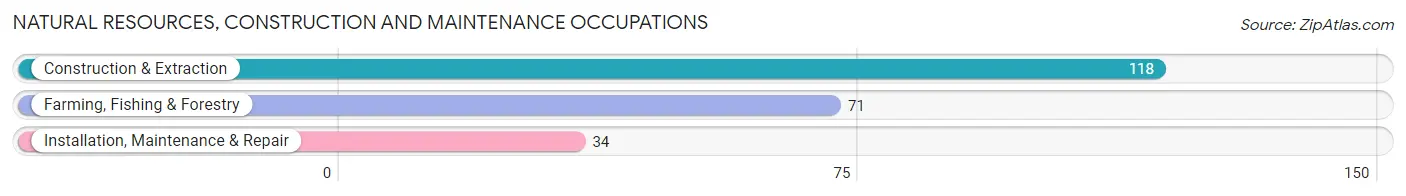
Natural Resources, Construction and Maintenance Occupations
The most common Natural Resources, Construction and Maintenance occupations in Rawlins County are Construction & Extraction (118 | 8.8%), Farming, Fishing & Forestry (71 | 5.3%), and Installation, Maintenance & Repair (34 | 2.5%).
Natural Resources, Construction and Maintenance Occupations by Sex
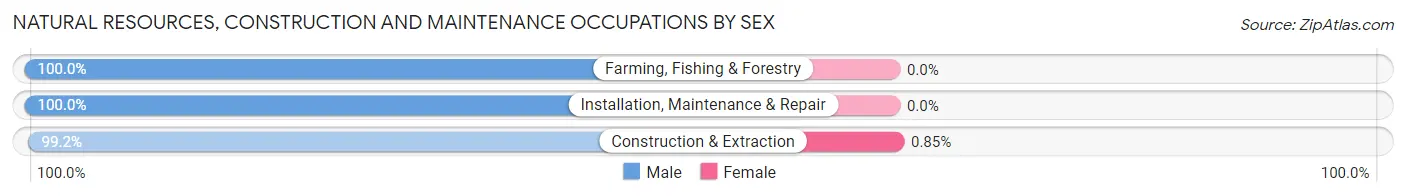
| Occupation | Male | Female |
| Farming, Fishing & Forestry | 71 (100.0%) | 0 (0.0%) |
| Construction & Extraction | 117 (99.2%) | 1 (0.9%) |
| Installation, Maintenance & Repair | 34 (100.0%) | 0 (0.0%) |
| Total (Category) | 222 (99.6%) | 1 (0.4%) |
| Total (Overall) | 753 (56.0%) | 591 (44.0%) |
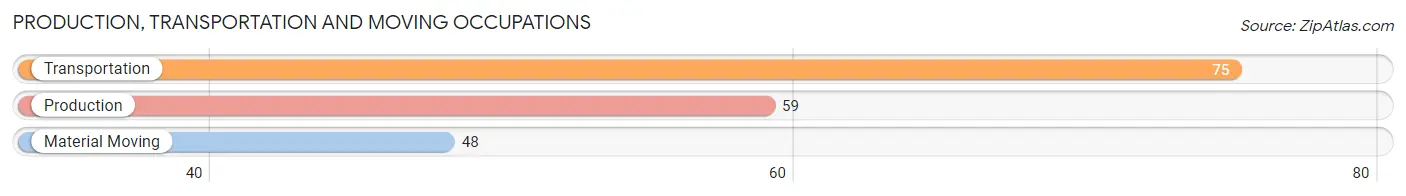
Production, Transportation and Moving Occupations
The most common Production, Transportation and Moving occupations in Rawlins County are Transportation (75 | 5.6%), Production (59 | 4.4%), and Material Moving (48 | 3.6%).
Production, Transportation and Moving Occupations by Sex
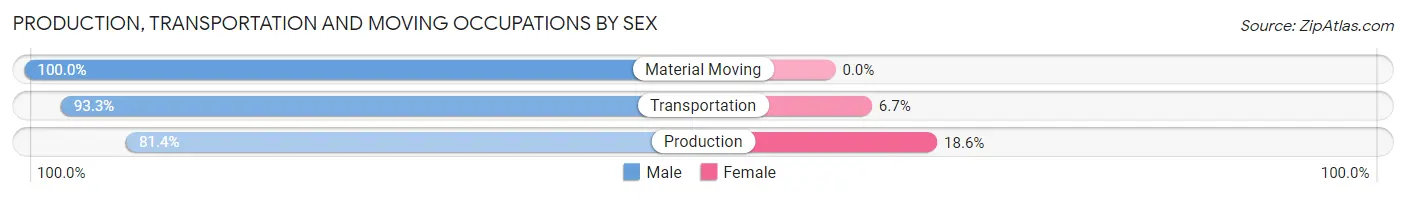
| Occupation | Male | Female |
| Production | 48 (81.4%) | 11 (18.6%) |
| Transportation | 70 (93.3%) | 5 (6.7%) |
| Material Moving | 48 (100.0%) | 0 (0.0%) |
| Total (Category) | 166 (91.2%) | 16 (8.8%) |
| Total (Overall) | 753 (56.0%) | 591 (44.0%) |
Employment Industries by Sex in Rawlins County
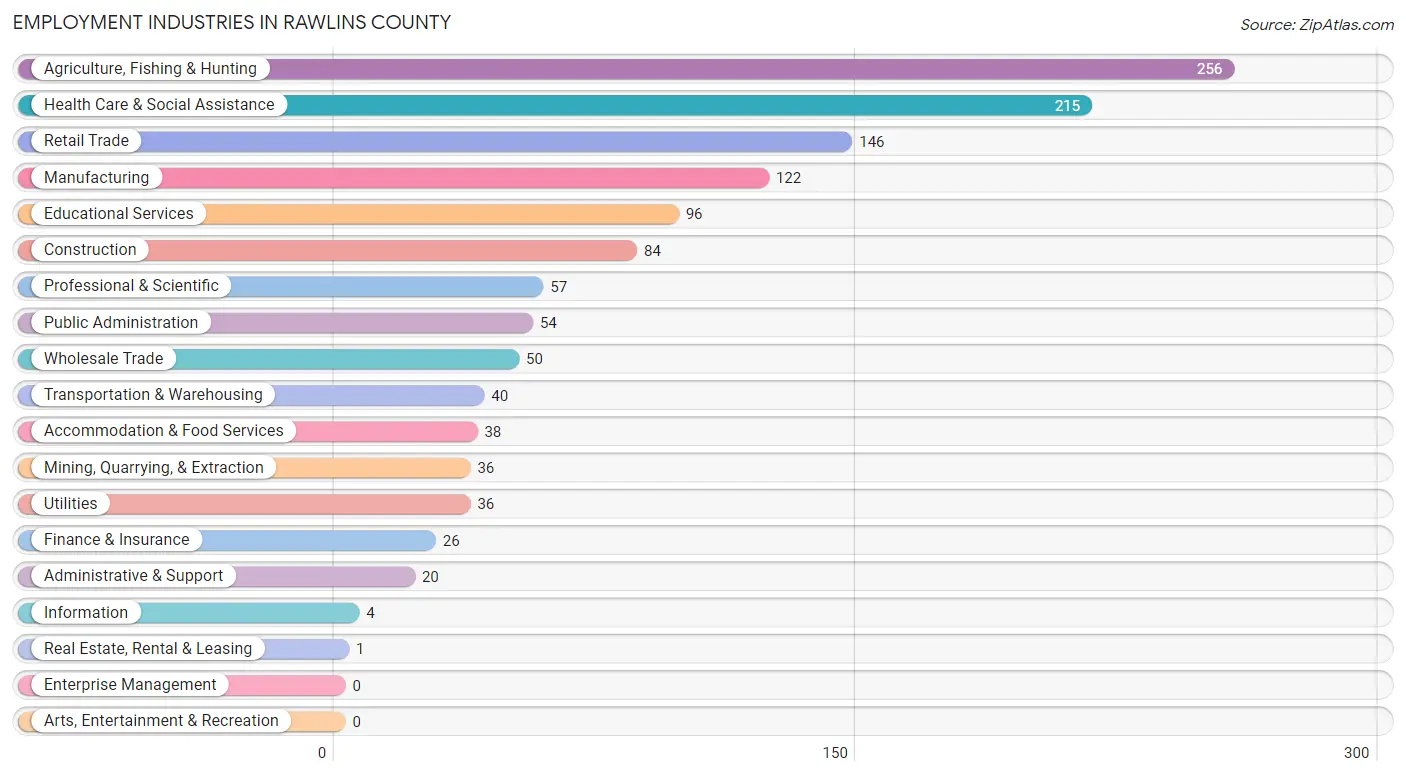
Employment Industries in Rawlins County
The major employment industries in Rawlins County include Agriculture, Fishing & Hunting (256 | 19.1%), Health Care & Social Assistance (215 | 16.0%), Retail Trade (146 | 10.9%), Manufacturing (122 | 9.1%), and Educational Services (96 | 7.1%).
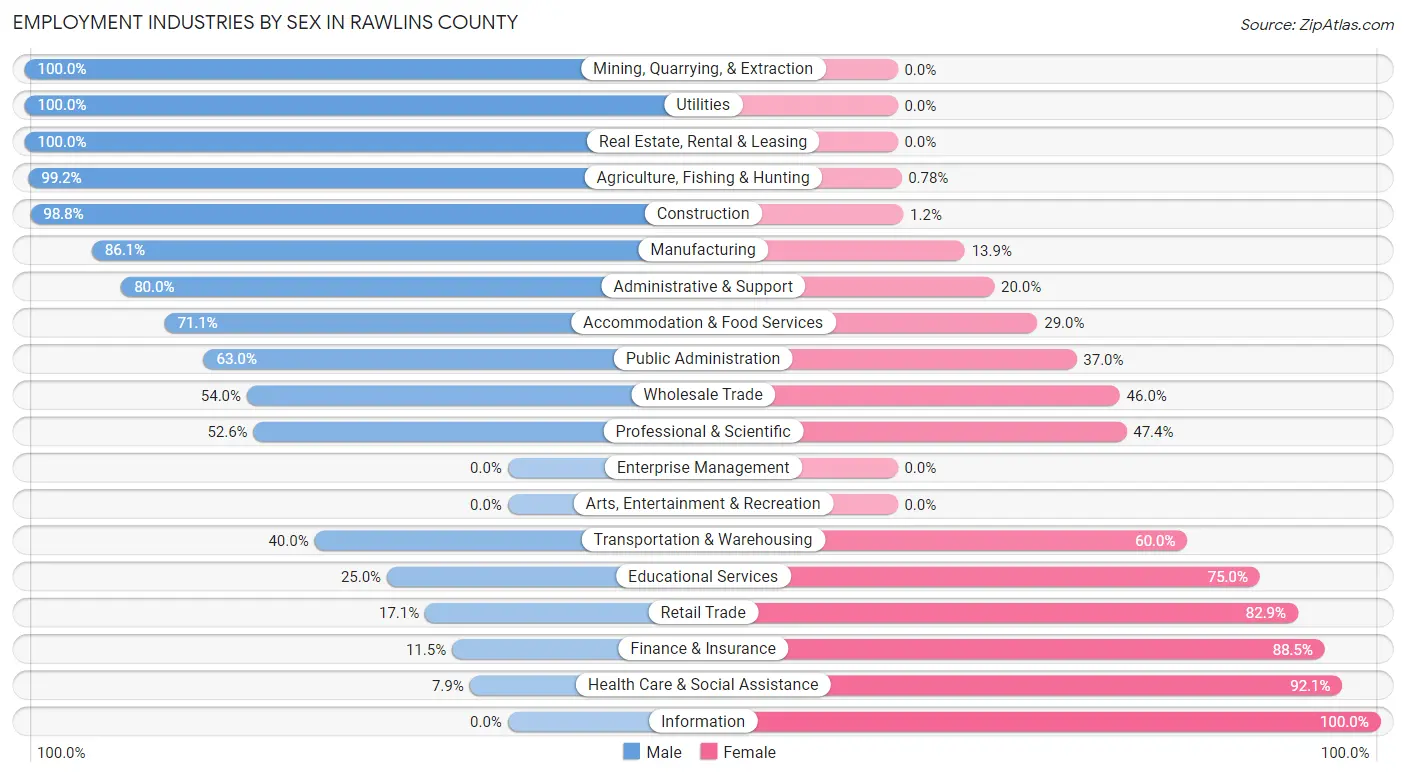
Employment Industries by Sex in Rawlins County
The Rawlins County industries that see more men than women are Mining, Quarrying, & Extraction (100.0%), Utilities (100.0%), and Real Estate, Rental & Leasing (100.0%), whereas the industries that tend to have a higher number of women are Information (100.0%), Health Care & Social Assistance (92.1%), and Finance & Insurance (88.5%).
| Industry | Male | Female |
| Agriculture, Fishing & Hunting | 254 (99.2%) | 2 (0.8%) |
| Mining, Quarrying, & Extraction | 36 (100.0%) | 0 (0.0%) |
| Construction | 83 (98.8%) | 1 (1.2%) |
| Manufacturing | 105 (86.1%) | 17 (13.9%) |
| Wholesale Trade | 27 (54.0%) | 23 (46.0%) |
| Retail Trade | 25 (17.1%) | 121 (82.9%) |
| Transportation & Warehousing | 16 (40.0%) | 24 (60.0%) |
| Utilities | 36 (100.0%) | 0 (0.0%) |
| Information | 0 (0.0%) | 4 (100.0%) |
| Finance & Insurance | 3 (11.5%) | 23 (88.5%) |
| Real Estate, Rental & Leasing | 1 (100.0%) | 0 (0.0%) |
| Professional & Scientific | 30 (52.6%) | 27 (47.4%) |
| Enterprise Management | 0 (0.0%) | 0 (0.0%) |
| Administrative & Support | 16 (80.0%) | 4 (20.0%) |
| Educational Services | 24 (25.0%) | 72 (75.0%) |
| Health Care & Social Assistance | 17 (7.9%) | 198 (92.1%) |
| Arts, Entertainment & Recreation | 0 (0.0%) | 0 (0.0%) |
| Accommodation & Food Services | 27 (71.1%) | 11 (28.9%) |
| Public Administration | 34 (63.0%) | 20 (37.0%) |
| Total | 753 (56.0%) | 591 (44.0%) |
Education in Rawlins County
School Enrollment in Rawlins County
The most common levels of schooling among the 585 students in Rawlins County are elementary school (154 | 26.3%), college / undergraduate (122 | 20.8%), and middle school (117 | 20.0%).
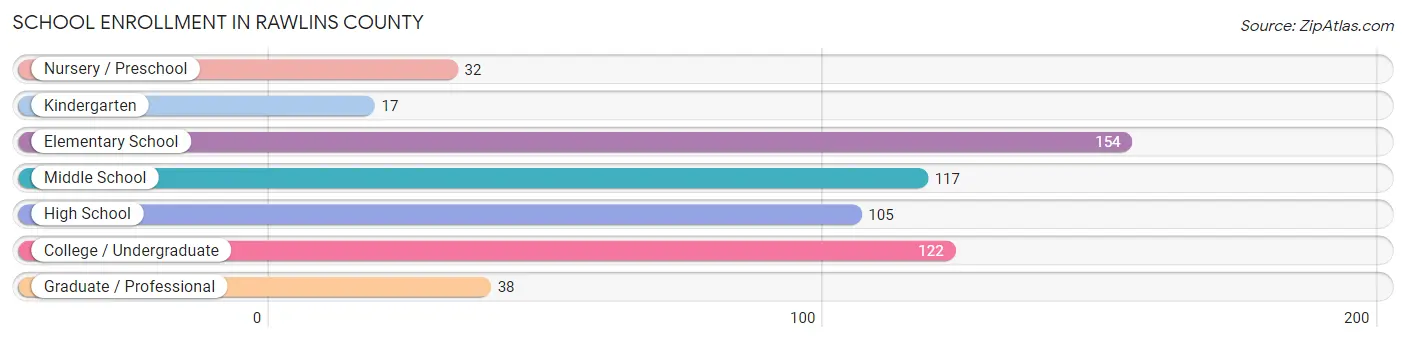
| School Level | # Students | % Students |
| Nursery / Preschool | 32 | 5.5% |
| Kindergarten | 17 | 2.9% |
| Elementary School | 154 | 26.3% |
| Middle School | 117 | 20.0% |
| High School | 105 | 17.9% |
| College / Undergraduate | 122 | 20.8% |
| Graduate / Professional | 38 | 6.5% |
| Total | 585 | 100.0% |
School Enrollment by Age by Funding Source in Rawlins County
Out of a total of 585 students who are enrolled in schools in Rawlins County, 13 (2.2%) attend a private institution, while the remaining 572 (97.8%) are enrolled in public schools. The age group of 15 to 17 year olds has the highest likelihood of being enrolled in private schools, with 10 (12.5% in the age bracket) enrolled. Conversely, the age group of 3 to 4 year olds has the lowest likelihood of being enrolled in a private school, with 30 (100.0% in the age bracket) attending a public institution.
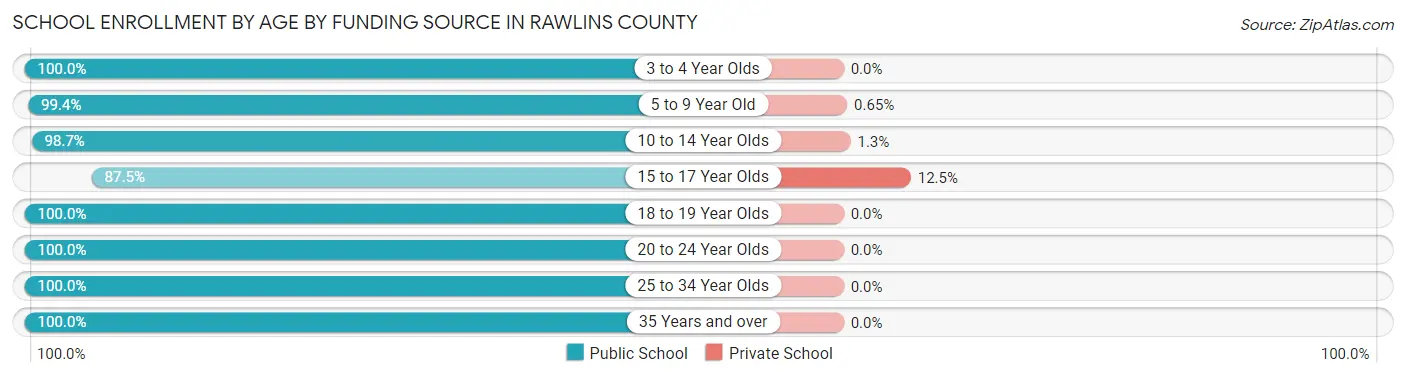
| Age Bracket | Public School | Private School |
| 3 to 4 Year Olds | 30 (100.0%) | 0 (0.0%) |
| 5 to 9 Year Old | 154 (99.4%) | 1 (0.6%) |
| 10 to 14 Year Olds | 154 (98.7%) | 2 (1.3%) |
| 15 to 17 Year Olds | 70 (87.5%) | 10 (12.5%) |
| 18 to 19 Year Olds | 4 (100.0%) | 0 (0.0%) |
| 20 to 24 Year Olds | 25 (100.0%) | 0 (0.0%) |
| 25 to 34 Year Olds | 44 (100.0%) | 0 (0.0%) |
| 35 Years and over | 91 (100.0%) | 0 (0.0%) |
| Total | 572 (97.8%) | 13 (2.2%) |
Educational Attainment by Field of Study in Rawlins County
Bio, nature & agricultural (80 | 23.2%), business (65 | 18.8%), education (64 | 18.5%), science & technology (32 | 9.3%), and engineering (28 | 8.1%) are the most common fields of study among 345 individuals in Rawlins County who have obtained a bachelor's degree or higher.
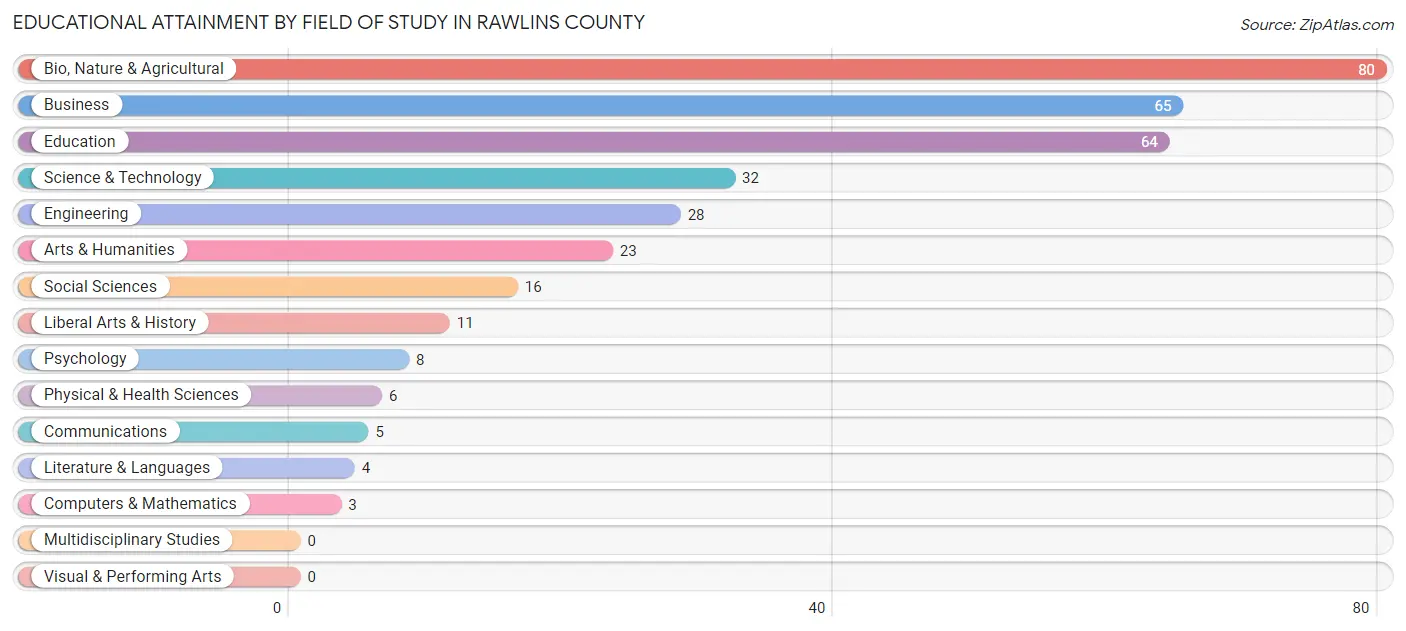
| Field of Study | # Graduates | % Graduates |
| Computers & Mathematics | 3 | 0.9% |
| Bio, Nature & Agricultural | 80 | 23.2% |
| Physical & Health Sciences | 6 | 1.7% |
| Psychology | 8 | 2.3% |
| Social Sciences | 16 | 4.6% |
| Engineering | 28 | 8.1% |
| Multidisciplinary Studies | 0 | 0.0% |
| Science & Technology | 32 | 9.3% |
| Business | 65 | 18.8% |
| Education | 64 | 18.5% |
| Literature & Languages | 4 | 1.2% |
| Liberal Arts & History | 11 | 3.2% |
| Visual & Performing Arts | 0 | 0.0% |
| Communications | 5 | 1.5% |
| Arts & Humanities | 23 | 6.7% |
| Total | 345 | 100.0% |
Transportation & Commute in Rawlins County
Vehicle Availability by Sex in Rawlins County
The most prevalent vehicle ownership categories in Rawlins County are males with 2 vehicles (292, accounting for 40.0%) and females with 2 vehicles (216, making up 51.9%).
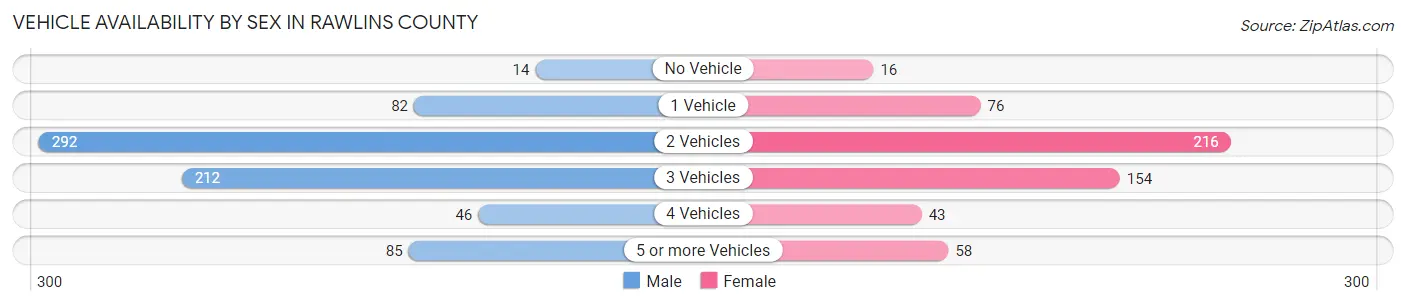
| Vehicles Available | Male | Female |
| No Vehicle | 14 (1.9%) | 16 (2.8%) |
| 1 Vehicle | 82 (11.2%) | 76 (13.5%) |
| 2 Vehicles | 292 (40.0%) | 216 (38.4%) |
| 3 Vehicles | 212 (29.0%) | 154 (27.4%) |
| 4 Vehicles | 46 (6.3%) | 43 (7.6%) |
| 5 or more Vehicles | 85 (11.6%) | 58 (10.3%) |
| Total | 731 (100.0%) | 563 (100.0%) |
Commute Time in Rawlins County
The most frequently occuring commute durations in Rawlins County are less than 5 minutes (300 commuters, 26.8%), 5 to 9 minutes (265 commuters, 23.6%), and 10 to 14 minutes (181 commuters, 16.2%).
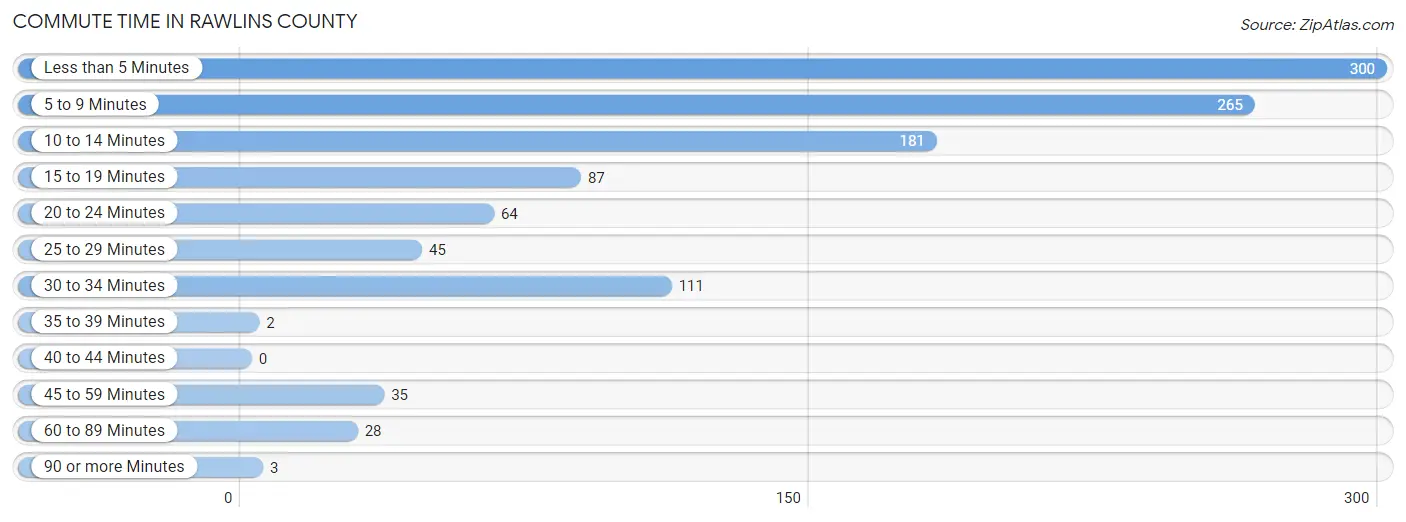
| Commute Time | # Commuters | % Commuters |
| Less than 5 Minutes | 300 | 26.8% |
| 5 to 9 Minutes | 265 | 23.6% |
| 10 to 14 Minutes | 181 | 16.2% |
| 15 to 19 Minutes | 87 | 7.8% |
| 20 to 24 Minutes | 64 | 5.7% |
| 25 to 29 Minutes | 45 | 4.0% |
| 30 to 34 Minutes | 111 | 9.9% |
| 35 to 39 Minutes | 2 | 0.2% |
| 40 to 44 Minutes | 0 | 0.0% |
| 45 to 59 Minutes | 35 | 3.1% |
| 60 to 89 Minutes | 28 | 2.5% |
| 90 or more Minutes | 3 | 0.3% |
Commute Time by Sex in Rawlins County
The most common commute times in Rawlins County are 5 to 9 minutes (181 commuters, 29.0%) for males and less than 5 minutes (182 commuters, 36.6%) for females.
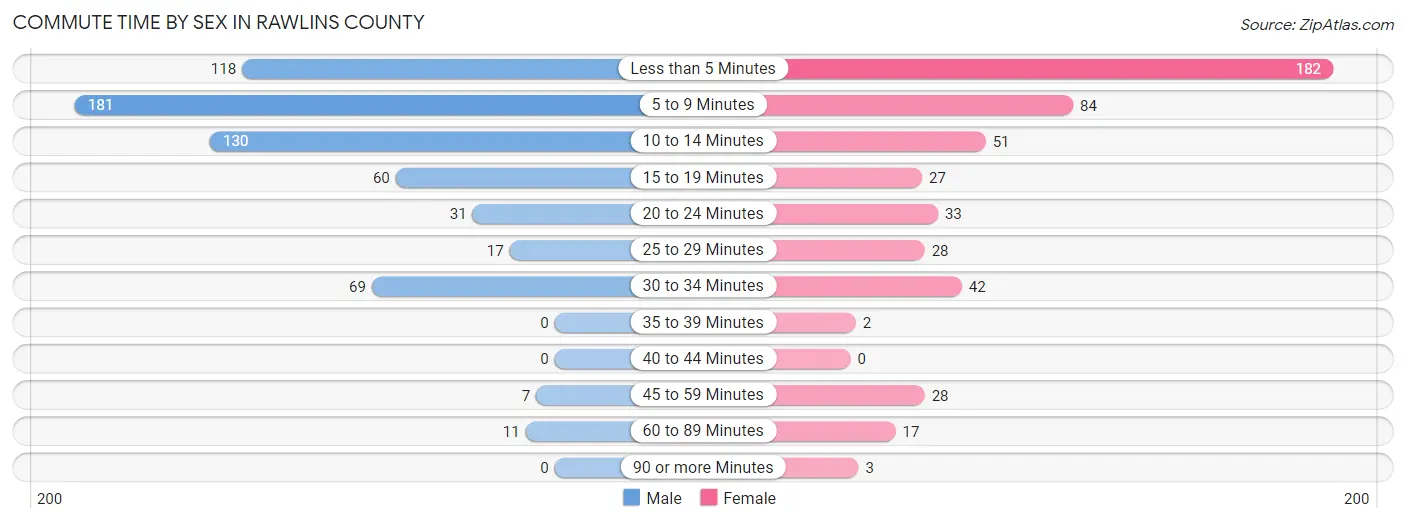
| Commute Time | Male | Female |
| Less than 5 Minutes | 118 (18.9%) | 182 (36.6%) |
| 5 to 9 Minutes | 181 (29.0%) | 84 (16.9%) |
| 10 to 14 Minutes | 130 (20.8%) | 51 (10.3%) |
| 15 to 19 Minutes | 60 (9.6%) | 27 (5.4%) |
| 20 to 24 Minutes | 31 (5.0%) | 33 (6.6%) |
| 25 to 29 Minutes | 17 (2.7%) | 28 (5.6%) |
| 30 to 34 Minutes | 69 (11.1%) | 42 (8.5%) |
| 35 to 39 Minutes | 0 (0.0%) | 2 (0.4%) |
| 40 to 44 Minutes | 0 (0.0%) | 0 (0.0%) |
| 45 to 59 Minutes | 7 (1.1%) | 28 (5.6%) |
| 60 to 89 Minutes | 11 (1.8%) | 17 (3.4%) |
| 90 or more Minutes | 0 (0.0%) | 3 (0.6%) |
Time of Departure to Work by Sex in Rawlins County
The most frequent times of departure to work in Rawlins County are 7:30 AM to 7:59 AM (247, 39.6%) for males and 7:30 AM to 7:59 AM (129, 26.0%) for females.
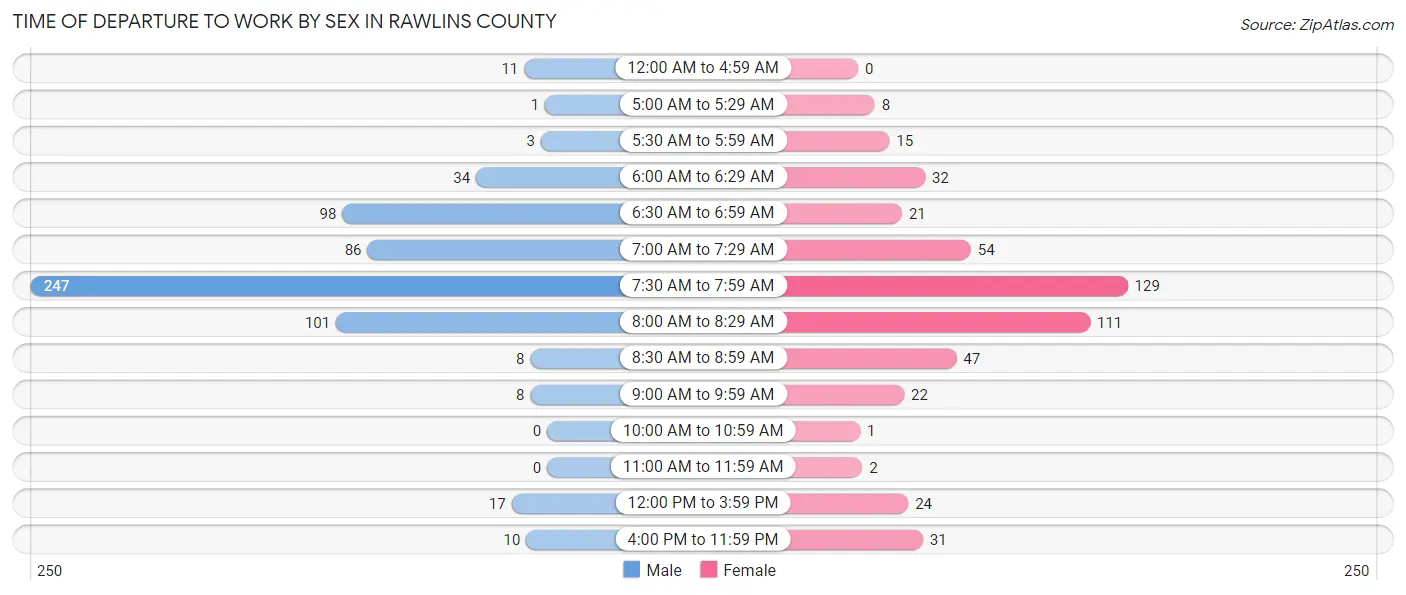
| Time of Departure | Male | Female |
| 12:00 AM to 4:59 AM | 11 (1.8%) | 0 (0.0%) |
| 5:00 AM to 5:29 AM | 1 (0.2%) | 8 (1.6%) |
| 5:30 AM to 5:59 AM | 3 (0.5%) | 15 (3.0%) |
| 6:00 AM to 6:29 AM | 34 (5.4%) | 32 (6.4%) |
| 6:30 AM to 6:59 AM | 98 (15.7%) | 21 (4.2%) |
| 7:00 AM to 7:29 AM | 86 (13.8%) | 54 (10.9%) |
| 7:30 AM to 7:59 AM | 247 (39.6%) | 129 (26.0%) |
| 8:00 AM to 8:29 AM | 101 (16.2%) | 111 (22.3%) |
| 8:30 AM to 8:59 AM | 8 (1.3%) | 47 (9.5%) |
| 9:00 AM to 9:59 AM | 8 (1.3%) | 22 (4.4%) |
| 10:00 AM to 10:59 AM | 0 (0.0%) | 1 (0.2%) |
| 11:00 AM to 11:59 AM | 0 (0.0%) | 2 (0.4%) |
| 12:00 PM to 3:59 PM | 17 (2.7%) | 24 (4.8%) |
| 4:00 PM to 11:59 PM | 10 (1.6%) | 31 (6.2%) |
| Total | 624 (100.0%) | 497 (100.0%) |
Housing Occupancy in Rawlins County
Occupancy by Ownership in Rawlins County
Of the total 1,165 dwellings in Rawlins County, owner-occupied units account for 803 (68.9%), while renter-occupied units make up 362 (31.1%).
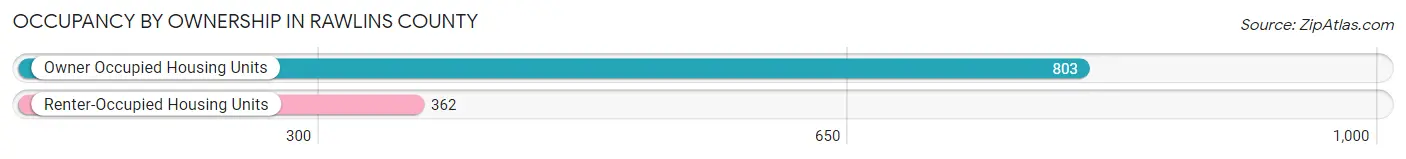
| Occupancy | # Housing Units | % Housing Units |
| Owner Occupied Housing Units | 803 | 68.9% |
| Renter-Occupied Housing Units | 362 | 31.1% |
| Total Occupied Housing Units | 1,165 | 100.0% |
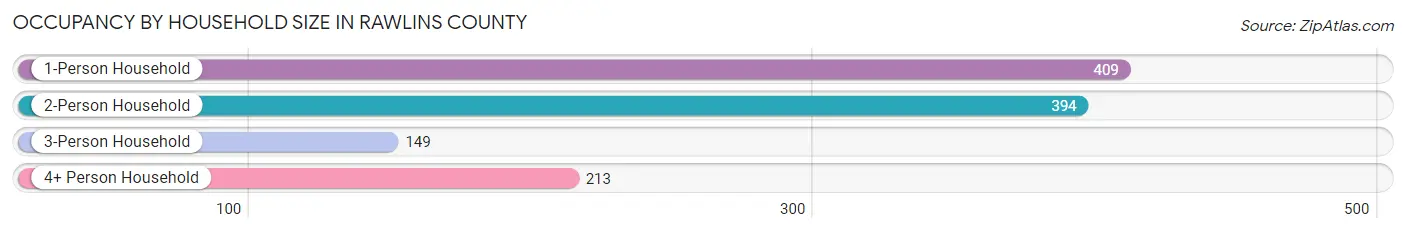
Occupancy by Household Size in Rawlins County
| Household Size | # Housing Units | % Housing Units |
| 1-Person Household | 409 | 35.1% |
| 2-Person Household | 394 | 33.8% |
| 3-Person Household | 149 | 12.8% |
| 4+ Person Household | 213 | 18.3% |
| Total Housing Units | 1,165 | 100.0% |
Occupancy by Ownership by Household Size in Rawlins County
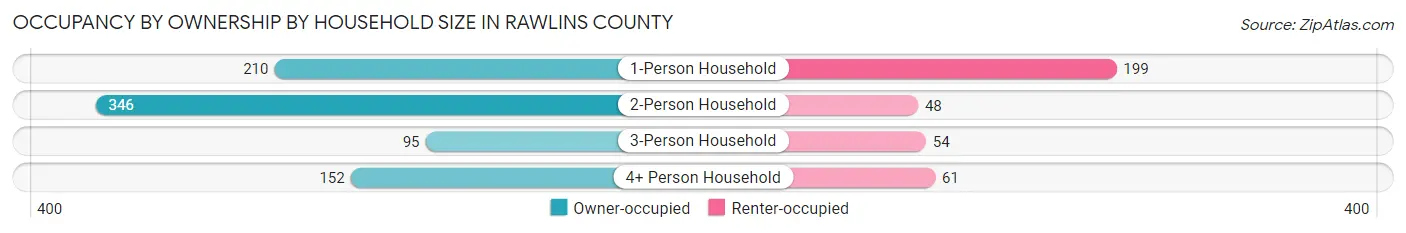
| Household Size | Owner-occupied | Renter-occupied |
| 1-Person Household | 210 (51.3%) | 199 (48.7%) |
| 2-Person Household | 346 (87.8%) | 48 (12.2%) |
| 3-Person Household | 95 (63.8%) | 54 (36.2%) |
| 4+ Person Household | 152 (71.4%) | 61 (28.6%) |
| Total Housing Units | 803 (68.9%) | 362 (31.1%) |
Occupancy by Educational Attainment in Rawlins County
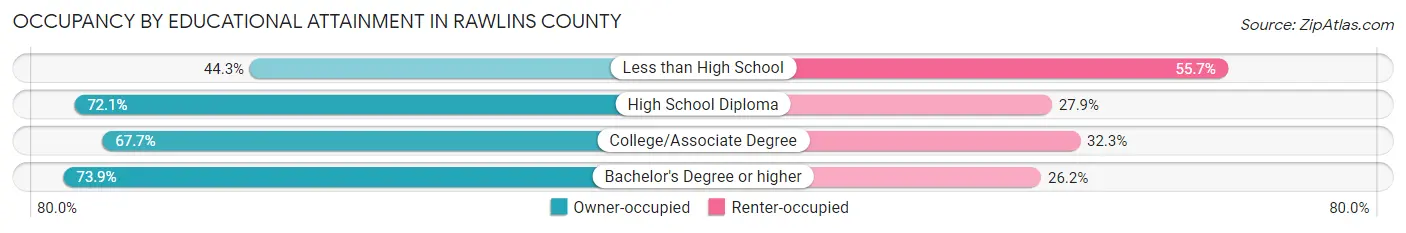
| Household Size | Owner-occupied | Renter-occupied |
| Less than High School | 27 (44.3%) | 34 (55.7%) |
| High School Diploma | 251 (72.1%) | 97 (27.9%) |
| College/Associate Degree | 364 (67.7%) | 174 (32.3%) |
| Bachelor's Degree or higher | 161 (73.9%) | 57 (26.2%) |
Occupancy by Age of Householder in Rawlins County
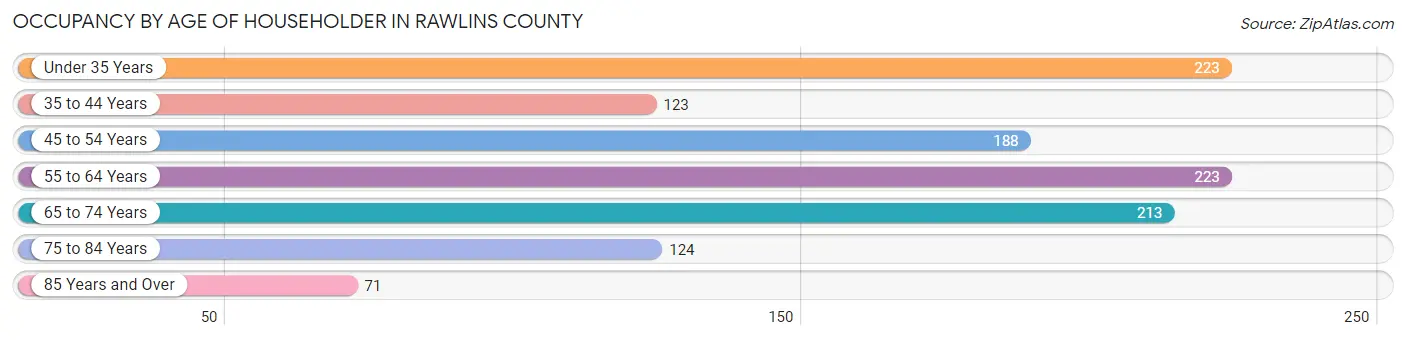
| Age Bracket | # Households | % Households |
| Under 35 Years | 223 | 19.1% |
| 35 to 44 Years | 123 | 10.6% |
| 45 to 54 Years | 188 | 16.1% |
| 55 to 64 Years | 223 | 19.1% |
| 65 to 74 Years | 213 | 18.3% |
| 75 to 84 Years | 124 | 10.6% |
| 85 Years and Over | 71 | 6.1% |
| Total | 1,165 | 100.0% |
Housing Finances in Rawlins County
Median Income by Occupancy in Rawlins County
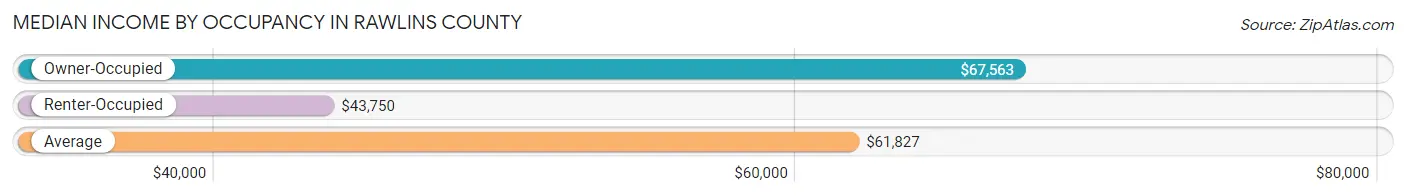
| Occupancy Type | # Households | Median Income |
| Owner-Occupied | 803 (68.9%) | $67,563 |
| Renter-Occupied | 362 (31.1%) | $43,750 |
| Average | 1,165 (100.0%) | $61,827 |
Occupancy by Householder Income Bracket in Rawlins County
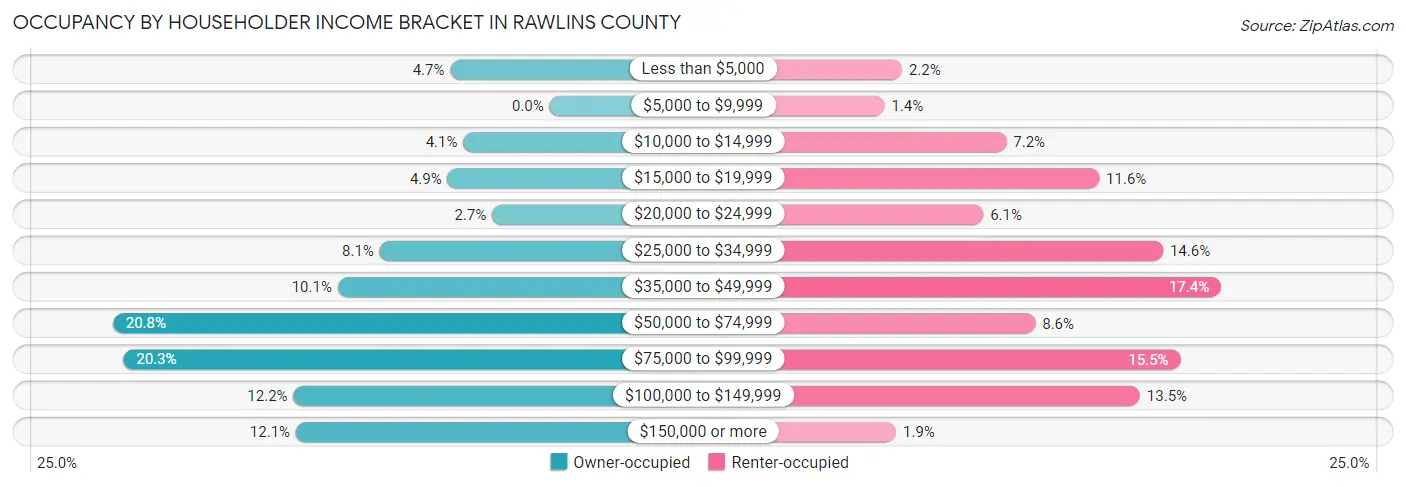
| Income Bracket | Owner-occupied | Renter-occupied |
| Less than $5,000 | 38 (4.7%) | 8 (2.2%) |
| $5,000 to $9,999 | 0 (0.0%) | 5 (1.4%) |
| $10,000 to $14,999 | 33 (4.1%) | 26 (7.2%) |
| $15,000 to $19,999 | 39 (4.9%) | 42 (11.6%) |
| $20,000 to $24,999 | 22 (2.7%) | 22 (6.1%) |
| $25,000 to $34,999 | 65 (8.1%) | 53 (14.6%) |
| $35,000 to $49,999 | 81 (10.1%) | 63 (17.4%) |
| $50,000 to $74,999 | 167 (20.8%) | 31 (8.6%) |
| $75,000 to $99,999 | 163 (20.3%) | 56 (15.5%) |
| $100,000 to $149,999 | 98 (12.2%) | 49 (13.5%) |
| $150,000 or more | 97 (12.1%) | 7 (1.9%) |
| Total | 803 (100.0%) | 362 (100.0%) |
Monthly Housing Cost Tiers in Rawlins County
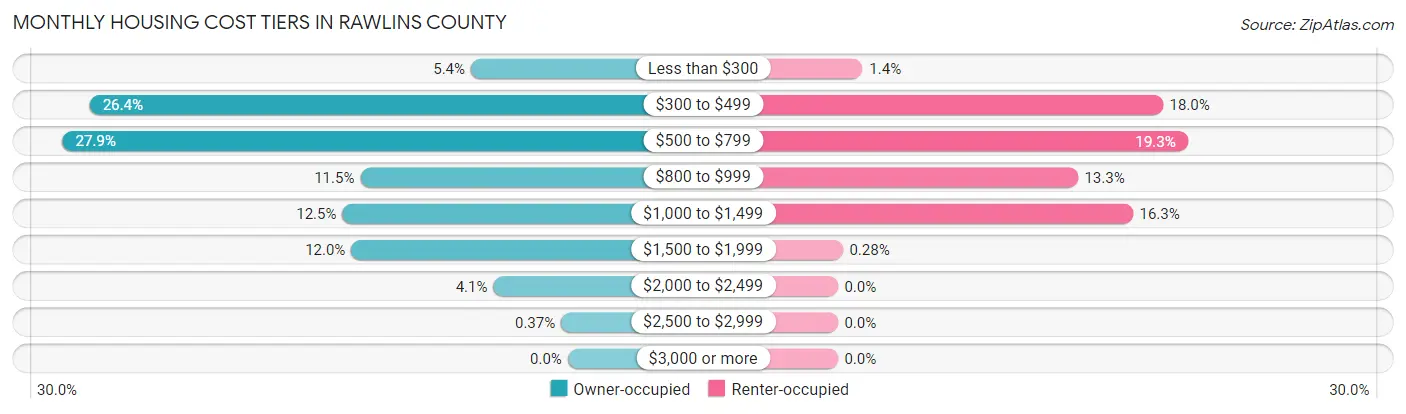
| Monthly Cost | Owner-occupied | Renter-occupied |
| Less than $300 | 43 (5.3%) | 5 (1.4%) |
| $300 to $499 | 212 (26.4%) | 65 (18.0%) |
| $500 to $799 | 224 (27.9%) | 70 (19.3%) |
| $800 to $999 | 92 (11.5%) | 48 (13.3%) |
| $1,000 to $1,499 | 100 (12.4%) | 59 (16.3%) |
| $1,500 to $1,999 | 96 (12.0%) | 1 (0.3%) |
| $2,000 to $2,499 | 33 (4.1%) | 0 (0.0%) |
| $2,500 to $2,999 | 3 (0.4%) | 0 (0.0%) |
| $3,000 or more | 0 (0.0%) | 0 (0.0%) |
| Total | 803 (100.0%) | 362 (100.0%) |
Physical Housing Characteristics in Rawlins County
Housing Structures in Rawlins County
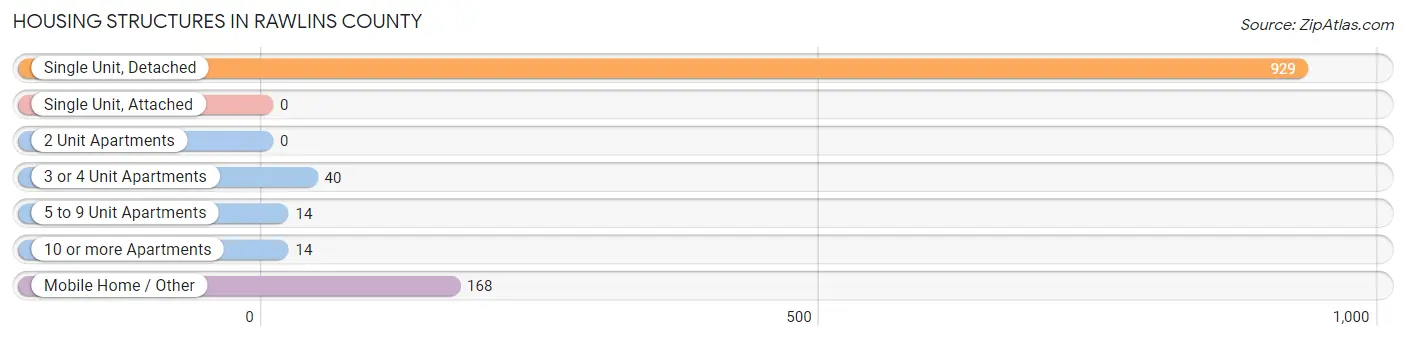
| Structure Type | # Housing Units | % Housing Units |
| Single Unit, Detached | 929 | 79.7% |
| Single Unit, Attached | 0 | 0.0% |
| 2 Unit Apartments | 0 | 0.0% |
| 3 or 4 Unit Apartments | 40 | 3.4% |
| 5 to 9 Unit Apartments | 14 | 1.2% |
| 10 or more Apartments | 14 | 1.2% |
| Mobile Home / Other | 168 | 14.4% |
| Total | 1,165 | 100.0% |
Housing Structures by Occupancy in Rawlins County
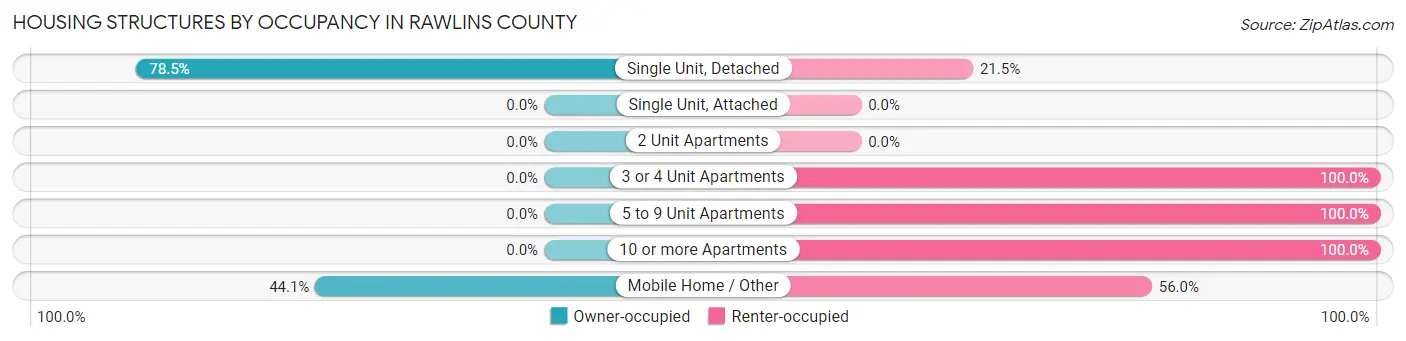
| Structure Type | Owner-occupied | Renter-occupied |
| Single Unit, Detached | 729 (78.5%) | 200 (21.5%) |
| Single Unit, Attached | 0 (0.0%) | 0 (0.0%) |
| 2 Unit Apartments | 0 (0.0%) | 0 (0.0%) |
| 3 or 4 Unit Apartments | 0 (0.0%) | 40 (100.0%) |
| 5 to 9 Unit Apartments | 0 (0.0%) | 14 (100.0%) |
| 10 or more Apartments | 0 (0.0%) | 14 (100.0%) |
| Mobile Home / Other | 74 (44.1%) | 94 (55.9%) |
| Total | 803 (68.9%) | 362 (31.1%) |
Housing Structures by Number of Rooms in Rawlins County
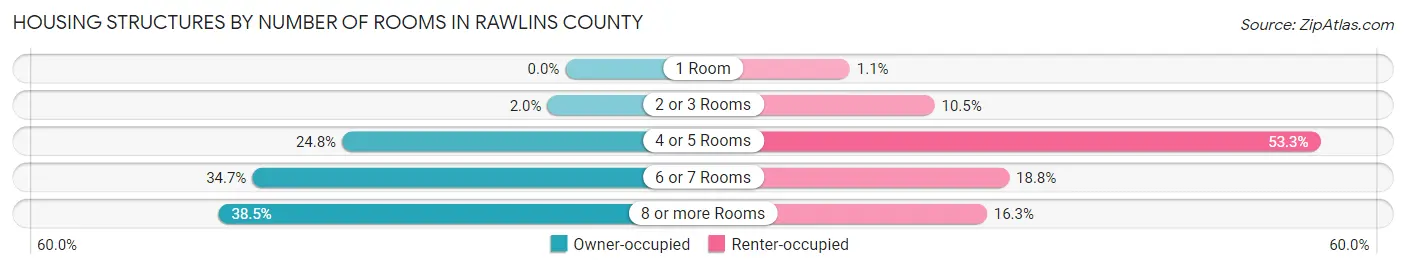
| Number of Rooms | Owner-occupied | Renter-occupied |
| 1 Room | 0 (0.0%) | 4 (1.1%) |
| 2 or 3 Rooms | 16 (2.0%) | 38 (10.5%) |
| 4 or 5 Rooms | 199 (24.8%) | 193 (53.3%) |
| 6 or 7 Rooms | 279 (34.7%) | 68 (18.8%) |
| 8 or more Rooms | 309 (38.5%) | 59 (16.3%) |
| Total | 803 (100.0%) | 362 (100.0%) |
Housing Structure by Heating Type in Rawlins County
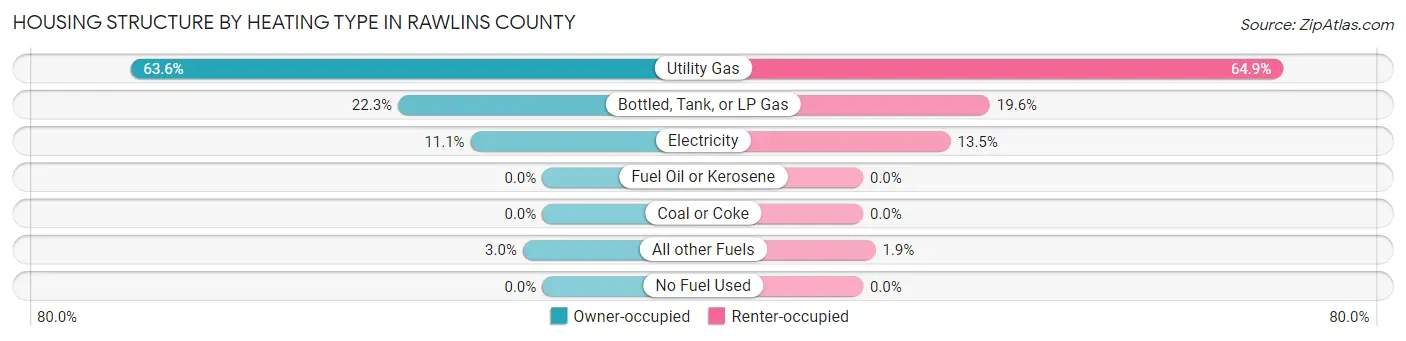
| Heating Type | Owner-occupied | Renter-occupied |
| Utility Gas | 511 (63.6%) | 235 (64.9%) |
| Bottled, Tank, or LP Gas | 179 (22.3%) | 71 (19.6%) |
| Electricity | 89 (11.1%) | 49 (13.5%) |
| Fuel Oil or Kerosene | 0 (0.0%) | 0 (0.0%) |
| Coal or Coke | 0 (0.0%) | 0 (0.0%) |
| All other Fuels | 24 (3.0%) | 7 (1.9%) |
| No Fuel Used | 0 (0.0%) | 0 (0.0%) |
| Total | 803 (100.0%) | 362 (100.0%) |
Household Vehicle Usage in Rawlins County
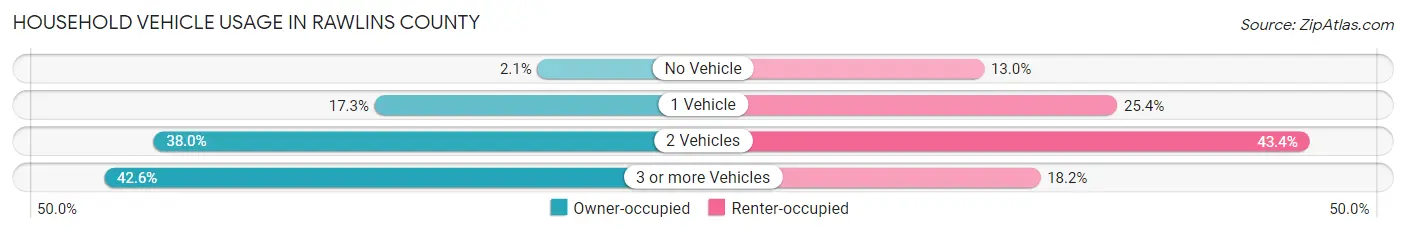
| Vehicles per Household | Owner-occupied | Renter-occupied |
| No Vehicle | 17 (2.1%) | 47 (13.0%) |
| 1 Vehicle | 139 (17.3%) | 92 (25.4%) |
| 2 Vehicles | 305 (38.0%) | 157 (43.4%) |
| 3 or more Vehicles | 342 (42.6%) | 66 (18.2%) |
| Total | 803 (100.0%) | 362 (100.0%) |
Real Estate & Mortgages in Rawlins County
Real Estate and Mortgage Overview in Rawlins County
| Characteristic | Without Mortgage | With Mortgage |
| Housing Units | 519 | 284 |
| Median Property Value | $89,700 | $153,500 |
| Median Household Income | $64,327 | $60 |
| Monthly Housing Costs | $507 | $0 |
| Real Estate Taxes | $1,281 | $1 |
Property Value by Mortgage Status in Rawlins County
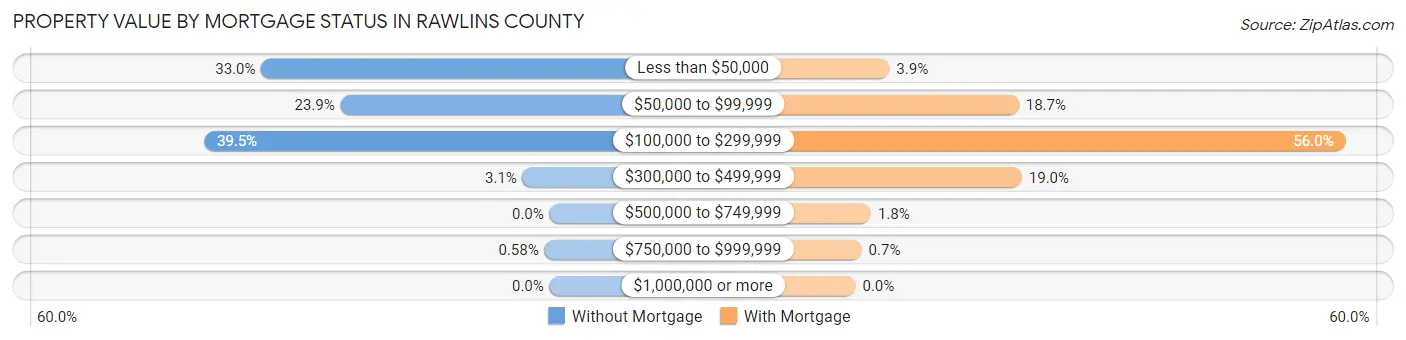
| Property Value | Without Mortgage | With Mortgage |
| Less than $50,000 | 171 (33.0%) | 11 (3.9%) |
| $50,000 to $99,999 | 124 (23.9%) | 53 (18.7%) |
| $100,000 to $299,999 | 205 (39.5%) | 159 (56.0%) |
| $300,000 to $499,999 | 16 (3.1%) | 54 (19.0%) |
| $500,000 to $749,999 | 0 (0.0%) | 5 (1.8%) |
| $750,000 to $999,999 | 3 (0.6%) | 2 (0.7%) |
| $1,000,000 or more | 0 (0.0%) | 0 (0.0%) |
| Total | 519 (100.0%) | 284 (100.0%) |
Household Income by Mortgage Status in Rawlins County
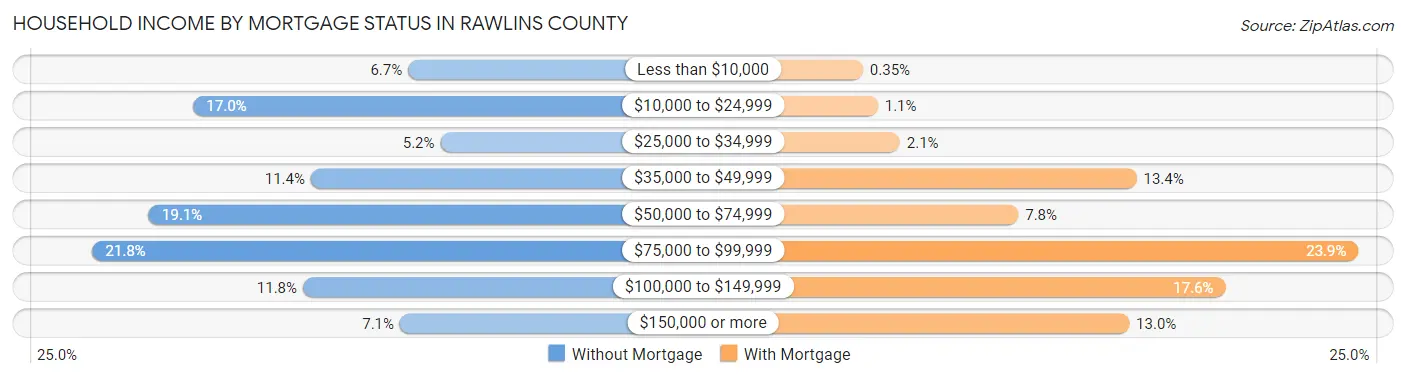
| Household Income | Without Mortgage | With Mortgage |
| Less than $10,000 | 35 (6.7%) | 1 (0.4%) |
| $10,000 to $24,999 | 88 (17.0%) | 3 (1.1%) |
| $25,000 to $34,999 | 27 (5.2%) | 6 (2.1%) |
| $35,000 to $49,999 | 59 (11.4%) | 38 (13.4%) |
| $50,000 to $74,999 | 99 (19.1%) | 22 (7.7%) |
| $75,000 to $99,999 | 113 (21.8%) | 68 (23.9%) |
| $100,000 to $149,999 | 61 (11.7%) | 50 (17.6%) |
| $150,000 or more | 37 (7.1%) | 37 (13.0%) |
| Total | 519 (100.0%) | 284 (100.0%) |
Property Value to Household Income Ratio in Rawlins County
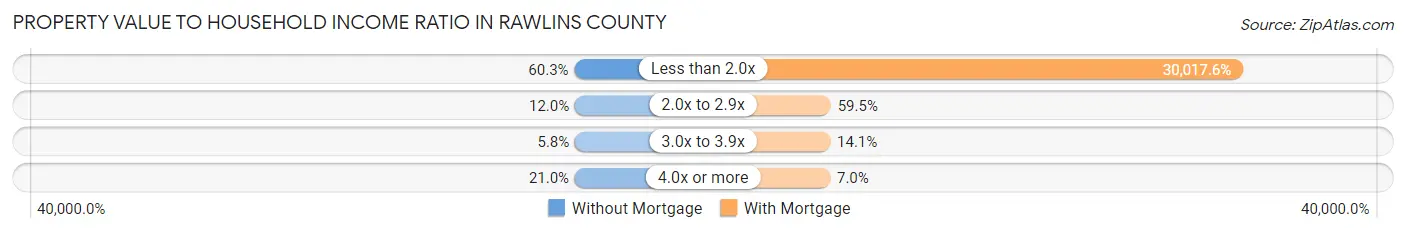
| Value-to-Income Ratio | Without Mortgage | With Mortgage |
| Less than 2.0x | 313 (60.3%) | 85,250 (30,017.6%) |
| 2.0x to 2.9x | 62 (11.9%) | 169 (59.5%) |
| 3.0x to 3.9x | 30 (5.8%) | 40 (14.1%) |
| 4.0x or more | 109 (21.0%) | 20 (7.0%) |
| Total | 519 (100.0%) | 284 (100.0%) |
Real Estate Taxes by Mortgage Status in Rawlins County
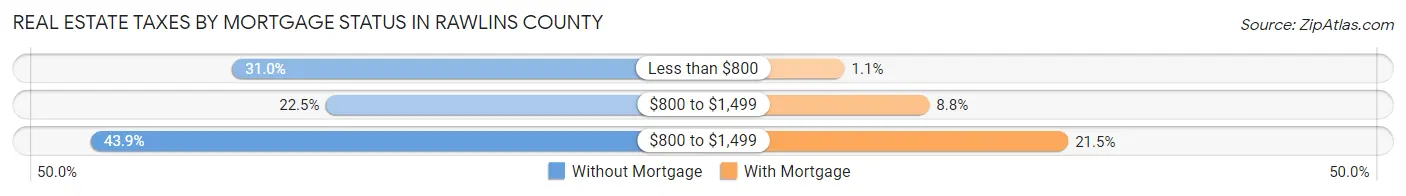
| Property Taxes | Without Mortgage | With Mortgage |
| Less than $800 | 161 (31.0%) | 3 (1.1%) |
| $800 to $1,499 | 117 (22.5%) | 25 (8.8%) |
| $800 to $1,499 | 228 (43.9%) | 61 (21.5%) |
| Total | 519 (100.0%) | 284 (100.0%) |
Health & Disability in Rawlins County
Health Insurance Coverage by Age in Rawlins County
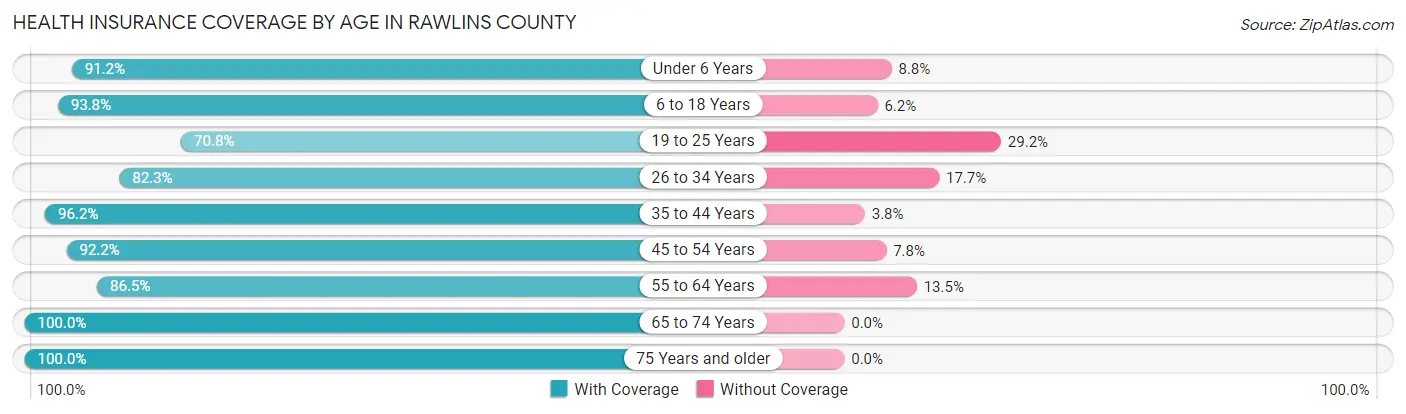
| Age Bracket | With Coverage | Without Coverage |
| Under 6 Years | 176 (91.2%) | 17 (8.8%) |
| 6 to 18 Years | 364 (93.8%) | 24 (6.2%) |
| 19 to 25 Years | 80 (70.8%) | 33 (29.2%) |
| 26 to 34 Years | 233 (82.3%) | 50 (17.7%) |
| 35 to 44 Years | 252 (96.2%) | 10 (3.8%) |
| 45 to 54 Years | 248 (92.2%) | 21 (7.8%) |
| 55 to 64 Years | 301 (86.5%) | 47 (13.5%) |
| 65 to 74 Years | 354 (100.0%) | 0 (0.0%) |
| 75 Years and older | 299 (100.0%) | 0 (0.0%) |
| Total | 2,307 (91.9%) | 202 (8.1%) |
Health Insurance Coverage by Citizenship Status in Rawlins County
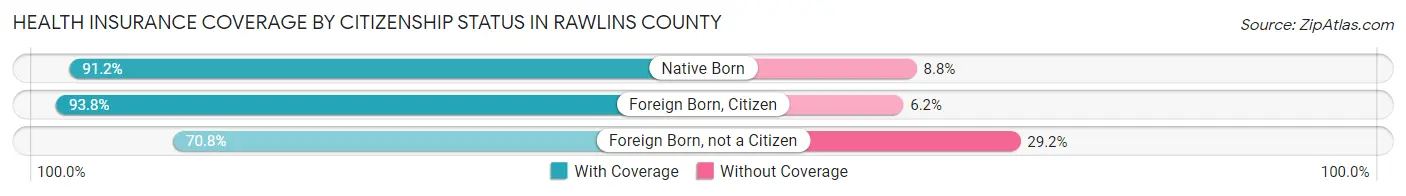
| Citizenship Status | With Coverage | Without Coverage |
| Native Born | 176 (91.2%) | 17 (8.8%) |
| Foreign Born, Citizen | 364 (93.8%) | 24 (6.2%) |
| Foreign Born, not a Citizen | 80 (70.8%) | 33 (29.2%) |
Health Insurance Coverage by Household Income in Rawlins County
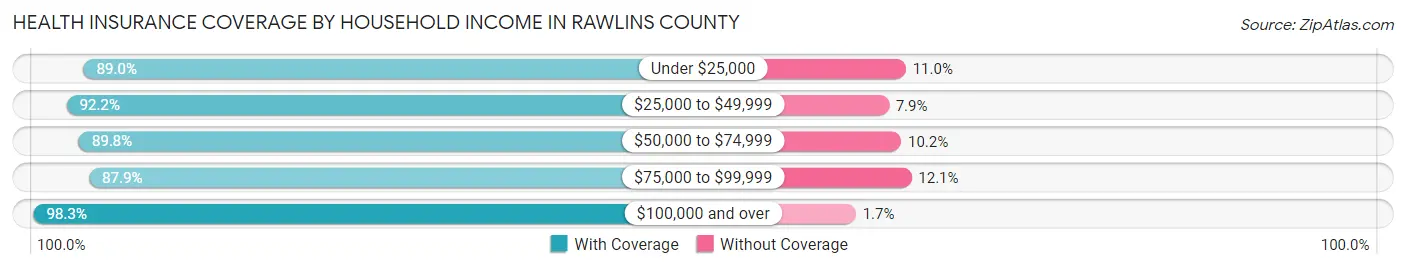
| Household Income | With Coverage | Without Coverage |
| Under $25,000 | 282 (89.0%) | 35 (11.0%) |
| $25,000 to $49,999 | 446 (92.1%) | 38 (7.9%) |
| $50,000 to $74,999 | 415 (89.8%) | 47 (10.2%) |
| $75,000 to $99,999 | 516 (87.9%) | 71 (12.1%) |
| $100,000 and over | 648 (98.3%) | 11 (1.7%) |
Public vs Private Health Insurance Coverage by Age in Rawlins County
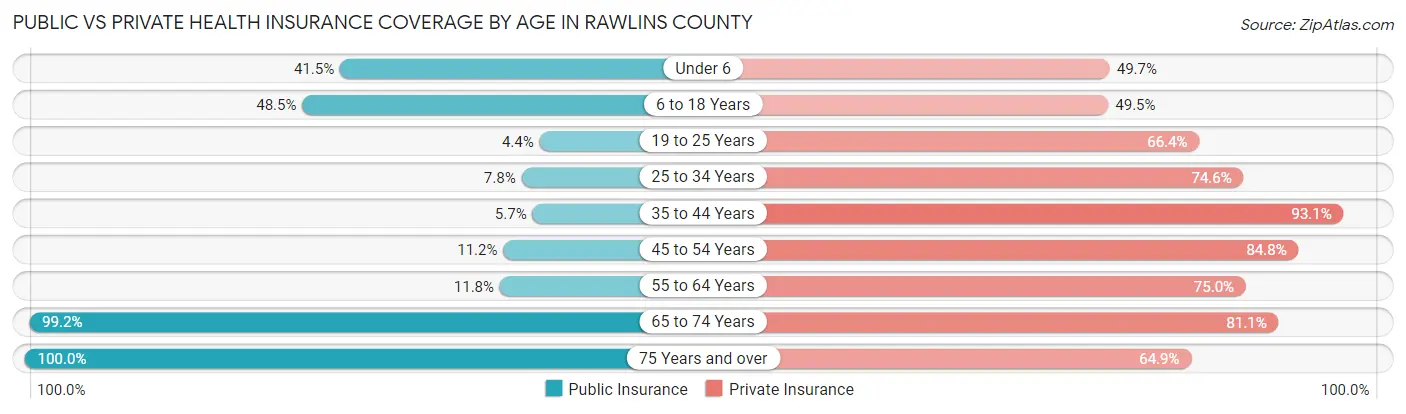
| Age Bracket | Public Insurance | Private Insurance |
| Under 6 | 80 (41.4%) | 96 (49.7%) |
| 6 to 18 Years | 188 (48.4%) | 192 (49.5%) |
| 19 to 25 Years | 5 (4.4%) | 75 (66.4%) |
| 25 to 34 Years | 22 (7.8%) | 211 (74.6%) |
| 35 to 44 Years | 15 (5.7%) | 244 (93.1%) |
| 45 to 54 Years | 30 (11.2%) | 228 (84.8%) |
| 55 to 64 Years | 41 (11.8%) | 261 (75.0%) |
| 65 to 74 Years | 351 (99.2%) | 287 (81.1%) |
| 75 Years and over | 299 (100.0%) | 194 (64.9%) |
| Total | 1,031 (41.1%) | 1,788 (71.3%) |
Disability Status by Sex by Age in Rawlins County
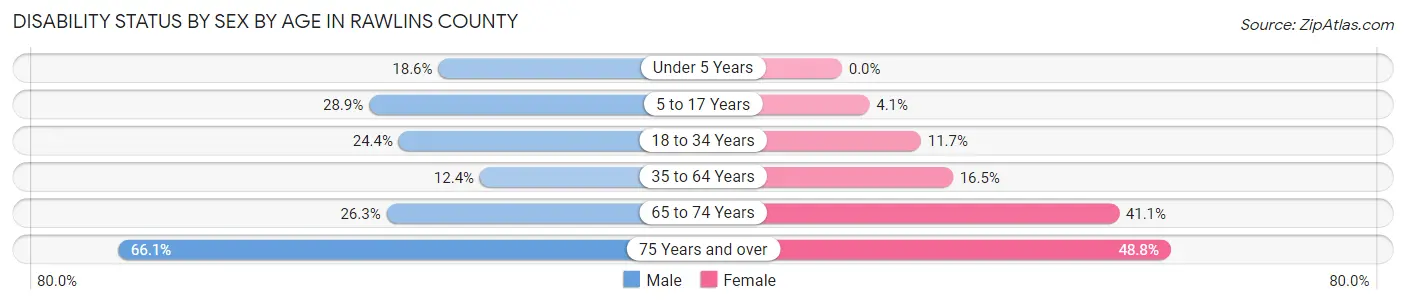
| Age Bracket | Male | Female |
| Under 5 Years | 18 (18.6%) | 0 (0.0%) |
| 5 to 17 Years | 60 (28.8%) | 8 (4.1%) |
| 18 to 34 Years | 54 (24.4%) | 21 (11.7%) |
| 35 to 64 Years | 57 (12.4%) | 69 (16.5%) |
| 65 to 74 Years | 47 (26.3%) | 72 (41.1%) |
| 75 Years and over | 84 (66.1%) | 84 (48.8%) |
Disability Class by Sex by Age in Rawlins County
Disability Class: Hearing Difficulty
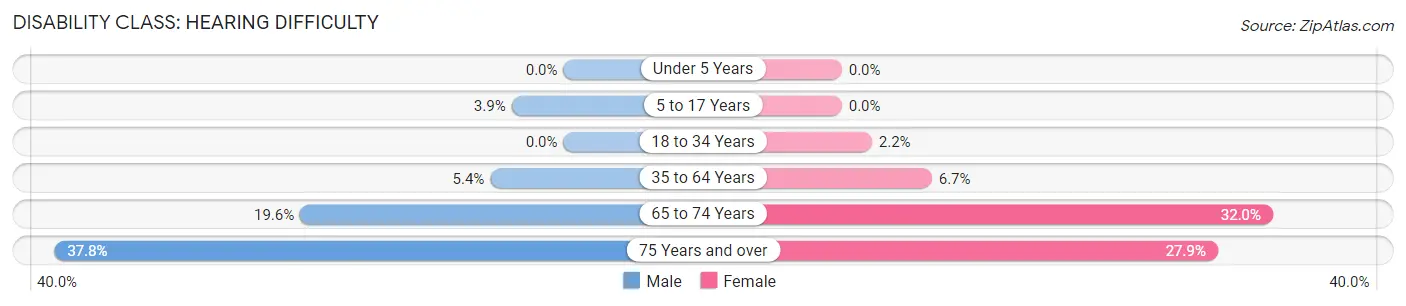
| Age Bracket | Male | Female |
| Under 5 Years | 0 (0.0%) | 0 (0.0%) |
| 5 to 17 Years | 8 (3.8%) | 0 (0.0%) |
| 18 to 34 Years | 0 (0.0%) | 4 (2.2%) |
| 35 to 64 Years | 25 (5.4%) | 28 (6.7%) |
| 65 to 74 Years | 35 (19.6%) | 56 (32.0%) |
| 75 Years and over | 48 (37.8%) | 48 (27.9%) |
Disability Class: Vision Difficulty
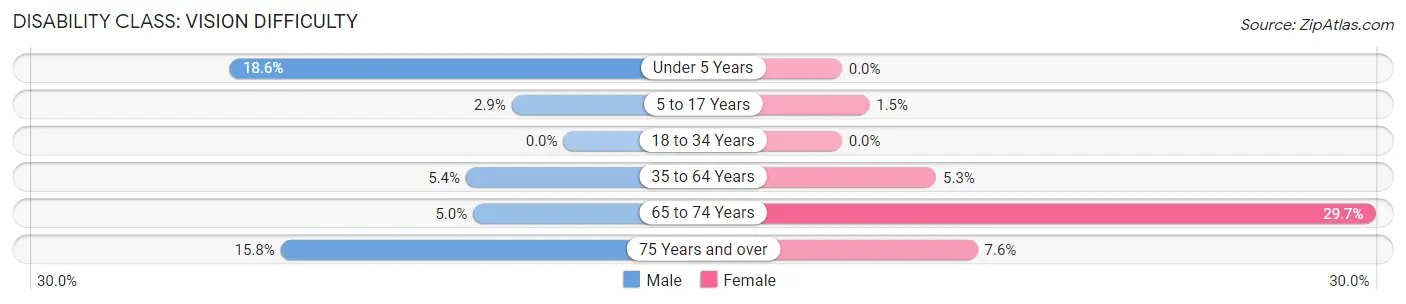
| Age Bracket | Male | Female |
| Under 5 Years | 18 (18.6%) | 0 (0.0%) |
| 5 to 17 Years | 6 (2.9%) | 3 (1.5%) |
| 18 to 34 Years | 0 (0.0%) | 0 (0.0%) |
| 35 to 64 Years | 25 (5.4%) | 22 (5.2%) |
| 65 to 74 Years | 9 (5.0%) | 52 (29.7%) |
| 75 Years and over | 20 (15.8%) | 13 (7.6%) |
Disability Class: Cognitive Difficulty
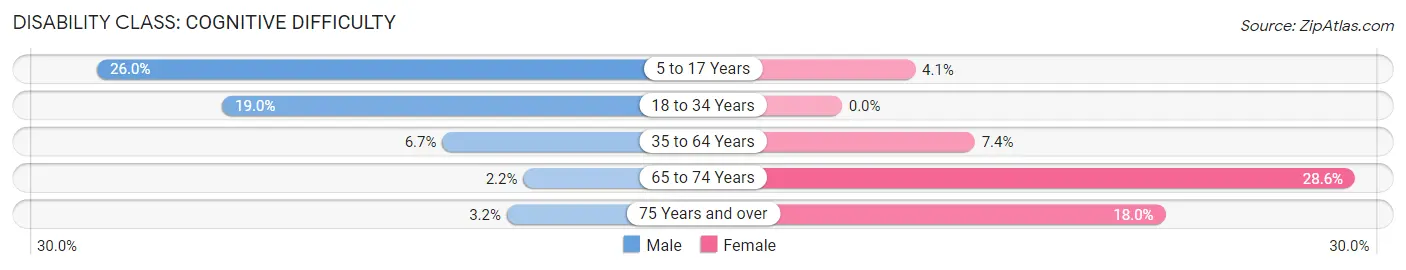
| Age Bracket | Male | Female |
| 5 to 17 Years | 54 (26.0%) | 8 (4.1%) |
| 18 to 34 Years | 42 (19.0%) | 0 (0.0%) |
| 35 to 64 Years | 31 (6.7%) | 31 (7.4%) |
| 65 to 74 Years | 4 (2.2%) | 50 (28.6%) |
| 75 Years and over | 4 (3.2%) | 31 (18.0%) |
Disability Class: Ambulatory Difficulty
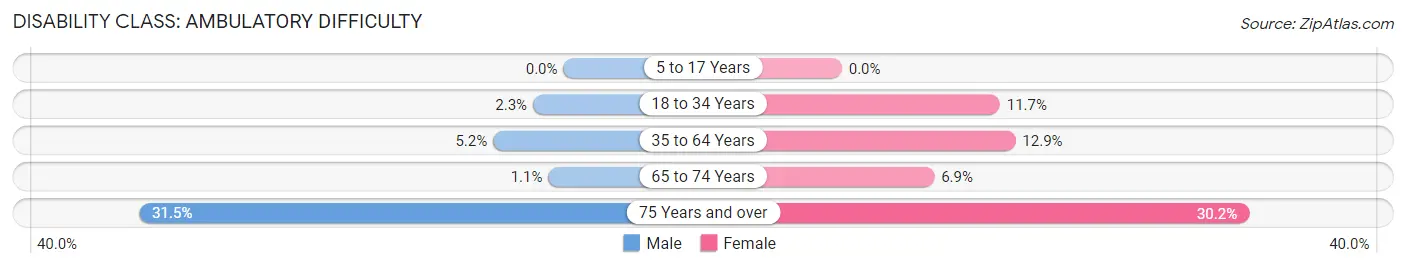
| Age Bracket | Male | Female |
| 5 to 17 Years | 0 (0.0%) | 0 (0.0%) |
| 18 to 34 Years | 5 (2.3%) | 21 (11.7%) |
| 35 to 64 Years | 24 (5.2%) | 54 (12.9%) |
| 65 to 74 Years | 2 (1.1%) | 12 (6.9%) |
| 75 Years and over | 40 (31.5%) | 52 (30.2%) |
Disability Class: Self-Care Difficulty
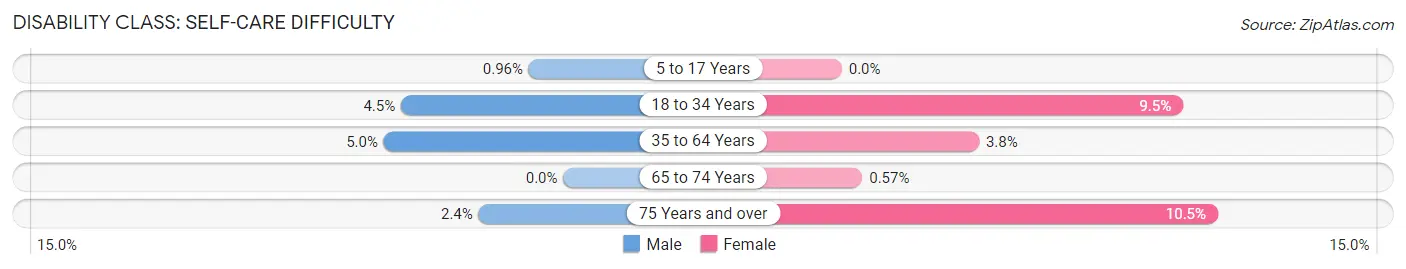
| Age Bracket | Male | Female |
| 5 to 17 Years | 2 (1.0%) | 0 (0.0%) |
| 18 to 34 Years | 10 (4.5%) | 17 (9.5%) |
| 35 to 64 Years | 23 (5.0%) | 16 (3.8%) |
| 65 to 74 Years | 0 (0.0%) | 1 (0.6%) |
| 75 Years and over | 3 (2.4%) | 18 (10.5%) |
Technology Access in Rawlins County
Computing Device Access in Rawlins County
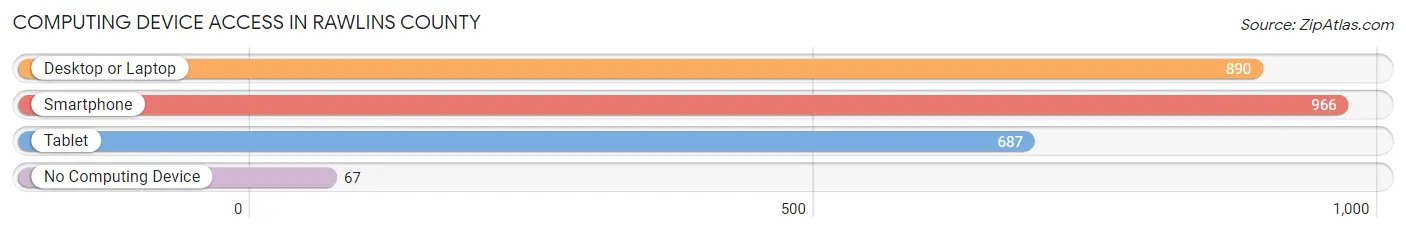
| Device Type | # Households | % Households |
| Desktop or Laptop | 890 | 76.4% |
| Smartphone | 966 | 82.9% |
| Tablet | 687 | 59.0% |
| No Computing Device | 67 | 5.8% |
| Total | 1,165 | 100.0% |
Internet Access in Rawlins County
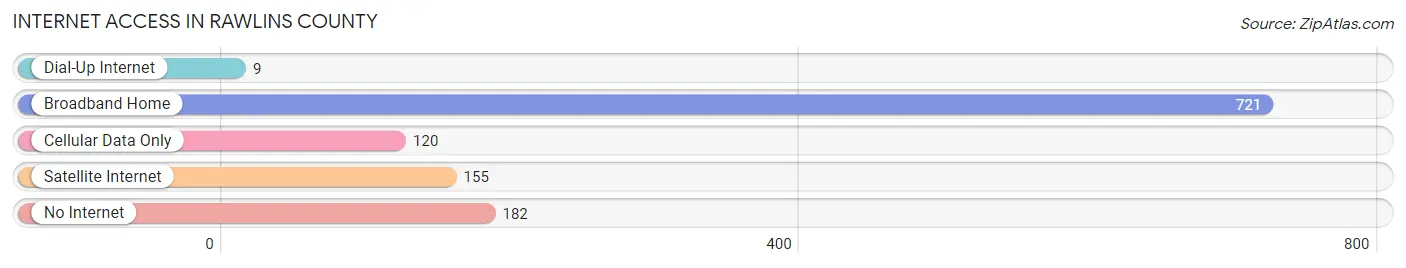
| Internet Type | # Households | % Households |
| Dial-Up Internet | 9 | 0.8% |
| Broadband Home | 721 | 61.9% |
| Cellular Data Only | 120 | 10.3% |
| Satellite Internet | 155 | 13.3% |
| No Internet | 182 | 15.6% |
| Total | 1,165 | 100.0% |
Rawlins County Summary
Rawlins County is located in the northwest corner of Kansas, and is bordered by Nebraska to the north, Colorado to the west, and Cheyenne County to the east. The county seat is Atwood, and the county was named after Union General John Aaron Rawlins. The county has a total area of 890 square miles, and a population of 2,845 as of the 2010 census.
History
Rawlins County was established in 1873, and was named after Union General John Aaron Rawlins. The county was originally part of Cheyenne County, and was created from the western portion of that county. The first settlers in the area were mostly ranchers and farmers, and the county was largely rural until the early 20th century.
In the early 1900s, the county began to experience an influx of settlers from other parts of the country, and the population began to grow. The county was also home to several small towns, including Atwood, Herndon, and McDonald.
Geography
Rawlins County is located in the northwest corner of Kansas, and is bordered by Nebraska to the north, Colorado to the west, and Cheyenne County to the east. The county has a total area of 890 square miles, and is mostly flat, with some rolling hills in the eastern part of the county. The county is home to several small lakes, including Atwood Lake, Herndon Lake, and McDonald Lake.
The county is home to several small towns, including Atwood, Herndon, and McDonald. The county seat is Atwood, and the county is served by two highways, US-36 and US-24.
Economy
The economy of Rawlins County is largely based on agriculture, and the county is home to several large farms and ranches. The county is also home to several small businesses, including restaurants, retail stores, and service providers.
The county is also home to several manufacturing companies, including a concrete plant, a grain elevator, and a feed mill. The county is also home to several oil and gas companies, and the county is home to several wind farms.
Demographics
As of the 2010 census, the population of Rawlins County was 2,845, and the county had a population density of 3.2 people per square mile. The racial makeup of the county was 95.3% White, 0.7% Native American, 0.2% Asian, 0.1% Black or African American, 0.1% Pacific Islander, and 3.6% from other races.
The median income for a household in the county was $37,917, and the median income for a family was $45,000. The per capita income for the county was $18,845. The unemployment rate in the county was 4.2%.
Common Questions
What is Per Capita Income in Rawlins County?
Per Capita income in Rawlins County is $33,003.
What is the Median Family Income in Rawlins County?
Median Family Income in Rawlins County is $77,847.
What is the Median Household income in Rawlins County?
Median Household Income in Rawlins County is $61,827.
What is Income or Wage Gap in Rawlins County?
Income or Wage Gap in Rawlins County is 39.1%.
Women in Rawlins County earn 60.9 cents for every dollar earned by a man.
What is Inequality or Gini Index in Rawlins County?
Inequality or Gini Index in Rawlins County is 0.41.
What is the Total Population of Rawlins County?
Total Population of Rawlins County is 2,544.
What is the Total Male Population of Rawlins County?
Total Male Population of Rawlins County is 1,304.
What is the Total Female Population of Rawlins County?
Total Female Population of Rawlins County is 1,240.
What is the Ratio of Males per 100 Females in Rawlins County?
There are 105.16 Males per 100 Females in Rawlins County.
What is the Ratio of Females per 100 Males in Rawlins County?
There are 95.09 Females per 100 Males in Rawlins County.
What is the Median Population Age in Rawlins County?
Median Population Age in Rawlins County is 46.2 Years.
What is the Average Family Size in Rawlins County
Average Family Size in Rawlins County is 2.7 People.
What is the Average Household Size in Rawlins County
Average Household Size in Rawlins County is 2.1 People.
How Large is the Labor Force in Rawlins County?
There are 1,357 People in the Labor Forcein in Rawlins County.
What is the Percentage of People in the Labor Force in Rawlins County?
66.9% of People are in the Labor Force in Rawlins County.
What is the Unemployment Rate in Rawlins County?
Unemployment Rate in Rawlins County is 1.0%.