Pawnee County, KS Map & Demographics
Pawnee County Map
Pawnee County Overview
$32,542
PER CAPITA INCOME
$82,115
AVG FAMILY INCOME
$54,141
AVG HOUSEHOLD INCOME
3.1%
WAGE / INCOME GAP [ % ]
96.9¢/ $1
WAGE / INCOME GAP [ $ ]
0.43
INEQUALITY / GINI INDEX
6,288
TOTAL POPULATION
3,448
MALE POPULATION
2,840
FEMALE POPULATION
121.41
MALES / 100 FEMALES
82.37
FEMALES / 100 MALES
46.1
MEDIAN AGE
3.4
AVG FAMILY SIZE
2.2
AVG HOUSEHOLD SIZE
2,838
LABOR FORCE [ PEOPLE ]
51.6%
PERCENT IN LABOR FORCE
1.6%
UNEMPLOYMENT RATE
Pawnee County Area Codes
Income in Pawnee County
Income Overview in Pawnee County
Per Capita Income in Pawnee County is $32,542, while median incomes of families and households are $82,115 and $54,141 respectively.
| Characteristic | Number | Measure |
| Per Capita Income | 6,288 | $32,542 |
| Median Family Income | 1,114 | $82,115 |
| Mean Family Income | 1,114 | $97,426 |
| Median Household Income | 2,396 | $54,141 |
| Mean Household Income | 2,396 | $75,010 |
| Income Deficit | 1,114 | $0 |
| Wage / Income Gap (%) | 6,288 | 3.06% |
| Wage / Income Gap ($) | 6,288 | 96.94¢ per $1 |
| Gini / Inequality Index | 6,288 | 0.43 |
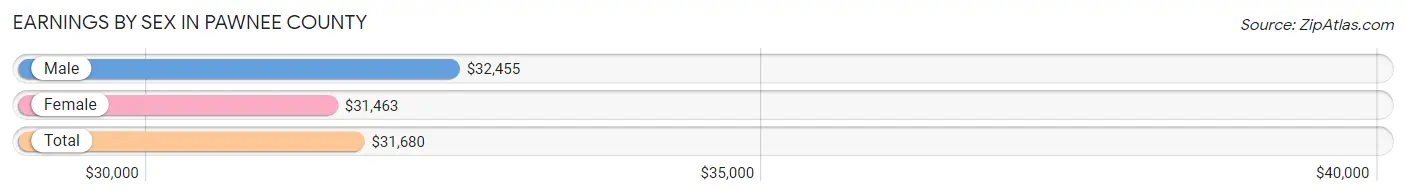
Earnings by Sex in Pawnee County
Average Earnings in Pawnee County are $31,680, $32,455 for men and $31,463 for women, a difference of 3.1%.
| Sex | Number | Average Earnings |
| Male | 2,086 (61.1%) | $32,455 |
| Female | 1,326 (38.9%) | $31,463 |
| Total | 3,412 (100.0%) | $31,680 |
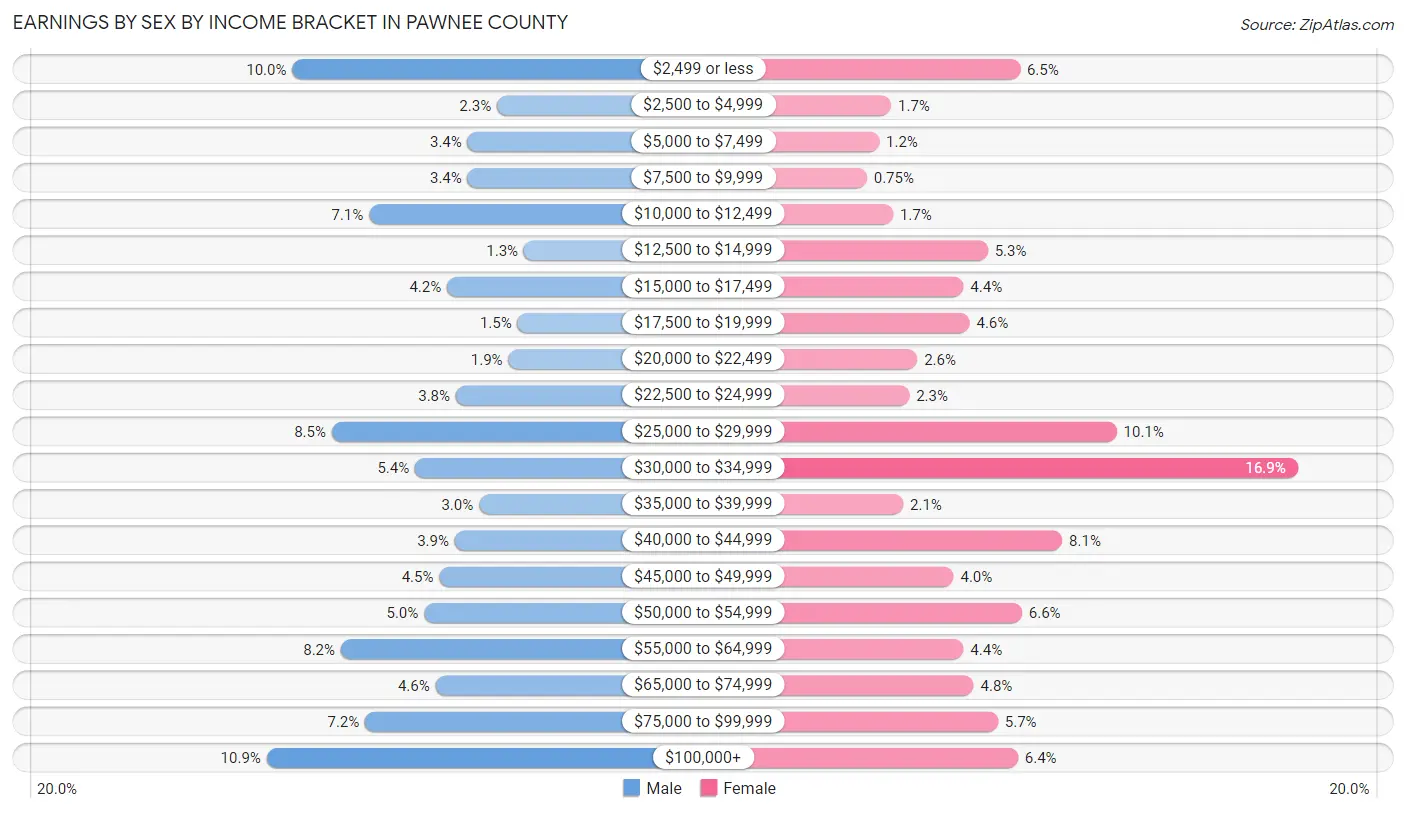
Earnings by Sex by Income Bracket in Pawnee County
The most common earnings brackets in Pawnee County are $100,000+ for men (228 | 10.9%) and $30,000 to $34,999 for women (224 | 16.9%).
| Income | Male | Female |
| $2,499 or less | 208 (10.0%) | 86 (6.5%) |
| $2,500 to $4,999 | 48 (2.3%) | 22 (1.7%) |
| $5,000 to $7,499 | 71 (3.4%) | 16 (1.2%) |
| $7,500 to $9,999 | 71 (3.4%) | 10 (0.7%) |
| $10,000 to $12,499 | 148 (7.1%) | 23 (1.7%) |
| $12,500 to $14,999 | 27 (1.3%) | 70 (5.3%) |
| $15,000 to $17,499 | 87 (4.2%) | 58 (4.4%) |
| $17,500 to $19,999 | 32 (1.5%) | 61 (4.6%) |
| $20,000 to $22,499 | 39 (1.9%) | 35 (2.6%) |
| $22,500 to $24,999 | 80 (3.8%) | 31 (2.3%) |
| $25,000 to $29,999 | 177 (8.5%) | 134 (10.1%) |
| $30,000 to $34,999 | 112 (5.4%) | 224 (16.9%) |
| $35,000 to $39,999 | 62 (3.0%) | 28 (2.1%) |
| $40,000 to $44,999 | 81 (3.9%) | 107 (8.1%) |
| $45,000 to $49,999 | 93 (4.5%) | 53 (4.0%) |
| $50,000 to $54,999 | 105 (5.0%) | 87 (6.6%) |
| $55,000 to $64,999 | 170 (8.2%) | 58 (4.4%) |
| $65,000 to $74,999 | 96 (4.6%) | 63 (4.8%) |
| $75,000 to $99,999 | 151 (7.2%) | 75 (5.7%) |
| $100,000+ | 228 (10.9%) | 85 (6.4%) |
| Total | 2,086 (100.0%) | 1,326 (100.0%) |
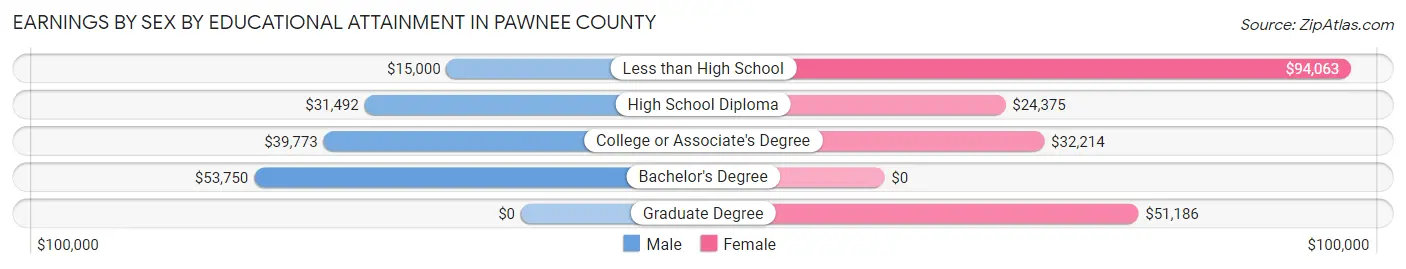
Earnings by Sex by Educational Attainment in Pawnee County
Average earnings in Pawnee County are $34,444 for men and $31,869 for women, a difference of 7.5%. Men with an educational attainment of bachelor's degree enjoy the highest average annual earnings of $53,750, while those with less than high school education earn the least with $15,000. Women with an educational attainment of less than high school earn the most with the average annual earnings of $94,063, while those with high school diploma education have the smallest earnings of $24,375.
| Educational Attainment | Male Income | Female Income |
| Less than High School | $15,000 | $94,063 |
| High School Diploma | $31,492 | $24,375 |
| College or Associate's Degree | $39,773 | $32,214 |
| Bachelor's Degree | $53,750 | $0 |
| Graduate Degree | - | - |
| Total | $34,444 | $31,869 |
Family Income in Pawnee County
Family Income Brackets in Pawnee County
According to the Pawnee County family income data, there are 258 families falling into the $75,000 to $99,999 income range, which is the most common income bracket and makes up 23.2% of all families.
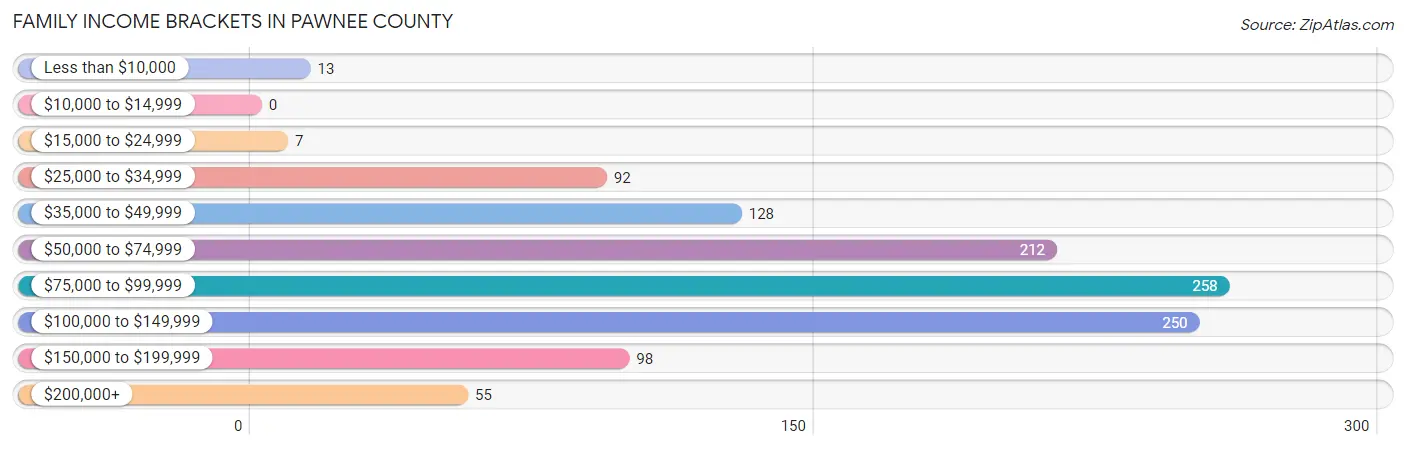
| Income Bracket | # Families | % Families |
| Less than $10,000 | 13 | 1.2% |
| $10,000 to $14,999 | 0 | 0.0% |
| $15,000 to $24,999 | 7 | 0.6% |
| $25,000 to $34,999 | 92 | 8.3% |
| $35,000 to $49,999 | 128 | 11.5% |
| $50,000 to $74,999 | 212 | 19.0% |
| $75,000 to $99,999 | 258 | 23.2% |
| $100,000 to $149,999 | 250 | 22.4% |
| $150,000 to $199,999 | 98 | 8.8% |
| $200,000+ | 55 | 4.9% |
Family Income by Famaliy Size in Pawnee County
5-person families (114 | 10.2%) account for the highest median family income in Pawnee County with $145,385 per family, while 2-person families (581 | 52.1%) have the highest median income of $40,428 per family member.
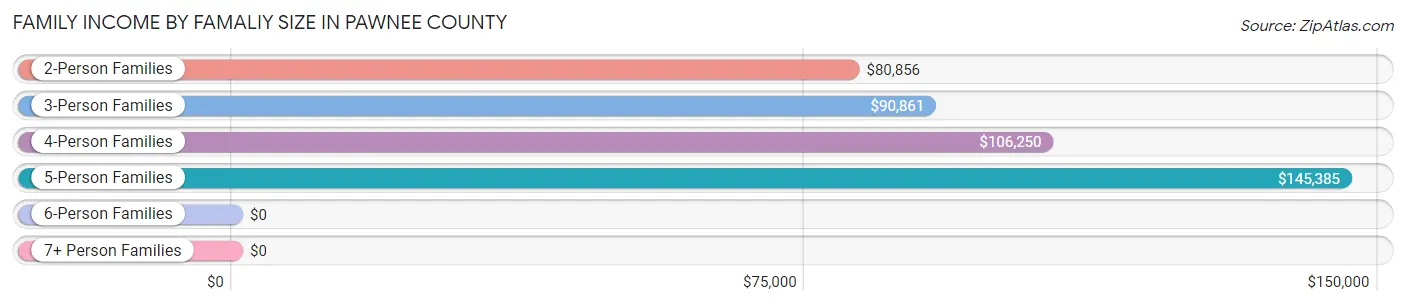
| Income Bracket | # Families | Median Income |
| 2-Person Families | 581 (52.1%) | $80,856 |
| 3-Person Families | 225 (20.2%) | $90,861 |
| 4-Person Families | 133 (11.9%) | $106,250 |
| 5-Person Families | 114 (10.2%) | $145,385 |
| 6-Person Families | 30 (2.7%) | $0 |
| 7+ Person Families | 31 (2.8%) | $0 |
| Total | 1,114 (100.0%) | $82,115 |
Family Income by Number of Earners in Pawnee County
The median family income in Pawnee County is $82,115, with families comprising 3+ earners (133) having the highest median family income of $169,063, while families with no earners (107) have the lowest median family income of $55,625, accounting for 11.9% and 9.6% of families, respectively.
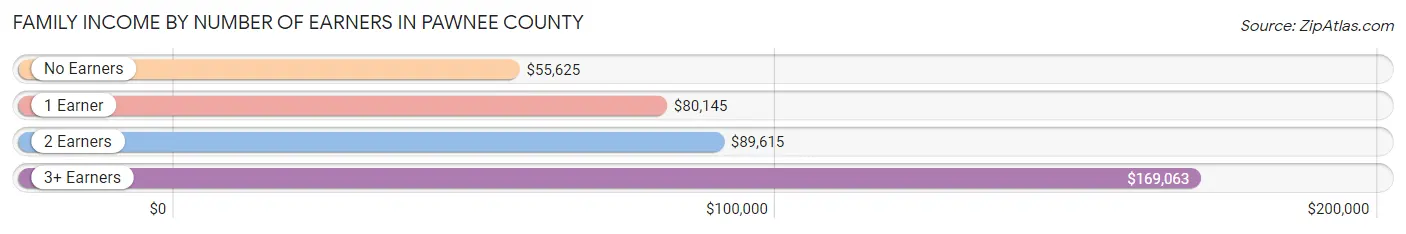
| Number of Earners | # Families | Median Income |
| No Earners | 107 (9.6%) | $55,625 |
| 1 Earner | 452 (40.6%) | $80,145 |
| 2 Earners | 422 (37.9%) | $89,615 |
| 3+ Earners | 133 (11.9%) | $169,063 |
| Total | 1,114 (100.0%) | $82,115 |
Household Income in Pawnee County
Household Income Brackets in Pawnee County
With 371 households falling in the category, the $100,000 to $149,999 income range is the most frequent in Pawnee County, accounting for 15.5% of all households. In contrast, only 103 households (4.3%) fall into the less than $10,000 income bracket, making it the least populous group.
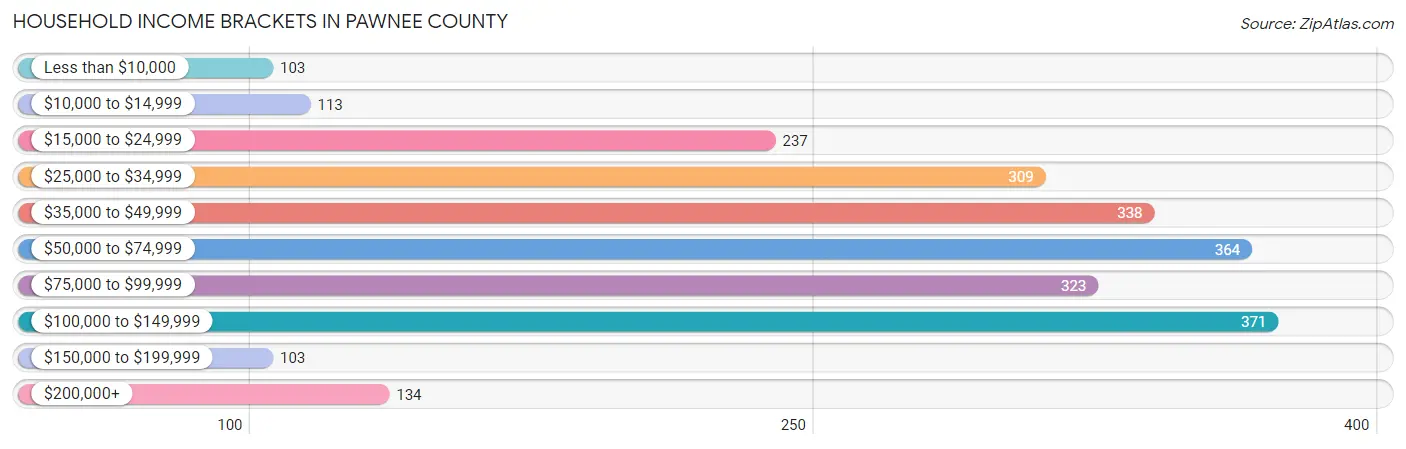
| Income Bracket | # Households | % Households |
| Less than $10,000 | 103 | 4.3% |
| $10,000 to $14,999 | 113 | 4.7% |
| $15,000 to $24,999 | 237 | 9.9% |
| $25,000 to $34,999 | 309 | 12.9% |
| $35,000 to $49,999 | 338 | 14.1% |
| $50,000 to $74,999 | 364 | 15.2% |
| $75,000 to $99,999 | 323 | 13.5% |
| $100,000 to $149,999 | 371 | 15.5% |
| $150,000 to $199,999 | 103 | 4.3% |
| $200,000+ | 134 | 5.6% |
Household Income by Householder Age in Pawnee County
The median household income in Pawnee County is $54,141, with the highest median household income of $63,906 found in the 45 to 64 years age bracket for the primary householder. A total of 793 households (33.1%) fall into this category. Meanwhile, the 65+ years age bracket for the primary householder has the lowest median household income of $40,391, with 855 households (35.7%) in this group.
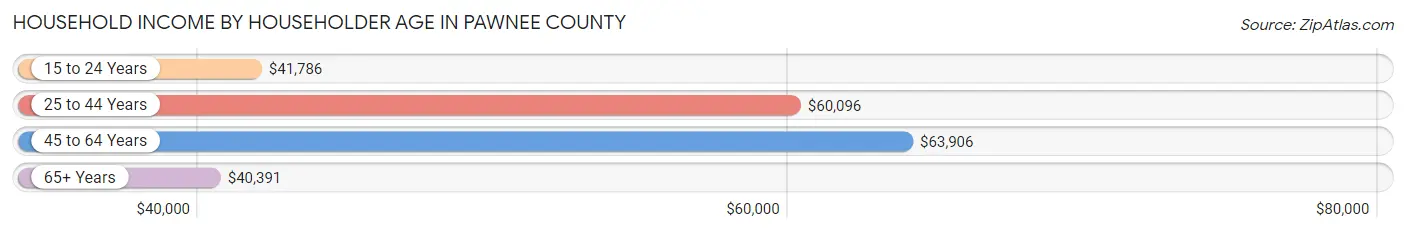
| Income Bracket | # Households | Median Income |
| 15 to 24 Years | 76 (3.2%) | $41,786 |
| 25 to 44 Years | 672 (28.1%) | $60,096 |
| 45 to 64 Years | 793 (33.1%) | $63,906 |
| 65+ Years | 855 (35.7%) | $40,391 |
| Total | 2,396 (100.0%) | $54,141 |
Poverty in Pawnee County
Income Below Poverty by Sex and Age in Pawnee County
With 8.3% poverty level for males and 15.2% for females among the residents of Pawnee County, 25 to 34 year old males and 18 to 24 year old females are the most vulnerable to poverty, with 45 males (15.9%) and 60 females (36.8%) in their respective age groups living below the poverty level.
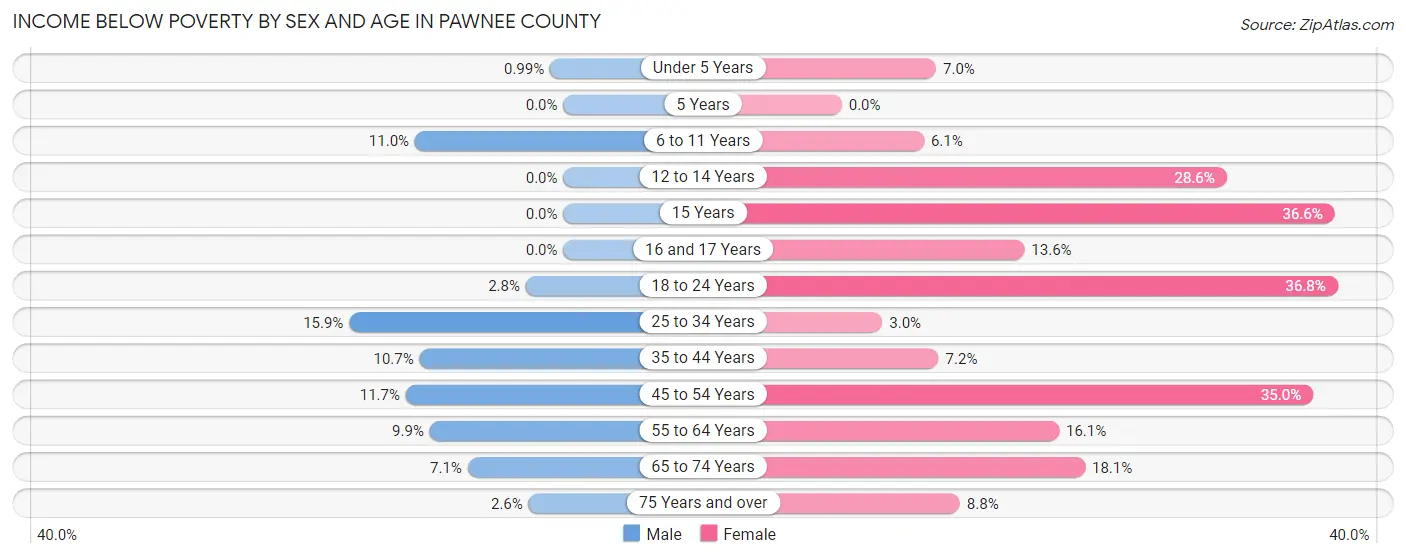
| Age Bracket | Male | Female |
| Under 5 Years | 1 (1.0%) | 7 (7.0%) |
| 5 Years | 0 (0.0%) | 0 (0.0%) |
| 6 to 11 Years | 13 (11.0%) | 13 (6.1%) |
| 12 to 14 Years | 0 (0.0%) | 4 (28.6%) |
| 15 Years | 0 (0.0%) | 15 (36.6%) |
| 16 and 17 Years | 0 (0.0%) | 8 (13.6%) |
| 18 to 24 Years | 6 (2.8%) | 60 (36.8%) |
| 25 to 34 Years | 45 (15.9%) | 11 (3.0%) |
| 35 to 44 Years | 30 (10.7%) | 24 (7.2%) |
| 45 to 54 Years | 44 (11.7%) | 106 (35.0%) |
| 55 to 64 Years | 48 (9.9%) | 80 (16.1%) |
| 65 to 74 Years | 25 (7.1%) | 67 (18.1%) |
| 75 Years and over | 5 (2.6%) | 30 (8.8%) |
| Total | 217 (8.3%) | 425 (15.2%) |
Income Above Poverty by Sex and Age in Pawnee County
According to the poverty statistics in Pawnee County, males aged 5 years and females aged 25 to 34 years are the age groups that are most secure financially, with 100.0% of males and 97.0% of females in these age groups living above the poverty line.
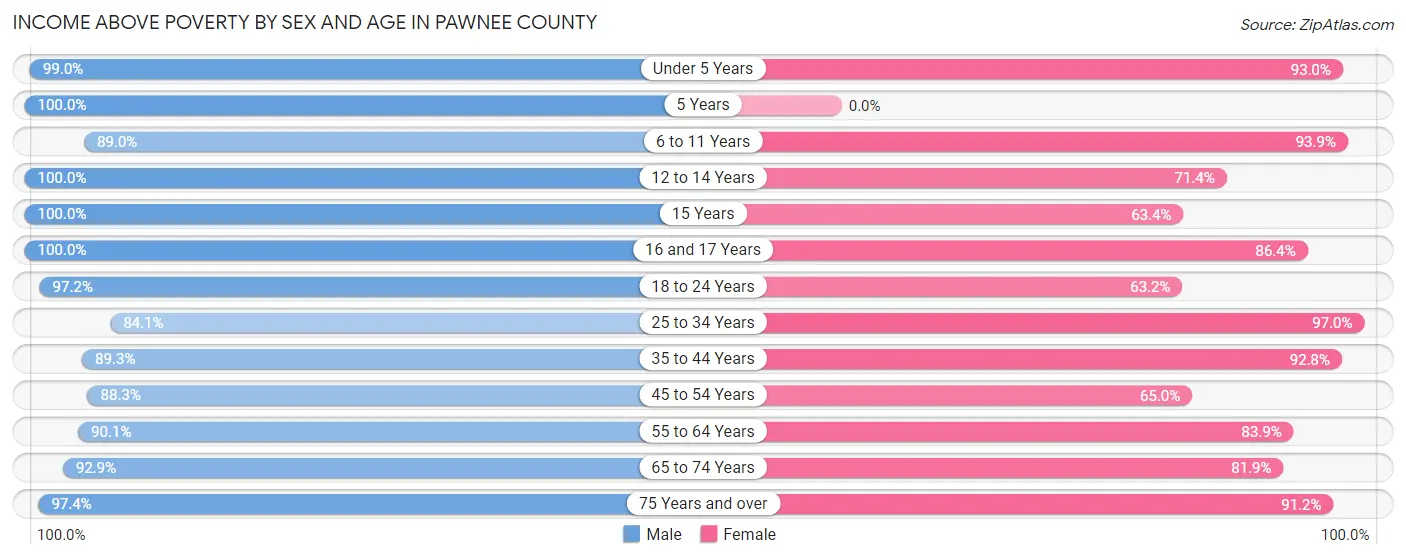
| Age Bracket | Male | Female |
| Under 5 Years | 100 (99.0%) | 93 (93.0%) |
| 5 Years | 37 (100.0%) | 0 (0.0%) |
| 6 to 11 Years | 105 (89.0%) | 200 (93.9%) |
| 12 to 14 Years | 110 (100.0%) | 10 (71.4%) |
| 15 Years | 8 (100.0%) | 26 (63.4%) |
| 16 and 17 Years | 42 (100.0%) | 51 (86.4%) |
| 18 to 24 Years | 209 (97.2%) | 103 (63.2%) |
| 25 to 34 Years | 238 (84.1%) | 354 (97.0%) |
| 35 to 44 Years | 251 (89.3%) | 310 (92.8%) |
| 45 to 54 Years | 332 (88.3%) | 197 (65.0%) |
| 55 to 64 Years | 436 (90.1%) | 416 (83.9%) |
| 65 to 74 Years | 327 (92.9%) | 304 (81.9%) |
| 75 Years and over | 189 (97.4%) | 312 (91.2%) |
| Total | 2,384 (91.7%) | 2,376 (84.8%) |
Income Below Poverty Among Married-Couple Families in Pawnee County
The poverty statistics for married-couple families in Pawnee County show that 1.9% or 19 of the total 988 families live below the poverty line. Families with 3 or 4 children have the highest poverty rate of 10.4%, comprising of 13 families. On the other hand, families with 5 or more children have the lowest poverty rate of 0.0%, which includes 0 families.
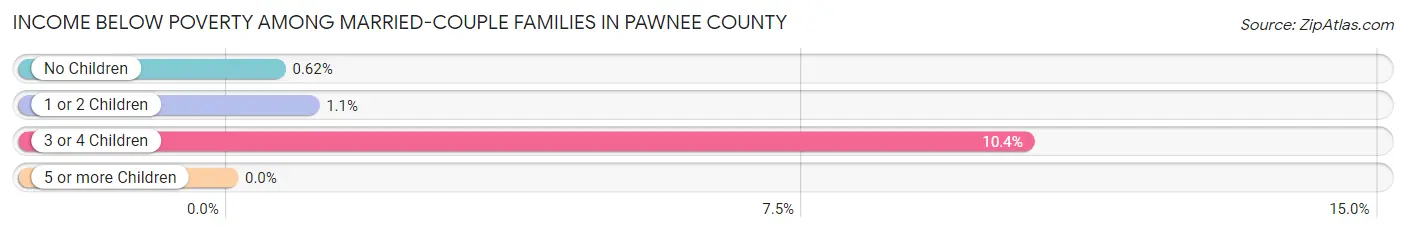
| Children | Above Poverty | Below Poverty |
| No Children | 645 (99.4%) | 4 (0.6%) |
| 1 or 2 Children | 186 (98.9%) | 2 (1.1%) |
| 3 or 4 Children | 112 (89.6%) | 13 (10.4%) |
| 5 or more Children | 26 (100.0%) | 0 (0.0%) |
| Total | 969 (98.1%) | 19 (1.9%) |
Income Below Poverty Among Single-Parent Households in Pawnee County
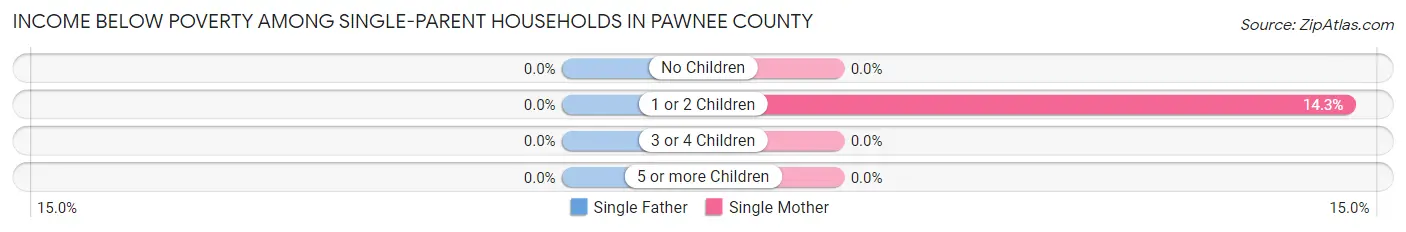
| Children | Single Father | Single Mother |
| No Children | 0 (0.0%) | 0 (0.0%) |
| 1 or 2 Children | 0 (0.0%) | 10 (14.3%) |
| 3 or 4 Children | 0 (0.0%) | 0 (0.0%) |
| 5 or more Children | 0 (0.0%) | 0 (0.0%) |
| Total | 0 (0.0%) | 10 (12.5%) |
Income Below Poverty Among Married-Couple vs Single-Parent Households in Pawnee County
The poverty data for Pawnee County shows that 19 of the married-couple family households (1.9%) and 10 of the single-parent households (7.9%) are living below the poverty level. Within the married-couple family households, those with 3 or 4 children have the highest poverty rate, with 13 households (10.4%) falling below the poverty line. Among the single-parent households, those with 1 or 2 children have the highest poverty rate, with 10 household (9.7%) living below poverty.
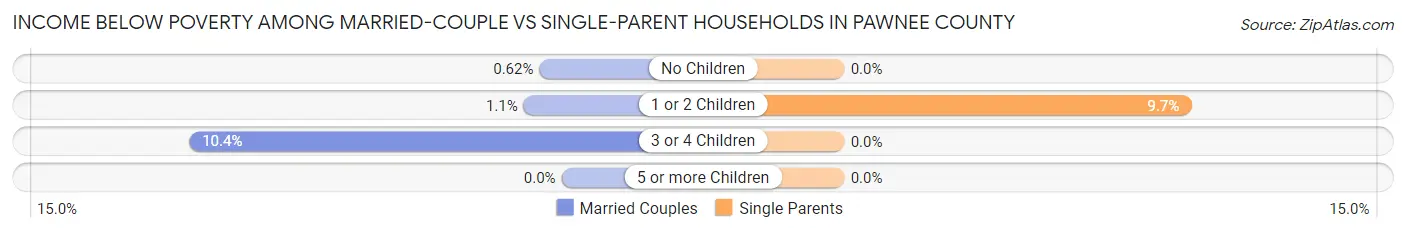
| Children | Married-Couple Families | Single-Parent Households |
| No Children | 4 (0.6%) | 0 (0.0%) |
| 1 or 2 Children | 2 (1.1%) | 10 (9.7%) |
| 3 or 4 Children | 13 (10.4%) | 0 (0.0%) |
| 5 or more Children | 0 (0.0%) | 0 (0.0%) |
| Total | 19 (1.9%) | 10 (7.9%) |
Race in Pawnee County
The most populous races in Pawnee County are White / Caucasian (5,527 | 87.9%), Hispanic or Latino (472 | 7.5%), and Black / African American (358 | 5.7%).
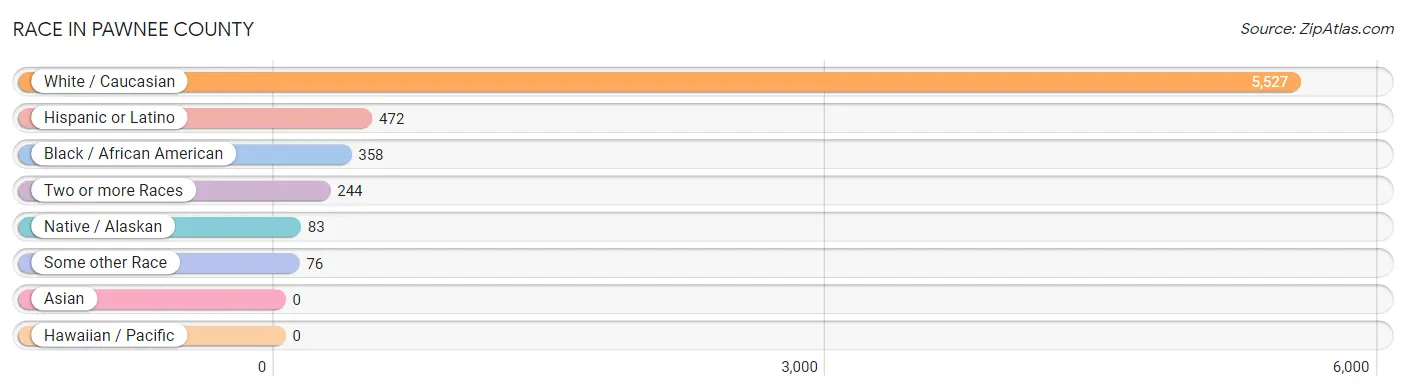
| Race | # Population | % Population |
| Asian | 0 | 0.0% |
| Black / African American | 358 | 5.7% |
| Hawaiian / Pacific | 0 | 0.0% |
| Hispanic or Latino | 472 | 7.5% |
| Native / Alaskan | 83 | 1.3% |
| White / Caucasian | 5,527 | 87.9% |
| Two or more Races | 244 | 3.9% |
| Some other Race | 76 | 1.2% |
| Total | 6,288 | 100.0% |
Ancestry in Pawnee County
The most populous ancestries reported in Pawnee County are German (1,693 | 26.9%), Irish (737 | 11.7%), English (528 | 8.4%), American (340 | 5.4%), and Mexican (305 | 4.9%), together accounting for 57.3% of all Pawnee County residents.
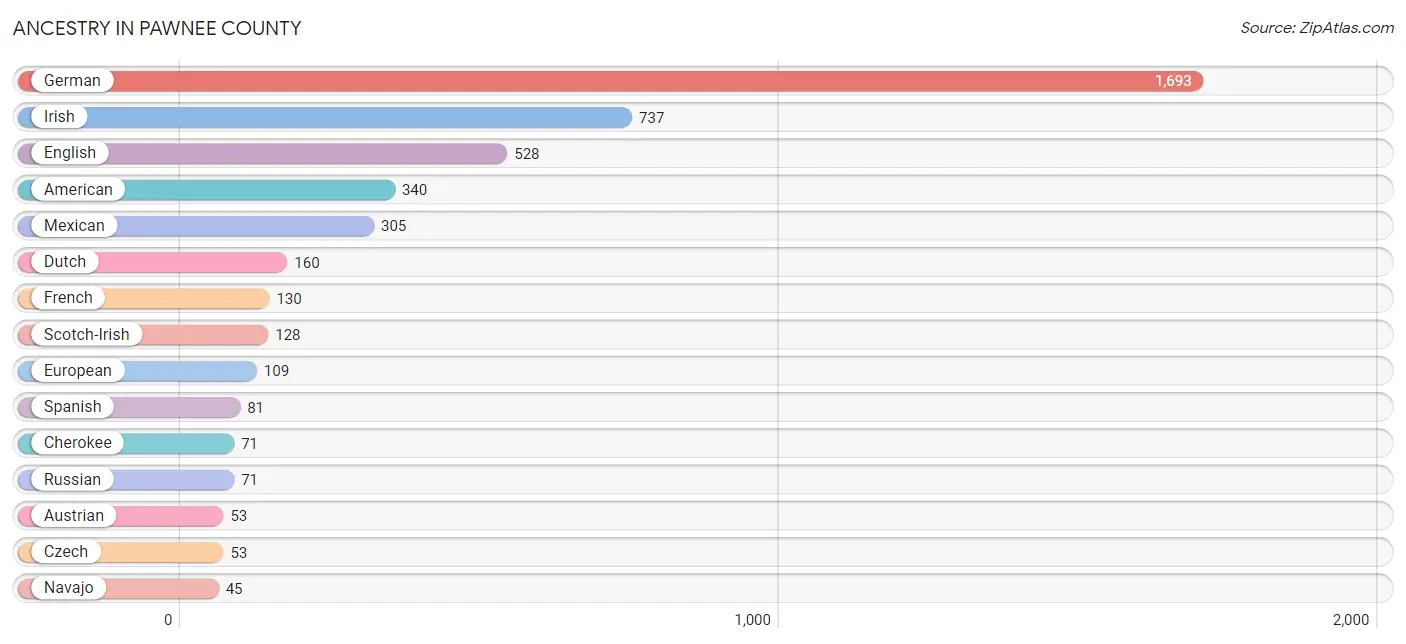
| Ancestry | # Population | % Population |
| American | 340 | 5.4% |
| Apache | 1 | 0.0% |
| Arab | 25 | 0.4% |
| Austrian | 53 | 0.8% |
| Brazilian | 1 | 0.0% |
| British | 4 | 0.1% |
| Cajun | 16 | 0.3% |
| Central American | 5 | 0.1% |
| Cherokee | 71 | 1.1% |
| Chickasaw | 13 | 0.2% |
| Chippewa | 1 | 0.0% |
| Choctaw | 6 | 0.1% |
| Cuban | 1 | 0.0% |
| Czech | 53 | 0.8% |
| Czechoslovakian | 31 | 0.5% |
| Danish | 2 | 0.0% |
| Dutch | 160 | 2.5% |
| English | 528 | 8.4% |
| European | 109 | 1.7% |
| French | 130 | 2.1% |
| French American Indian | 22 | 0.4% |
| French Canadian | 16 | 0.3% |
| German | 1,693 | 26.9% |
| Hungarian | 10 | 0.2% |
| Irish | 737 | 11.7% |
| Iroquois | 3 | 0.1% |
| Italian | 33 | 0.5% |
| Mexican | 305 | 4.9% |
| Moroccan | 4 | 0.1% |
| Navajo | 45 | 0.7% |
| Norwegian | 31 | 0.5% |
| Polish | 39 | 0.6% |
| Pueblo | 1 | 0.0% |
| Puerto Rican | 16 | 0.3% |
| Russian | 71 | 1.1% |
| Salvadoran | 5 | 0.1% |
| Scandinavian | 30 | 0.5% |
| Scotch-Irish | 128 | 2.0% |
| Scottish | 34 | 0.5% |
| Slovak | 11 | 0.2% |
| Spaniard | 21 | 0.3% |
| Spanish | 81 | 1.3% |
| Swedish | 23 | 0.4% |
| Swiss | 1 | 0.0% |
| Syrian | 4 | 0.1% |
| Ute | 45 | 0.7% |
| Welsh | 3 | 0.1% |
| Yaqui | 4 | 0.1% | View All 48 Rows |
Immigrants in Pawnee County
The most numerous immigrant groups reported in Pawnee County came from Central America (44 | 0.7%), Latin America (44 | 0.7%), Mexico (39 | 0.6%), Europe (16 | 0.3%), and Northern Europe (13 | 0.2%), together accounting for 2.5% of all Pawnee County residents.
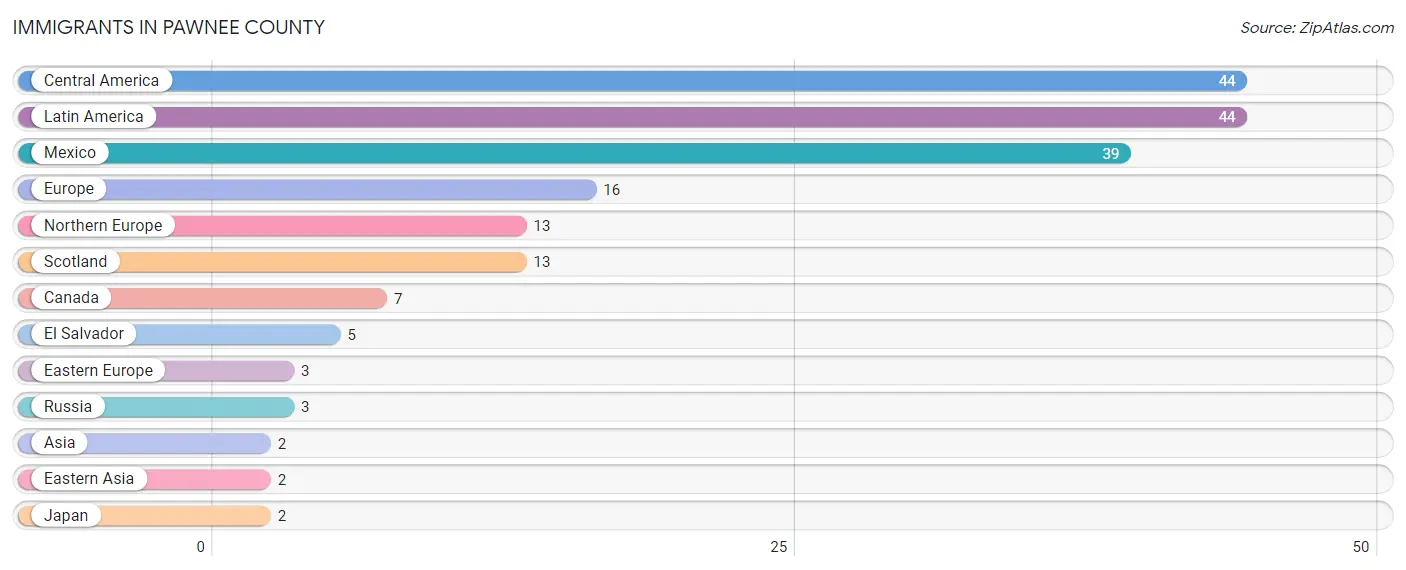
| Immigration Origin | # Population | % Population |
| Asia | 2 | 0.0% |
| Canada | 7 | 0.1% |
| Central America | 44 | 0.7% |
| Eastern Asia | 2 | 0.0% |
| Eastern Europe | 3 | 0.1% |
| El Salvador | 5 | 0.1% |
| Europe | 16 | 0.3% |
| Japan | 2 | 0.0% |
| Latin America | 44 | 0.7% |
| Mexico | 39 | 0.6% |
| Northern Europe | 13 | 0.2% |
| Russia | 3 | 0.1% |
| Scotland | 13 | 0.2% | View All 13 Rows |
Sex and Age in Pawnee County
Sex and Age in Pawnee County
The most populous age groups in Pawnee County are 35 to 39 Years (399 | 11.6%) for men and 60 to 64 Years (349 | 12.3%) for women.
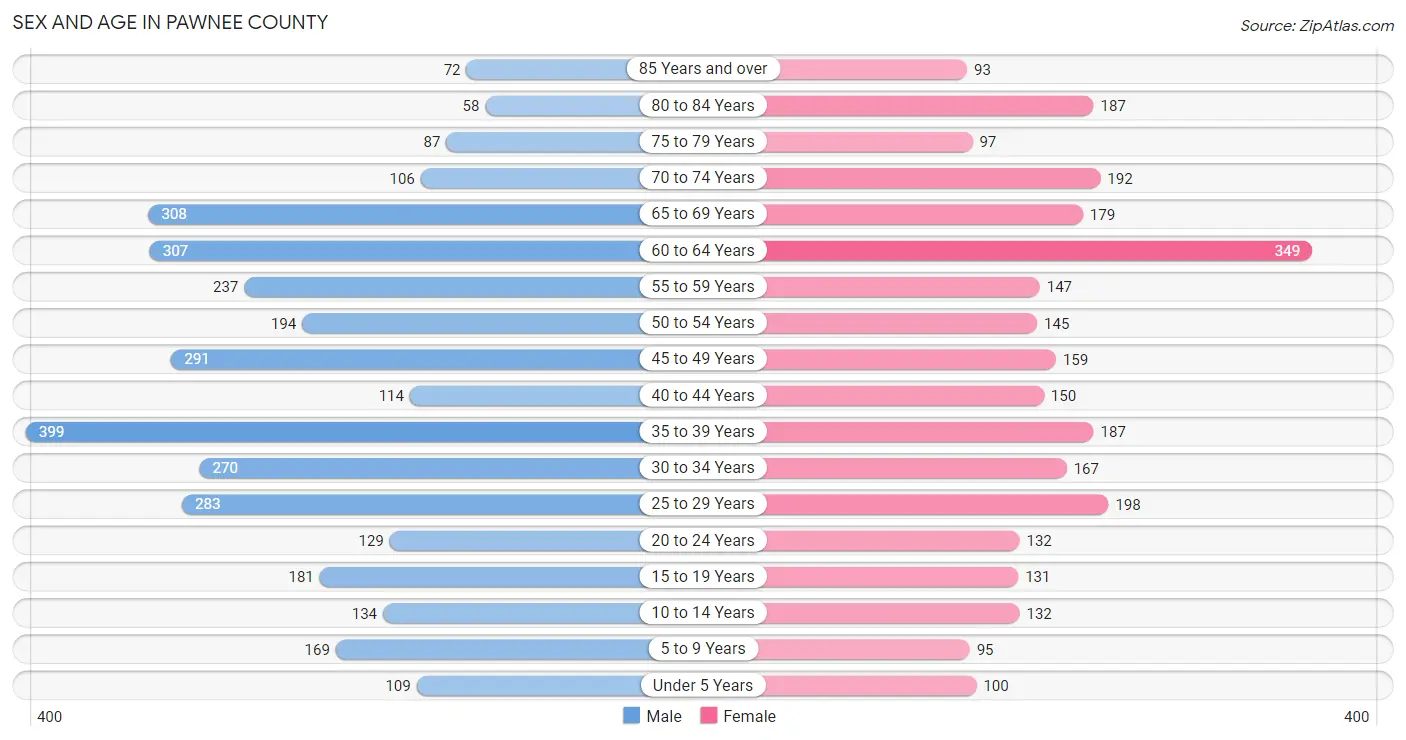
| Age Bracket | Male | Female |
| Under 5 Years | 109 (3.2%) | 100 (3.5%) |
| 5 to 9 Years | 169 (4.9%) | 95 (3.4%) |
| 10 to 14 Years | 134 (3.9%) | 132 (4.6%) |
| 15 to 19 Years | 181 (5.2%) | 131 (4.6%) |
| 20 to 24 Years | 129 (3.7%) | 132 (4.6%) |
| 25 to 29 Years | 283 (8.2%) | 198 (7.0%) |
| 30 to 34 Years | 270 (7.8%) | 167 (5.9%) |
| 35 to 39 Years | 399 (11.6%) | 187 (6.6%) |
| 40 to 44 Years | 114 (3.3%) | 150 (5.3%) |
| 45 to 49 Years | 291 (8.4%) | 159 (5.6%) |
| 50 to 54 Years | 194 (5.6%) | 145 (5.1%) |
| 55 to 59 Years | 237 (6.9%) | 147 (5.2%) |
| 60 to 64 Years | 307 (8.9%) | 349 (12.3%) |
| 65 to 69 Years | 308 (8.9%) | 179 (6.3%) |
| 70 to 74 Years | 106 (3.1%) | 192 (6.8%) |
| 75 to 79 Years | 87 (2.5%) | 97 (3.4%) |
| 80 to 84 Years | 58 (1.7%) | 187 (6.6%) |
| 85 Years and over | 72 (2.1%) | 93 (3.3%) |
| Total | 3,448 (100.0%) | 2,840 (100.0%) |
Families and Households in Pawnee County
Median Family Size in Pawnee County
The median family size in Pawnee County is 3.36 persons per family, with single male/father families (46 | 4.1%) accounting for the largest median family size of 5.41 persons per family. On the other hand, single female/mother families (80 | 7.2%) represent the smallest median family size with 2.81 persons per family.
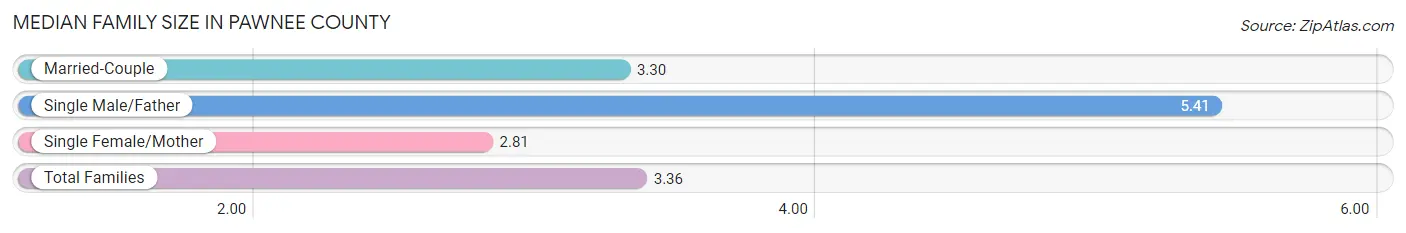
| Family Type | # Families | Family Size |
| Married-Couple | 988 (88.7%) | 3.30 |
| Single Male/Father | 46 (4.1%) | 5.41 |
| Single Female/Mother | 80 (7.2%) | 2.81 |
| Total Families | 1,114 (100.0%) | 3.36 |
Median Household Size in Pawnee County
The median household size in Pawnee County is 2.23 persons per household, with single male/father households (46 | 1.9%) accounting for the largest median household size of 5.54 persons per household. non-family households (1,282 | 53.5%) represent the smallest median household size with 1.16 persons per household.
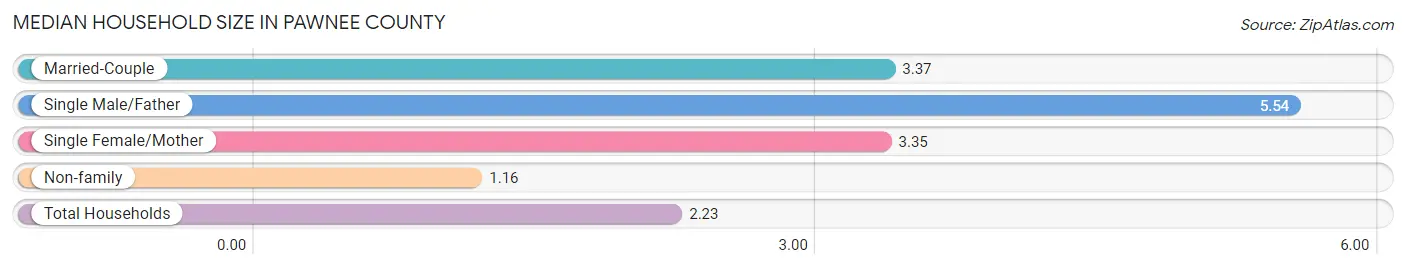
| Household Type | # Households | Household Size |
| Married-Couple | 988 (41.2%) | 3.37 |
| Single Male/Father | 46 (1.9%) | 5.54 |
| Single Female/Mother | 80 (3.3%) | 3.35 |
| Non-family | 1,282 (53.5%) | 1.16 |
| Total Households | 2,396 (100.0%) | 2.23 |
Household Size by Marriage Status in Pawnee County
Out of a total of 2,396 households in Pawnee County, 1,114 (46.5%) are family households, while 1,282 (53.5%) are nonfamily households. The most numerous type of family households are 2-person households, comprising 552, and the most common type of nonfamily households are 1-person households, comprising 1,060.
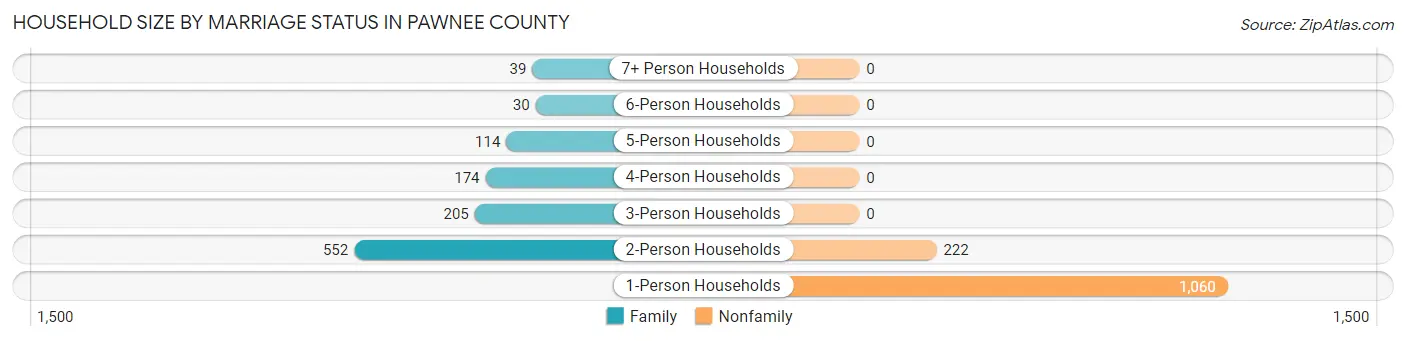
| Household Size | Family Households | Nonfamily Households |
| 1-Person Households | - | 1,060 (44.2%) |
| 2-Person Households | 552 (23.0%) | 222 (9.3%) |
| 3-Person Households | 205 (8.6%) | 0 (0.0%) |
| 4-Person Households | 174 (7.3%) | 0 (0.0%) |
| 5-Person Households | 114 (4.8%) | 0 (0.0%) |
| 6-Person Households | 30 (1.3%) | 0 (0.0%) |
| 7+ Person Households | 39 (1.6%) | 0 (0.0%) |
| Total | 1,114 (46.5%) | 1,282 (53.5%) |
Female Fertility in Pawnee County
Fertility by Age in Pawnee County
Average fertility rate in Pawnee County is 86.0 births per 1,000 women. Women in the age bracket of 20 to 34 years have the highest fertility rate with 109.0 births per 1,000 women. Women in the age bracket of 20 to 34 years acount for 55.1% of all women with births.
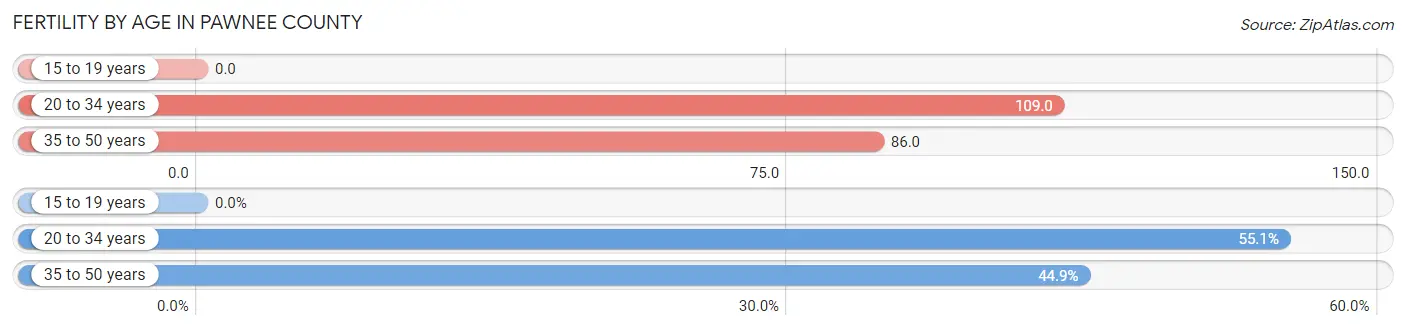
| Age Bracket | Women with Births | Births / 1,000 Women |
| 15 to 19 years | 0 (0.0%) | 0.0 |
| 20 to 34 years | 54 (55.1%) | 109.0 |
| 35 to 50 years | 44 (44.9%) | 86.0 |
| Total | 98 (100.0%) | 86.0 |
Fertility by Age by Marriage Status in Pawnee County
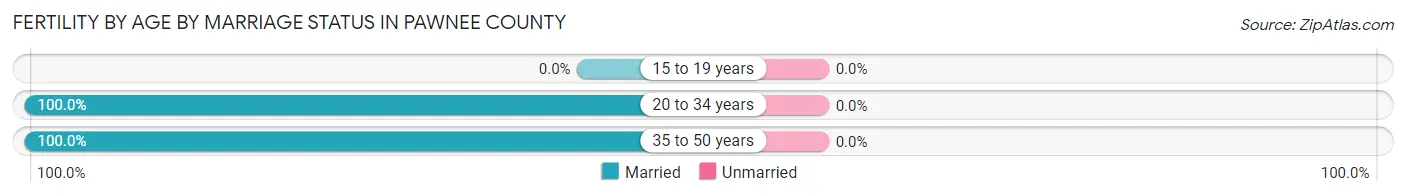
| Age Bracket | Married | Unmarried |
| 15 to 19 years | 0 (0.0%) | 0 (0.0%) |
| 20 to 34 years | 54 (100.0%) | 0 (0.0%) |
| 35 to 50 years | 44 (100.0%) | 0 (0.0%) |
| Total | 98 (100.0%) | 0 (0.0%) |
Fertility by Education in Pawnee County
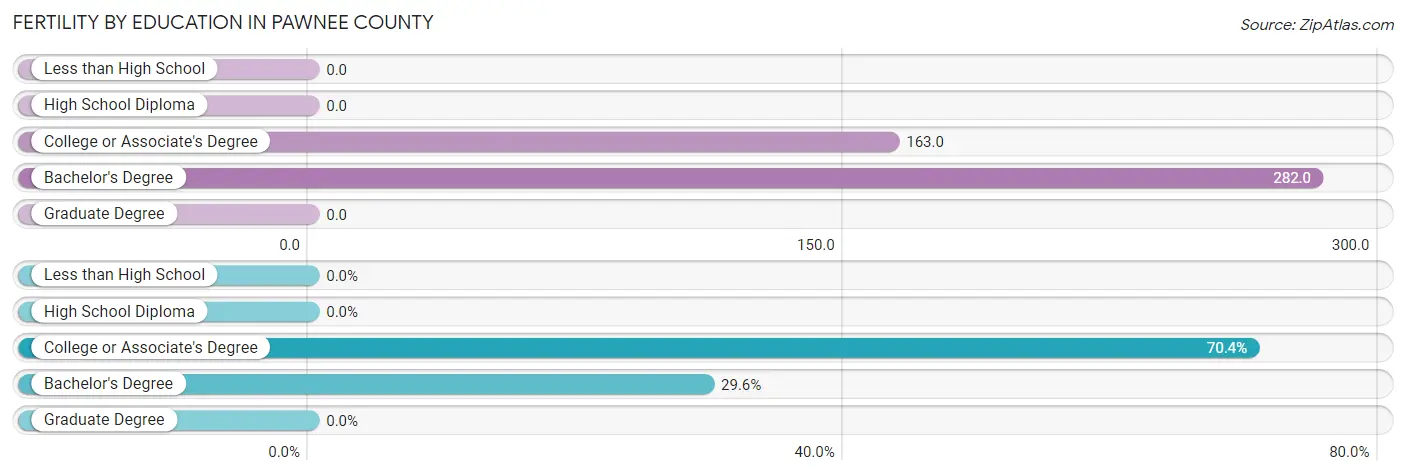
| Educational Attainment | Women with Births | Births / 1,000 Women |
| Less than High School | 0 (0.0%) | 0.0 |
| High School Diploma | 0 (0.0%) | 0.0 |
| College or Associate's Degree | 69 (70.4%) | 163.0 |
| Bachelor's Degree | 29 (29.6%) | 282.0 |
| Graduate Degree | 0 (0.0%) | 0.0 |
| Total | 98 (100.0%) | 86.0 |
Fertility by Education by Marriage Status in Pawnee County
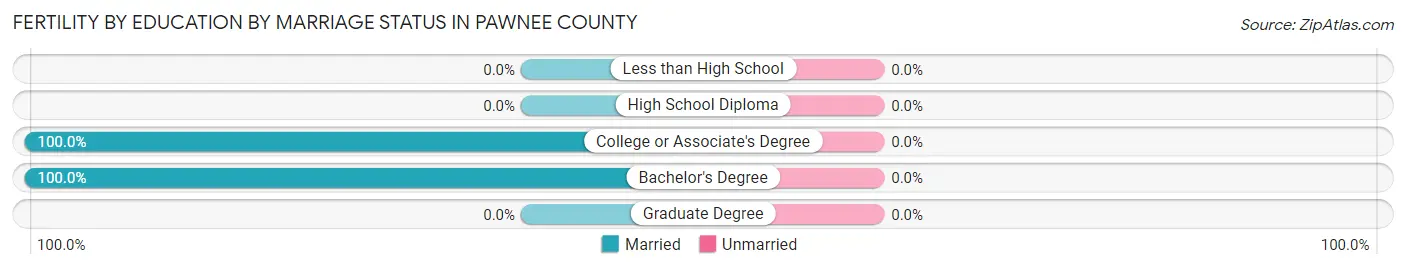
| Educational Attainment | Married | Unmarried |
| Less than High School | 0 (0.0%) | 0 (0.0%) |
| High School Diploma | 0 (0.0%) | 0 (0.0%) |
| College or Associate's Degree | 69 (100.0%) | 0 (0.0%) |
| Bachelor's Degree | 29 (100.0%) | 0 (0.0%) |
| Graduate Degree | 0 (0.0%) | 0 (0.0%) |
| Total | 98 (100.0%) | 0 (0.0%) |
Employment Characteristics in Pawnee County
Employment by Class of Employer in Pawnee County
Among the 2,774 employed individuals in Pawnee County, private company employees (1,318 | 47.5%), state government employees (495 | 17.8%), and self-employed (not incorporated) (438 | 15.8%) make up the most common classes of employment.
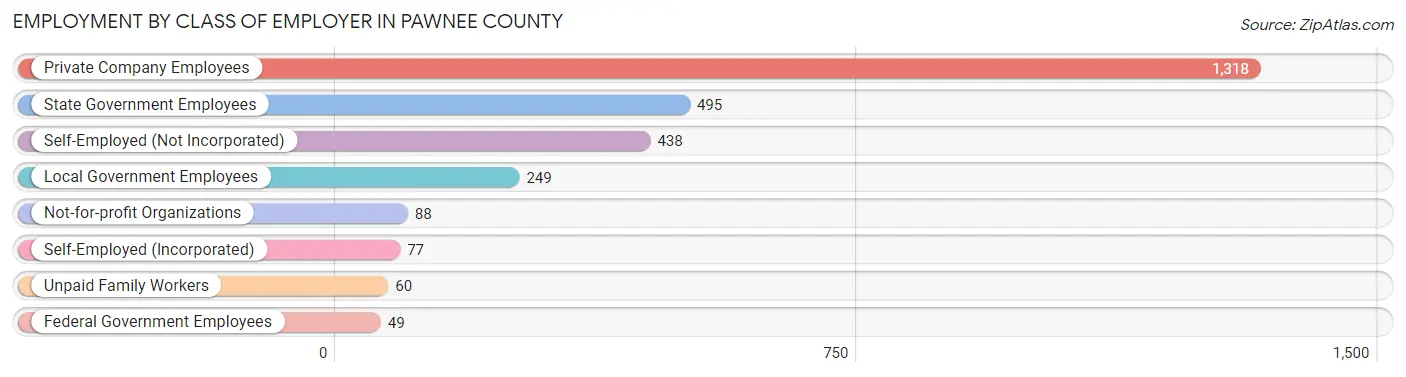
| Employer Class | # Employees | % Employees |
| Private Company Employees | 1,318 | 47.5% |
| Self-Employed (Incorporated) | 77 | 2.8% |
| Self-Employed (Not Incorporated) | 438 | 15.8% |
| Not-for-profit Organizations | 88 | 3.2% |
| Local Government Employees | 249 | 9.0% |
| State Government Employees | 495 | 17.8% |
| Federal Government Employees | 49 | 1.8% |
| Unpaid Family Workers | 60 | 2.2% |
| Total | 2,774 | 100.0% |
Employment Status by Age in Pawnee County
According to the labor force statistics for Pawnee County, out of the total population over 16 years of age (5,500), 51.6% or 2,838 individuals are in the labor force, with 1.6% or 45 of them unemployed. The age group with the highest labor force participation rate is 55 to 59 years, with 68.8% or 264 individuals in the labor force. Within the labor force, the 25 to 29 years age range has the highest percentage of unemployed individuals, with 7.7% or 22 of them being unemployed.
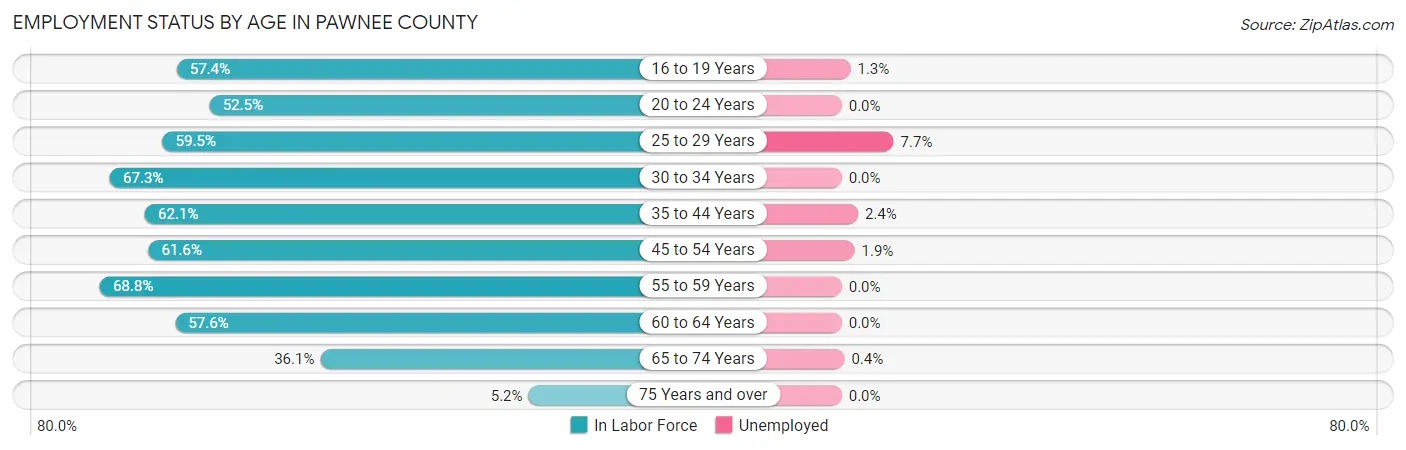
| Age Bracket | In Labor Force | Unemployed |
| 16 to 19 Years | 151 (57.4%) | 2 (1.3%) |
| 20 to 24 Years | 137 (52.5%) | 0 (0.0%) |
| 25 to 29 Years | 286 (59.5%) | 22 (7.7%) |
| 30 to 34 Years | 294 (67.3%) | 0 (0.0%) |
| 35 to 44 Years | 528 (62.1%) | 13 (2.4%) |
| 45 to 54 Years | 486 (61.6%) | 9 (1.9%) |
| 55 to 59 Years | 264 (68.8%) | 0 (0.0%) |
| 60 to 64 Years | 378 (57.6%) | 0 (0.0%) |
| 65 to 74 Years | 283 (36.1%) | 1 (0.4%) |
| 75 Years and over | 31 (5.2%) | 0 (0.0%) |
| Total | 2,838 (51.6%) | 45 (1.6%) |
Employment Status by Educational Attainment in Pawnee County
According to labor force statistics for Pawnee County, 62.2% of individuals (2,237) out of the total population between 25 and 64 years of age (3,597) are in the labor force, with 1.9% or 43 of them being unemployed. The group with the highest labor force participation rate are those with the educational attainment of bachelor's degree or higher, with 83.3% or 507 individuals in the labor force. Within the labor force, individuals with high school diploma education have the highest percentage of unemployment, with 3.5% or 22 of them being unemployed.
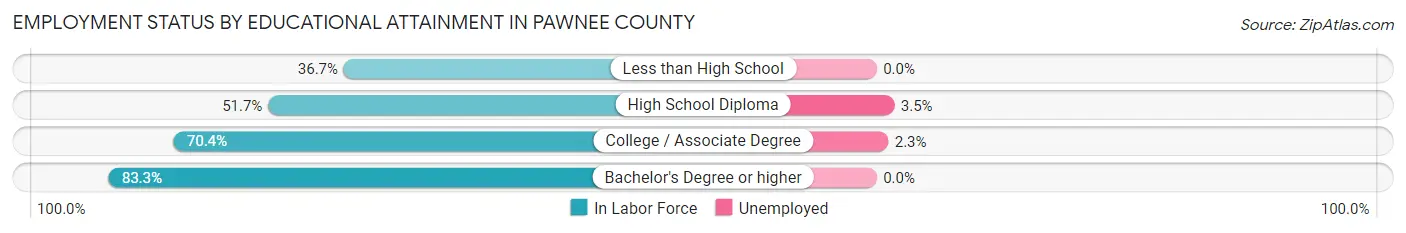
| Educational Attainment | In Labor Force | Unemployed |
| Less than High School | 162 (36.7%) | 0 (0.0%) |
| High School Diploma | 625 (51.7%) | 42 (3.5%) |
| College / Associate Degree | 943 (70.4%) | 31 (2.3%) |
| Bachelor's Degree or higher | 507 (83.3%) | 0 (0.0%) |
| Total | 2,237 (62.2%) | 68 (1.9%) |
Employment Occupations by Sex in Pawnee County
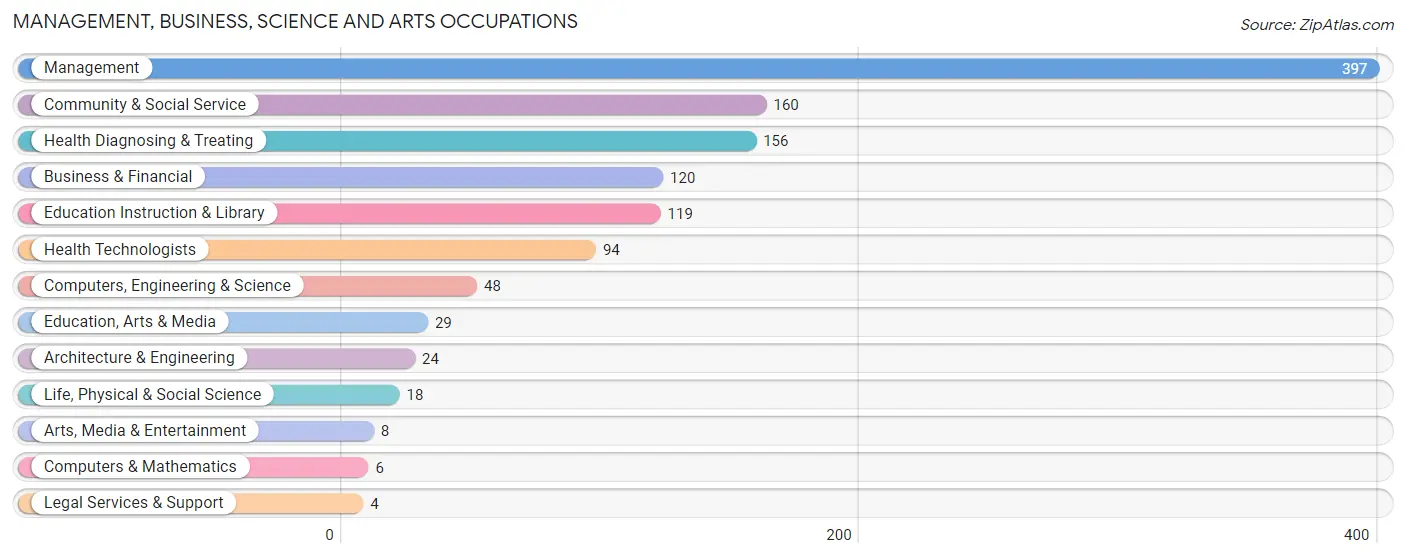
Management, Business, Science and Arts Occupations
The most common Management, Business, Science and Arts occupations in Pawnee County are Management (397 | 14.3%), Community & Social Service (160 | 5.8%), Health Diagnosing & Treating (156 | 5.6%), Business & Financial (120 | 4.3%), and Education Instruction & Library (119 | 4.3%).
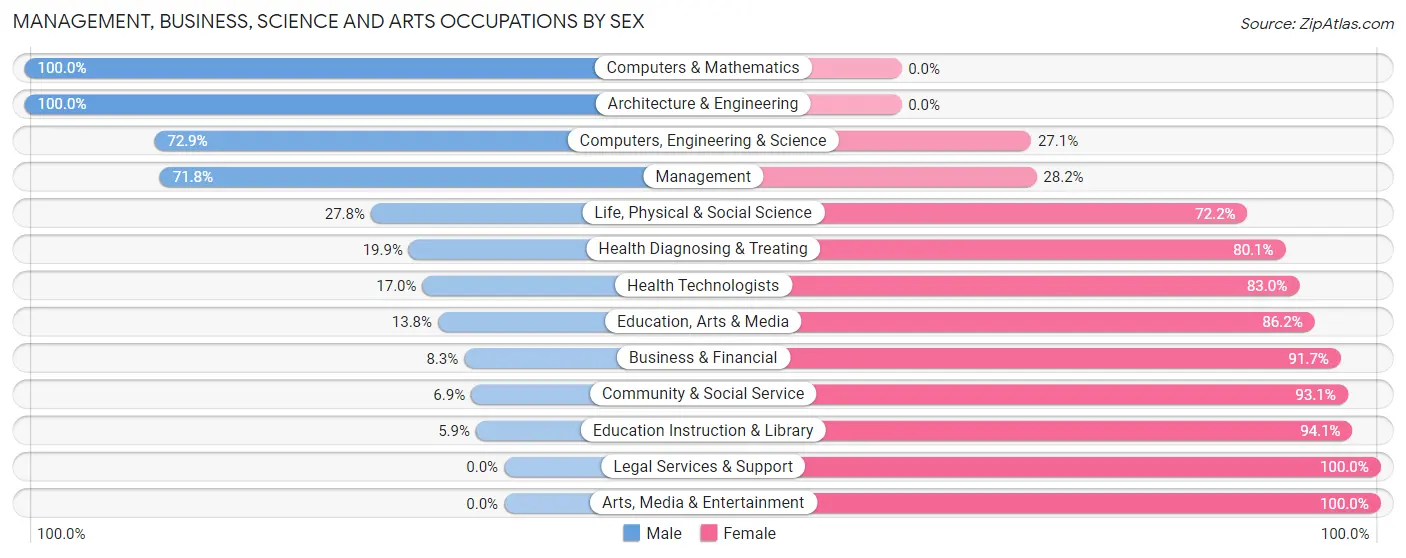
Management, Business, Science and Arts Occupations by Sex
Within the Management, Business, Science and Arts occupations in Pawnee County, the most male-oriented occupations are Computers & Mathematics (100.0%), Architecture & Engineering (100.0%), and Computers, Engineering & Science (72.9%), while the most female-oriented occupations are Legal Services & Support (100.0%), Arts, Media & Entertainment (100.0%), and Education Instruction & Library (94.1%).
| Occupation | Male | Female |
| Management | 285 (71.8%) | 112 (28.2%) |
| Business & Financial | 10 (8.3%) | 110 (91.7%) |
| Computers, Engineering & Science | 35 (72.9%) | 13 (27.1%) |
| Computers & Mathematics | 6 (100.0%) | 0 (0.0%) |
| Architecture & Engineering | 24 (100.0%) | 0 (0.0%) |
| Life, Physical & Social Science | 5 (27.8%) | 13 (72.2%) |
| Community & Social Service | 11 (6.9%) | 149 (93.1%) |
| Education, Arts & Media | 4 (13.8%) | 25 (86.2%) |
| Legal Services & Support | 0 (0.0%) | 4 (100.0%) |
| Education Instruction & Library | 7 (5.9%) | 112 (94.1%) |
| Arts, Media & Entertainment | 0 (0.0%) | 8 (100.0%) |
| Health Diagnosing & Treating | 31 (19.9%) | 125 (80.1%) |
| Health Technologists | 16 (17.0%) | 78 (83.0%) |
| Total (Category) | 372 (42.2%) | 509 (57.8%) |
| Total (Overall) | 1,534 (55.5%) | 1,232 (44.5%) |
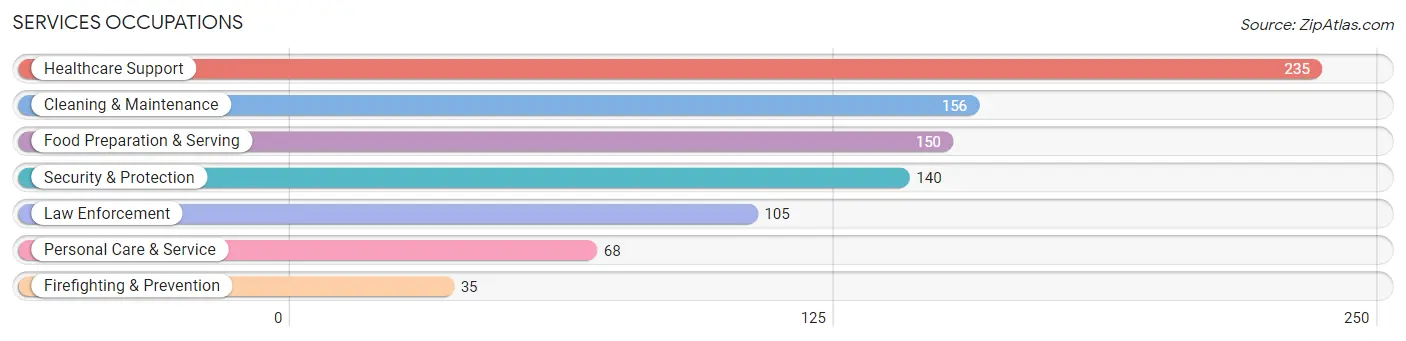
Services Occupations
The most common Services occupations in Pawnee County are Healthcare Support (235 | 8.5%), Cleaning & Maintenance (156 | 5.6%), Food Preparation & Serving (150 | 5.4%), Security & Protection (140 | 5.1%), and Law Enforcement (105 | 3.8%).
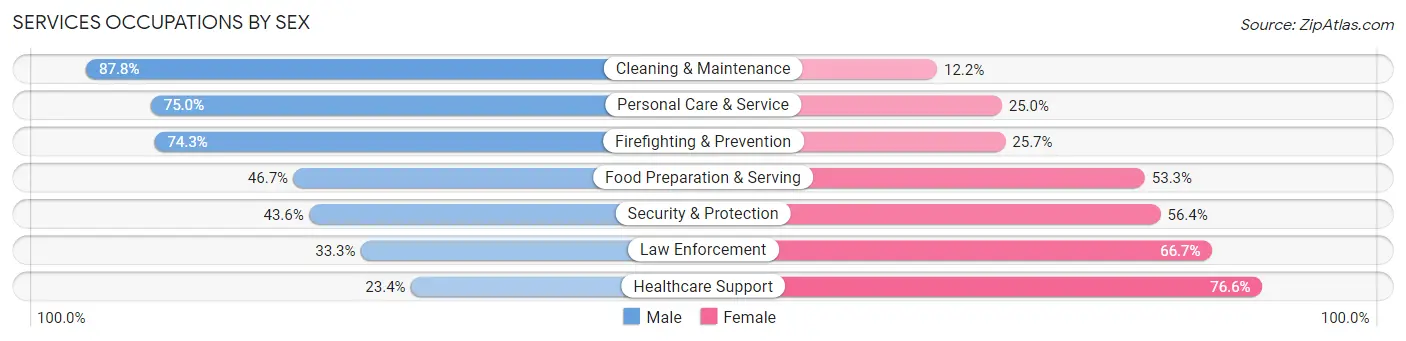
Services Occupations by Sex
Within the Services occupations in Pawnee County, the most male-oriented occupations are Cleaning & Maintenance (87.8%), Personal Care & Service (75.0%), and Firefighting & Prevention (74.3%), while the most female-oriented occupations are Healthcare Support (76.6%), Law Enforcement (66.7%), and Security & Protection (56.4%).
| Occupation | Male | Female |
| Healthcare Support | 55 (23.4%) | 180 (76.6%) |
| Security & Protection | 61 (43.6%) | 79 (56.4%) |
| Firefighting & Prevention | 26 (74.3%) | 9 (25.7%) |
| Law Enforcement | 35 (33.3%) | 70 (66.7%) |
| Food Preparation & Serving | 70 (46.7%) | 80 (53.3%) |
| Cleaning & Maintenance | 137 (87.8%) | 19 (12.2%) |
| Personal Care & Service | 51 (75.0%) | 17 (25.0%) |
| Total (Category) | 374 (49.9%) | 375 (50.1%) |
| Total (Overall) | 1,534 (55.5%) | 1,232 (44.5%) |
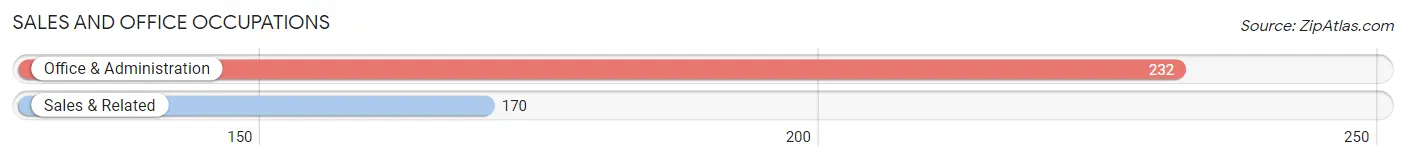
Sales and Office Occupations
The most common Sales and Office occupations in Pawnee County are Office & Administration (232 | 8.4%), and Sales & Related (170 | 6.1%).
Sales and Office Occupations by Sex
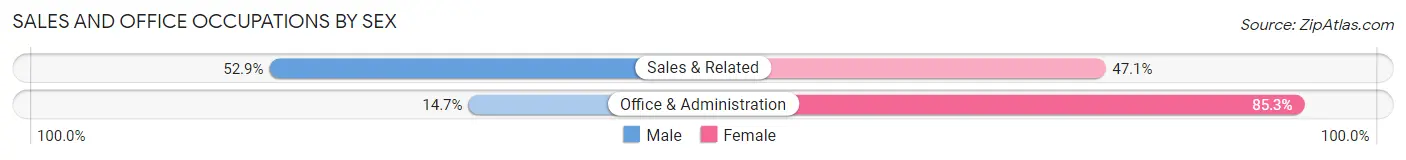
| Occupation | Male | Female |
| Sales & Related | 90 (52.9%) | 80 (47.1%) |
| Office & Administration | 34 (14.7%) | 198 (85.3%) |
| Total (Category) | 124 (30.8%) | 278 (69.2%) |
| Total (Overall) | 1,534 (55.5%) | 1,232 (44.5%) |
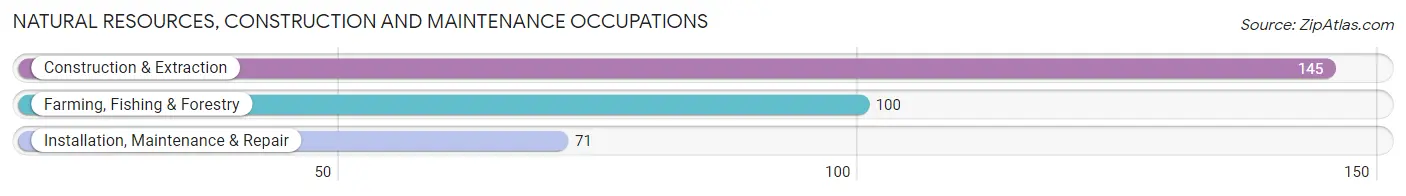
Natural Resources, Construction and Maintenance Occupations
The most common Natural Resources, Construction and Maintenance occupations in Pawnee County are Construction & Extraction (145 | 5.2%), Farming, Fishing & Forestry (100 | 3.6%), and Installation, Maintenance & Repair (71 | 2.6%).
Natural Resources, Construction and Maintenance Occupations by Sex
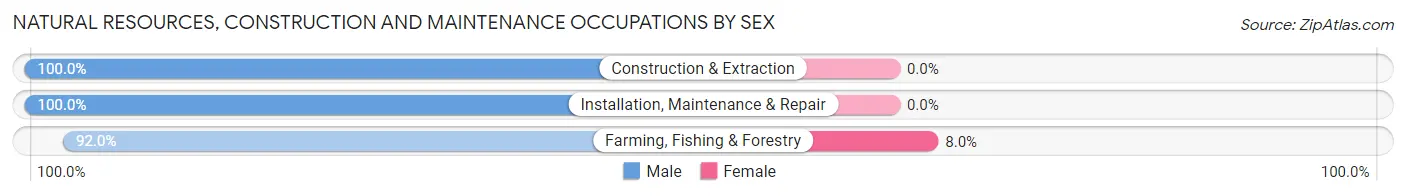
| Occupation | Male | Female |
| Farming, Fishing & Forestry | 92 (92.0%) | 8 (8.0%) |
| Construction & Extraction | 145 (100.0%) | 0 (0.0%) |
| Installation, Maintenance & Repair | 71 (100.0%) | 0 (0.0%) |
| Total (Category) | 308 (97.5%) | 8 (2.5%) |
| Total (Overall) | 1,534 (55.5%) | 1,232 (44.5%) |
Production, Transportation and Moving Occupations
The most common Production, Transportation and Moving occupations in Pawnee County are Transportation (185 | 6.7%), Material Moving (128 | 4.6%), and Production (105 | 3.8%).
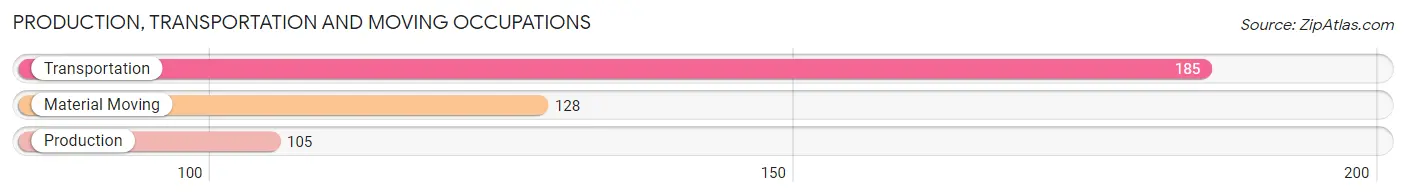
Production, Transportation and Moving Occupations by Sex
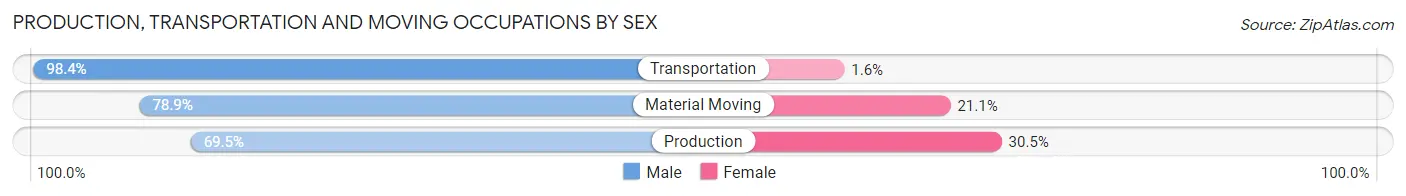
| Occupation | Male | Female |
| Production | 73 (69.5%) | 32 (30.5%) |
| Transportation | 182 (98.4%) | 3 (1.6%) |
| Material Moving | 101 (78.9%) | 27 (21.1%) |
| Total (Category) | 356 (85.2%) | 62 (14.8%) |
| Total (Overall) | 1,534 (55.5%) | 1,232 (44.5%) |
Employment Industries by Sex in Pawnee County
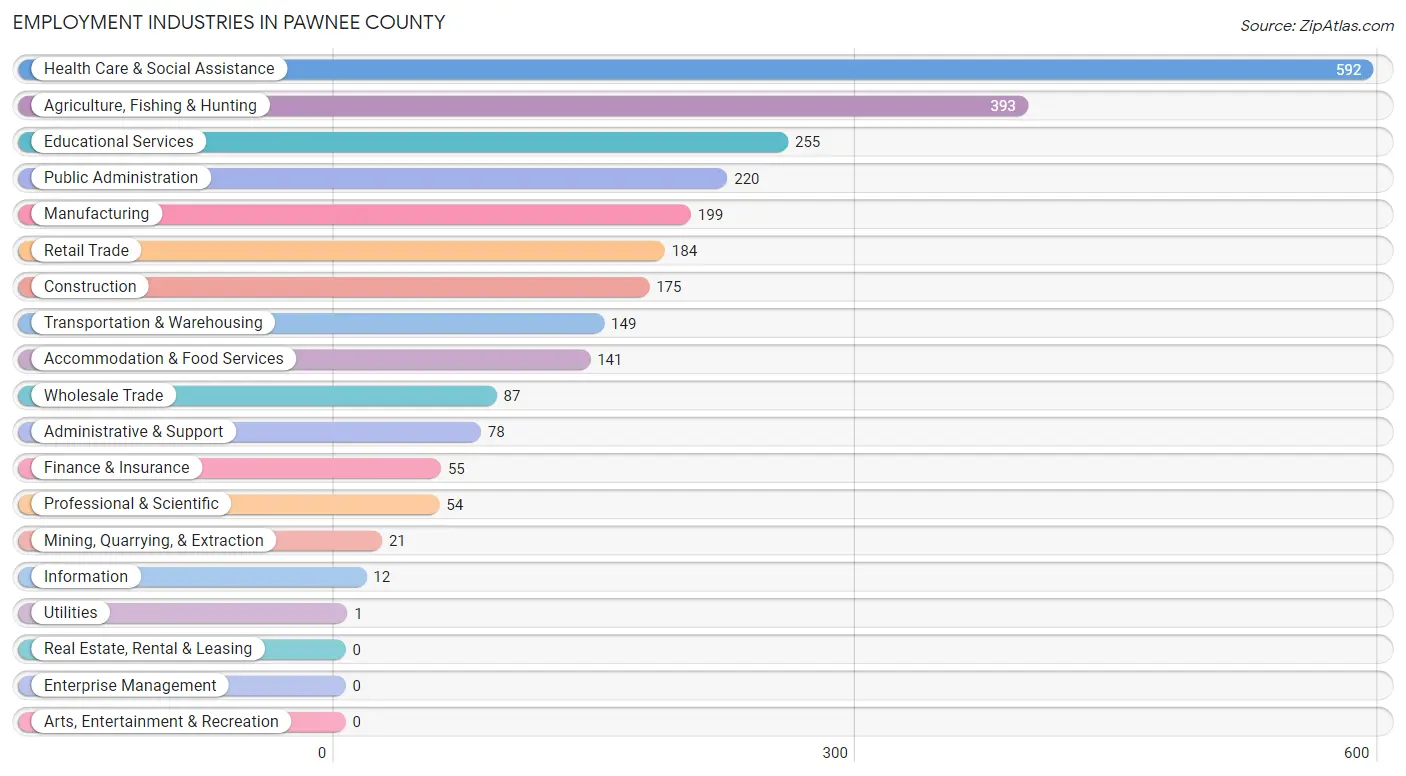
Employment Industries in Pawnee County
The major employment industries in Pawnee County include Health Care & Social Assistance (592 | 21.4%), Agriculture, Fishing & Hunting (393 | 14.2%), Educational Services (255 | 9.2%), Public Administration (220 | 8.0%), and Manufacturing (199 | 7.2%).
Employment Industries by Sex in Pawnee County
The Pawnee County industries that see more men than women are Mining, Quarrying, & Extraction (100.0%), Utilities (100.0%), and Administrative & Support (98.7%), whereas the industries that tend to have a higher number of women are Finance & Insurance (96.4%), Public Administration (80.9%), and Educational Services (80.8%).
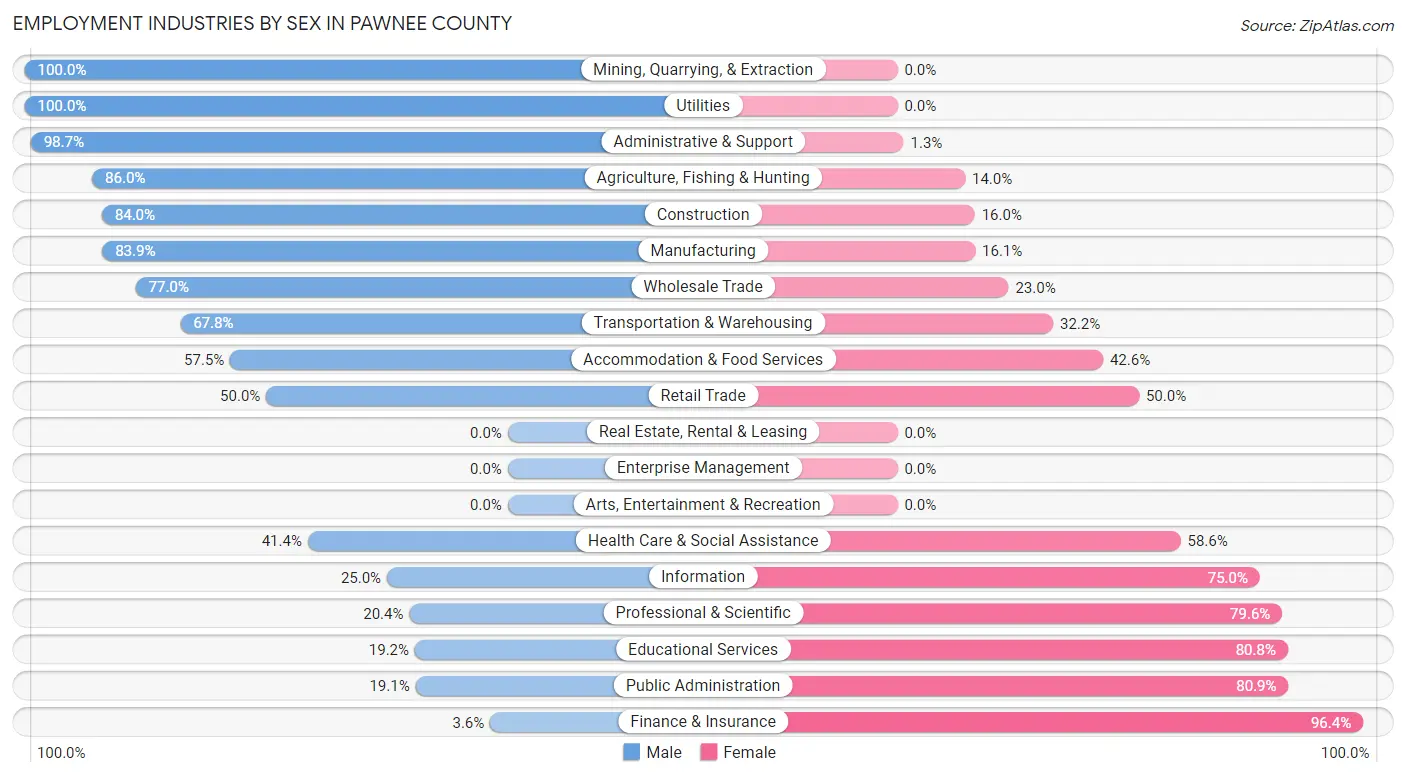
| Industry | Male | Female |
| Agriculture, Fishing & Hunting | 338 (86.0%) | 55 (14.0%) |
| Mining, Quarrying, & Extraction | 21 (100.0%) | 0 (0.0%) |
| Construction | 147 (84.0%) | 28 (16.0%) |
| Manufacturing | 167 (83.9%) | 32 (16.1%) |
| Wholesale Trade | 67 (77.0%) | 20 (23.0%) |
| Retail Trade | 92 (50.0%) | 92 (50.0%) |
| Transportation & Warehousing | 101 (67.8%) | 48 (32.2%) |
| Utilities | 1 (100.0%) | 0 (0.0%) |
| Information | 3 (25.0%) | 9 (75.0%) |
| Finance & Insurance | 2 (3.6%) | 53 (96.4%) |
| Real Estate, Rental & Leasing | 0 (0.0%) | 0 (0.0%) |
| Professional & Scientific | 11 (20.4%) | 43 (79.6%) |
| Enterprise Management | 0 (0.0%) | 0 (0.0%) |
| Administrative & Support | 77 (98.7%) | 1 (1.3%) |
| Educational Services | 49 (19.2%) | 206 (80.8%) |
| Health Care & Social Assistance | 245 (41.4%) | 347 (58.6%) |
| Arts, Entertainment & Recreation | 0 (0.0%) | 0 (0.0%) |
| Accommodation & Food Services | 81 (57.5%) | 60 (42.5%) |
| Public Administration | 42 (19.1%) | 178 (80.9%) |
| Total | 1,534 (55.5%) | 1,232 (44.5%) |
Education in Pawnee County
School Enrollment in Pawnee County
The most common levels of schooling among the 973 students in Pawnee County are high school (288 | 29.6%), middle school (213 | 21.9%), and college / undergraduate (193 | 19.8%).
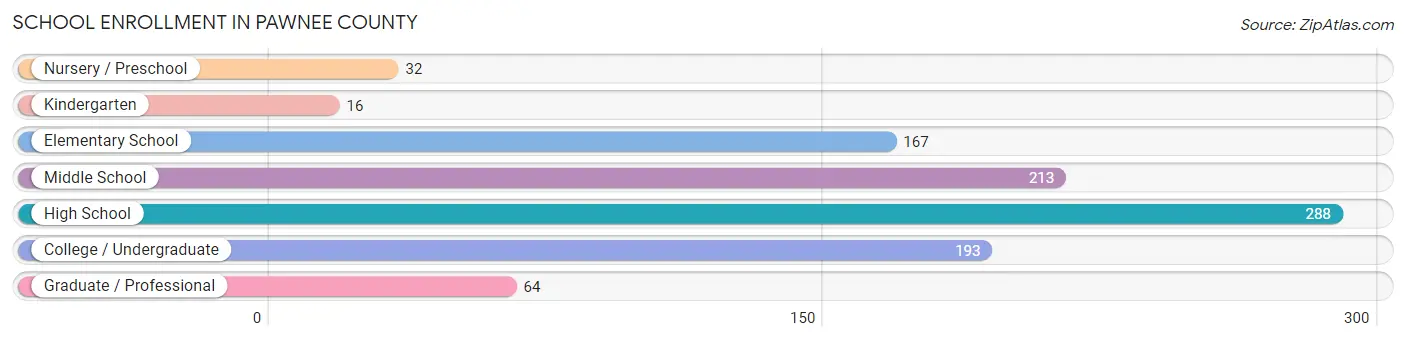
| School Level | # Students | % Students |
| Nursery / Preschool | 32 | 3.3% |
| Kindergarten | 16 | 1.6% |
| Elementary School | 167 | 17.2% |
| Middle School | 213 | 21.9% |
| High School | 288 | 29.6% |
| College / Undergraduate | 193 | 19.8% |
| Graduate / Professional | 64 | 6.6% |
| Total | 973 | 100.0% |
School Enrollment by Age by Funding Source in Pawnee County
Out of a total of 973 students who are enrolled in schools in Pawnee County, 118 (12.1%) attend a private institution, while the remaining 855 (87.9%) are enrolled in public schools. The age group of 10 to 14 year olds has the highest likelihood of being enrolled in private schools, with 65 (27.8% in the age bracket) enrolled. Conversely, the age group of 18 to 19 year olds has the lowest likelihood of being enrolled in a private school, with 106 (100.0% in the age bracket) attending a public institution.
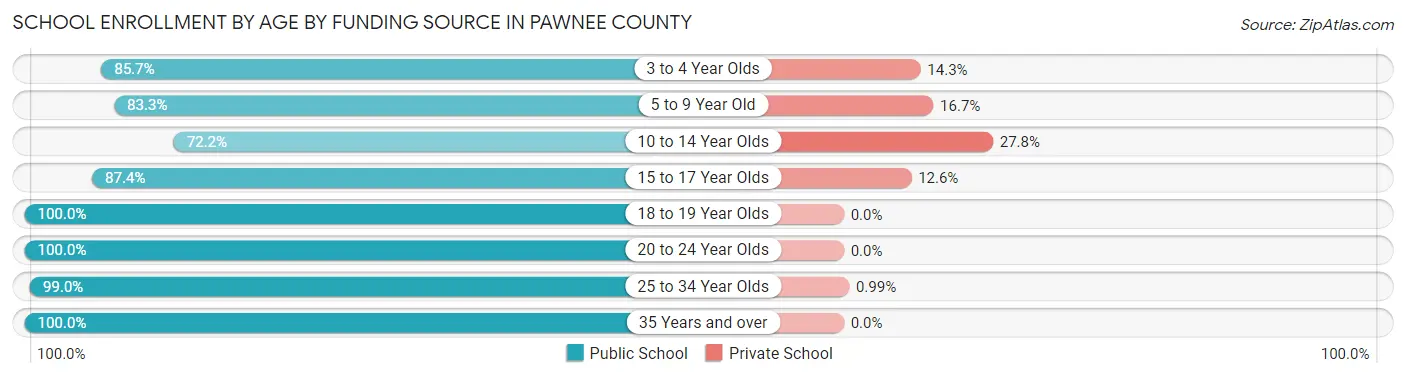
| Age Bracket | Public School | Private School |
| 3 to 4 Year Olds | 18 (85.7%) | 3 (14.3%) |
| 5 to 9 Year Old | 150 (83.3%) | 30 (16.7%) |
| 10 to 14 Year Olds | 169 (72.2%) | 65 (27.8%) |
| 15 to 17 Year Olds | 132 (87.4%) | 19 (12.6%) |
| 18 to 19 Year Olds | 106 (100.0%) | 0 (0.0%) |
| 20 to 24 Year Olds | 89 (100.0%) | 0 (0.0%) |
| 25 to 34 Year Olds | 100 (99.0%) | 1 (1.0%) |
| 35 Years and over | 91 (100.0%) | 0 (0.0%) |
| Total | 855 (87.9%) | 118 (12.1%) |
Educational Attainment by Field of Study in Pawnee County
Education (235 | 24.1%), bio, nature & agricultural (191 | 19.6%), business (159 | 16.3%), science & technology (86 | 8.8%), and literature & languages (73 | 7.5%) are the most common fields of study among 974 individuals in Pawnee County who have obtained a bachelor's degree or higher.
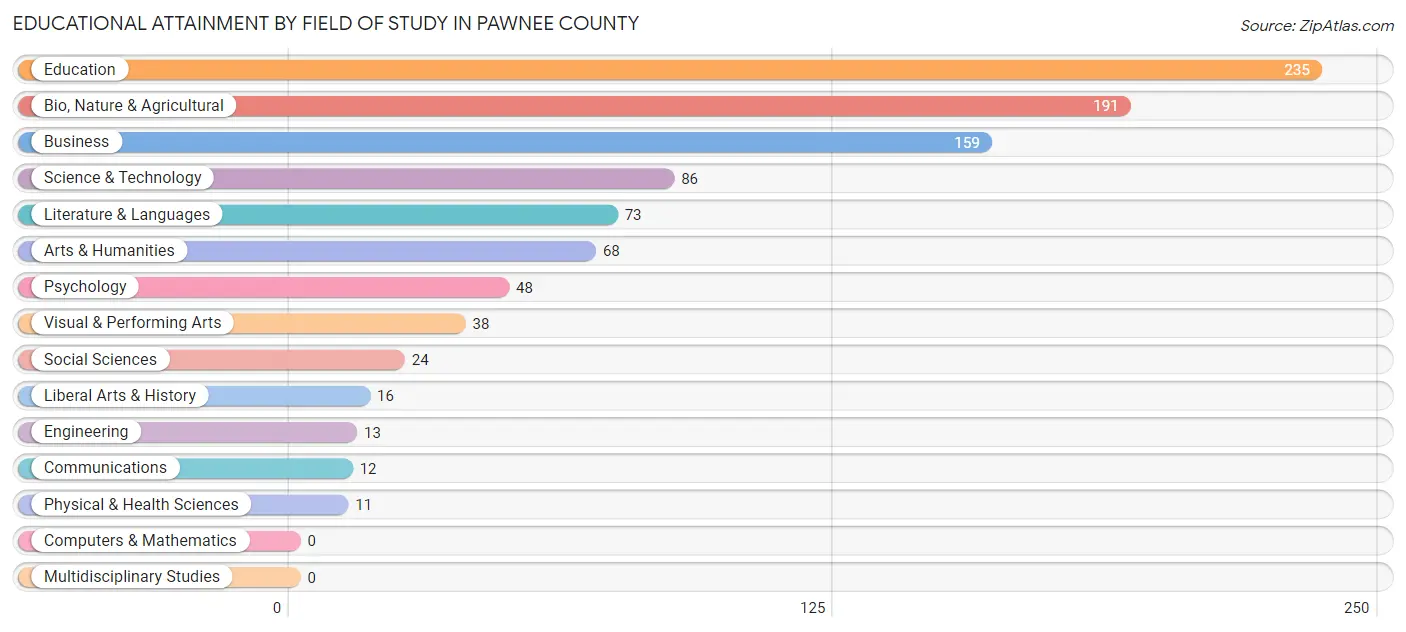
| Field of Study | # Graduates | % Graduates |
| Computers & Mathematics | 0 | 0.0% |
| Bio, Nature & Agricultural | 191 | 19.6% |
| Physical & Health Sciences | 11 | 1.1% |
| Psychology | 48 | 4.9% |
| Social Sciences | 24 | 2.5% |
| Engineering | 13 | 1.3% |
| Multidisciplinary Studies | 0 | 0.0% |
| Science & Technology | 86 | 8.8% |
| Business | 159 | 16.3% |
| Education | 235 | 24.1% |
| Literature & Languages | 73 | 7.5% |
| Liberal Arts & History | 16 | 1.6% |
| Visual & Performing Arts | 38 | 3.9% |
| Communications | 12 | 1.2% |
| Arts & Humanities | 68 | 7.0% |
| Total | 974 | 100.0% |
Transportation & Commute in Pawnee County
Vehicle Availability by Sex in Pawnee County
The most prevalent vehicle ownership categories in Pawnee County are males with 2 vehicles (499, accounting for 32.2%) and females with 2 vehicles (362, making up 40.8%).
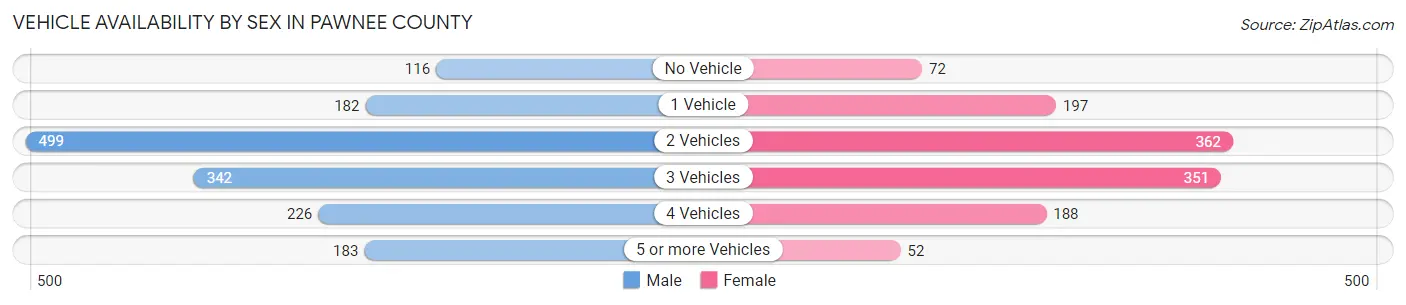
| Vehicles Available | Male | Female |
| No Vehicle | 116 (7.5%) | 72 (5.9%) |
| 1 Vehicle | 182 (11.8%) | 197 (16.1%) |
| 2 Vehicles | 499 (32.2%) | 362 (29.6%) |
| 3 Vehicles | 342 (22.1%) | 351 (28.7%) |
| 4 Vehicles | 226 (14.6%) | 188 (15.4%) |
| 5 or more Vehicles | 183 (11.8%) | 52 (4.3%) |
| Total | 1,548 (100.0%) | 1,222 (100.0%) |
Commute Time in Pawnee County
The most frequently occuring commute durations in Pawnee County are 5 to 9 minutes (716 commuters, 29.1%), less than 5 minutes (484 commuters, 19.7%), and 10 to 14 minutes (468 commuters, 19.0%).
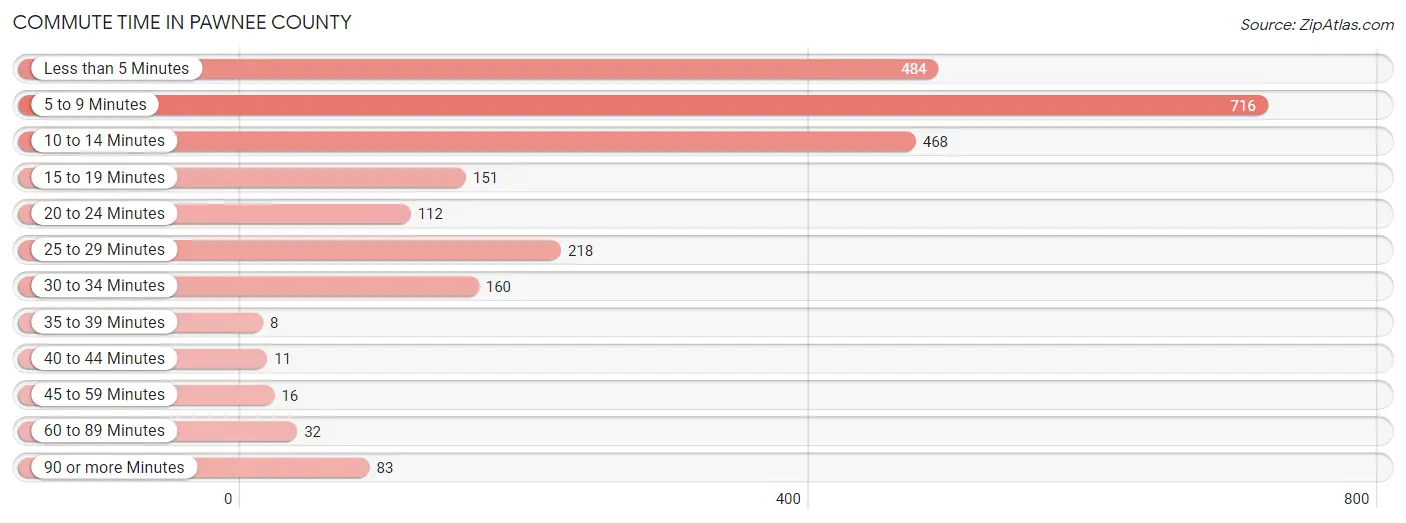
| Commute Time | # Commuters | % Commuters |
| Less than 5 Minutes | 484 | 19.7% |
| 5 to 9 Minutes | 716 | 29.1% |
| 10 to 14 Minutes | 468 | 19.0% |
| 15 to 19 Minutes | 151 | 6.1% |
| 20 to 24 Minutes | 112 | 4.5% |
| 25 to 29 Minutes | 218 | 8.9% |
| 30 to 34 Minutes | 160 | 6.5% |
| 35 to 39 Minutes | 8 | 0.3% |
| 40 to 44 Minutes | 11 | 0.4% |
| 45 to 59 Minutes | 16 | 0.6% |
| 60 to 89 Minutes | 32 | 1.3% |
| 90 or more Minutes | 83 | 3.4% |
Commute Time by Sex in Pawnee County
The most common commute times in Pawnee County are 5 to 9 minutes (403 commuters, 29.2%) for males and 5 to 9 minutes (313 commuters, 29.1%) for females.
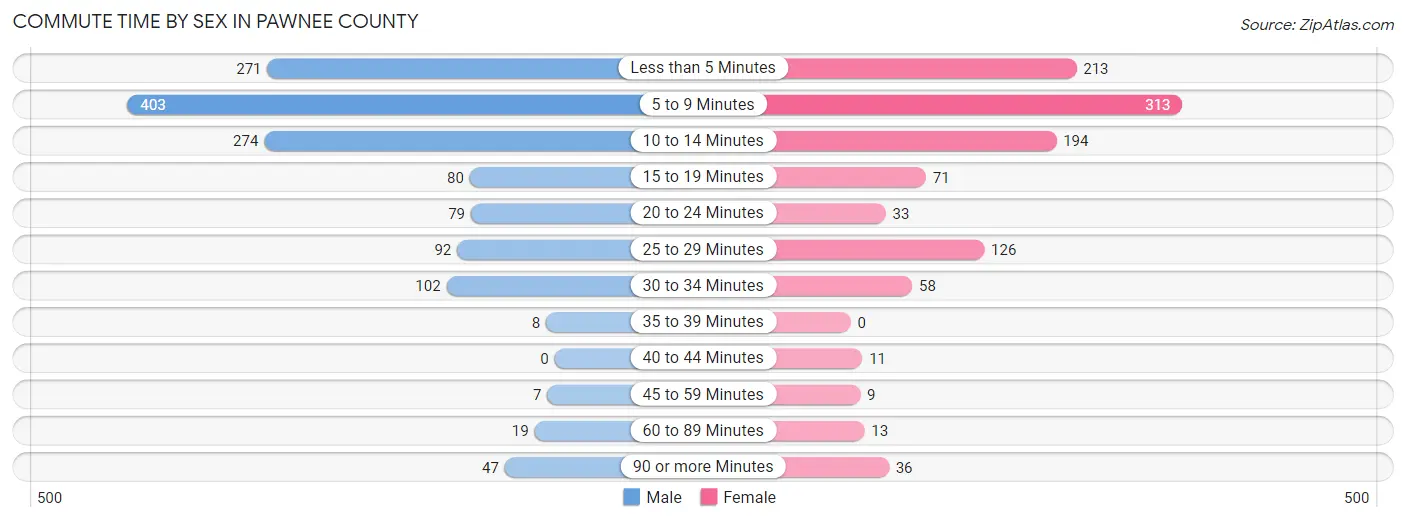
| Commute Time | Male | Female |
| Less than 5 Minutes | 271 (19.6%) | 213 (19.8%) |
| 5 to 9 Minutes | 403 (29.2%) | 313 (29.1%) |
| 10 to 14 Minutes | 274 (19.8%) | 194 (18.0%) |
| 15 to 19 Minutes | 80 (5.8%) | 71 (6.6%) |
| 20 to 24 Minutes | 79 (5.7%) | 33 (3.1%) |
| 25 to 29 Minutes | 92 (6.7%) | 126 (11.7%) |
| 30 to 34 Minutes | 102 (7.4%) | 58 (5.4%) |
| 35 to 39 Minutes | 8 (0.6%) | 0 (0.0%) |
| 40 to 44 Minutes | 0 (0.0%) | 11 (1.0%) |
| 45 to 59 Minutes | 7 (0.5%) | 9 (0.8%) |
| 60 to 89 Minutes | 19 (1.4%) | 13 (1.2%) |
| 90 or more Minutes | 47 (3.4%) | 36 (3.3%) |
Time of Departure to Work by Sex in Pawnee County
The most frequent times of departure to work in Pawnee County are 6:30 AM to 6:59 AM (283, 20.5%) for males and 7:00 AM to 7:29 AM (174, 16.2%) for females.
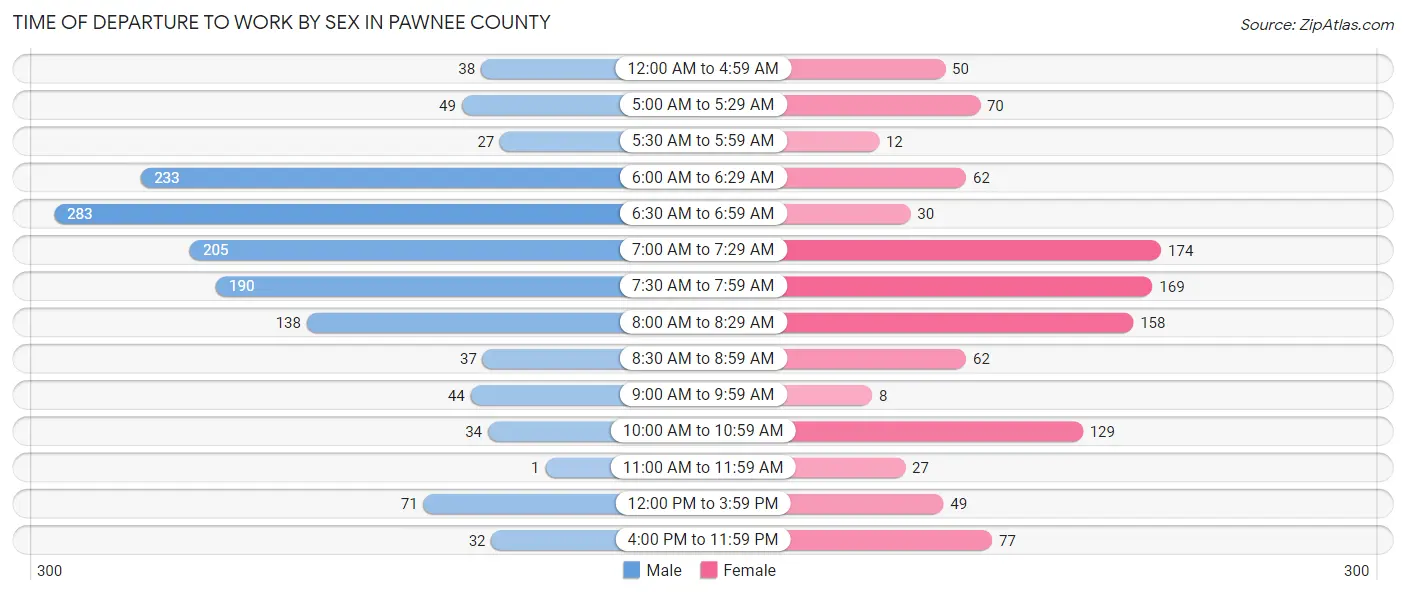
| Time of Departure | Male | Female |
| 12:00 AM to 4:59 AM | 38 (2.8%) | 50 (4.6%) |
| 5:00 AM to 5:29 AM | 49 (3.5%) | 70 (6.5%) |
| 5:30 AM to 5:59 AM | 27 (1.9%) | 12 (1.1%) |
| 6:00 AM to 6:29 AM | 233 (16.9%) | 62 (5.8%) |
| 6:30 AM to 6:59 AM | 283 (20.5%) | 30 (2.8%) |
| 7:00 AM to 7:29 AM | 205 (14.8%) | 174 (16.2%) |
| 7:30 AM to 7:59 AM | 190 (13.8%) | 169 (15.7%) |
| 8:00 AM to 8:29 AM | 138 (10.0%) | 158 (14.7%) |
| 8:30 AM to 8:59 AM | 37 (2.7%) | 62 (5.8%) |
| 9:00 AM to 9:59 AM | 44 (3.2%) | 8 (0.7%) |
| 10:00 AM to 10:59 AM | 34 (2.5%) | 129 (12.0%) |
| 11:00 AM to 11:59 AM | 1 (0.1%) | 27 (2.5%) |
| 12:00 PM to 3:59 PM | 71 (5.1%) | 49 (4.5%) |
| 4:00 PM to 11:59 PM | 32 (2.3%) | 77 (7.1%) |
| Total | 1,382 (100.0%) | 1,077 (100.0%) |
Housing Occupancy in Pawnee County
Occupancy by Ownership in Pawnee County
Of the total 2,396 dwellings in Pawnee County, owner-occupied units account for 1,478 (61.7%), while renter-occupied units make up 918 (38.3%).
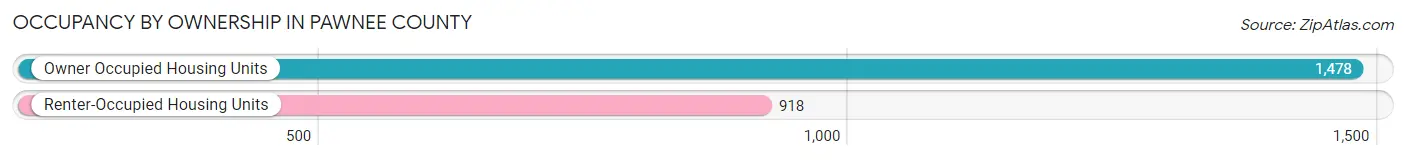
| Occupancy | # Housing Units | % Housing Units |
| Owner Occupied Housing Units | 1,478 | 61.7% |
| Renter-Occupied Housing Units | 918 | 38.3% |
| Total Occupied Housing Units | 2,396 | 100.0% |
Occupancy by Household Size in Pawnee County
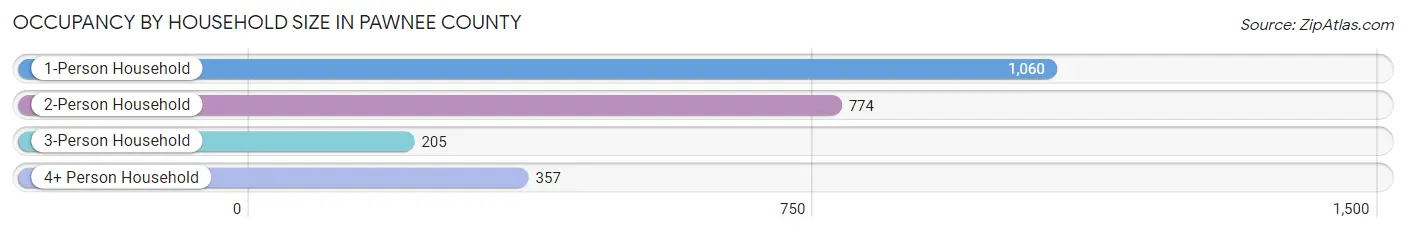
| Household Size | # Housing Units | % Housing Units |
| 1-Person Household | 1,060 | 44.2% |
| 2-Person Household | 774 | 32.3% |
| 3-Person Household | 205 | 8.6% |
| 4+ Person Household | 357 | 14.9% |
| Total Housing Units | 2,396 | 100.0% |
Occupancy by Ownership by Household Size in Pawnee County
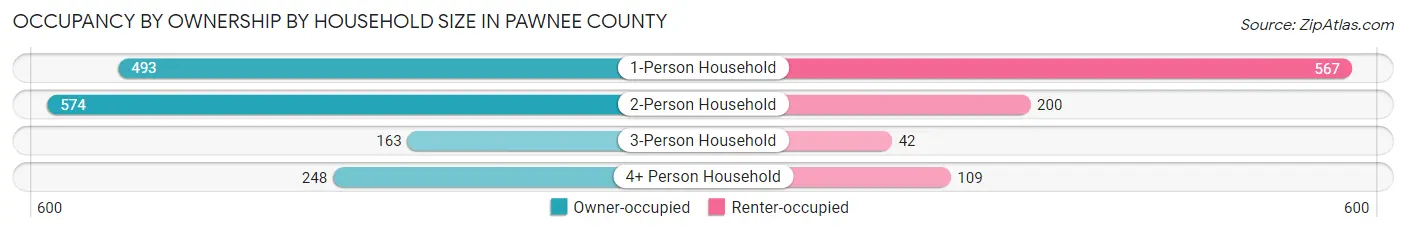
| Household Size | Owner-occupied | Renter-occupied |
| 1-Person Household | 493 (46.5%) | 567 (53.5%) |
| 2-Person Household | 574 (74.2%) | 200 (25.8%) |
| 3-Person Household | 163 (79.5%) | 42 (20.5%) |
| 4+ Person Household | 248 (69.5%) | 109 (30.5%) |
| Total Housing Units | 1,478 (61.7%) | 918 (38.3%) |
Occupancy by Educational Attainment in Pawnee County
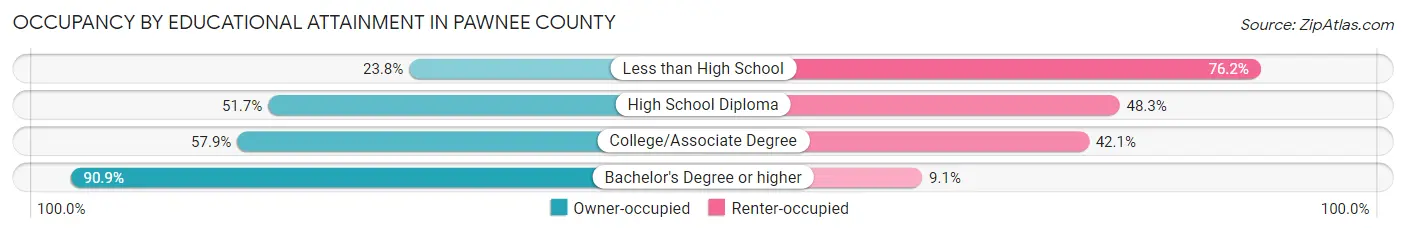
| Household Size | Owner-occupied | Renter-occupied |
| Less than High School | 29 (23.8%) | 93 (76.2%) |
| High School Diploma | 372 (51.7%) | 347 (48.3%) |
| College/Associate Degree | 589 (57.9%) | 429 (42.1%) |
| Bachelor's Degree or higher | 488 (90.9%) | 49 (9.1%) |
Occupancy by Age of Householder in Pawnee County
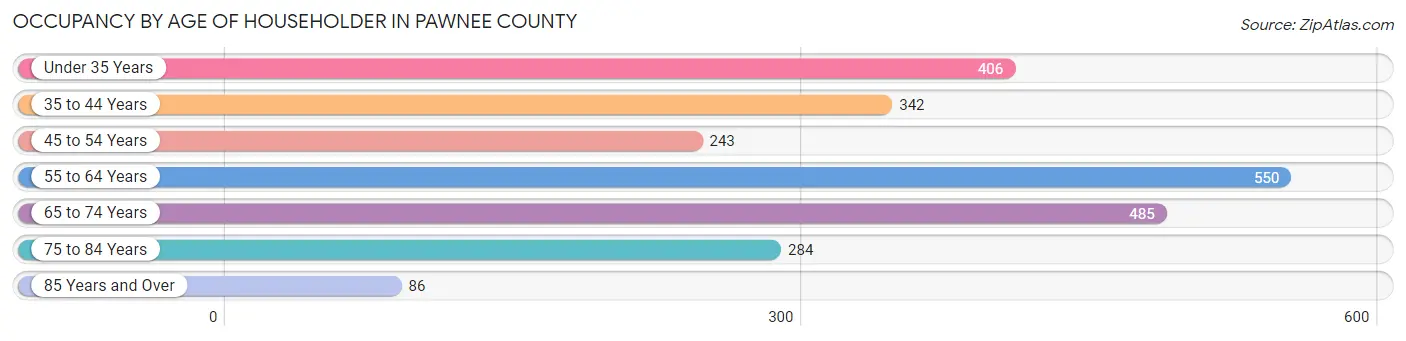
| Age Bracket | # Households | % Households |
| Under 35 Years | 406 | 16.9% |
| 35 to 44 Years | 342 | 14.3% |
| 45 to 54 Years | 243 | 10.1% |
| 55 to 64 Years | 550 | 23.0% |
| 65 to 74 Years | 485 | 20.2% |
| 75 to 84 Years | 284 | 11.8% |
| 85 Years and Over | 86 | 3.6% |
| Total | 2,396 | 100.0% |
Housing Finances in Pawnee County
Median Income by Occupancy in Pawnee County
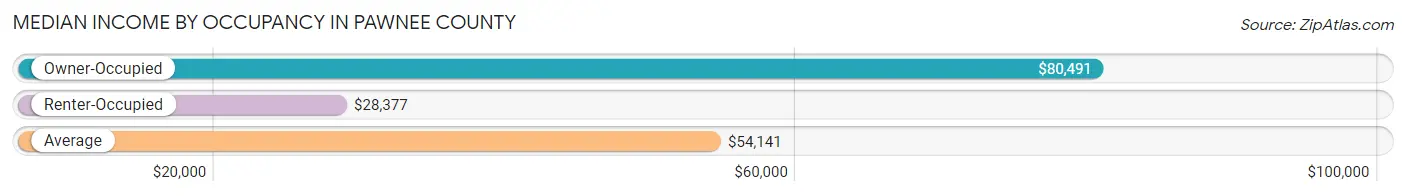
| Occupancy Type | # Households | Median Income |
| Owner-Occupied | 1,478 (61.7%) | $80,491 |
| Renter-Occupied | 918 (38.3%) | $28,377 |
| Average | 2,396 (100.0%) | $54,141 |
Occupancy by Householder Income Bracket in Pawnee County
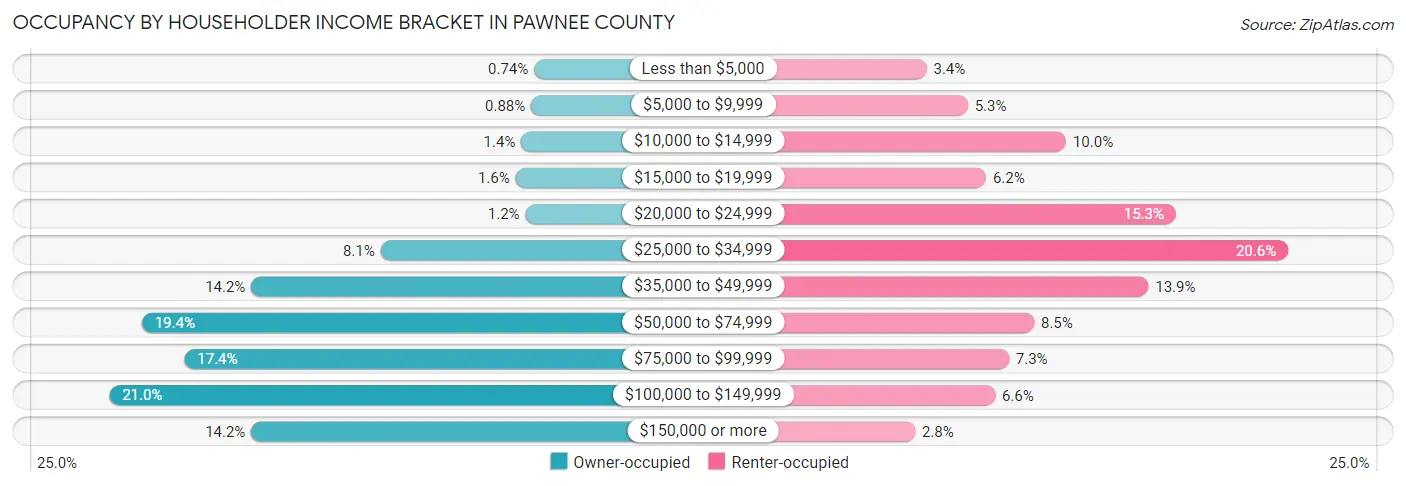
| Income Bracket | Owner-occupied | Renter-occupied |
| Less than $5,000 | 11 (0.7%) | 31 (3.4%) |
| $5,000 to $9,999 | 13 (0.9%) | 49 (5.3%) |
| $10,000 to $14,999 | 20 (1.3%) | 92 (10.0%) |
| $15,000 to $19,999 | 24 (1.6%) | 57 (6.2%) |
| $20,000 to $24,999 | 17 (1.1%) | 140 (15.2%) |
| $25,000 to $34,999 | 119 (8.1%) | 189 (20.6%) |
| $35,000 to $49,999 | 210 (14.2%) | 128 (13.9%) |
| $50,000 to $74,999 | 287 (19.4%) | 78 (8.5%) |
| $75,000 to $99,999 | 257 (17.4%) | 67 (7.3%) |
| $100,000 to $149,999 | 310 (21.0%) | 61 (6.6%) |
| $150,000 or more | 210 (14.2%) | 26 (2.8%) |
| Total | 1,478 (100.0%) | 918 (100.0%) |
Monthly Housing Cost Tiers in Pawnee County
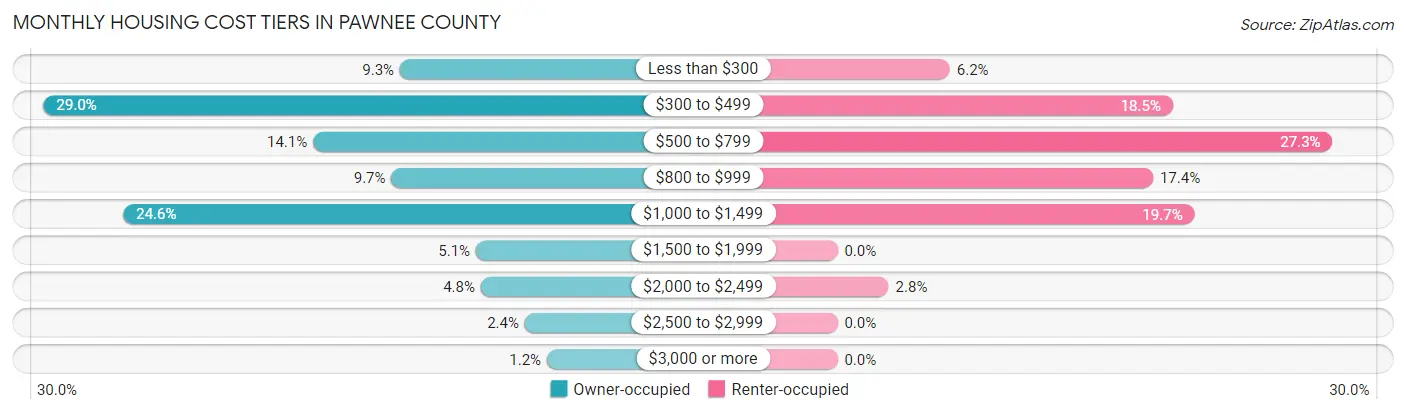
| Monthly Cost | Owner-occupied | Renter-occupied |
| Less than $300 | 137 (9.3%) | 57 (6.2%) |
| $300 to $499 | 428 (29.0%) | 170 (18.5%) |
| $500 to $799 | 208 (14.1%) | 251 (27.3%) |
| $800 to $999 | 144 (9.7%) | 160 (17.4%) |
| $1,000 to $1,499 | 363 (24.6%) | 181 (19.7%) |
| $1,500 to $1,999 | 75 (5.1%) | 0 (0.0%) |
| $2,000 to $2,499 | 71 (4.8%) | 26 (2.8%) |
| $2,500 to $2,999 | 35 (2.4%) | 0 (0.0%) |
| $3,000 or more | 17 (1.1%) | 0 (0.0%) |
| Total | 1,478 (100.0%) | 918 (100.0%) |
Physical Housing Characteristics in Pawnee County
Housing Structures in Pawnee County
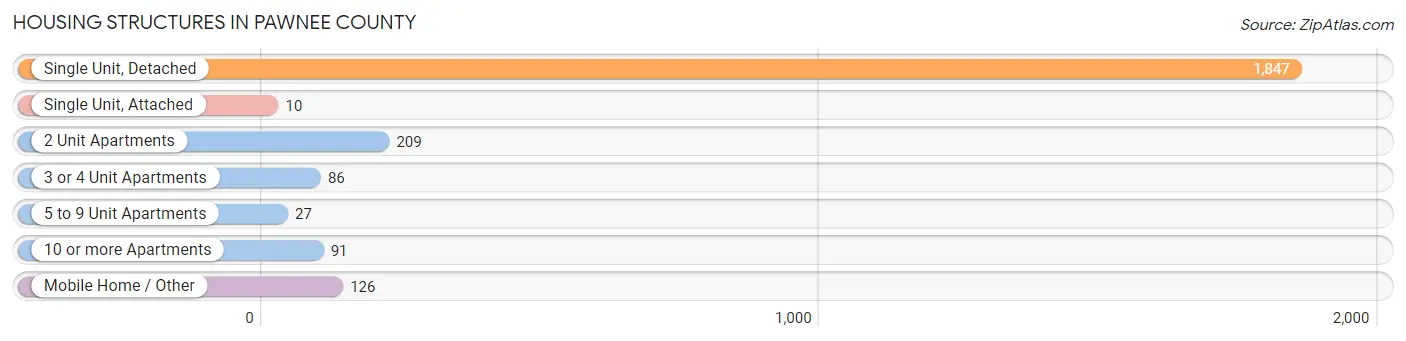
| Structure Type | # Housing Units | % Housing Units |
| Single Unit, Detached | 1,847 | 77.1% |
| Single Unit, Attached | 10 | 0.4% |
| 2 Unit Apartments | 209 | 8.7% |
| 3 or 4 Unit Apartments | 86 | 3.6% |
| 5 to 9 Unit Apartments | 27 | 1.1% |
| 10 or more Apartments | 91 | 3.8% |
| Mobile Home / Other | 126 | 5.3% |
| Total | 2,396 | 100.0% |
Housing Structures by Occupancy in Pawnee County
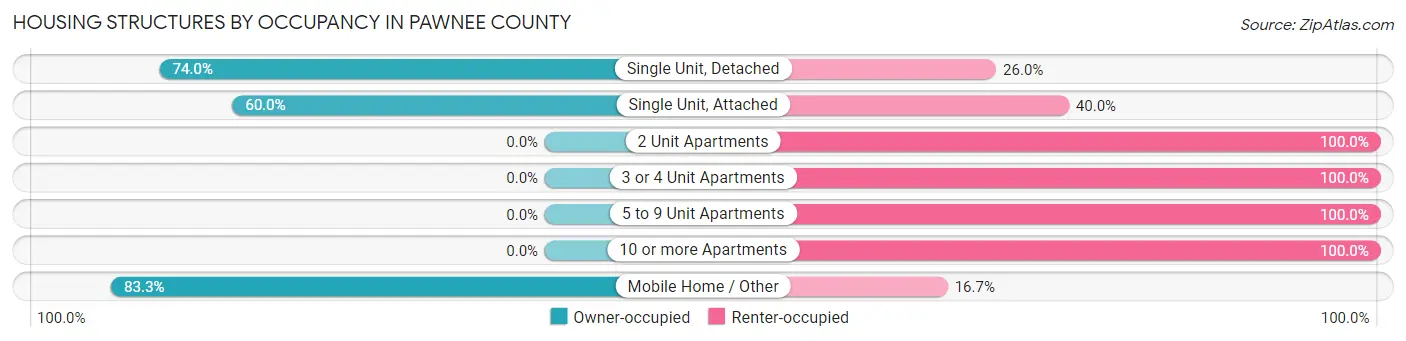
| Structure Type | Owner-occupied | Renter-occupied |
| Single Unit, Detached | 1,367 (74.0%) | 480 (26.0%) |
| Single Unit, Attached | 6 (60.0%) | 4 (40.0%) |
| 2 Unit Apartments | 0 (0.0%) | 209 (100.0%) |
| 3 or 4 Unit Apartments | 0 (0.0%) | 86 (100.0%) |
| 5 to 9 Unit Apartments | 0 (0.0%) | 27 (100.0%) |
| 10 or more Apartments | 0 (0.0%) | 91 (100.0%) |
| Mobile Home / Other | 105 (83.3%) | 21 (16.7%) |
| Total | 1,478 (61.7%) | 918 (38.3%) |
Housing Structures by Number of Rooms in Pawnee County
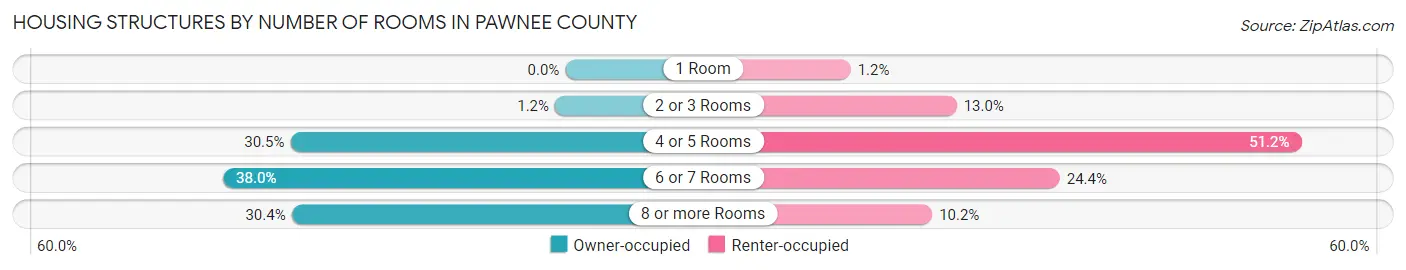
| Number of Rooms | Owner-occupied | Renter-occupied |
| 1 Room | 0 (0.0%) | 11 (1.2%) |
| 2 or 3 Rooms | 17 (1.1%) | 119 (13.0%) |
| 4 or 5 Rooms | 451 (30.5%) | 470 (51.2%) |
| 6 or 7 Rooms | 561 (38.0%) | 224 (24.4%) |
| 8 or more Rooms | 449 (30.4%) | 94 (10.2%) |
| Total | 1,478 (100.0%) | 918 (100.0%) |
Housing Structure by Heating Type in Pawnee County
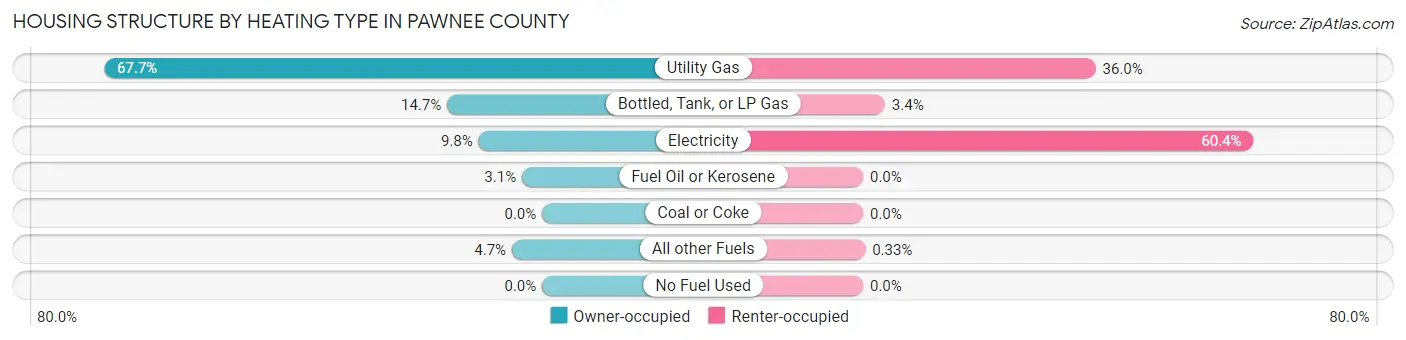
| Heating Type | Owner-occupied | Renter-occupied |
| Utility Gas | 1,001 (67.7%) | 330 (35.9%) |
| Bottled, Tank, or LP Gas | 217 (14.7%) | 31 (3.4%) |
| Electricity | 145 (9.8%) | 554 (60.4%) |
| Fuel Oil or Kerosene | 46 (3.1%) | 0 (0.0%) |
| Coal or Coke | 0 (0.0%) | 0 (0.0%) |
| All other Fuels | 69 (4.7%) | 3 (0.3%) |
| No Fuel Used | 0 (0.0%) | 0 (0.0%) |
| Total | 1,478 (100.0%) | 918 (100.0%) |
Household Vehicle Usage in Pawnee County
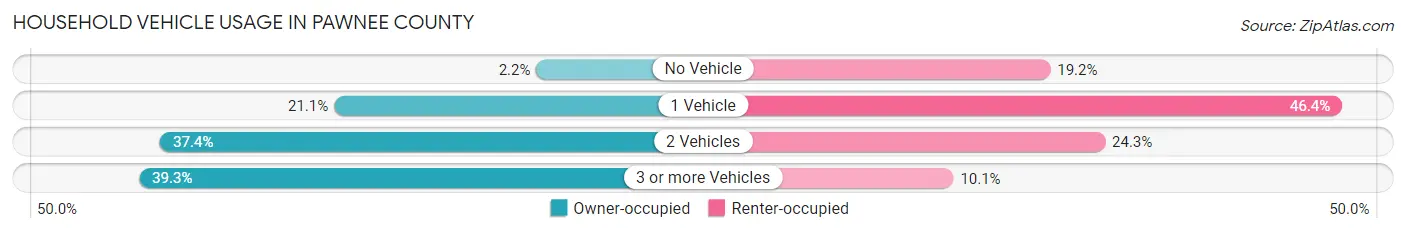
| Vehicles per Household | Owner-occupied | Renter-occupied |
| No Vehicle | 33 (2.2%) | 176 (19.2%) |
| 1 Vehicle | 312 (21.1%) | 426 (46.4%) |
| 2 Vehicles | 552 (37.3%) | 223 (24.3%) |
| 3 or more Vehicles | 581 (39.3%) | 93 (10.1%) |
| Total | 1,478 (100.0%) | 918 (100.0%) |
Real Estate & Mortgages in Pawnee County
Real Estate and Mortgage Overview in Pawnee County
| Characteristic | Without Mortgage | With Mortgage |
| Housing Units | 791 | 687 |
| Median Property Value | $71,300 | $126,100 |
| Median Household Income | $56,875 | $165 |
| Monthly Housing Costs | $393 | $17 |
| Real Estate Taxes | $1,264 | $12 |
Property Value by Mortgage Status in Pawnee County
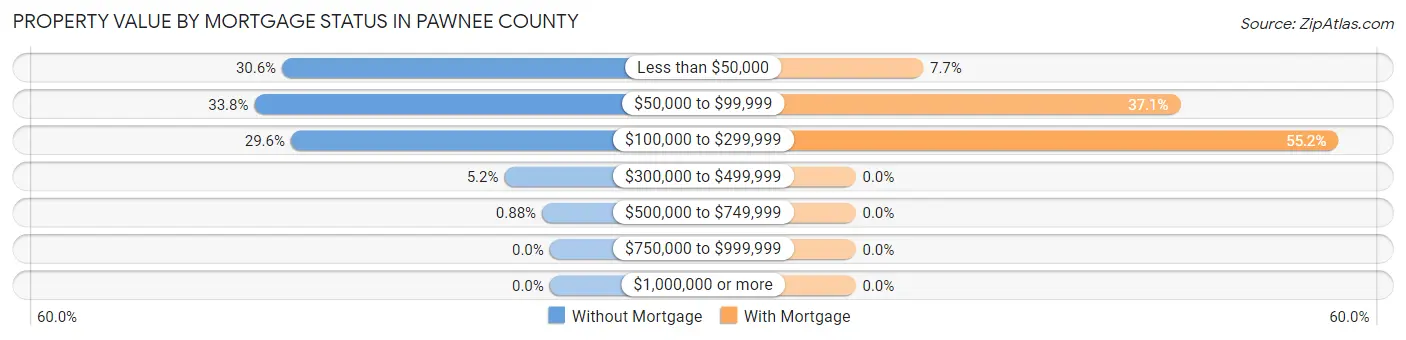
| Property Value | Without Mortgage | With Mortgage |
| Less than $50,000 | 242 (30.6%) | 53 (7.7%) |
| $50,000 to $99,999 | 267 (33.8%) | 255 (37.1%) |
| $100,000 to $299,999 | 234 (29.6%) | 379 (55.2%) |
| $300,000 to $499,999 | 41 (5.2%) | 0 (0.0%) |
| $500,000 to $749,999 | 7 (0.9%) | 0 (0.0%) |
| $750,000 to $999,999 | 0 (0.0%) | 0 (0.0%) |
| $1,000,000 or more | 0 (0.0%) | 0 (0.0%) |
| Total | 791 (100.0%) | 687 (100.0%) |
Household Income by Mortgage Status in Pawnee County
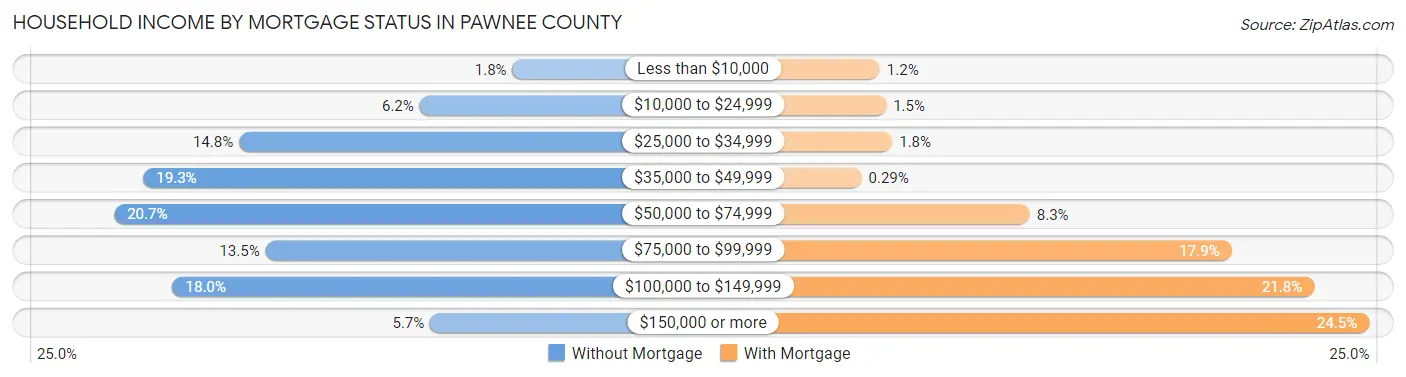
| Household Income | Without Mortgage | With Mortgage |
| Less than $10,000 | 14 (1.8%) | 8 (1.2%) |
| $10,000 to $24,999 | 49 (6.2%) | 10 (1.5%) |
| $25,000 to $34,999 | 117 (14.8%) | 12 (1.8%) |
| $35,000 to $49,999 | 153 (19.3%) | 2 (0.3%) |
| $50,000 to $74,999 | 164 (20.7%) | 57 (8.3%) |
| $75,000 to $99,999 | 107 (13.5%) | 123 (17.9%) |
| $100,000 to $149,999 | 142 (17.9%) | 150 (21.8%) |
| $150,000 or more | 45 (5.7%) | 168 (24.4%) |
| Total | 791 (100.0%) | 687 (100.0%) |
Property Value to Household Income Ratio in Pawnee County
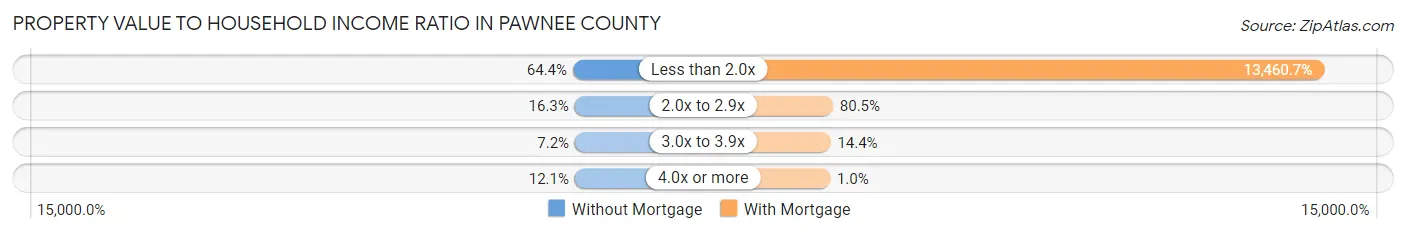
| Value-to-Income Ratio | Without Mortgage | With Mortgage |
| Less than 2.0x | 509 (64.3%) | 92,475 (13,460.7%) |
| 2.0x to 2.9x | 129 (16.3%) | 553 (80.5%) |
| 3.0x to 3.9x | 57 (7.2%) | 99 (14.4%) |
| 4.0x or more | 96 (12.1%) | 7 (1.0%) |
| Total | 791 (100.0%) | 687 (100.0%) |
Real Estate Taxes by Mortgage Status in Pawnee County
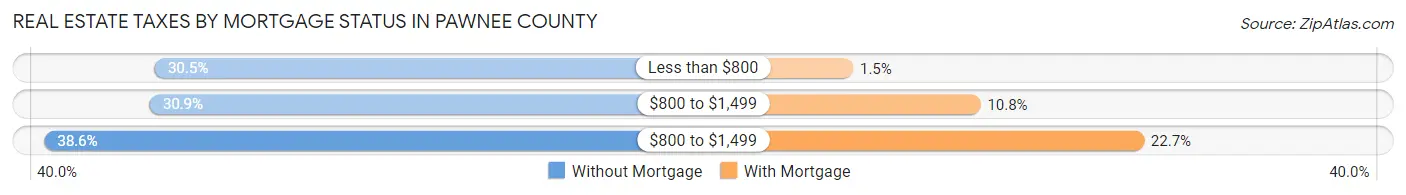
| Property Taxes | Without Mortgage | With Mortgage |
| Less than $800 | 241 (30.5%) | 10 (1.5%) |
| $800 to $1,499 | 244 (30.8%) | 74 (10.8%) |
| $800 to $1,499 | 305 (38.6%) | 156 (22.7%) |
| Total | 791 (100.0%) | 687 (100.0%) |
Health & Disability in Pawnee County
Health Insurance Coverage by Age in Pawnee County
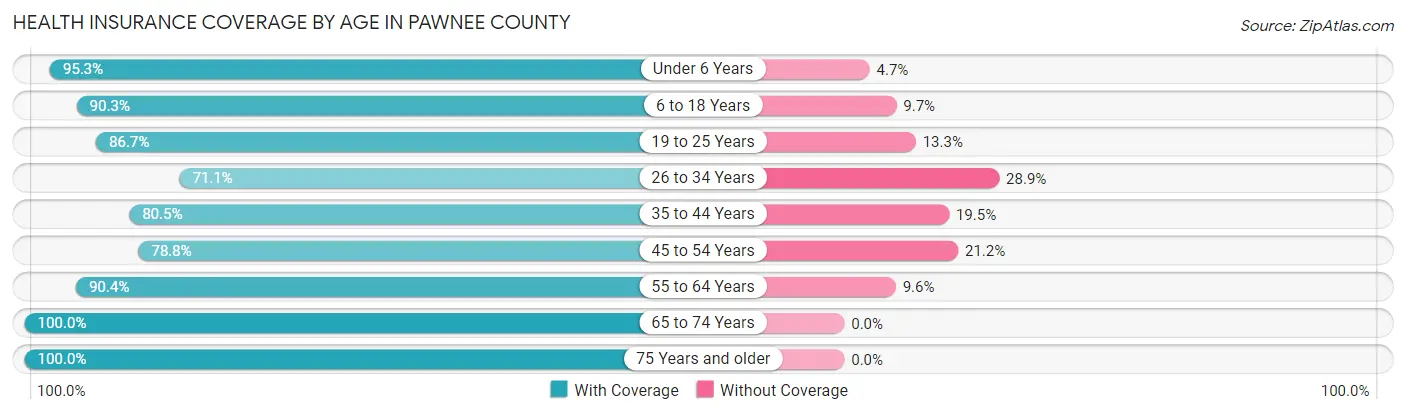
| Age Bracket | With Coverage | Without Coverage |
| Under 6 Years | 242 (95.3%) | 12 (4.7%) |
| 6 to 18 Years | 661 (90.3%) | 71 (9.7%) |
| 19 to 25 Years | 358 (86.7%) | 55 (13.3%) |
| 26 to 34 Years | 367 (71.1%) | 149 (28.9%) |
| 35 to 44 Years | 474 (80.5%) | 115 (19.5%) |
| 45 to 54 Years | 535 (78.8%) | 144 (21.2%) |
| 55 to 64 Years | 886 (90.4%) | 94 (9.6%) |
| 65 to 74 Years | 723 (100.0%) | 0 (0.0%) |
| 75 Years and older | 536 (100.0%) | 0 (0.0%) |
| Total | 4,782 (88.2%) | 640 (11.8%) |
Health Insurance Coverage by Citizenship Status in Pawnee County
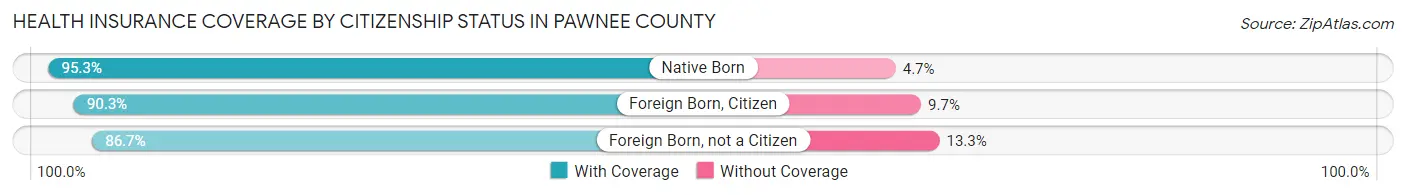
| Citizenship Status | With Coverage | Without Coverage |
| Native Born | 242 (95.3%) | 12 (4.7%) |
| Foreign Born, Citizen | 661 (90.3%) | 71 (9.7%) |
| Foreign Born, not a Citizen | 358 (86.7%) | 55 (13.3%) |
Health Insurance Coverage by Household Income in Pawnee County
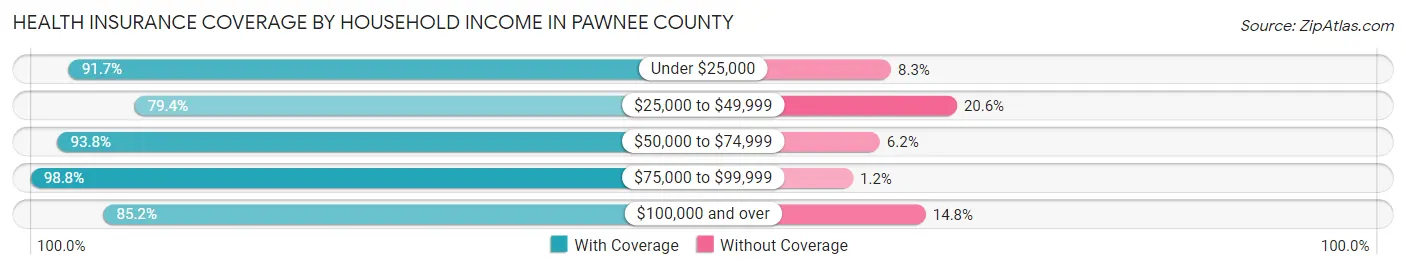
| Household Income | With Coverage | Without Coverage |
| Under $25,000 | 497 (91.7%) | 45 (8.3%) |
| $25,000 to $49,999 | 969 (79.4%) | 252 (20.6%) |
| $50,000 to $74,999 | 726 (93.8%) | 48 (6.2%) |
| $75,000 to $99,999 | 841 (98.8%) | 10 (1.2%) |
| $100,000 and over | 1,640 (85.2%) | 285 (14.8%) |
Public vs Private Health Insurance Coverage by Age in Pawnee County
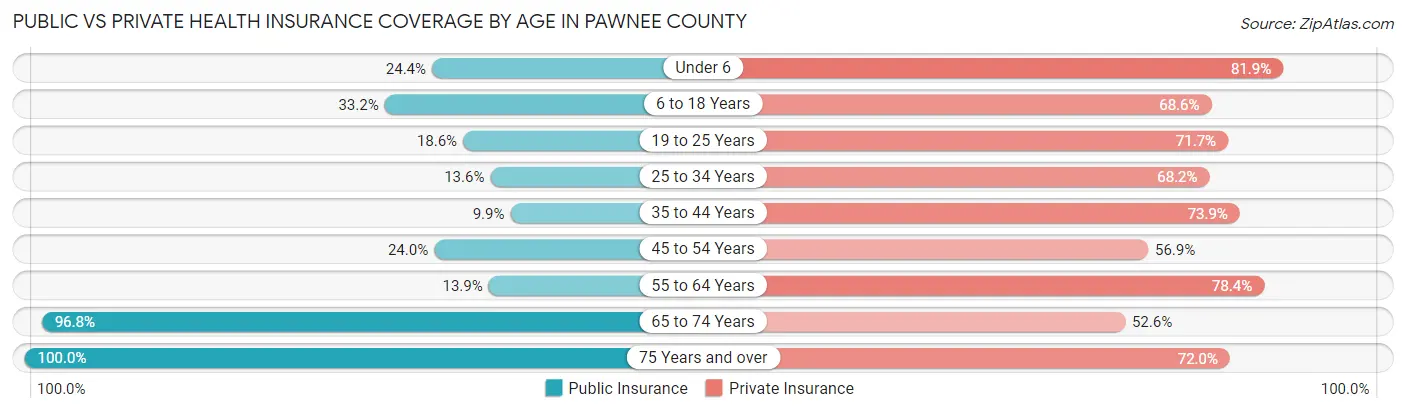
| Age Bracket | Public Insurance | Private Insurance |
| Under 6 | 62 (24.4%) | 208 (81.9%) |
| 6 to 18 Years | 243 (33.2%) | 502 (68.6%) |
| 19 to 25 Years | 77 (18.6%) | 296 (71.7%) |
| 25 to 34 Years | 70 (13.6%) | 352 (68.2%) |
| 35 to 44 Years | 58 (9.9%) | 435 (73.9%) |
| 45 to 54 Years | 163 (24.0%) | 386 (56.9%) |
| 55 to 64 Years | 136 (13.9%) | 768 (78.4%) |
| 65 to 74 Years | 700 (96.8%) | 380 (52.6%) |
| 75 Years and over | 536 (100.0%) | 386 (72.0%) |
| Total | 2,045 (37.7%) | 3,713 (68.5%) |
Disability Status by Sex by Age in Pawnee County
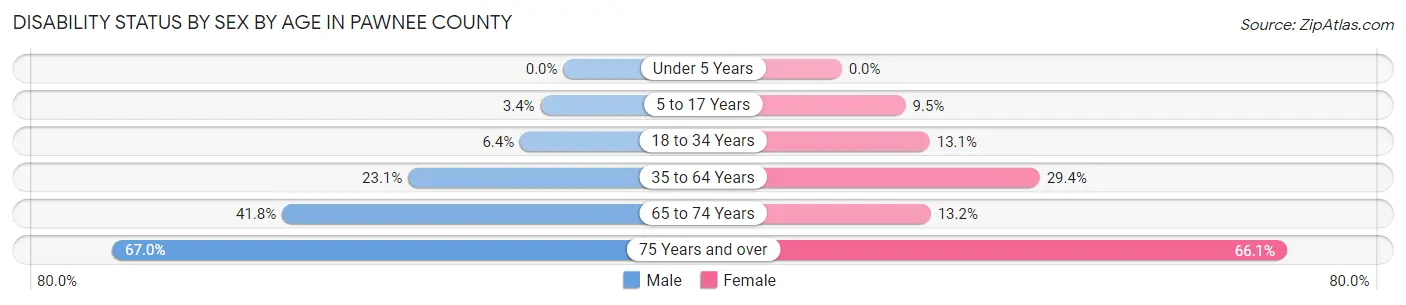
| Age Bracket | Male | Female |
| Under 5 Years | 0 (0.0%) | 0 (0.0%) |
| 5 to 17 Years | 12 (3.4%) | 31 (9.5%) |
| 18 to 34 Years | 32 (6.4%) | 69 (13.1%) |
| 35 to 64 Years | 257 (23.1%) | 333 (29.4%) |
| 65 to 74 Years | 147 (41.8%) | 49 (13.2%) |
| 75 Years and over | 130 (67.0%) | 226 (66.1%) |
Disability Class by Sex by Age in Pawnee County
Disability Class: Hearing Difficulty
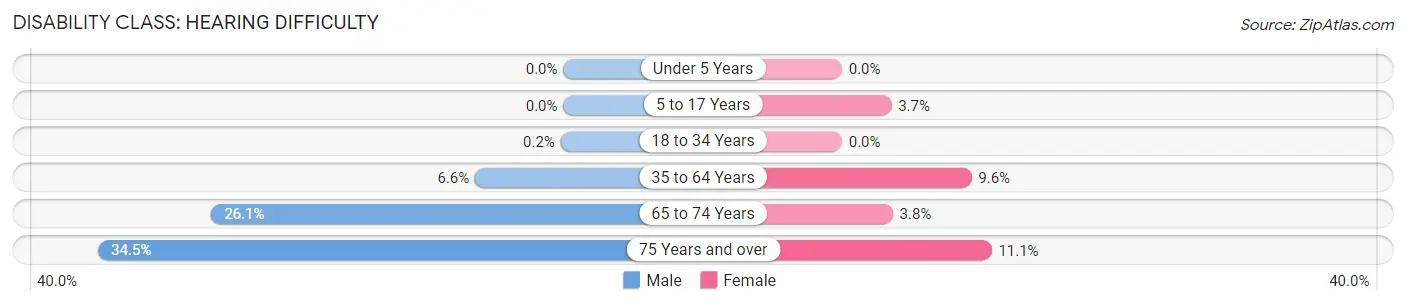
| Age Bracket | Male | Female |
| Under 5 Years | 0 (0.0%) | 0 (0.0%) |
| 5 to 17 Years | 0 (0.0%) | 12 (3.7%) |
| 18 to 34 Years | 1 (0.2%) | 0 (0.0%) |
| 35 to 64 Years | 73 (6.6%) | 109 (9.6%) |
| 65 to 74 Years | 92 (26.1%) | 14 (3.8%) |
| 75 Years and over | 67 (34.5%) | 38 (11.1%) |
Disability Class: Vision Difficulty
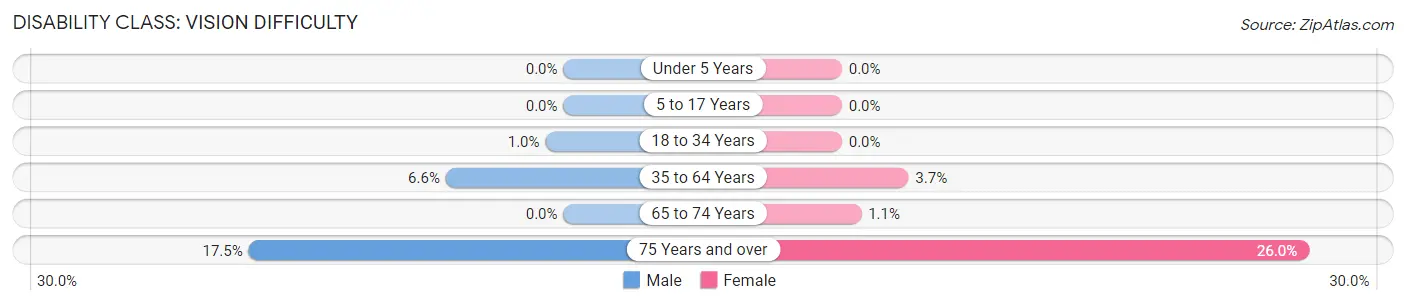
| Age Bracket | Male | Female |
| Under 5 Years | 0 (0.0%) | 0 (0.0%) |
| 5 to 17 Years | 0 (0.0%) | 0 (0.0%) |
| 18 to 34 Years | 5 (1.0%) | 0 (0.0%) |
| 35 to 64 Years | 73 (6.6%) | 42 (3.7%) |
| 65 to 74 Years | 0 (0.0%) | 4 (1.1%) |
| 75 Years and over | 34 (17.5%) | 89 (26.0%) |
Disability Class: Cognitive Difficulty
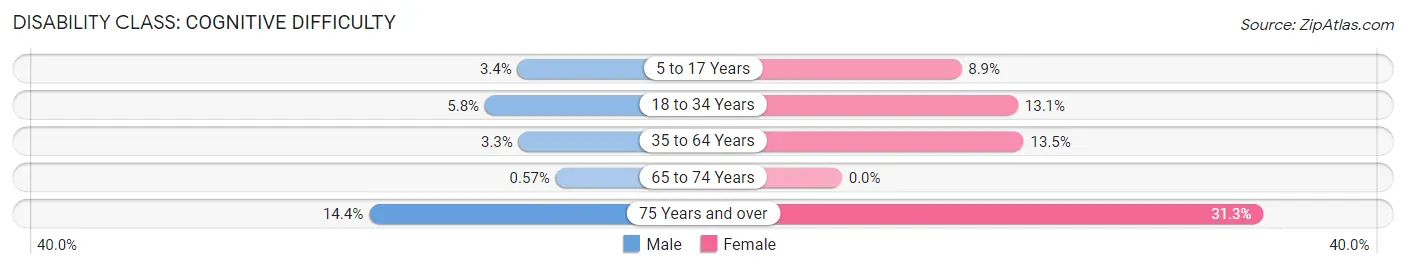
| Age Bracket | Male | Female |
| 5 to 17 Years | 12 (3.4%) | 29 (8.9%) |
| 18 to 34 Years | 29 (5.8%) | 69 (13.1%) |
| 35 to 64 Years | 37 (3.3%) | 153 (13.5%) |
| 65 to 74 Years | 2 (0.6%) | 0 (0.0%) |
| 75 Years and over | 28 (14.4%) | 107 (31.3%) |
Disability Class: Ambulatory Difficulty
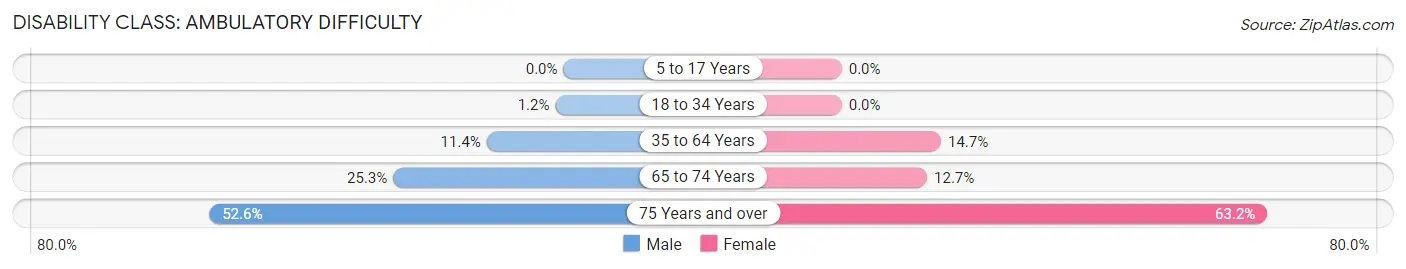
| Age Bracket | Male | Female |
| 5 to 17 Years | 0 (0.0%) | 0 (0.0%) |
| 18 to 34 Years | 6 (1.2%) | 0 (0.0%) |
| 35 to 64 Years | 127 (11.4%) | 167 (14.7%) |
| 65 to 74 Years | 89 (25.3%) | 47 (12.7%) |
| 75 Years and over | 102 (52.6%) | 216 (63.2%) |
Disability Class: Self-Care Difficulty
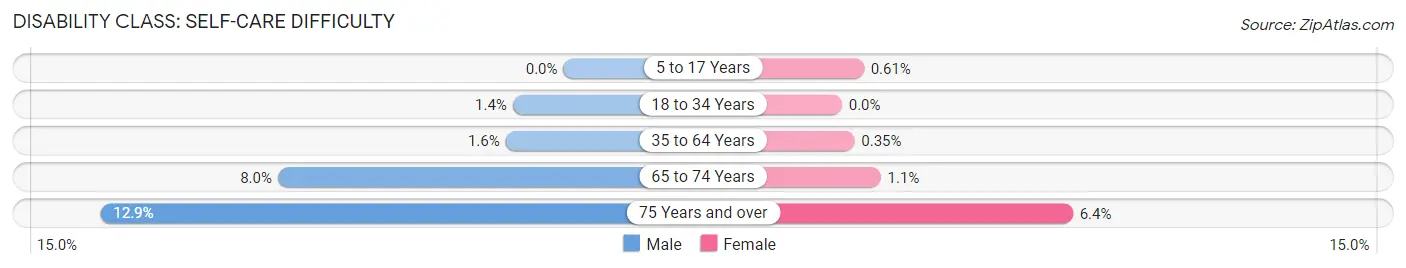
| Age Bracket | Male | Female |
| 5 to 17 Years | 0 (0.0%) | 2 (0.6%) |
| 18 to 34 Years | 7 (1.4%) | 0 (0.0%) |
| 35 to 64 Years | 18 (1.6%) | 4 (0.4%) |
| 65 to 74 Years | 28 (8.0%) | 4 (1.1%) |
| 75 Years and over | 25 (12.9%) | 22 (6.4%) |
Technology Access in Pawnee County
Computing Device Access in Pawnee County
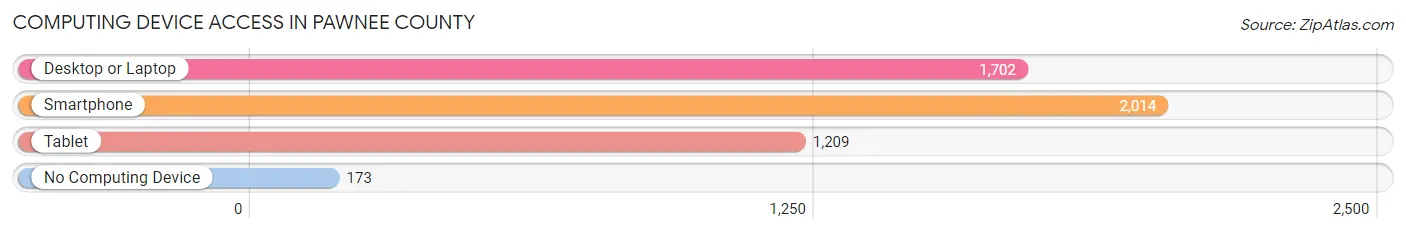
| Device Type | # Households | % Households |
| Desktop or Laptop | 1,702 | 71.0% |
| Smartphone | 2,014 | 84.1% |
| Tablet | 1,209 | 50.5% |
| No Computing Device | 173 | 7.2% |
| Total | 2,396 | 100.0% |
Internet Access in Pawnee County
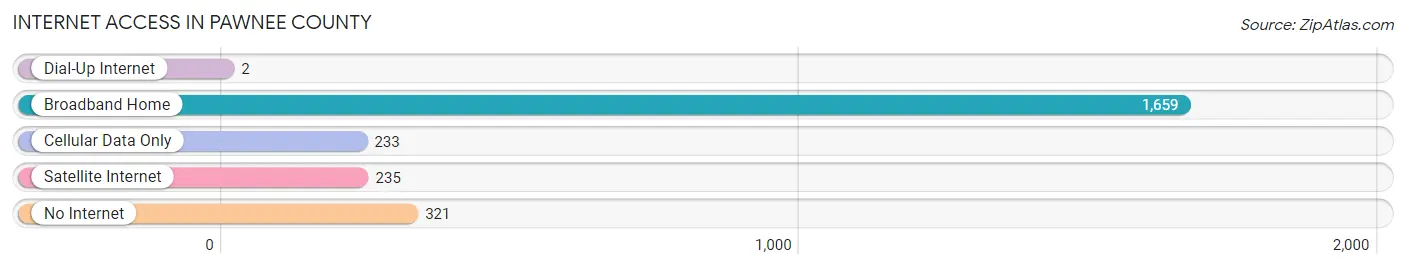
| Internet Type | # Households | % Households |
| Dial-Up Internet | 2 | 0.1% |
| Broadband Home | 1,659 | 69.2% |
| Cellular Data Only | 233 | 9.7% |
| Satellite Internet | 235 | 9.8% |
| No Internet | 321 | 13.4% |
| Total | 2,396 | 100.0% |
Pawnee County Summary
Pawnee County is located in the state of Kansas, in the central United States. It is bordered by Edwards County to the north, Rush County to the east, Stafford County to the south, and Barton County to the west. The county seat is Larned, and the largest city is Rozel. As of the 2010 census, the population was 6,973.
History
Pawnee County was established in 1867, and was named for the Pawnee Native American tribe. The county was originally part of Edwards County, and was created from parts of Rush and Stafford counties. The first settlers arrived in the area in the late 1860s, and the county was officially organized in 1872.
The county was home to several Native American tribes, including the Pawnee, Cheyenne, Arapaho, and Kiowa. The Pawnee were the most numerous, and the county was named after them. The Pawnee were forced to move to Oklahoma in the late 1870s, and the other tribes followed shortly after.
Geography
Pawnee County covers an area of 876 square miles, and is located in the central part of the state. The county is mostly flat, with some rolling hills in the east. The Arkansas River runs through the county, and there are several small lakes and ponds scattered throughout. The county is mostly covered in grassland, with some areas of cropland.
The county is located in the High Plains region of Kansas, and is part of the Great Plains. The climate is semi-arid, with hot summers and cold winters. The average annual precipitation is about 20 inches.
Economy
Agriculture is the main economic activity in Pawnee County. The county is home to several large farms, and the main crops are wheat, corn, sorghum, and soybeans. Cattle and sheep are also raised in the county.
The county also has a small manufacturing sector, with several small factories producing a variety of products. The county is home to several small businesses, including restaurants, retail stores, and service providers.
Demographics
As of the 2010 census, there were 6,973 people, 2,717 households, and 1,845 families living in the county. The population density was 8 people per square mile. The racial makeup of the county was 95.3% White, 0.7% African American, 0.5% Native American, 0.2% Asian, 0.1% Pacific Islander, 1.7% from other races, and 1.5% from two or more races. Hispanic or Latino of any race were 4.2% of the population.
The median income for a household in the county was $37,945, and the median income for a family was $45,938. The per capita income for the county was $18,845. About 11.2% of families and 14.2% of the population were below the poverty line, including 19.2% of those under age 18 and 8.2% of those age 65 or over.
Common Questions
What is Per Capita Income in Pawnee County?
Per Capita income in Pawnee County is $32,542.
What is the Median Family Income in Pawnee County?
Median Family Income in Pawnee County is $82,115.
What is the Median Household income in Pawnee County?
Median Household Income in Pawnee County is $54,141.
What is Income or Wage Gap in Pawnee County?
Income or Wage Gap in Pawnee County is 3.1%.
Women in Pawnee County earn 96.9 cents for every dollar earned by a man.
What is Inequality or Gini Index in Pawnee County?
Inequality or Gini Index in Pawnee County is 0.43.
What is the Total Population of Pawnee County?
Total Population of Pawnee County is 6,288.
What is the Total Male Population of Pawnee County?
Total Male Population of Pawnee County is 3,448.
What is the Total Female Population of Pawnee County?
Total Female Population of Pawnee County is 2,840.
What is the Ratio of Males per 100 Females in Pawnee County?
There are 121.41 Males per 100 Females in Pawnee County.
What is the Ratio of Females per 100 Males in Pawnee County?
There are 82.37 Females per 100 Males in Pawnee County.
What is the Median Population Age in Pawnee County?
Median Population Age in Pawnee County is 46.1 Years.
What is the Average Family Size in Pawnee County
Average Family Size in Pawnee County is 3.4 People.
What is the Average Household Size in Pawnee County
Average Household Size in Pawnee County is 2.2 People.
How Large is the Labor Force in Pawnee County?
There are 2,838 People in the Labor Forcein in Pawnee County.
What is the Percentage of People in the Labor Force in Pawnee County?
51.6% of People are in the Labor Force in Pawnee County.
What is the Unemployment Rate in Pawnee County?
Unemployment Rate in Pawnee County is 1.6%.