Osage County, KS Map & Demographics
Osage County Map
Osage County Overview
$32,120
PER CAPITA INCOME
$78,712
AVG FAMILY INCOME
$66,155
AVG HOUSEHOLD INCOME
27.1%
WAGE / INCOME GAP [ % ]
72.9¢/ $1
WAGE / INCOME GAP [ $ ]
$13,488
FAMILY INCOME DEFICIT
0.38
INEQUALITY / GINI INDEX
15,787
TOTAL POPULATION
8,107
MALE POPULATION
7,680
FEMALE POPULATION
105.56
MALES / 100 FEMALES
94.73
FEMALES / 100 MALES
42.6
MEDIAN AGE
3.0
AVG FAMILY SIZE
2.5
AVG HOUSEHOLD SIZE
7,794
LABOR FORCE [ PEOPLE ]
62.1%
PERCENT IN LABOR FORCE
3.4%
UNEMPLOYMENT RATE
Osage County Area Codes
Income in Osage County
Income Overview in Osage County
Per Capita Income in Osage County is $32,120, while median incomes of families and households are $78,712 and $66,155 respectively.
| Characteristic | Number | Measure |
| Per Capita Income | 15,787 | $32,120 |
| Median Family Income | 4,089 | $78,712 |
| Mean Family Income | 4,089 | $88,717 |
| Median Household Income | 6,280 | $66,155 |
| Mean Household Income | 6,280 | $76,953 |
| Income Deficit | 4,089 | $13,488 |
| Wage / Income Gap (%) | 15,787 | 27.08% |
| Wage / Income Gap ($) | 15,787 | 72.92¢ per $1 |
| Gini / Inequality Index | 15,787 | 0.38 |
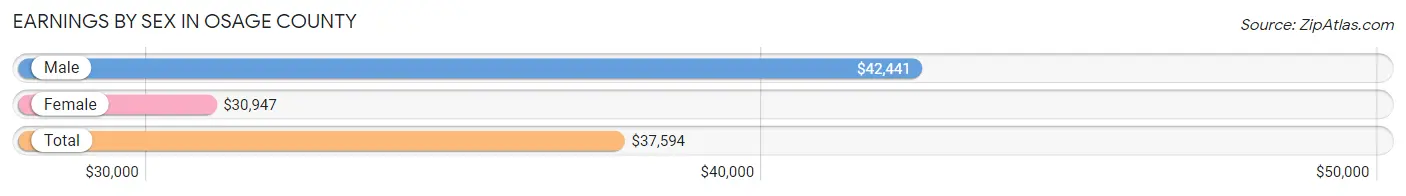
Earnings by Sex in Osage County
Average Earnings in Osage County are $37,594, $42,441 for men and $30,947 for women, a difference of 27.1%.
| Sex | Number | Average Earnings |
| Male | 4,545 (54.8%) | $42,441 |
| Female | 3,748 (45.2%) | $30,947 |
| Total | 8,293 (100.0%) | $37,594 |
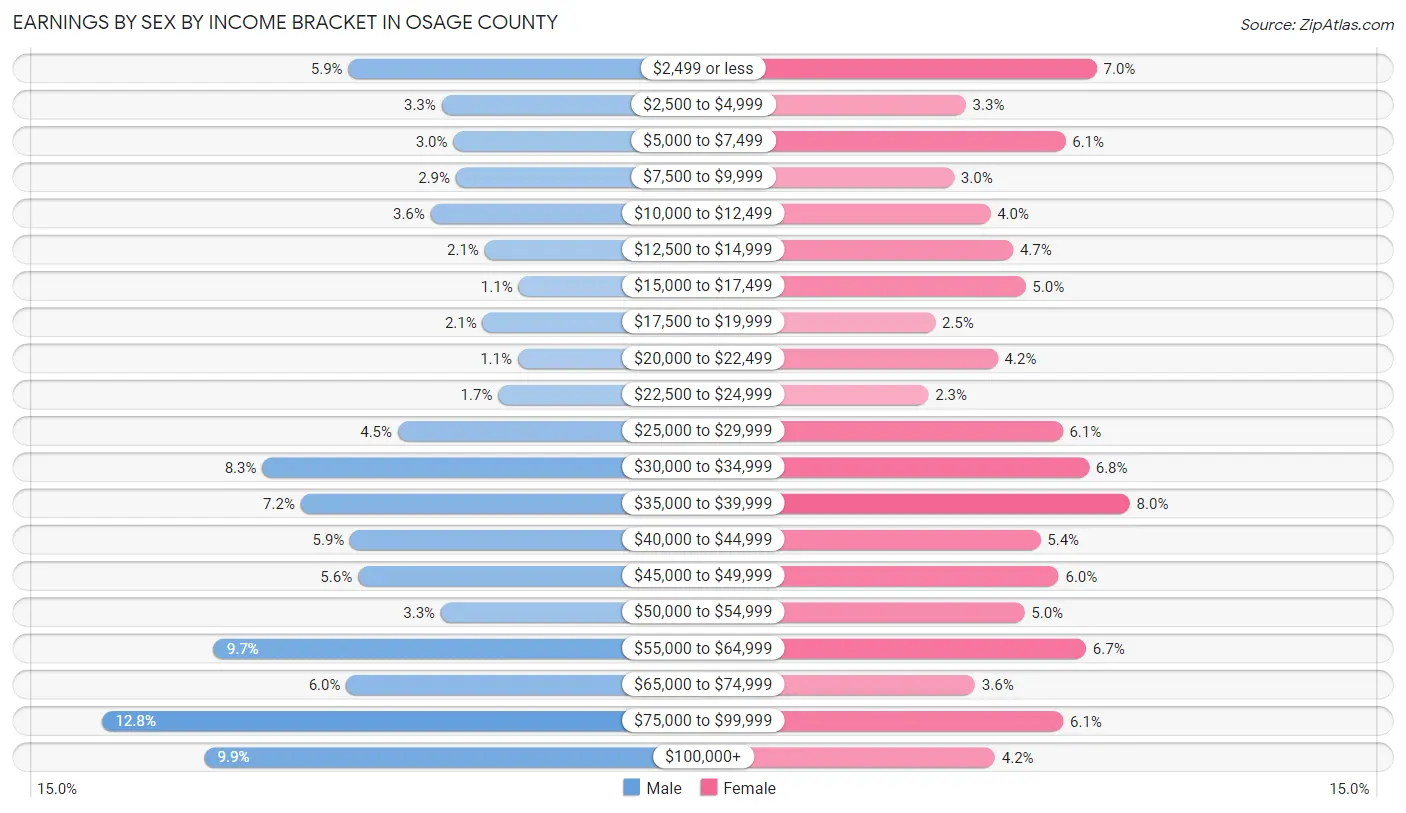
Earnings by Sex by Income Bracket in Osage County
The most common earnings brackets in Osage County are $75,000 to $99,999 for men (582 | 12.8%) and $35,000 to $39,999 for women (298 | 8.0%).
| Income | Male | Female |
| $2,499 or less | 268 (5.9%) | 263 (7.0%) |
| $2,500 to $4,999 | 149 (3.3%) | 125 (3.3%) |
| $5,000 to $7,499 | 134 (2.9%) | 230 (6.1%) |
| $7,500 to $9,999 | 131 (2.9%) | 113 (3.0%) |
| $10,000 to $12,499 | 163 (3.6%) | 151 (4.0%) |
| $12,500 to $14,999 | 94 (2.1%) | 175 (4.7%) |
| $15,000 to $17,499 | 51 (1.1%) | 188 (5.0%) |
| $17,500 to $19,999 | 97 (2.1%) | 93 (2.5%) |
| $20,000 to $22,499 | 52 (1.1%) | 159 (4.2%) |
| $22,500 to $24,999 | 77 (1.7%) | 86 (2.3%) |
| $25,000 to $29,999 | 205 (4.5%) | 227 (6.1%) |
| $30,000 to $34,999 | 378 (8.3%) | 255 (6.8%) |
| $35,000 to $39,999 | 329 (7.2%) | 298 (8.0%) |
| $40,000 to $44,999 | 266 (5.9%) | 204 (5.4%) |
| $45,000 to $49,999 | 256 (5.6%) | 223 (5.9%) |
| $50,000 to $54,999 | 150 (3.3%) | 187 (5.0%) |
| $55,000 to $64,999 | 440 (9.7%) | 252 (6.7%) |
| $65,000 to $74,999 | 271 (6.0%) | 135 (3.6%) |
| $75,000 to $99,999 | 582 (12.8%) | 228 (6.1%) |
| $100,000+ | 452 (9.9%) | 156 (4.2%) |
| Total | 4,545 (100.0%) | 3,748 (100.0%) |
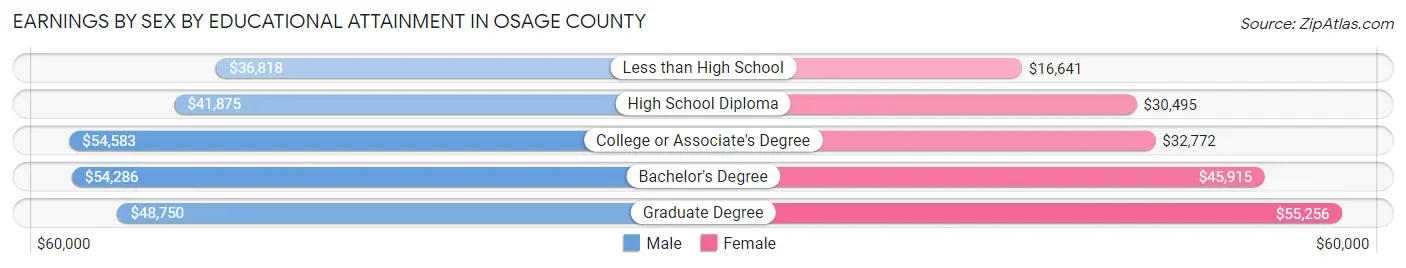
Earnings by Sex by Educational Attainment in Osage County
Average earnings in Osage County are $47,360 for men and $35,265 for women, a difference of 25.5%. Men with an educational attainment of college or associate's degree enjoy the highest average annual earnings of $54,583, while those with less than high school education earn the least with $36,818. Women with an educational attainment of graduate degree earn the most with the average annual earnings of $55,256, while those with less than high school education have the smallest earnings of $16,641.
| Educational Attainment | Male Income | Female Income |
| Less than High School | $36,818 | $16,641 |
| High School Diploma | $41,875 | $30,495 |
| College or Associate's Degree | $54,583 | $32,772 |
| Bachelor's Degree | $54,286 | $45,915 |
| Graduate Degree | $48,750 | $55,256 |
| Total | $47,360 | $35,265 |
Family Income in Osage County
Family Income Brackets in Osage County
According to the Osage County family income data, there are 969 families falling into the $100,000 to $149,999 income range, which is the most common income bracket and makes up 23.7% of all families. Conversely, the $10,000 to $14,999 income bracket is the least frequent group with only 98 families (2.4%) belonging to this category.
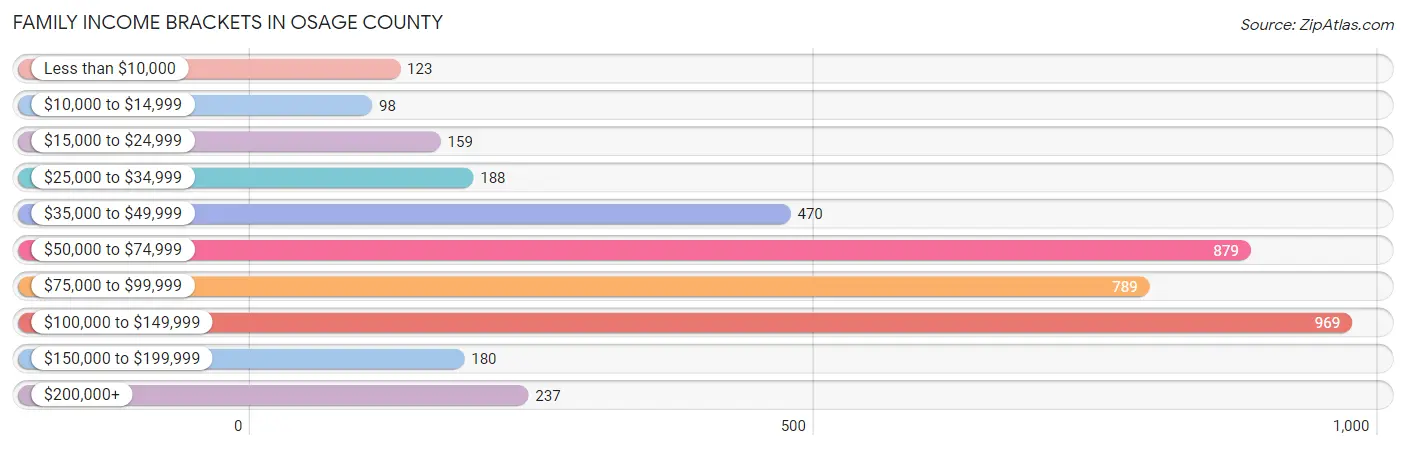
| Income Bracket | # Families | % Families |
| Less than $10,000 | 123 | 3.0% |
| $10,000 to $14,999 | 98 | 2.4% |
| $15,000 to $24,999 | 159 | 3.9% |
| $25,000 to $34,999 | 188 | 4.6% |
| $35,000 to $49,999 | 470 | 11.5% |
| $50,000 to $74,999 | 879 | 21.5% |
| $75,000 to $99,999 | 789 | 19.3% |
| $100,000 to $149,999 | 969 | 23.7% |
| $150,000 to $199,999 | 180 | 4.4% |
| $200,000+ | 237 | 5.8% |
Family Income by Famaliy Size in Osage County
6-person families (116 | 2.8%) account for the highest median family income in Osage County with $100,132 per family, while 2-person families (2,312 | 56.5%) have the highest median income of $36,603 per family member.
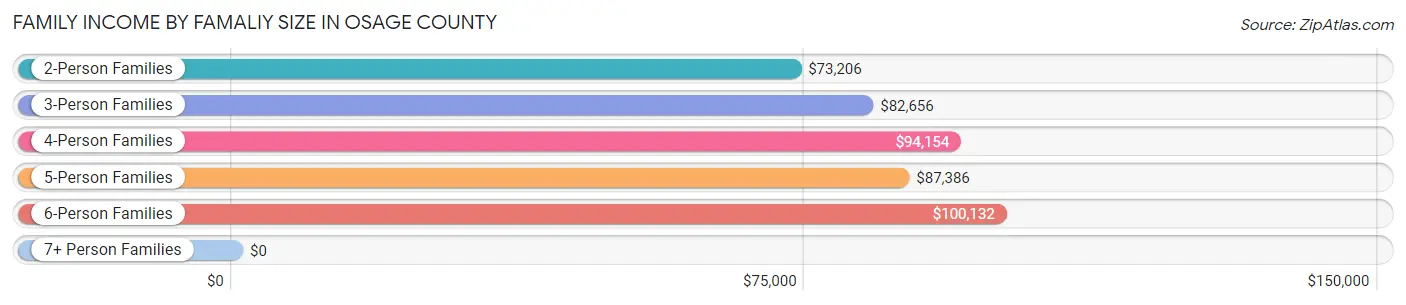
| Income Bracket | # Families | Median Income |
| 2-Person Families | 2,312 (56.5%) | $73,206 |
| 3-Person Families | 689 (16.9%) | $82,656 |
| 4-Person Families | 653 (16.0%) | $94,154 |
| 5-Person Families | 281 (6.9%) | $87,386 |
| 6-Person Families | 116 (2.8%) | $100,132 |
| 7+ Person Families | 38 (0.9%) | $0 |
| Total | 4,089 (100.0%) | $78,712 |
Family Income by Number of Earners in Osage County
The median family income in Osage County is $78,712, with families comprising 3+ earners (340) having the highest median family income of $128,846, while families with no earners (699) have the lowest median family income of $49,261, accounting for 8.3% and 17.1% of families, respectively.
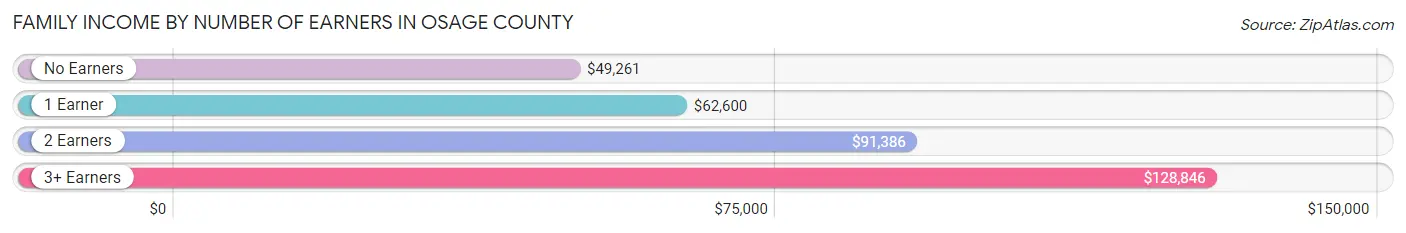
| Number of Earners | # Families | Median Income |
| No Earners | 699 (17.1%) | $49,261 |
| 1 Earner | 1,296 (31.7%) | $62,600 |
| 2 Earners | 1,754 (42.9%) | $91,386 |
| 3+ Earners | 340 (8.3%) | $128,846 |
| Total | 4,089 (100.0%) | $78,712 |
Household Income in Osage County
Household Income Brackets in Osage County
With 1,319 households falling in the category, the $50,000 to $74,999 income range is the most frequent in Osage County, accounting for 21.0% of all households. In contrast, only 201 households (3.2%) fall into the $150,000 to $199,999 income bracket, making it the least populous group.
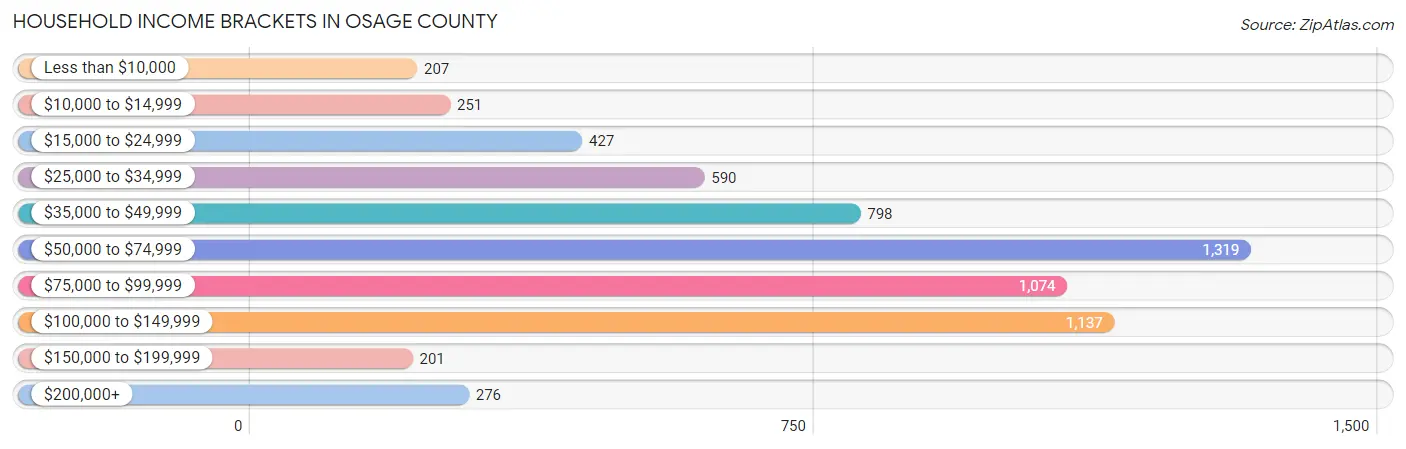
| Income Bracket | # Households | % Households |
| Less than $10,000 | 207 | 3.3% |
| $10,000 to $14,999 | 251 | 4.0% |
| $15,000 to $24,999 | 427 | 6.8% |
| $25,000 to $34,999 | 590 | 9.4% |
| $35,000 to $49,999 | 798 | 12.7% |
| $50,000 to $74,999 | 1,319 | 21.0% |
| $75,000 to $99,999 | 1,074 | 17.1% |
| $100,000 to $149,999 | 1,137 | 18.1% |
| $150,000 to $199,999 | 201 | 3.2% |
| $200,000+ | 276 | 4.4% |
Household Income by Householder Age in Osage County
The median household income in Osage County is $66,155, with the highest median household income of $82,241 found in the 45 to 64 years age bracket for the primary householder. A total of 2,430 households (38.7%) fall into this category. Meanwhile, the 15 to 24 years age bracket for the primary householder has the lowest median household income of $40,417, with 239 households (3.8%) in this group.
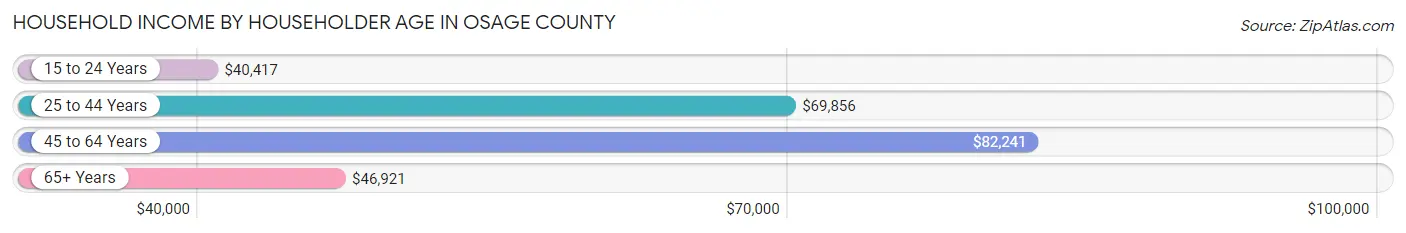
| Income Bracket | # Households | Median Income |
| 15 to 24 Years | 239 (3.8%) | $40,417 |
| 25 to 44 Years | 1,628 (25.9%) | $69,856 |
| 45 to 64 Years | 2,430 (38.7%) | $82,241 |
| 65+ Years | 1,983 (31.6%) | $46,921 |
| Total | 6,280 (100.0%) | $66,155 |
Poverty in Osage County
Income Below Poverty by Sex and Age in Osage County
With 10.8% poverty level for males and 11.6% for females among the residents of Osage County, 5 year old males and 6 to 11 year old females are the most vulnerable to poverty, with 22 males (24.2%) and 144 females (22.6%) in their respective age groups living below the poverty level.
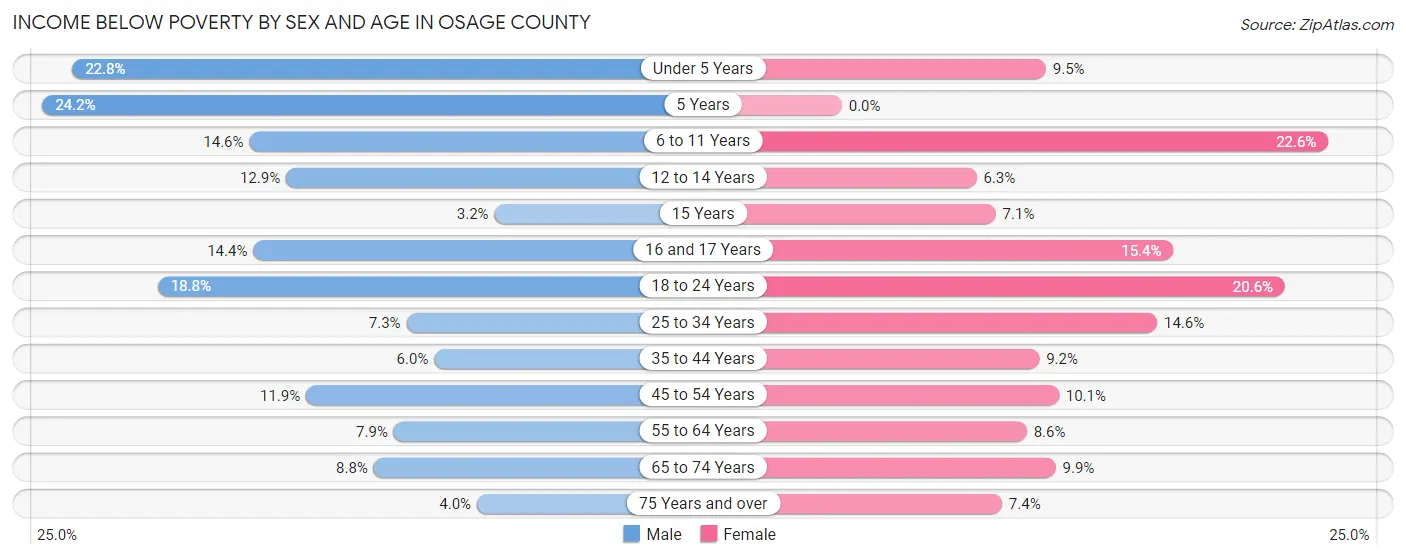
| Age Bracket | Male | Female |
| Under 5 Years | 98 (22.8%) | 32 (9.5%) |
| 5 Years | 22 (24.2%) | 0 (0.0%) |
| 6 to 11 Years | 96 (14.6%) | 144 (22.6%) |
| 12 to 14 Years | 39 (12.9%) | 20 (6.2%) |
| 15 Years | 4 (3.2%) | 10 (7.1%) |
| 16 and 17 Years | 39 (14.4%) | 28 (15.4%) |
| 18 to 24 Years | 131 (18.8%) | 102 (20.6%) |
| 25 to 34 Years | 56 (7.3%) | 120 (14.6%) |
| 35 to 44 Years | 56 (6.0%) | 77 (9.2%) |
| 45 to 54 Years | 114 (11.9%) | 92 (10.1%) |
| 55 to 64 Years | 98 (7.9%) | 107 (8.6%) |
| 65 to 74 Years | 85 (8.8%) | 89 (9.9%) |
| 75 Years and over | 22 (4.0%) | 45 (7.4%) |
| Total | 860 (10.8%) | 866 (11.6%) |
Income Above Poverty by Sex and Age in Osage County
According to the poverty statistics in Osage County, males aged 15 years and females aged 5 years are the age groups that are most secure financially, with 96.8% of males and 100.0% of females in these age groups living above the poverty line.
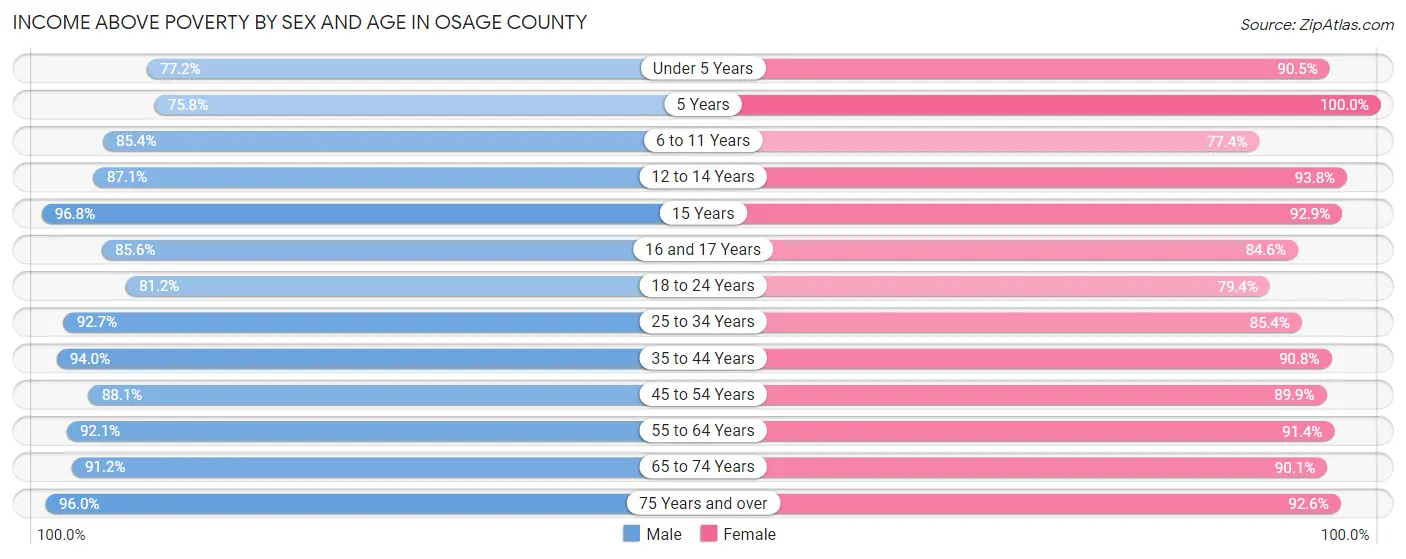
| Age Bracket | Male | Female |
| Under 5 Years | 332 (77.2%) | 306 (90.5%) |
| 5 Years | 69 (75.8%) | 51 (100.0%) |
| 6 to 11 Years | 563 (85.4%) | 494 (77.4%) |
| 12 to 14 Years | 264 (87.1%) | 300 (93.8%) |
| 15 Years | 121 (96.8%) | 130 (92.9%) |
| 16 and 17 Years | 232 (85.6%) | 154 (84.6%) |
| 18 to 24 Years | 565 (81.2%) | 394 (79.4%) |
| 25 to 34 Years | 713 (92.7%) | 700 (85.4%) |
| 35 to 44 Years | 879 (94.0%) | 764 (90.8%) |
| 45 to 54 Years | 841 (88.1%) | 822 (89.9%) |
| 55 to 64 Years | 1,148 (92.1%) | 1,140 (91.4%) |
| 65 to 74 Years | 881 (91.2%) | 808 (90.1%) |
| 75 Years and over | 526 (96.0%) | 561 (92.6%) |
| Total | 7,134 (89.2%) | 6,624 (88.4%) |
Income Below Poverty Among Married-Couple Families in Osage County
The poverty statistics for married-couple families in Osage County show that 3.6% or 118 of the total 3,248 families live below the poverty line. Families with 5 or more children have the highest poverty rate of 57.7%, comprising of 15 families. On the other hand, families with no children have the lowest poverty rate of 2.6%, which includes 57 families.
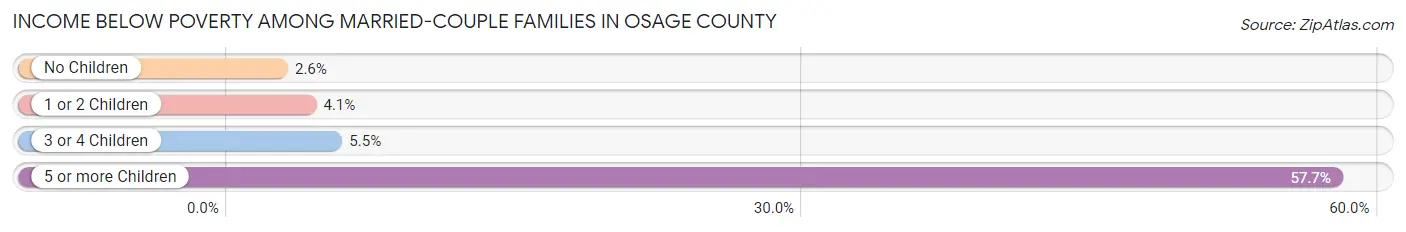
| Children | Above Poverty | Below Poverty |
| No Children | 2,127 (97.4%) | 57 (2.6%) |
| 1 or 2 Children | 749 (95.9%) | 32 (4.1%) |
| 3 or 4 Children | 243 (94.6%) | 14 (5.4%) |
| 5 or more Children | 11 (42.3%) | 15 (57.7%) |
| Total | 3,130 (96.4%) | 118 (3.6%) |
Income Below Poverty Among Single-Parent Households in Osage County
According to the poverty data in Osage County, 19.6% or 65 single-father households and 24.2% or 123 single-mother households are living below the poverty line. Among single-father households, those with 3 or 4 children have the highest poverty rate, with 52 households (49.5%) experiencing poverty. Likewise, among single-mother households, those with 1 or 2 children have the highest poverty rate, with 109 households (37.5%) falling below the poverty line.
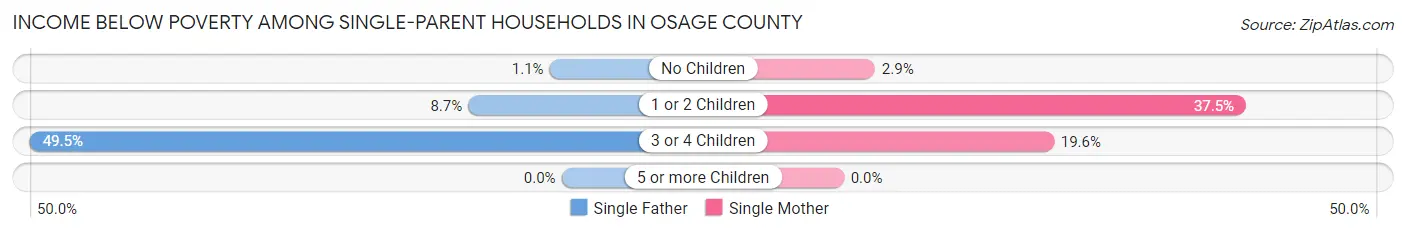
| Children | Single Father | Single Mother |
| No Children | 1 (1.1%) | 5 (2.9%) |
| 1 or 2 Children | 12 (8.7%) | 109 (37.5%) |
| 3 or 4 Children | 52 (49.5%) | 9 (19.6%) |
| 5 or more Children | 0 (0.0%) | 0 (0.0%) |
| Total | 65 (19.6%) | 123 (24.2%) |
Income Below Poverty Among Married-Couple vs Single-Parent Households in Osage County
The poverty data for Osage County shows that 118 of the married-couple family households (3.6%) and 188 of the single-parent households (22.4%) are living below the poverty level. Within the married-couple family households, those with 5 or more children have the highest poverty rate, with 15 households (57.7%) falling below the poverty line. Among the single-parent households, those with 3 or 4 children have the highest poverty rate, with 61 household (40.4%) living below poverty.
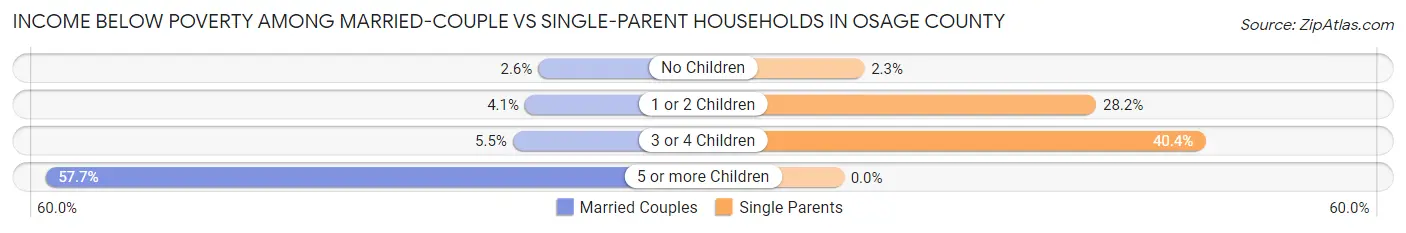
| Children | Married-Couple Families | Single-Parent Households |
| No Children | 57 (2.6%) | 6 (2.3%) |
| 1 or 2 Children | 32 (4.1%) | 121 (28.2%) |
| 3 or 4 Children | 14 (5.4%) | 61 (40.4%) |
| 5 or more Children | 15 (57.7%) | 0 (0.0%) |
| Total | 118 (3.6%) | 188 (22.4%) |
Race in Osage County
The most populous races in Osage County are White / Caucasian (14,885 | 94.3%), Two or more Races (688 | 4.4%), and Hispanic or Latino (568 | 3.6%).
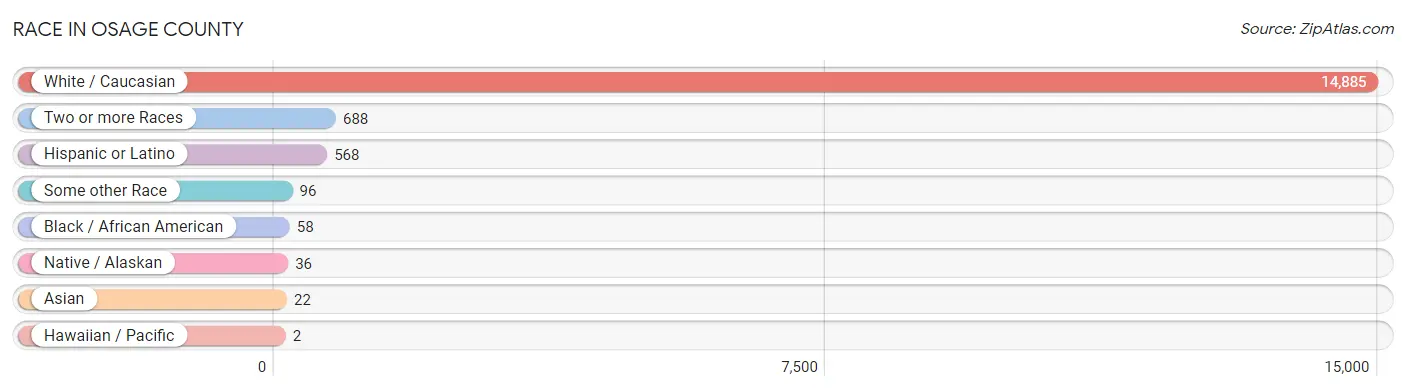
| Race | # Population | % Population |
| Asian | 22 | 0.1% |
| Black / African American | 58 | 0.4% |
| Hawaiian / Pacific | 2 | 0.0% |
| Hispanic or Latino | 568 | 3.6% |
| Native / Alaskan | 36 | 0.2% |
| White / Caucasian | 14,885 | 94.3% |
| Two or more Races | 688 | 4.4% |
| Some other Race | 96 | 0.6% |
| Total | 15,787 | 100.0% |
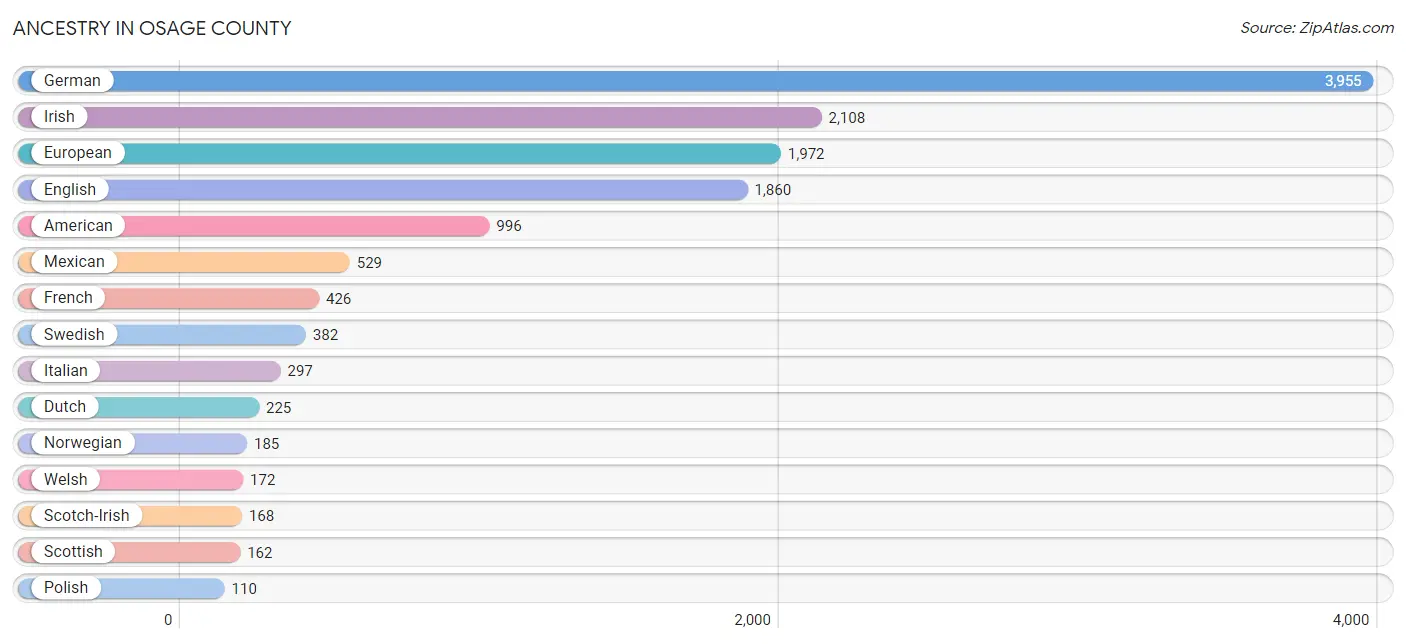
Ancestry in Osage County
The most populous ancestries reported in Osage County are German (3,955 | 25.1%), Irish (2,108 | 13.4%), European (1,972 | 12.5%), English (1,860 | 11.8%), and American (996 | 6.3%), together accounting for 69.0% of all Osage County residents.
| Ancestry | # Population | % Population |
| American | 996 | 6.3% |
| Apache | 17 | 0.1% |
| Australian | 84 | 0.5% |
| Austrian | 28 | 0.2% |
| Belgian | 21 | 0.1% |
| Bhutanese | 17 | 0.1% |
| Blackfeet | 2 | 0.0% |
| British | 69 | 0.4% |
| Burmese | 3 | 0.0% |
| Canadian | 9 | 0.1% |
| Celtic | 12 | 0.1% |
| Central American | 39 | 0.3% |
| Cherokee | 86 | 0.5% |
| Choctaw | 7 | 0.0% |
| Costa Rican | 10 | 0.1% |
| Creek | 8 | 0.1% |
| Croatian | 3 | 0.0% |
| Czech | 43 | 0.3% |
| Czechoslovakian | 8 | 0.1% |
| Danish | 87 | 0.5% |
| Dutch | 225 | 1.4% |
| Eastern European | 23 | 0.2% |
| English | 1,860 | 11.8% |
| European | 1,972 | 12.5% |
| Finnish | 3 | 0.0% |
| French | 426 | 2.7% |
| French Canadian | 50 | 0.3% |
| German | 3,955 | 25.1% |
| Greek | 7 | 0.0% |
| Indian (Asian) | 34 | 0.2% |
| Irish | 2,108 | 13.4% |
| Iroquois | 15 | 0.1% |
| Italian | 297 | 1.9% |
| Jamaican | 7 | 0.0% |
| Japanese | 9 | 0.1% |
| Kenyan | 6 | 0.0% |
| Korean | 9 | 0.1% |
| Lithuanian | 5 | 0.0% |
| Luxembourger | 1 | 0.0% |
| Malaysian | 12 | 0.1% |
| Menominee | 17 | 0.1% |
| Mexican | 529 | 3.4% |
| Native Hawaiian | 5 | 0.0% |
| Northern European | 1 | 0.0% |
| Norwegian | 185 | 1.2% |
| Pennsylvania German | 1 | 0.0% |
| Polish | 110 | 0.7% |
| Portuguese | 13 | 0.1% |
| Potawatomi | 17 | 0.1% |
| Russian | 107 | 0.7% |
| Salvadoran | 29 | 0.2% |
| Scandinavian | 13 | 0.1% |
| Scotch-Irish | 168 | 1.1% |
| Scottish | 162 | 1.0% |
| Sioux | 57 | 0.4% |
| Slovene | 5 | 0.0% |
| Subsaharan African | 6 | 0.0% |
| Swedish | 382 | 2.4% |
| Swiss | 40 | 0.3% |
| Ukrainian | 7 | 0.0% |
| Welsh | 172 | 1.1% | View All 61 Rows |
Immigrants in Osage County
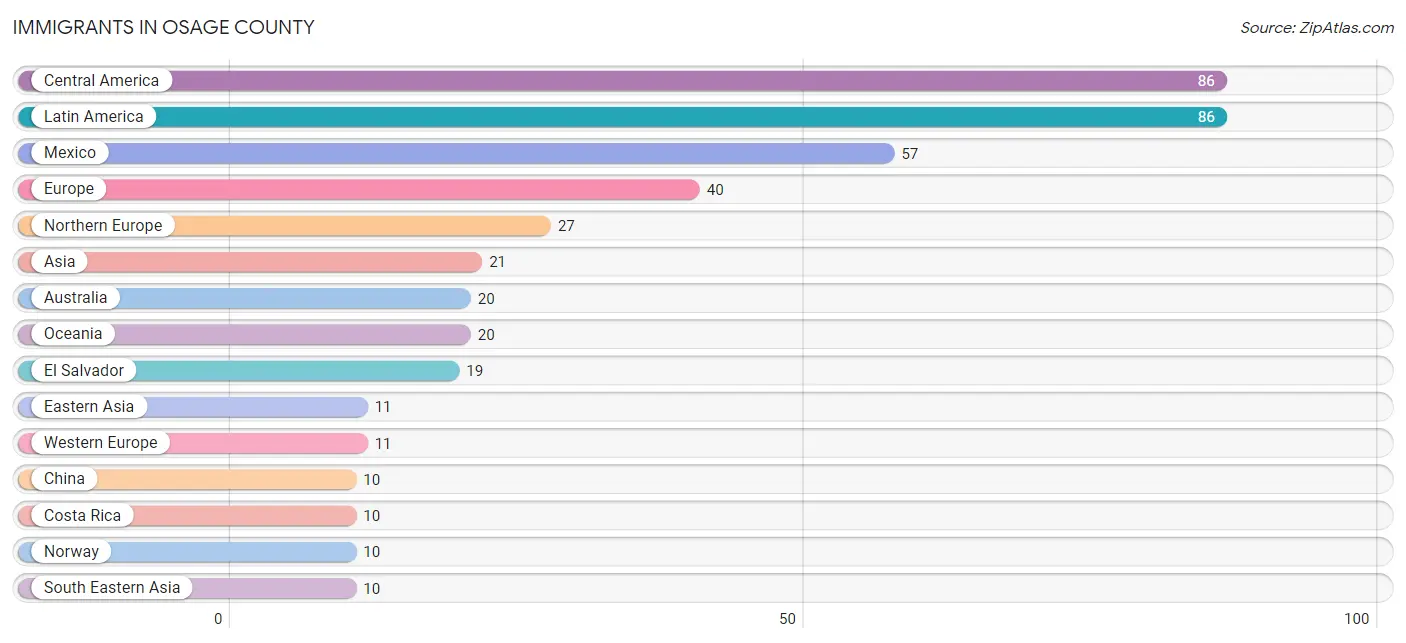
The most numerous immigrant groups reported in Osage County came from Central America (86 | 0.5%), Latin America (86 | 0.5%), Mexico (57 | 0.4%), Europe (40 | 0.3%), and Northern Europe (27 | 0.2%), together accounting for 1.9% of all Osage County residents.
| Immigration Origin | # Population | % Population |
| Africa | 6 | 0.0% |
| Asia | 21 | 0.1% |
| Australia | 20 | 0.1% |
| Cambodia | 4 | 0.0% |
| Canada | 9 | 0.1% |
| Central America | 86 | 0.5% |
| China | 10 | 0.1% |
| Costa Rica | 10 | 0.1% |
| Eastern Africa | 6 | 0.0% |
| Eastern Asia | 11 | 0.1% |
| Eastern Europe | 2 | 0.0% |
| El Salvador | 19 | 0.1% |
| Europe | 40 | 0.3% |
| France | 2 | 0.0% |
| Germany | 9 | 0.1% |
| Kenya | 6 | 0.0% |
| Korea | 1 | 0.0% |
| Laos | 1 | 0.0% |
| Latin America | 86 | 0.5% |
| Mexico | 57 | 0.4% |
| Northern Europe | 27 | 0.2% |
| Norway | 10 | 0.1% |
| Oceania | 20 | 0.1% |
| Philippines | 5 | 0.0% |
| South Eastern Asia | 10 | 0.1% |
| Ukraine | 2 | 0.0% |
| Western Europe | 11 | 0.1% | View All 27 Rows |
Sex and Age in Osage County
Sex and Age in Osage County
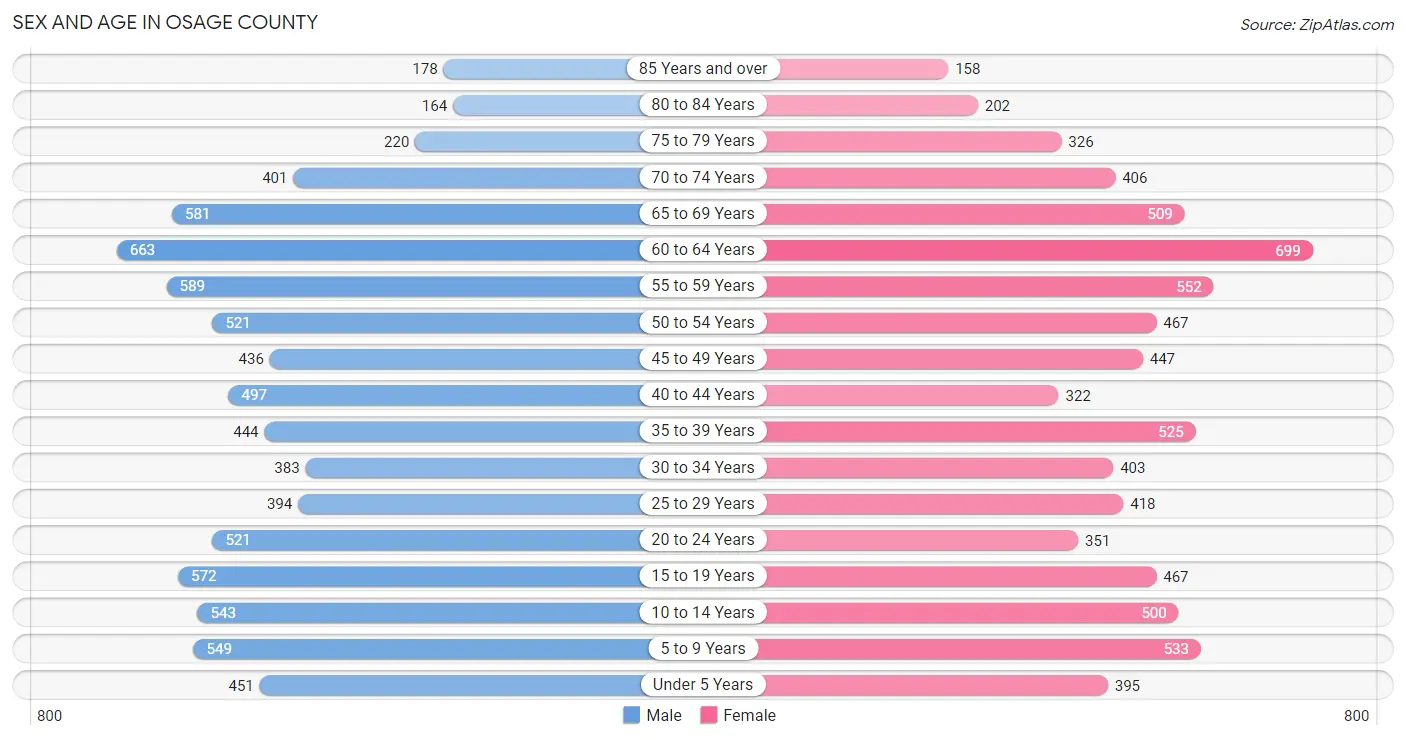
The most populous age groups in Osage County are 60 to 64 Years (663 | 8.2%) for men and 60 to 64 Years (699 | 9.1%) for women.
| Age Bracket | Male | Female |
| Under 5 Years | 451 (5.6%) | 395 (5.1%) |
| 5 to 9 Years | 549 (6.8%) | 533 (6.9%) |
| 10 to 14 Years | 543 (6.7%) | 500 (6.5%) |
| 15 to 19 Years | 572 (7.1%) | 467 (6.1%) |
| 20 to 24 Years | 521 (6.4%) | 351 (4.6%) |
| 25 to 29 Years | 394 (4.9%) | 418 (5.4%) |
| 30 to 34 Years | 383 (4.7%) | 403 (5.2%) |
| 35 to 39 Years | 444 (5.5%) | 525 (6.8%) |
| 40 to 44 Years | 497 (6.1%) | 322 (4.2%) |
| 45 to 49 Years | 436 (5.4%) | 447 (5.8%) |
| 50 to 54 Years | 521 (6.4%) | 467 (6.1%) |
| 55 to 59 Years | 589 (7.3%) | 552 (7.2%) |
| 60 to 64 Years | 663 (8.2%) | 699 (9.1%) |
| 65 to 69 Years | 581 (7.2%) | 509 (6.6%) |
| 70 to 74 Years | 401 (5.0%) | 406 (5.3%) |
| 75 to 79 Years | 220 (2.7%) | 326 (4.2%) |
| 80 to 84 Years | 164 (2.0%) | 202 (2.6%) |
| 85 Years and over | 178 (2.2%) | 158 (2.1%) |
| Total | 8,107 (100.0%) | 7,680 (100.0%) |
Families and Households in Osage County
Median Family Size in Osage County
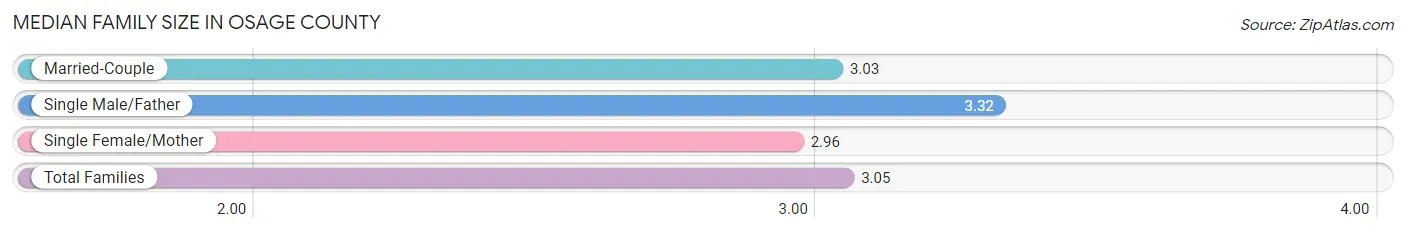
The median family size in Osage County is 3.05 persons per family, with single male/father families (332 | 8.1%) accounting for the largest median family size of 3.32 persons per family. On the other hand, single female/mother families (509 | 12.4%) represent the smallest median family size with 2.96 persons per family.
| Family Type | # Families | Family Size |
| Married-Couple | 3,248 (79.4%) | 3.03 |
| Single Male/Father | 332 (8.1%) | 3.32 |
| Single Female/Mother | 509 (12.4%) | 2.96 |
| Total Families | 4,089 (100.0%) | 3.05 |
Median Household Size in Osage County
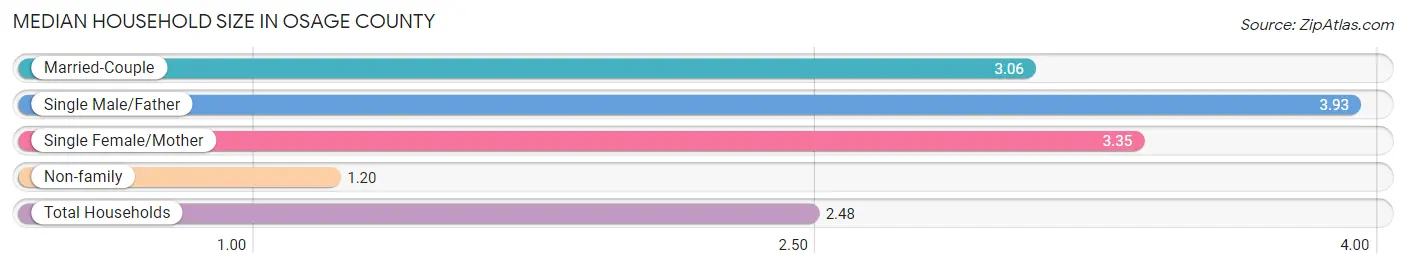
The median household size in Osage County is 2.48 persons per household, with single male/father households (332 | 5.3%) accounting for the largest median household size of 3.93 persons per household. non-family households (2,191 | 34.9%) represent the smallest median household size with 1.20 persons per household.
| Household Type | # Households | Household Size |
| Married-Couple | 3,248 (51.7%) | 3.06 |
| Single Male/Father | 332 (5.3%) | 3.93 |
| Single Female/Mother | 509 (8.1%) | 3.35 |
| Non-family | 2,191 (34.9%) | 1.20 |
| Total Households | 6,280 (100.0%) | 2.48 |
Household Size by Marriage Status in Osage County
Out of a total of 6,280 households in Osage County, 4,089 (65.1%) are family households, while 2,191 (34.9%) are nonfamily households. The most numerous type of family households are 2-person households, comprising 2,192, and the most common type of nonfamily households are 1-person households, comprising 1,880.
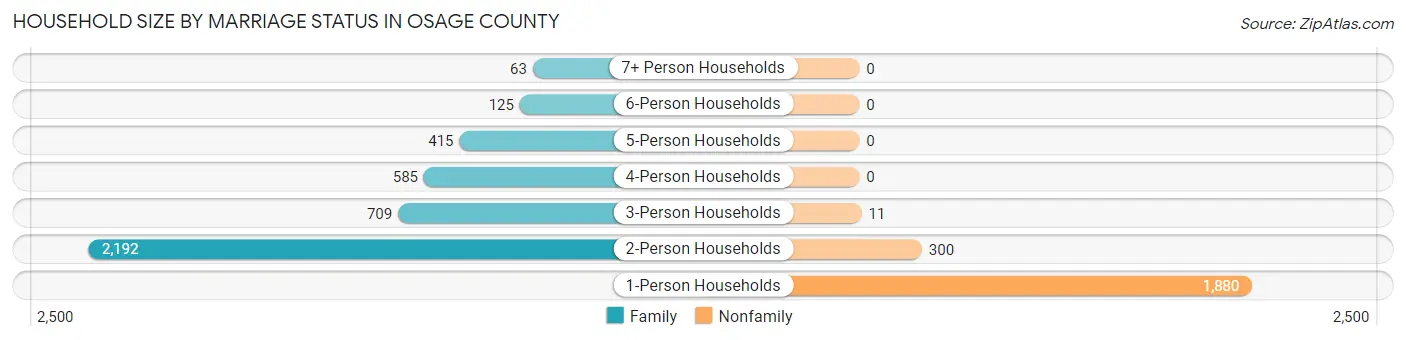
| Household Size | Family Households | Nonfamily Households |
| 1-Person Households | - | 1,880 (29.9%) |
| 2-Person Households | 2,192 (34.9%) | 300 (4.8%) |
| 3-Person Households | 709 (11.3%) | 11 (0.2%) |
| 4-Person Households | 585 (9.3%) | 0 (0.0%) |
| 5-Person Households | 415 (6.6%) | 0 (0.0%) |
| 6-Person Households | 125 (2.0%) | 0 (0.0%) |
| 7+ Person Households | 63 (1.0%) | 0 (0.0%) |
| Total | 4,089 (65.1%) | 2,191 (34.9%) |
Female Fertility in Osage County
Fertility by Age in Osage County
Average fertility rate in Osage County is 73.0 births per 1,000 women. Women in the age bracket of 20 to 34 years have the highest fertility rate with 152.0 births per 1,000 women. Women in the age bracket of 20 to 34 years acount for 80.5% of all women with births.
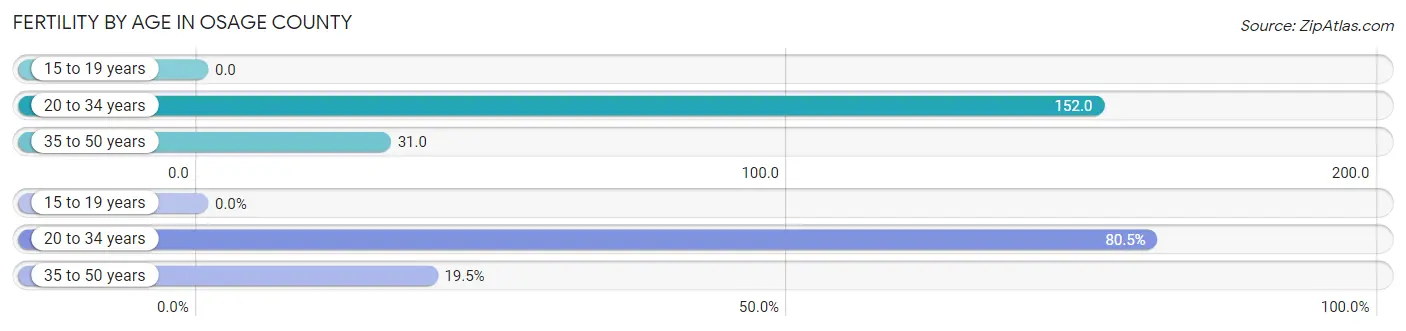
| Age Bracket | Women with Births | Births / 1,000 Women |
| 15 to 19 years | 0 (0.0%) | 0.0 |
| 20 to 34 years | 178 (80.5%) | 152.0 |
| 35 to 50 years | 43 (19.5%) | 31.0 |
| Total | 221 (100.0%) | 73.0 |
Fertility by Age by Marriage Status in Osage County
73.3% of women with births (221) in Osage County are married. The highest percentage of unmarried women with births falls into 20 to 34 years age bracket with 33.2% of them unmarried at the time of birth, while the lowest percentage of unmarried women with births belong to 35 to 50 years age bracket with 0.0% of them unmarried.
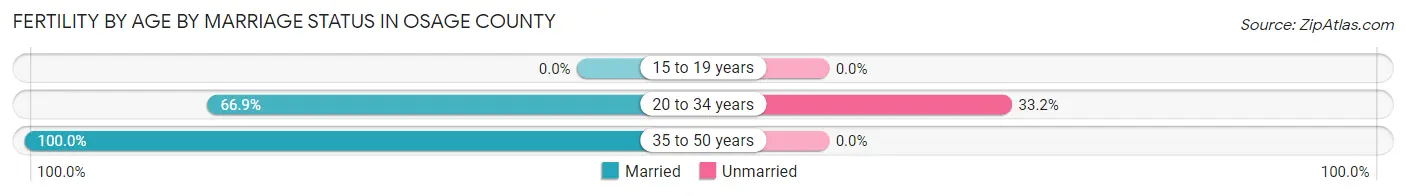
| Age Bracket | Married | Unmarried |
| 15 to 19 years | 0 (0.0%) | 0 (0.0%) |
| 20 to 34 years | 119 (66.8%) | 59 (33.2%) |
| 35 to 50 years | 43 (100.0%) | 0 (0.0%) |
| Total | 162 (73.3%) | 59 (26.7%) |
Fertility by Education in Osage County
Average fertility rate in Osage County is 73.0 births per 1,000 women. Women with the education attainment of bachelor's degree have the highest fertility rate of 132.0 births per 1,000 women, while women with the education attainment of less than high school have the lowest fertility at 29.0 births per 1,000 women. Women with the education attainment of high school diploma represent 31.7% of all women with births.
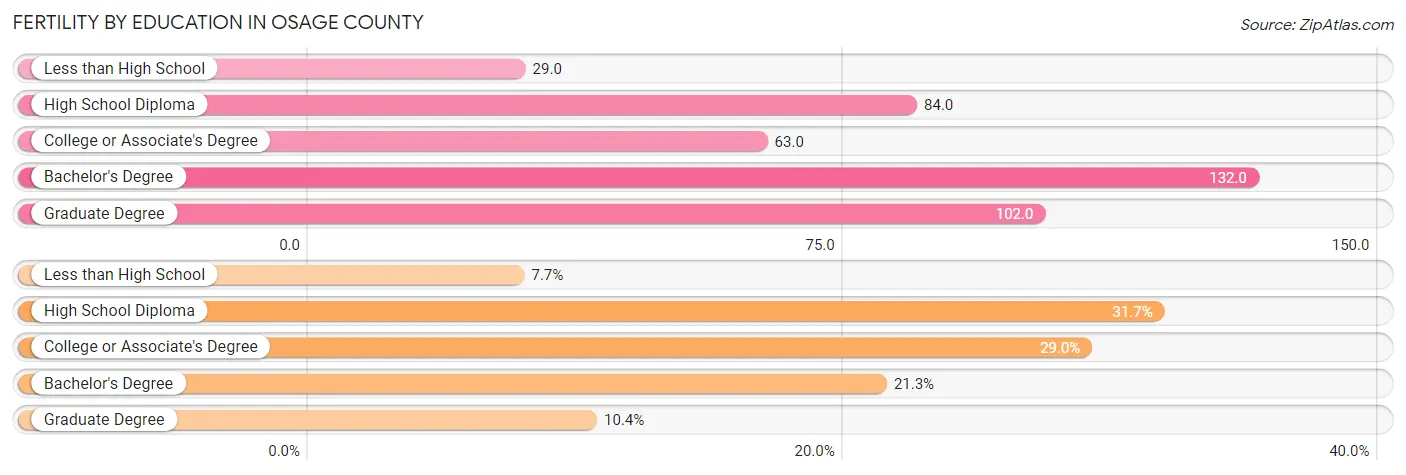
| Educational Attainment | Women with Births | Births / 1,000 Women |
| Less than High School | 17 (7.7%) | 29.0 |
| High School Diploma | 70 (31.7%) | 84.0 |
| College or Associate's Degree | 64 (29.0%) | 63.0 |
| Bachelor's Degree | 47 (21.3%) | 132.0 |
| Graduate Degree | 23 (10.4%) | 102.0 |
| Total | 221 (100.0%) | 73.0 |
Fertility by Education by Marriage Status in Osage County
26.7% of women with births in Osage County are unmarried. Women with the educational attainment of college or associate's degree are most likely to be married with 100.0% of them married at childbirth, while women with the educational attainment of high school diploma are least likely to be married with 60.0% of them unmarried at childbirth.
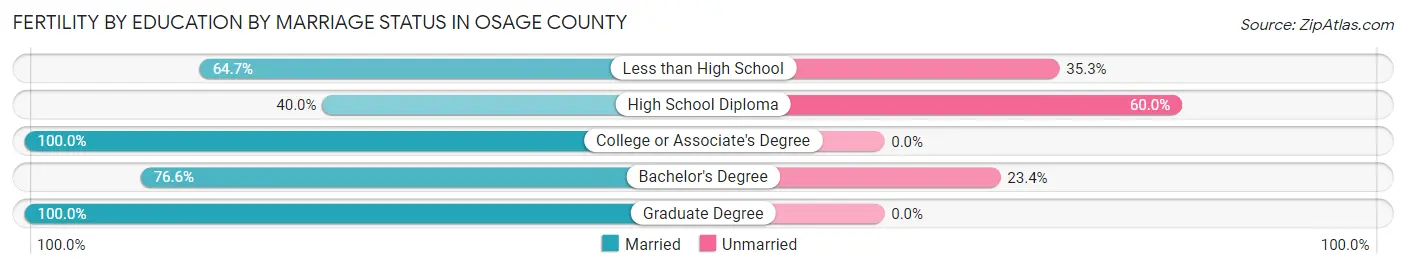
| Educational Attainment | Married | Unmarried |
| Less than High School | 11 (64.7%) | 6 (35.3%) |
| High School Diploma | 28 (40.0%) | 42 (60.0%) |
| College or Associate's Degree | 64 (100.0%) | 0 (0.0%) |
| Bachelor's Degree | 36 (76.6%) | 11 (23.4%) |
| Graduate Degree | 23 (100.0%) | 0 (0.0%) |
| Total | 162 (73.3%) | 59 (26.7%) |
Employment Characteristics in Osage County
Employment by Class of Employer in Osage County
Among the 7,325 employed individuals in Osage County, private company employees (4,616 | 63.0%), local government employees (688 | 9.4%), and not-for-profit organizations (581 | 7.9%) make up the most common classes of employment.

| Employer Class | # Employees | % Employees |
| Private Company Employees | 4,616 | 63.0% |
| Self-Employed (Incorporated) | 170 | 2.3% |
| Self-Employed (Not Incorporated) | 502 | 6.9% |
| Not-for-profit Organizations | 581 | 7.9% |
| Local Government Employees | 688 | 9.4% |
| State Government Employees | 504 | 6.9% |
| Federal Government Employees | 248 | 3.4% |
| Unpaid Family Workers | 16 | 0.2% |
| Total | 7,325 | 100.0% |
Employment Status by Age in Osage County
According to the labor force statistics for Osage County, out of the total population over 16 years of age (12,551), 62.1% or 7,794 individuals are in the labor force, with 3.4% or 265 of them unemployed. The age group with the highest labor force participation rate is 35 to 44 years, with 87.2% or 1,559 individuals in the labor force. Within the labor force, the 20 to 24 years age range has the highest percentage of unemployed individuals, with 12.8% or 91 of them being unemployed.
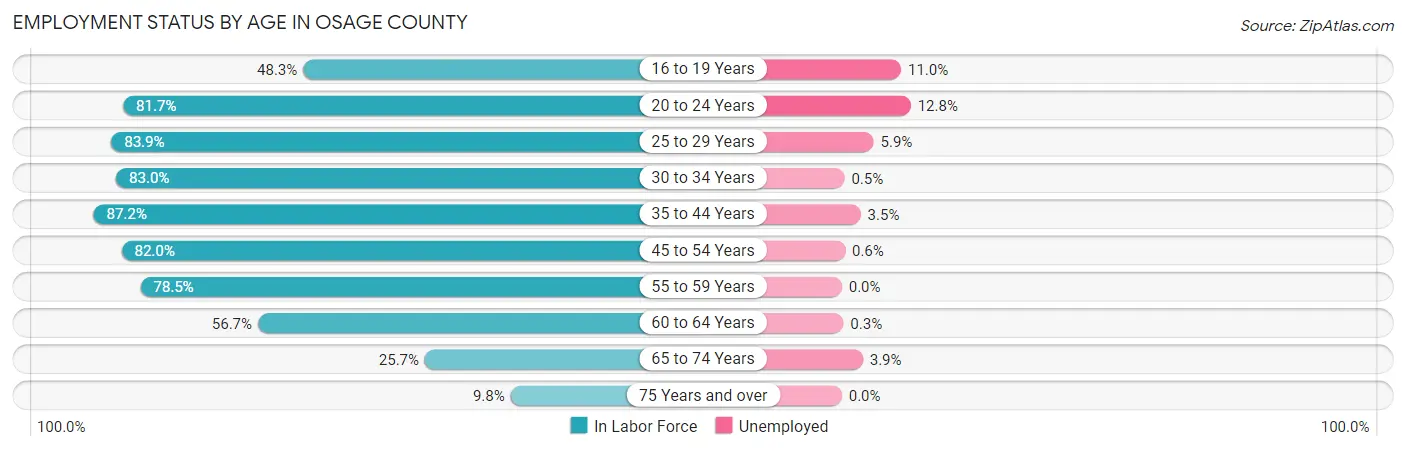
| Age Bracket | In Labor Force | Unemployed |
| 16 to 19 Years | 374 (48.3%) | 41 (11.0%) |
| 20 to 24 Years | 712 (81.7%) | 91 (12.8%) |
| 25 to 29 Years | 681 (83.9%) | 40 (5.9%) |
| 30 to 34 Years | 652 (83.0%) | 3 (0.5%) |
| 35 to 44 Years | 1,559 (87.2%) | 55 (3.5%) |
| 45 to 54 Years | 1,534 (82.0%) | 9 (0.6%) |
| 55 to 59 Years | 896 (78.5%) | 0 (0.0%) |
| 60 to 64 Years | 772 (56.7%) | 2 (0.3%) |
| 65 to 74 Years | 488 (25.7%) | 19 (3.9%) |
| 75 Years and over | 122 (9.8%) | 0 (0.0%) |
| Total | 7,794 (62.1%) | 265 (3.4%) |
Employment Status by Educational Attainment in Osage County
According to labor force statistics for Osage County, 78.6% of individuals (6,099) out of the total population between 25 and 64 years of age (7,760) are in the labor force, with 1.8% or 110 of them being unemployed. The group with the highest labor force participation rate are those with the educational attainment of bachelor's degree or higher, with 90.0% or 1,473 individuals in the labor force. Within the labor force, individuals with less than high school education have the highest percentage of unemployment, with 7.3% or 21 of them being unemployed.
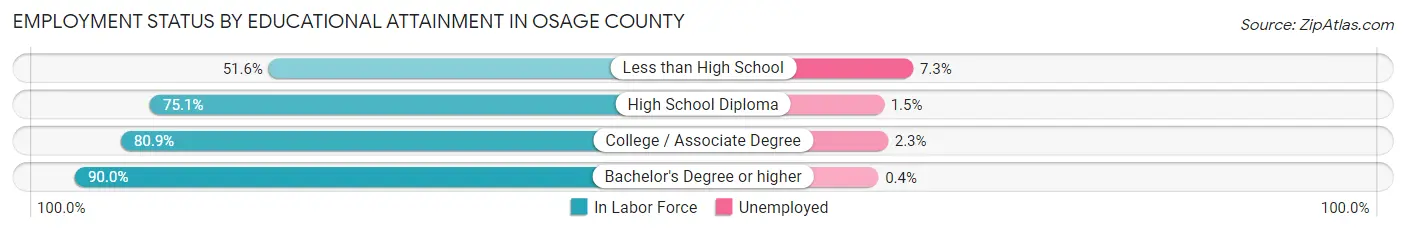
| Educational Attainment | In Labor Force | Unemployed |
| Less than High School | 288 (51.6%) | 41 (7.3%) |
| High School Diploma | 2,167 (75.1%) | 43 (1.5%) |
| College / Associate Degree | 2,168 (80.9%) | 62 (2.3%) |
| Bachelor's Degree or higher | 1,473 (90.0%) | 7 (0.4%) |
| Total | 6,099 (78.6%) | 140 (1.8%) |
Employment Occupations by Sex in Osage County
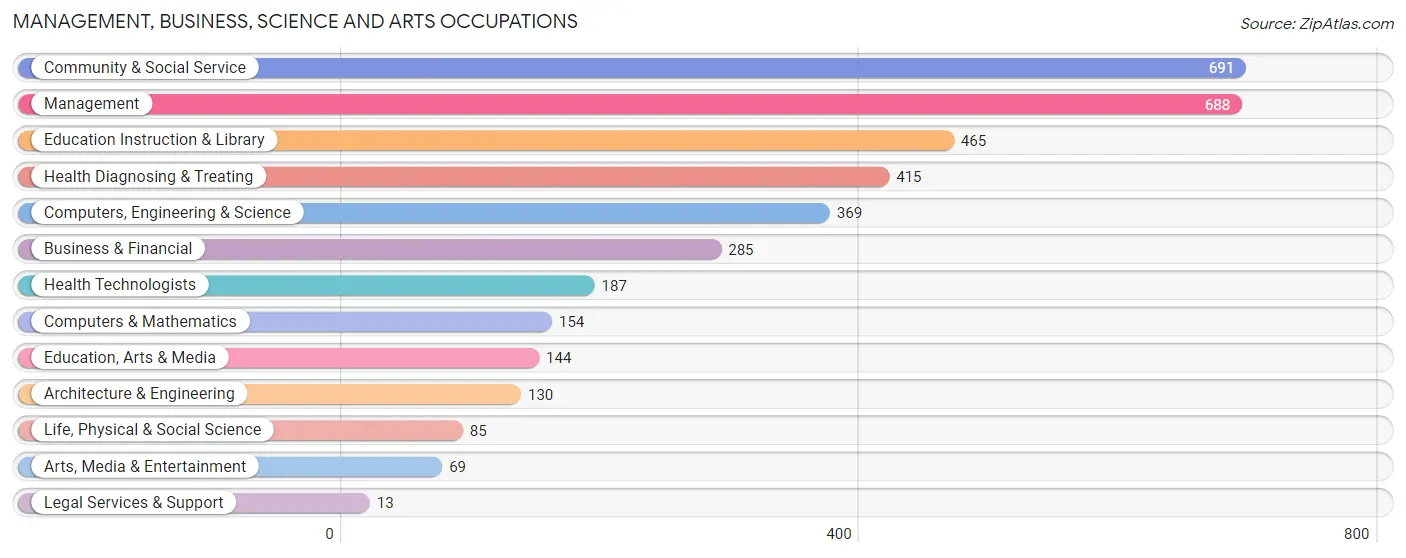
Management, Business, Science and Arts Occupations
The most common Management, Business, Science and Arts occupations in Osage County are Community & Social Service (691 | 9.2%), Management (688 | 9.2%), Education Instruction & Library (465 | 6.2%), Health Diagnosing & Treating (415 | 5.5%), and Computers, Engineering & Science (369 | 4.9%).
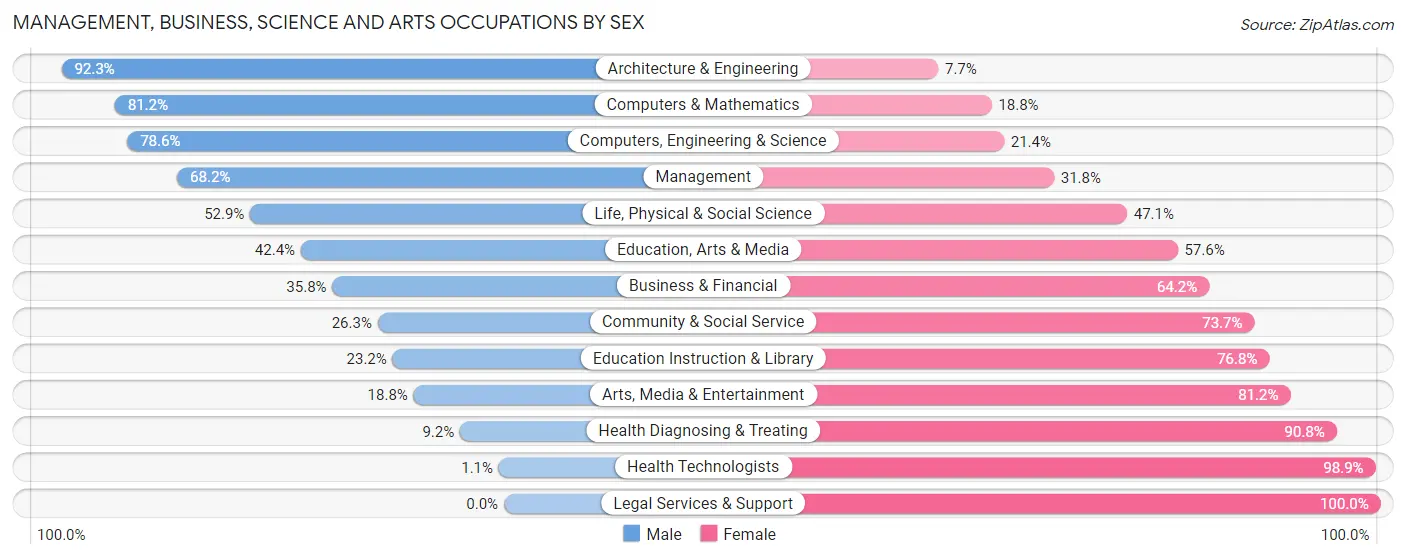
Management, Business, Science and Arts Occupations by Sex
Within the Management, Business, Science and Arts occupations in Osage County, the most male-oriented occupations are Architecture & Engineering (92.3%), Computers & Mathematics (81.2%), and Computers, Engineering & Science (78.6%), while the most female-oriented occupations are Legal Services & Support (100.0%), Health Technologists (98.9%), and Health Diagnosing & Treating (90.8%).
| Occupation | Male | Female |
| Management | 469 (68.2%) | 219 (31.8%) |
| Business & Financial | 102 (35.8%) | 183 (64.2%) |
| Computers, Engineering & Science | 290 (78.6%) | 79 (21.4%) |
| Computers & Mathematics | 125 (81.2%) | 29 (18.8%) |
| Architecture & Engineering | 120 (92.3%) | 10 (7.7%) |
| Life, Physical & Social Science | 45 (52.9%) | 40 (47.1%) |
| Community & Social Service | 182 (26.3%) | 509 (73.7%) |
| Education, Arts & Media | 61 (42.4%) | 83 (57.6%) |
| Legal Services & Support | 0 (0.0%) | 13 (100.0%) |
| Education Instruction & Library | 108 (23.2%) | 357 (76.8%) |
| Arts, Media & Entertainment | 13 (18.8%) | 56 (81.2%) |
| Health Diagnosing & Treating | 38 (9.2%) | 377 (90.8%) |
| Health Technologists | 2 (1.1%) | 185 (98.9%) |
| Total (Category) | 1,081 (44.2%) | 1,367 (55.8%) |
| Total (Overall) | 4,110 (54.8%) | 3,386 (45.2%) |
Services Occupations
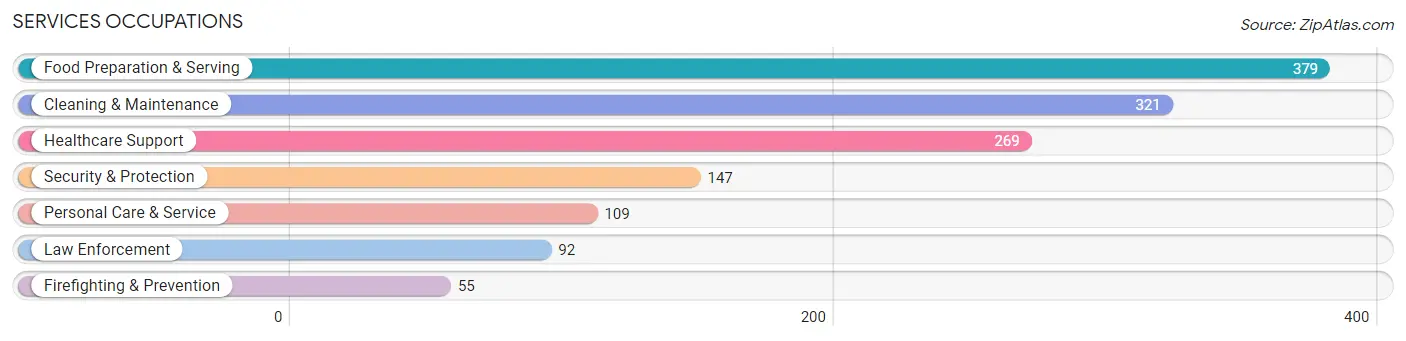
The most common Services occupations in Osage County are Food Preparation & Serving (379 | 5.1%), Cleaning & Maintenance (321 | 4.3%), Healthcare Support (269 | 3.6%), Security & Protection (147 | 2.0%), and Personal Care & Service (109 | 1.5%).
Services Occupations by Sex
Within the Services occupations in Osage County, the most male-oriented occupations are Cleaning & Maintenance (76.9%), Law Enforcement (75.0%), and Security & Protection (68.7%), while the most female-oriented occupations are Healthcare Support (90.7%), Personal Care & Service (89.0%), and Food Preparation & Serving (64.6%).
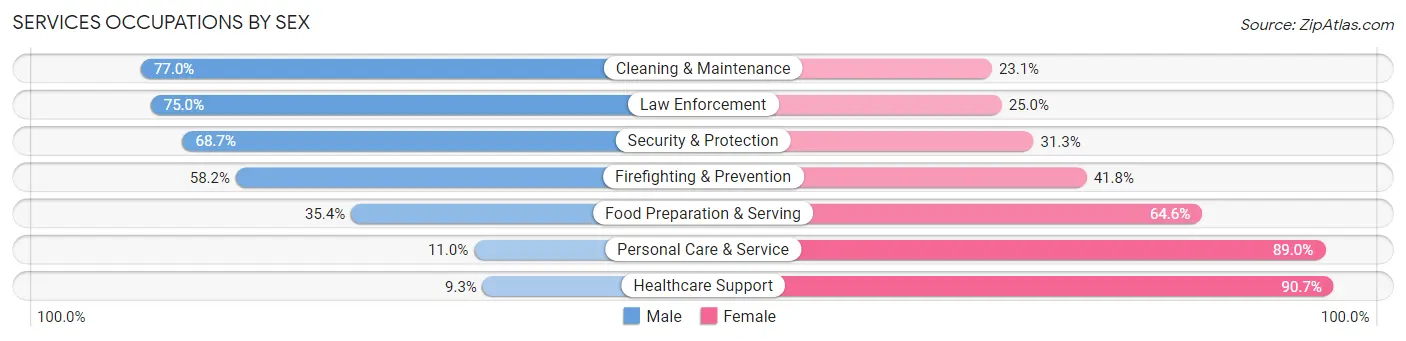
| Occupation | Male | Female |
| Healthcare Support | 25 (9.3%) | 244 (90.7%) |
| Security & Protection | 101 (68.7%) | 46 (31.3%) |
| Firefighting & Prevention | 32 (58.2%) | 23 (41.8%) |
| Law Enforcement | 69 (75.0%) | 23 (25.0%) |
| Food Preparation & Serving | 134 (35.4%) | 245 (64.6%) |
| Cleaning & Maintenance | 247 (76.9%) | 74 (23.1%) |
| Personal Care & Service | 12 (11.0%) | 97 (89.0%) |
| Total (Category) | 519 (42.4%) | 706 (57.6%) |
| Total (Overall) | 4,110 (54.8%) | 3,386 (45.2%) |
Sales and Office Occupations
The most common Sales and Office occupations in Osage County are Office & Administration (847 | 11.3%), and Sales & Related (471 | 6.3%).

Sales and Office Occupations by Sex

| Occupation | Male | Female |
| Sales & Related | 253 (53.7%) | 218 (46.3%) |
| Office & Administration | 96 (11.3%) | 751 (88.7%) |
| Total (Category) | 349 (26.5%) | 969 (73.5%) |
| Total (Overall) | 4,110 (54.8%) | 3,386 (45.2%) |
Natural Resources, Construction and Maintenance Occupations
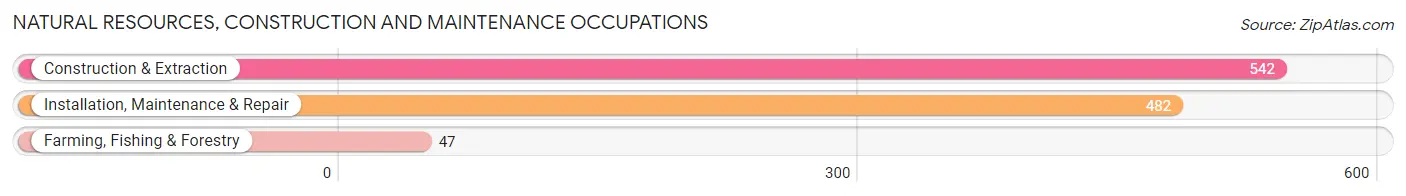
The most common Natural Resources, Construction and Maintenance occupations in Osage County are Construction & Extraction (542 | 7.2%), Installation, Maintenance & Repair (482 | 6.4%), and Farming, Fishing & Forestry (47 | 0.6%).
Natural Resources, Construction and Maintenance Occupations by Sex
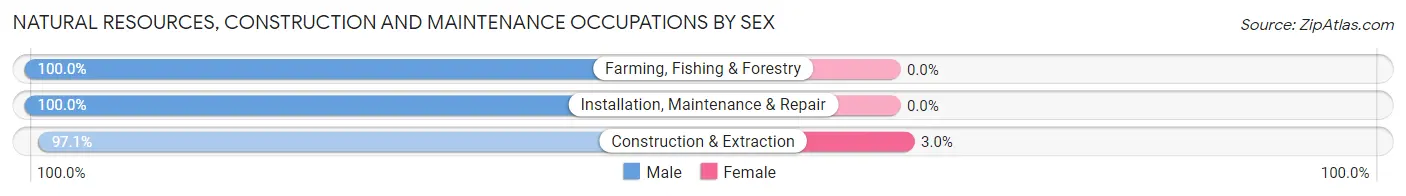
| Occupation | Male | Female |
| Farming, Fishing & Forestry | 47 (100.0%) | 0 (0.0%) |
| Construction & Extraction | 526 (97.1%) | 16 (2.9%) |
| Installation, Maintenance & Repair | 482 (100.0%) | 0 (0.0%) |
| Total (Category) | 1,055 (98.5%) | 16 (1.5%) |
| Total (Overall) | 4,110 (54.8%) | 3,386 (45.2%) |
Production, Transportation and Moving Occupations
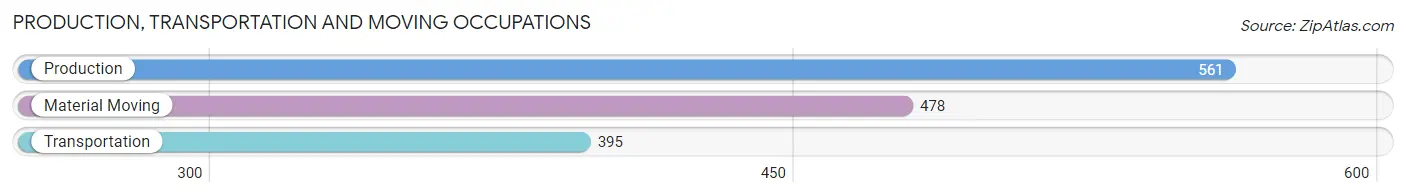
The most common Production, Transportation and Moving occupations in Osage County are Production (561 | 7.5%), Material Moving (478 | 6.4%), and Transportation (395 | 5.3%).
Production, Transportation and Moving Occupations by Sex
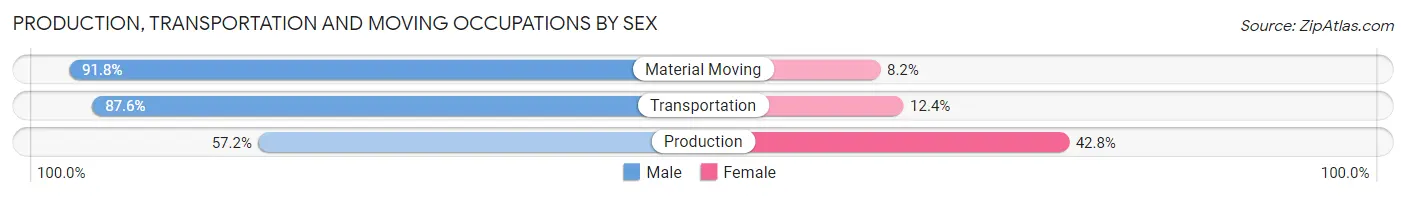
| Occupation | Male | Female |
| Production | 321 (57.2%) | 240 (42.8%) |
| Transportation | 346 (87.6%) | 49 (12.4%) |
| Material Moving | 439 (91.8%) | 39 (8.2%) |
| Total (Category) | 1,106 (77.1%) | 328 (22.9%) |
| Total (Overall) | 4,110 (54.8%) | 3,386 (45.2%) |
Employment Industries by Sex in Osage County
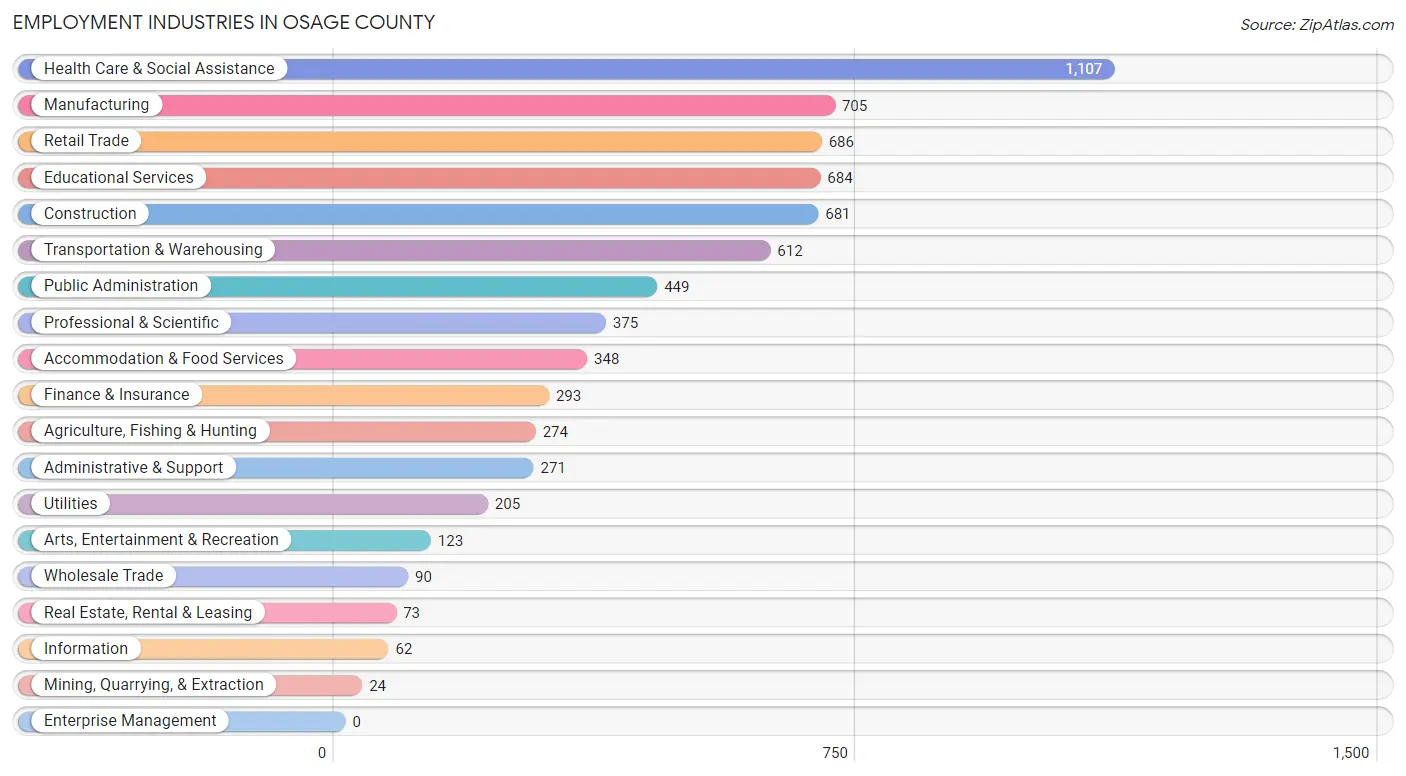
Employment Industries in Osage County
The major employment industries in Osage County include Health Care & Social Assistance (1,107 | 14.8%), Manufacturing (705 | 9.4%), Retail Trade (686 | 9.1%), Educational Services (684 | 9.1%), and Construction (681 | 9.1%).
Employment Industries by Sex in Osage County
The Osage County industries that see more men than women are Mining, Quarrying, & Extraction (100.0%), Wholesale Trade (93.3%), and Construction (92.7%), whereas the industries that tend to have a higher number of women are Health Care & Social Assistance (78.8%), Educational Services (76.2%), and Finance & Insurance (72.0%).
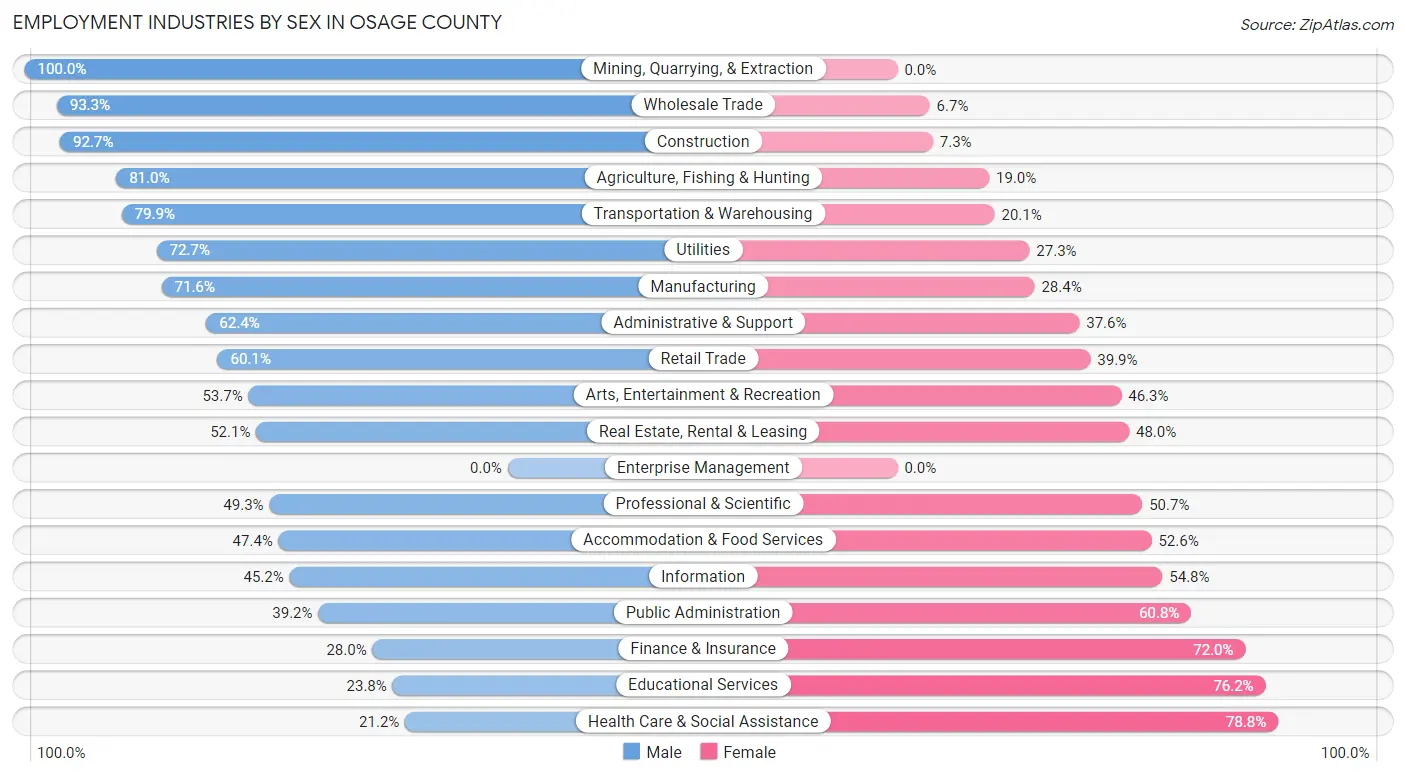
| Industry | Male | Female |
| Agriculture, Fishing & Hunting | 222 (81.0%) | 52 (19.0%) |
| Mining, Quarrying, & Extraction | 24 (100.0%) | 0 (0.0%) |
| Construction | 631 (92.7%) | 50 (7.3%) |
| Manufacturing | 505 (71.6%) | 200 (28.4%) |
| Wholesale Trade | 84 (93.3%) | 6 (6.7%) |
| Retail Trade | 412 (60.1%) | 274 (39.9%) |
| Transportation & Warehousing | 489 (79.9%) | 123 (20.1%) |
| Utilities | 149 (72.7%) | 56 (27.3%) |
| Information | 28 (45.2%) | 34 (54.8%) |
| Finance & Insurance | 82 (28.0%) | 211 (72.0%) |
| Real Estate, Rental & Leasing | 38 (52.0%) | 35 (47.9%) |
| Professional & Scientific | 185 (49.3%) | 190 (50.7%) |
| Enterprise Management | 0 (0.0%) | 0 (0.0%) |
| Administrative & Support | 169 (62.4%) | 102 (37.6%) |
| Educational Services | 163 (23.8%) | 521 (76.2%) |
| Health Care & Social Assistance | 235 (21.2%) | 872 (78.8%) |
| Arts, Entertainment & Recreation | 66 (53.7%) | 57 (46.3%) |
| Accommodation & Food Services | 165 (47.4%) | 183 (52.6%) |
| Public Administration | 176 (39.2%) | 273 (60.8%) |
| Total | 4,110 (54.8%) | 3,386 (45.2%) |
Education in Osage County
School Enrollment in Osage County
The most common levels of schooling among the 3,499 students in Osage County are high school (985 | 28.1%), middle school (846 | 24.2%), and elementary school (818 | 23.4%).
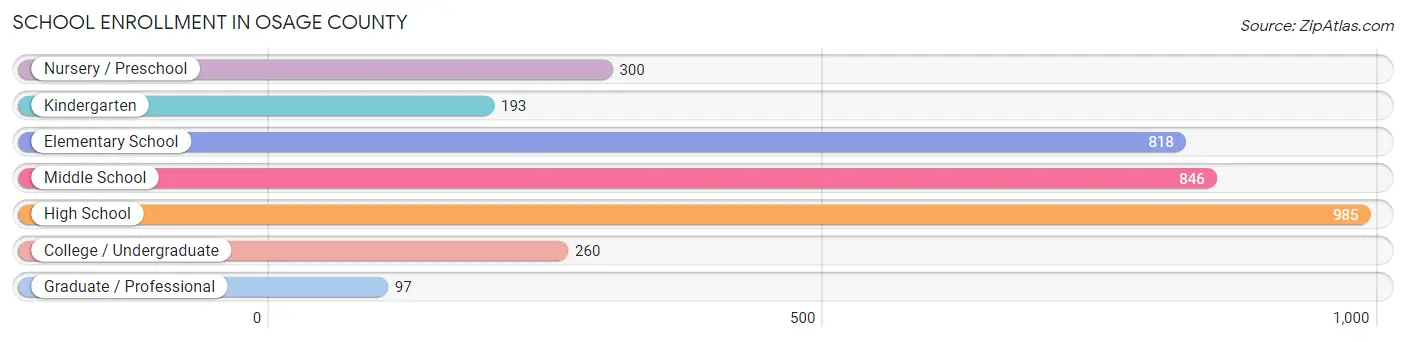
| School Level | # Students | % Students |
| Nursery / Preschool | 300 | 8.6% |
| Kindergarten | 193 | 5.5% |
| Elementary School | 818 | 23.4% |
| Middle School | 846 | 24.2% |
| High School | 985 | 28.1% |
| College / Undergraduate | 260 | 7.4% |
| Graduate / Professional | 97 | 2.8% |
| Total | 3,499 | 100.0% |
School Enrollment by Age by Funding Source in Osage County
Out of a total of 3,499 students who are enrolled in schools in Osage County, 182 (5.2%) attend a private institution, while the remaining 3,317 (94.8%) are enrolled in public schools. The age group of 35 years and over has the highest likelihood of being enrolled in private schools, with 31 (30.1% in the age bracket) enrolled. Conversely, the age group of 3 to 4 year olds has the lowest likelihood of being enrolled in a private school, with 210 (99.1% in the age bracket) attending a public institution.
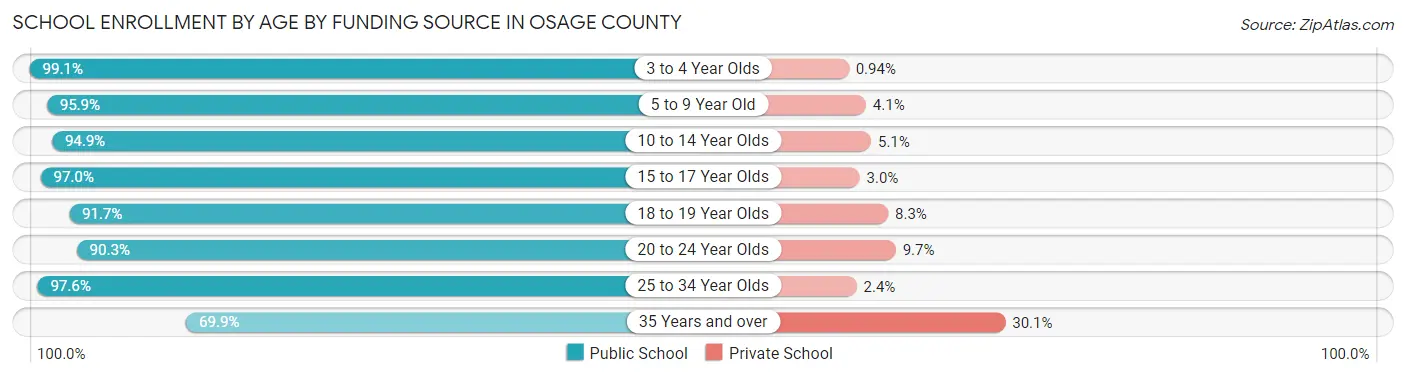
| Age Bracket | Public School | Private School |
| 3 to 4 Year Olds | 210 (99.1%) | 2 (0.9%) |
| 5 to 9 Year Old | 996 (95.9%) | 43 (4.1%) |
| 10 to 14 Year Olds | 968 (94.9%) | 52 (5.1%) |
| 15 to 17 Year Olds | 687 (97.0%) | 21 (3.0%) |
| 18 to 19 Year Olds | 155 (91.7%) | 14 (8.3%) |
| 20 to 24 Year Olds | 149 (90.3%) | 16 (9.7%) |
| 25 to 34 Year Olds | 81 (97.6%) | 2 (2.4%) |
| 35 Years and over | 72 (69.9%) | 31 (30.1%) |
| Total | 3,317 (94.8%) | 182 (5.2%) |
Educational Attainment by Field of Study in Osage County
Education (508 | 21.8%), business (442 | 19.0%), bio, nature & agricultural (259 | 11.1%), science & technology (220 | 9.5%), and psychology (171 | 7.3%) are the most common fields of study among 2,326 individuals in Osage County who have obtained a bachelor's degree or higher.
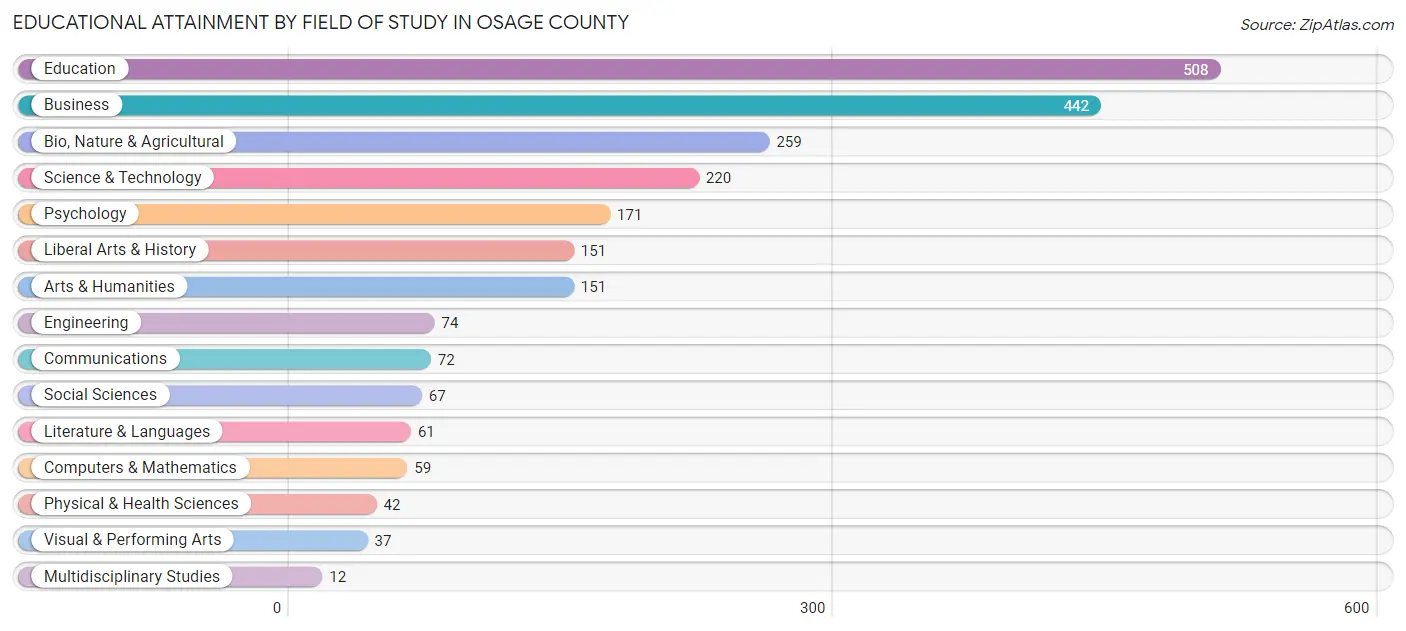
| Field of Study | # Graduates | % Graduates |
| Computers & Mathematics | 59 | 2.5% |
| Bio, Nature & Agricultural | 259 | 11.1% |
| Physical & Health Sciences | 42 | 1.8% |
| Psychology | 171 | 7.3% |
| Social Sciences | 67 | 2.9% |
| Engineering | 74 | 3.2% |
| Multidisciplinary Studies | 12 | 0.5% |
| Science & Technology | 220 | 9.5% |
| Business | 442 | 19.0% |
| Education | 508 | 21.8% |
| Literature & Languages | 61 | 2.6% |
| Liberal Arts & History | 151 | 6.5% |
| Visual & Performing Arts | 37 | 1.6% |
| Communications | 72 | 3.1% |
| Arts & Humanities | 151 | 6.5% |
| Total | 2,326 | 100.0% |
Transportation & Commute in Osage County
Vehicle Availability by Sex in Osage County
The most prevalent vehicle ownership categories in Osage County are males with 2 vehicles (1,453, accounting for 35.8%) and females with 2 vehicles (1,061, making up 44.7%).
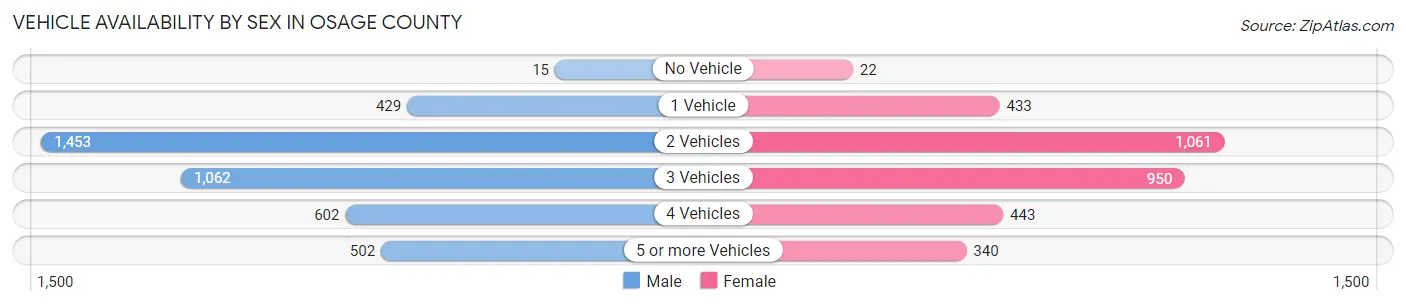
| Vehicles Available | Male | Female |
| No Vehicle | 15 (0.4%) | 22 (0.7%) |
| 1 Vehicle | 429 (10.6%) | 433 (13.3%) |
| 2 Vehicles | 1,453 (35.8%) | 1,061 (32.7%) |
| 3 Vehicles | 1,062 (26.1%) | 950 (29.2%) |
| 4 Vehicles | 602 (14.8%) | 443 (13.6%) |
| 5 or more Vehicles | 502 (12.4%) | 340 (10.5%) |
| Total | 4,063 (100.0%) | 3,249 (100.0%) |
Commute Time in Osage County
The most frequently occuring commute durations in Osage County are 30 to 34 minutes (785 commuters, 11.5%), 45 to 59 minutes (695 commuters, 10.2%), and 5 to 9 minutes (688 commuters, 10.1%).
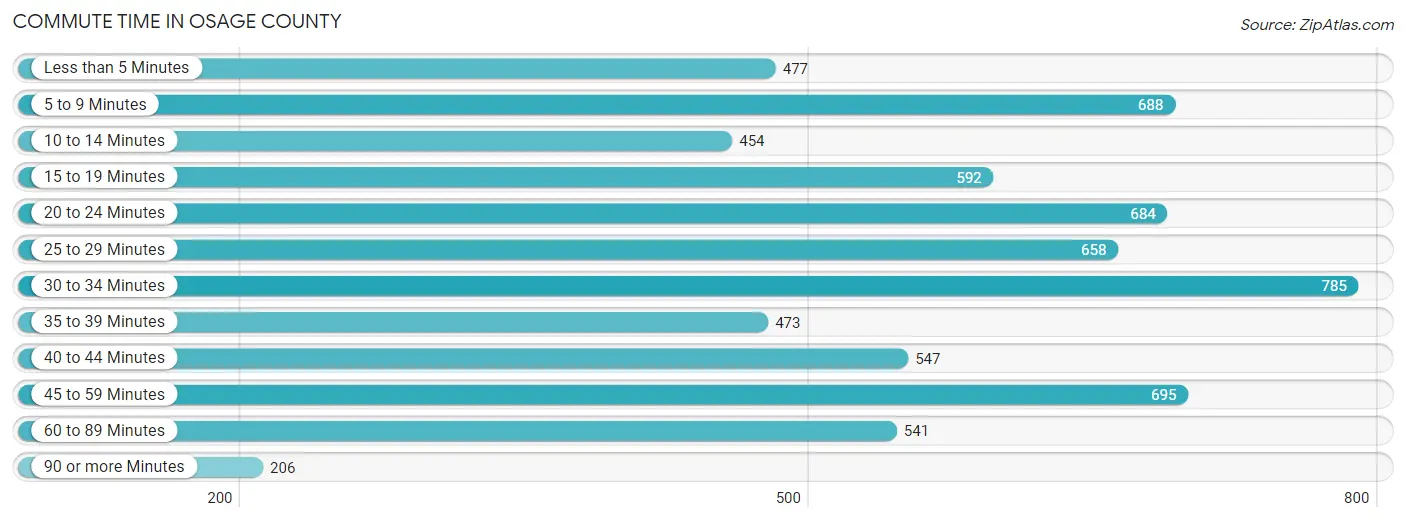
| Commute Time | # Commuters | % Commuters |
| Less than 5 Minutes | 477 | 7.0% |
| 5 to 9 Minutes | 688 | 10.1% |
| 10 to 14 Minutes | 454 | 6.7% |
| 15 to 19 Minutes | 592 | 8.7% |
| 20 to 24 Minutes | 684 | 10.1% |
| 25 to 29 Minutes | 658 | 9.7% |
| 30 to 34 Minutes | 785 | 11.5% |
| 35 to 39 Minutes | 473 | 7.0% |
| 40 to 44 Minutes | 547 | 8.0% |
| 45 to 59 Minutes | 695 | 10.2% |
| 60 to 89 Minutes | 541 | 8.0% |
| 90 or more Minutes | 206 | 3.0% |
Commute Time by Sex in Osage County
The most common commute times in Osage County are 20 to 24 minutes (427 commuters, 11.1%) for males and 30 to 34 minutes (391 commuters, 13.3%) for females.
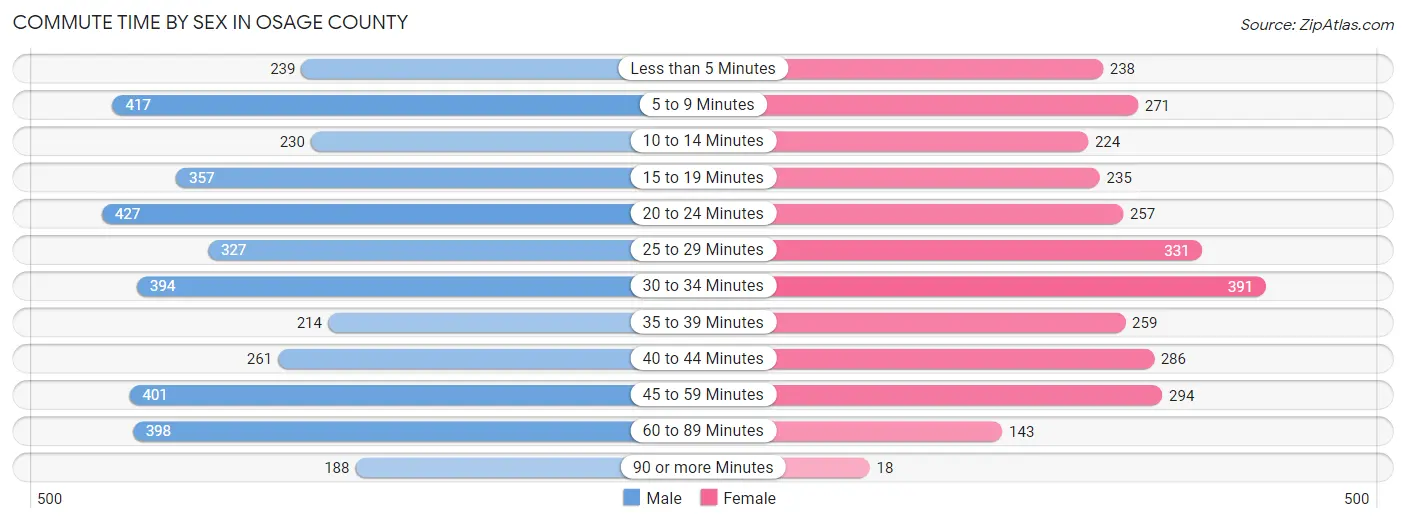
| Commute Time | Male | Female |
| Less than 5 Minutes | 239 (6.2%) | 238 (8.1%) |
| 5 to 9 Minutes | 417 (10.8%) | 271 (9.2%) |
| 10 to 14 Minutes | 230 (6.0%) | 224 (7.6%) |
| 15 to 19 Minutes | 357 (9.3%) | 235 (8.0%) |
| 20 to 24 Minutes | 427 (11.1%) | 257 (8.7%) |
| 25 to 29 Minutes | 327 (8.5%) | 331 (11.2%) |
| 30 to 34 Minutes | 394 (10.2%) | 391 (13.3%) |
| 35 to 39 Minutes | 214 (5.6%) | 259 (8.8%) |
| 40 to 44 Minutes | 261 (6.8%) | 286 (9.7%) |
| 45 to 59 Minutes | 401 (10.4%) | 294 (10.0%) |
| 60 to 89 Minutes | 398 (10.3%) | 143 (4.9%) |
| 90 or more Minutes | 188 (4.9%) | 18 (0.6%) |
Time of Departure to Work by Sex in Osage County
The most frequent times of departure to work in Osage County are 7:00 AM to 7:29 AM (656, 17.0%) for males and 7:00 AM to 7:29 AM (620, 21.0%) for females.
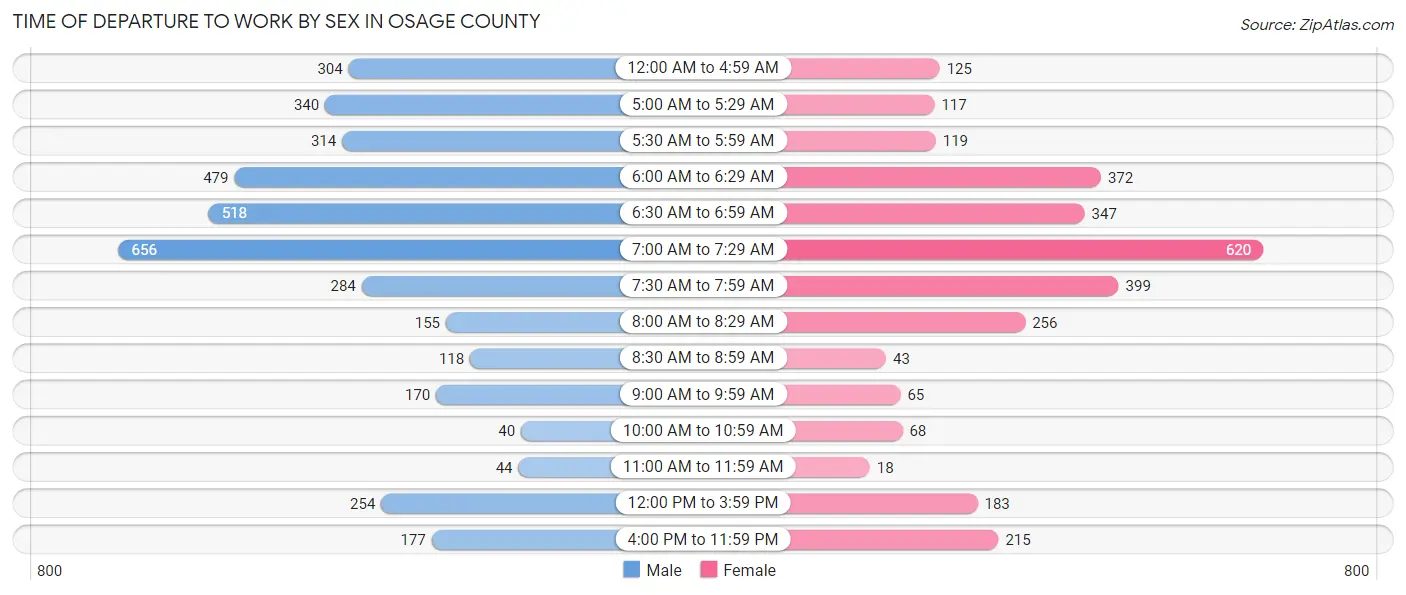
| Time of Departure | Male | Female |
| 12:00 AM to 4:59 AM | 304 (7.9%) | 125 (4.2%) |
| 5:00 AM to 5:29 AM | 340 (8.8%) | 117 (4.0%) |
| 5:30 AM to 5:59 AM | 314 (8.2%) | 119 (4.0%) |
| 6:00 AM to 6:29 AM | 479 (12.4%) | 372 (12.6%) |
| 6:30 AM to 6:59 AM | 518 (13.4%) | 347 (11.8%) |
| 7:00 AM to 7:29 AM | 656 (17.0%) | 620 (21.0%) |
| 7:30 AM to 7:59 AM | 284 (7.4%) | 399 (13.5%) |
| 8:00 AM to 8:29 AM | 155 (4.0%) | 256 (8.7%) |
| 8:30 AM to 8:59 AM | 118 (3.1%) | 43 (1.5%) |
| 9:00 AM to 9:59 AM | 170 (4.4%) | 65 (2.2%) |
| 10:00 AM to 10:59 AM | 40 (1.0%) | 68 (2.3%) |
| 11:00 AM to 11:59 AM | 44 (1.1%) | 18 (0.6%) |
| 12:00 PM to 3:59 PM | 254 (6.6%) | 183 (6.2%) |
| 4:00 PM to 11:59 PM | 177 (4.6%) | 215 (7.3%) |
| Total | 3,853 (100.0%) | 2,947 (100.0%) |
Housing Occupancy in Osage County
Occupancy by Ownership in Osage County
Of the total 6,280 dwellings in Osage County, owner-occupied units account for 4,932 (78.5%), while renter-occupied units make up 1,348 (21.5%).
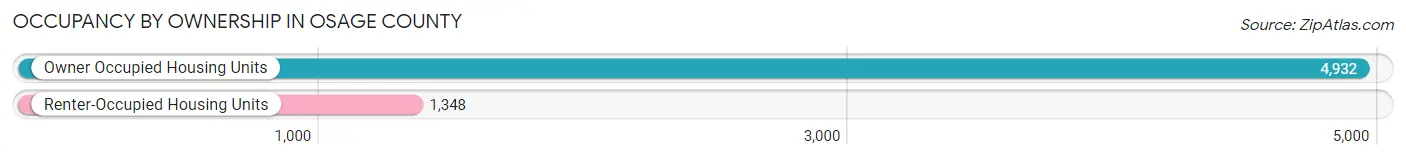
| Occupancy | # Housing Units | % Housing Units |
| Owner Occupied Housing Units | 4,932 | 78.5% |
| Renter-Occupied Housing Units | 1,348 | 21.5% |
| Total Occupied Housing Units | 6,280 | 100.0% |
Occupancy by Household Size in Osage County
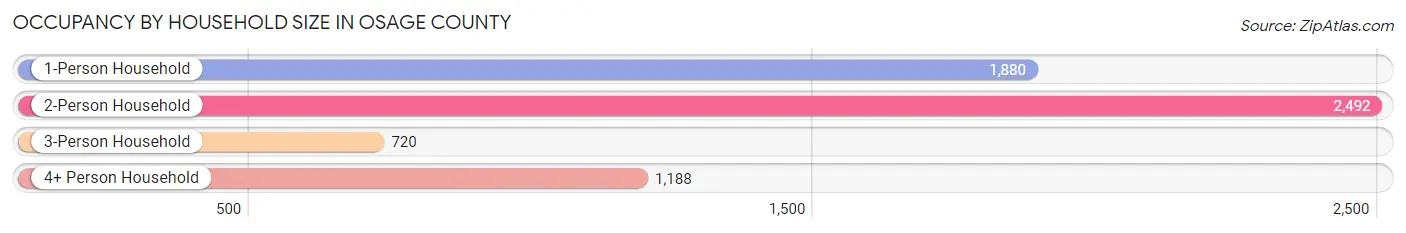
| Household Size | # Housing Units | % Housing Units |
| 1-Person Household | 1,880 | 29.9% |
| 2-Person Household | 2,492 | 39.7% |
| 3-Person Household | 720 | 11.5% |
| 4+ Person Household | 1,188 | 18.9% |
| Total Housing Units | 6,280 | 100.0% |
Occupancy by Ownership by Household Size in Osage County
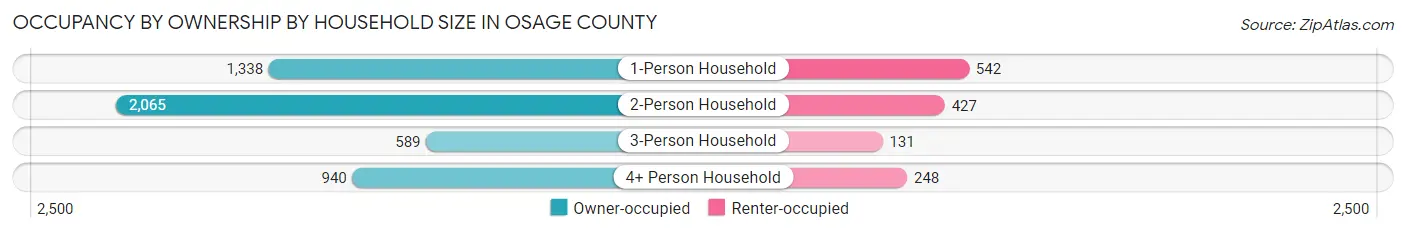
| Household Size | Owner-occupied | Renter-occupied |
| 1-Person Household | 1,338 (71.2%) | 542 (28.8%) |
| 2-Person Household | 2,065 (82.9%) | 427 (17.1%) |
| 3-Person Household | 589 (81.8%) | 131 (18.2%) |
| 4+ Person Household | 940 (79.1%) | 248 (20.9%) |
| Total Housing Units | 4,932 (78.5%) | 1,348 (21.5%) |
Occupancy by Educational Attainment in Osage County
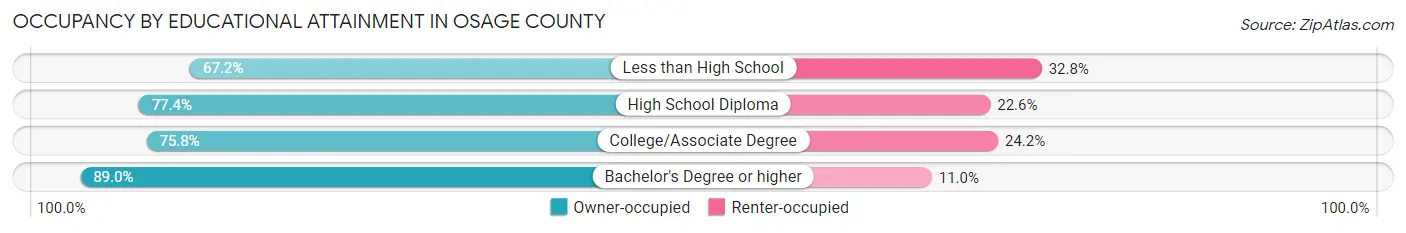
| Household Size | Owner-occupied | Renter-occupied |
| Less than High School | 262 (67.2%) | 128 (32.8%) |
| High School Diploma | 1,843 (77.4%) | 539 (22.6%) |
| College/Associate Degree | 1,698 (75.8%) | 541 (24.2%) |
| Bachelor's Degree or higher | 1,129 (89.0%) | 140 (11.0%) |
Occupancy by Age of Householder in Osage County
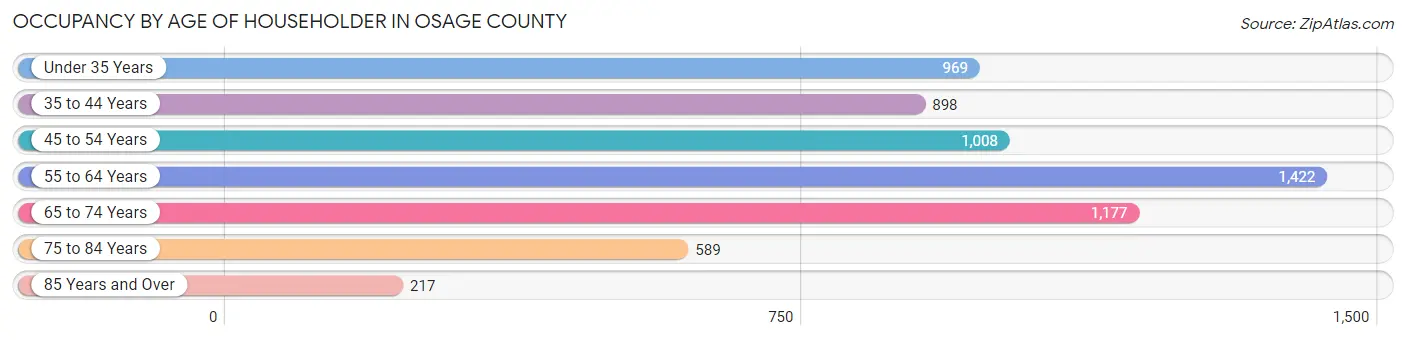
| Age Bracket | # Households | % Households |
| Under 35 Years | 969 | 15.4% |
| 35 to 44 Years | 898 | 14.3% |
| 45 to 54 Years | 1,008 | 16.1% |
| 55 to 64 Years | 1,422 | 22.6% |
| 65 to 74 Years | 1,177 | 18.7% |
| 75 to 84 Years | 589 | 9.4% |
| 85 Years and Over | 217 | 3.5% |
| Total | 6,280 | 100.0% |
Housing Finances in Osage County
Median Income by Occupancy in Osage County
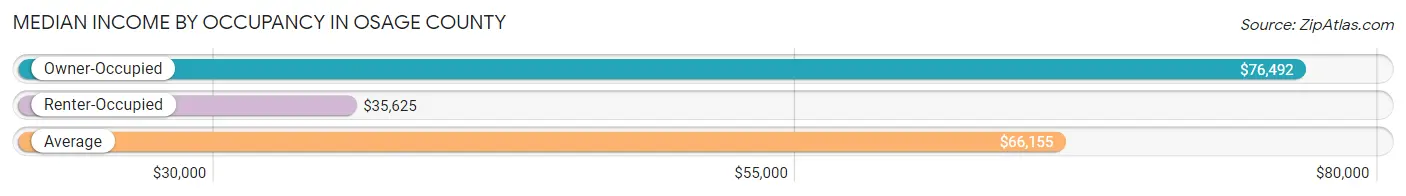
| Occupancy Type | # Households | Median Income |
| Owner-Occupied | 4,932 (78.5%) | $76,492 |
| Renter-Occupied | 1,348 (21.5%) | $35,625 |
| Average | 6,280 (100.0%) | $66,155 |
Occupancy by Householder Income Bracket in Osage County
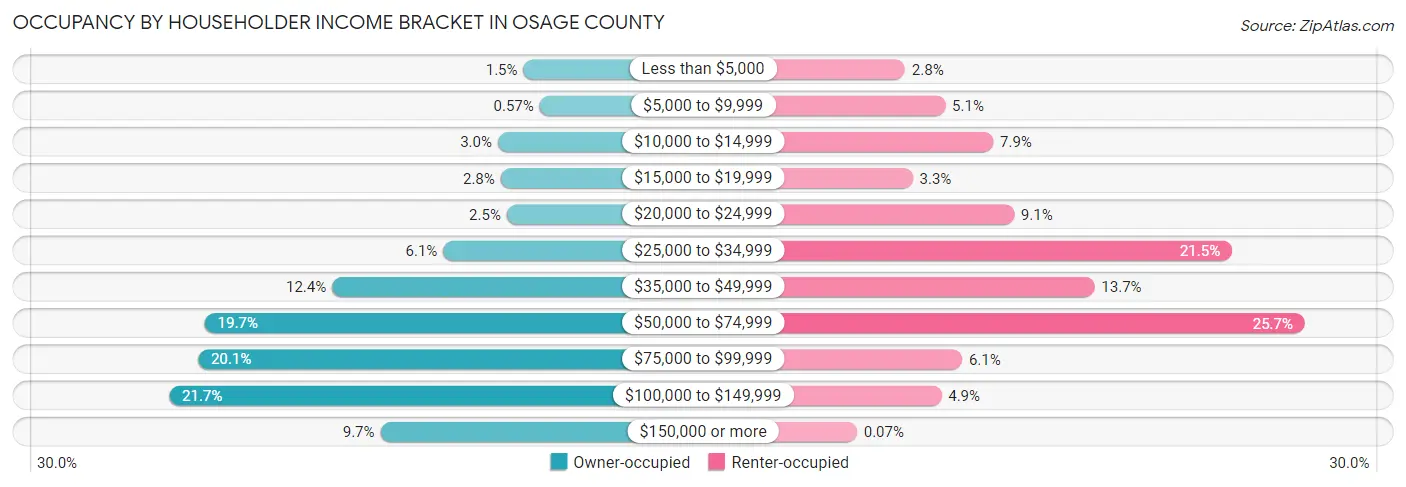
| Income Bracket | Owner-occupied | Renter-occupied |
| Less than $5,000 | 74 (1.5%) | 38 (2.8%) |
| $5,000 to $9,999 | 28 (0.6%) | 69 (5.1%) |
| $10,000 to $14,999 | 146 (3.0%) | 106 (7.9%) |
| $15,000 to $19,999 | 138 (2.8%) | 44 (3.3%) |
| $20,000 to $24,999 | 121 (2.5%) | 122 (9.0%) |
| $25,000 to $34,999 | 300 (6.1%) | 290 (21.5%) |
| $35,000 to $49,999 | 613 (12.4%) | 184 (13.7%) |
| $50,000 to $74,999 | 972 (19.7%) | 346 (25.7%) |
| $75,000 to $99,999 | 991 (20.1%) | 82 (6.1%) |
| $100,000 to $149,999 | 1,072 (21.7%) | 66 (4.9%) |
| $150,000 or more | 477 (9.7%) | 1 (0.1%) |
| Total | 4,932 (100.0%) | 1,348 (100.0%) |
Monthly Housing Cost Tiers in Osage County
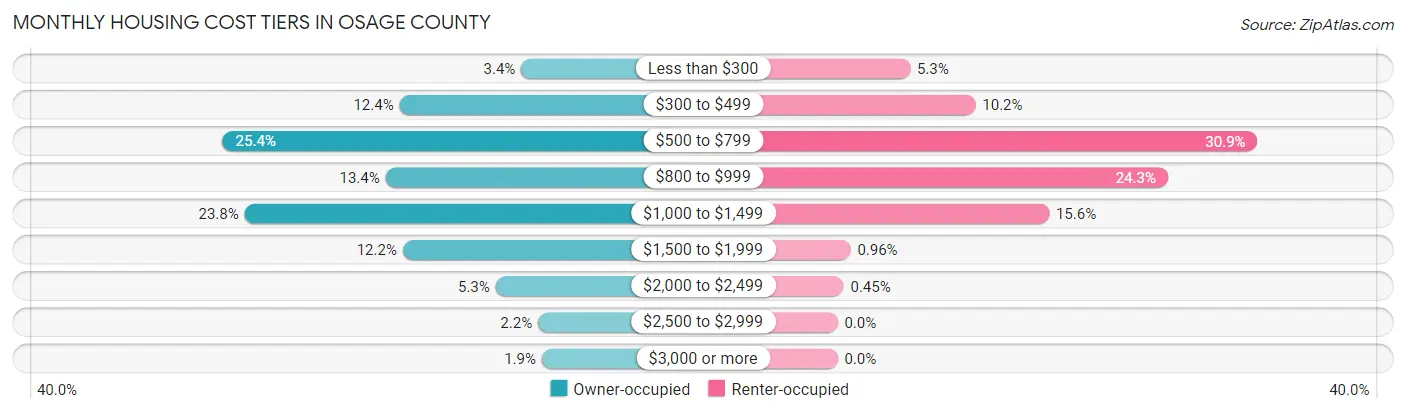
| Monthly Cost | Owner-occupied | Renter-occupied |
| Less than $300 | 169 (3.4%) | 72 (5.3%) |
| $300 to $499 | 611 (12.4%) | 137 (10.2%) |
| $500 to $799 | 1,253 (25.4%) | 417 (30.9%) |
| $800 to $999 | 662 (13.4%) | 328 (24.3%) |
| $1,000 to $1,499 | 1,174 (23.8%) | 210 (15.6%) |
| $1,500 to $1,999 | 599 (12.1%) | 13 (1.0%) |
| $2,000 to $2,499 | 262 (5.3%) | 6 (0.4%) |
| $2,500 to $2,999 | 108 (2.2%) | 0 (0.0%) |
| $3,000 or more | 94 (1.9%) | 0 (0.0%) |
| Total | 4,932 (100.0%) | 1,348 (100.0%) |
Physical Housing Characteristics in Osage County
Housing Structures in Osage County
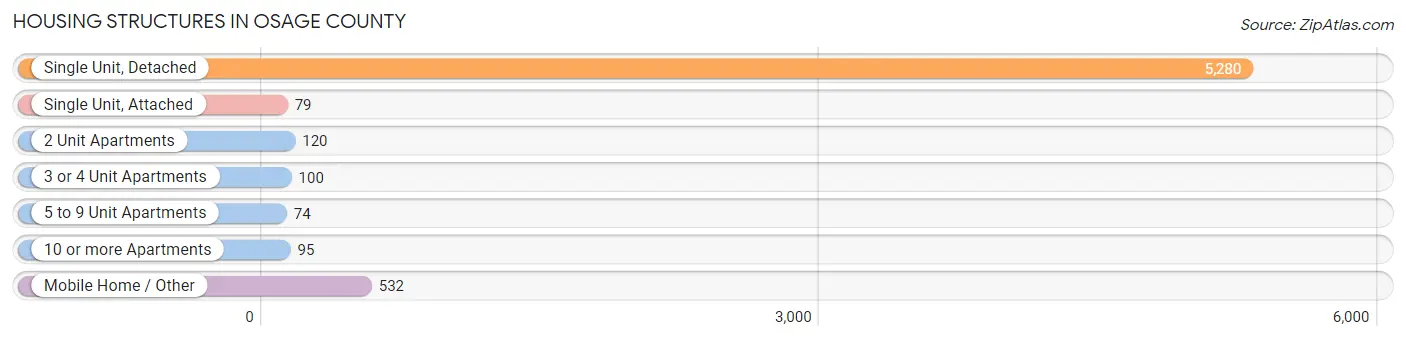
| Structure Type | # Housing Units | % Housing Units |
| Single Unit, Detached | 5,280 | 84.1% |
| Single Unit, Attached | 79 | 1.3% |
| 2 Unit Apartments | 120 | 1.9% |
| 3 or 4 Unit Apartments | 100 | 1.6% |
| 5 to 9 Unit Apartments | 74 | 1.2% |
| 10 or more Apartments | 95 | 1.5% |
| Mobile Home / Other | 532 | 8.5% |
| Total | 6,280 | 100.0% |
Housing Structures by Occupancy in Osage County
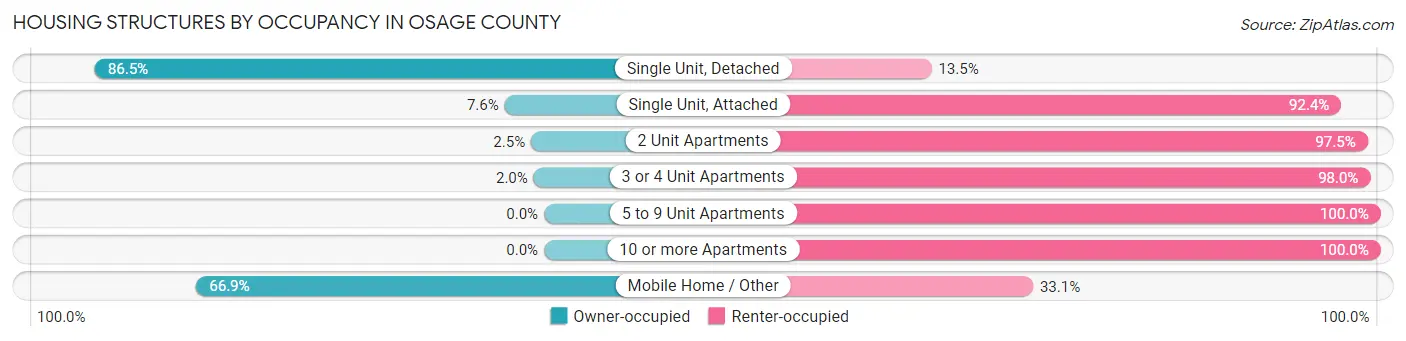
| Structure Type | Owner-occupied | Renter-occupied |
| Single Unit, Detached | 4,565 (86.5%) | 715 (13.5%) |
| Single Unit, Attached | 6 (7.6%) | 73 (92.4%) |
| 2 Unit Apartments | 3 (2.5%) | 117 (97.5%) |
| 3 or 4 Unit Apartments | 2 (2.0%) | 98 (98.0%) |
| 5 to 9 Unit Apartments | 0 (0.0%) | 74 (100.0%) |
| 10 or more Apartments | 0 (0.0%) | 95 (100.0%) |
| Mobile Home / Other | 356 (66.9%) | 176 (33.1%) |
| Total | 4,932 (78.5%) | 1,348 (21.5%) |
Housing Structures by Number of Rooms in Osage County
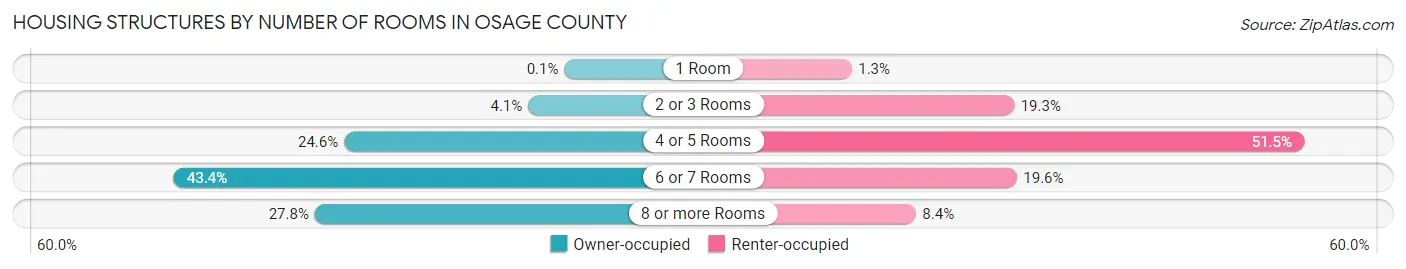
| Number of Rooms | Owner-occupied | Renter-occupied |
| 1 Room | 5 (0.1%) | 17 (1.3%) |
| 2 or 3 Rooms | 203 (4.1%) | 260 (19.3%) |
| 4 or 5 Rooms | 1,211 (24.5%) | 694 (51.5%) |
| 6 or 7 Rooms | 2,142 (43.4%) | 264 (19.6%) |
| 8 or more Rooms | 1,371 (27.8%) | 113 (8.4%) |
| Total | 4,932 (100.0%) | 1,348 (100.0%) |
Housing Structure by Heating Type in Osage County
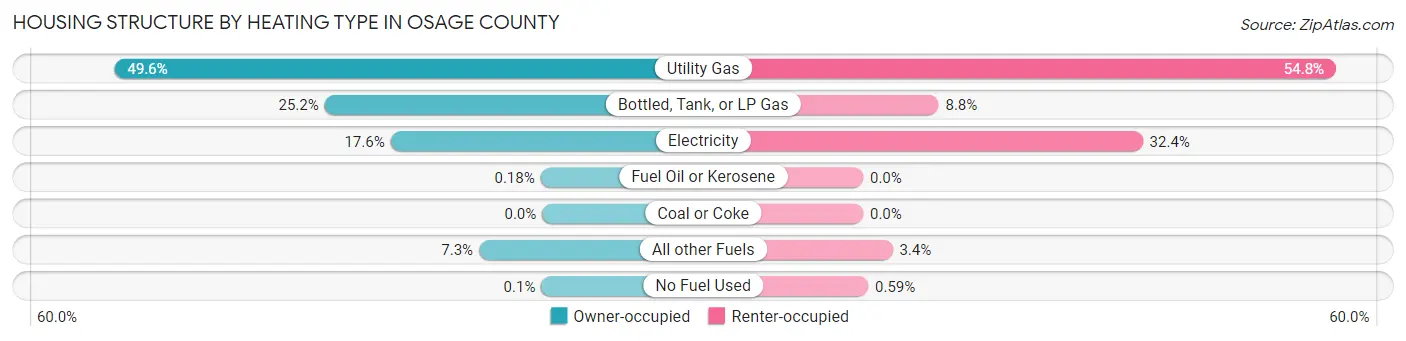
| Heating Type | Owner-occupied | Renter-occupied |
| Utility Gas | 2,446 (49.6%) | 739 (54.8%) |
| Bottled, Tank, or LP Gas | 1,244 (25.2%) | 118 (8.7%) |
| Electricity | 867 (17.6%) | 437 (32.4%) |
| Fuel Oil or Kerosene | 9 (0.2%) | 0 (0.0%) |
| Coal or Coke | 0 (0.0%) | 0 (0.0%) |
| All other Fuels | 361 (7.3%) | 46 (3.4%) |
| No Fuel Used | 5 (0.1%) | 8 (0.6%) |
| Total | 4,932 (100.0%) | 1,348 (100.0%) |
Household Vehicle Usage in Osage County
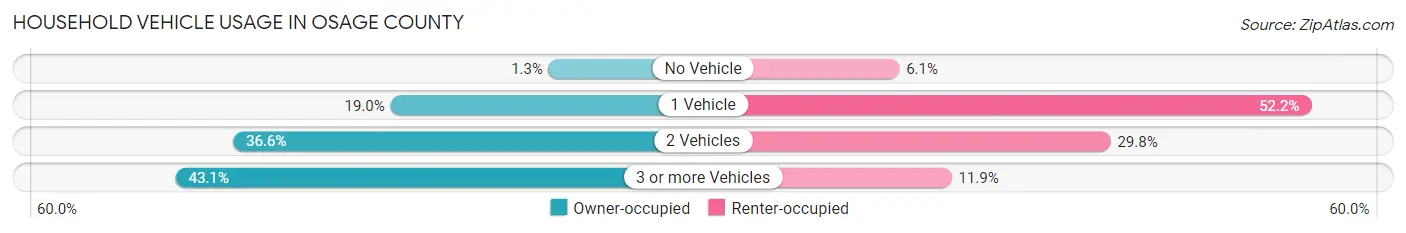
| Vehicles per Household | Owner-occupied | Renter-occupied |
| No Vehicle | 63 (1.3%) | 82 (6.1%) |
| 1 Vehicle | 937 (19.0%) | 704 (52.2%) |
| 2 Vehicles | 1,807 (36.6%) | 401 (29.7%) |
| 3 or more Vehicles | 2,125 (43.1%) | 161 (11.9%) |
| Total | 4,932 (100.0%) | 1,348 (100.0%) |
Real Estate & Mortgages in Osage County
Real Estate and Mortgage Overview in Osage County
| Characteristic | Without Mortgage | With Mortgage |
| Housing Units | 2,241 | 2,691 |
| Median Property Value | $127,200 | $146,000 |
| Median Household Income | $65,696 | $293 |
| Monthly Housing Costs | $575 | $77 |
| Real Estate Taxes | $2,160 | $13 |
Property Value by Mortgage Status in Osage County
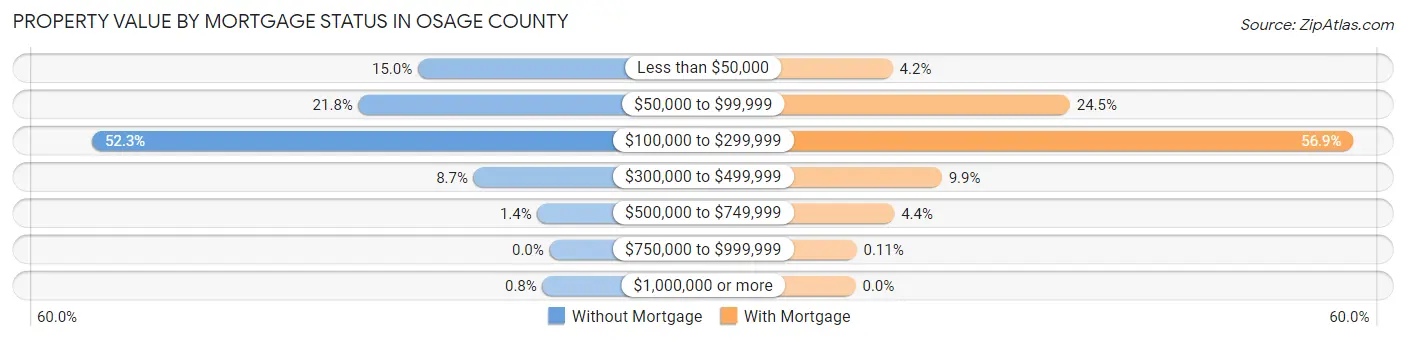
| Property Value | Without Mortgage | With Mortgage |
| Less than $50,000 | 337 (15.0%) | 114 (4.2%) |
| $50,000 to $99,999 | 489 (21.8%) | 659 (24.5%) |
| $100,000 to $299,999 | 1,172 (52.3%) | 1,531 (56.9%) |
| $300,000 to $499,999 | 194 (8.7%) | 265 (9.9%) |
| $500,000 to $749,999 | 31 (1.4%) | 119 (4.4%) |
| $750,000 to $999,999 | 0 (0.0%) | 3 (0.1%) |
| $1,000,000 or more | 18 (0.8%) | 0 (0.0%) |
| Total | 2,241 (100.0%) | 2,691 (100.0%) |
Household Income by Mortgage Status in Osage County
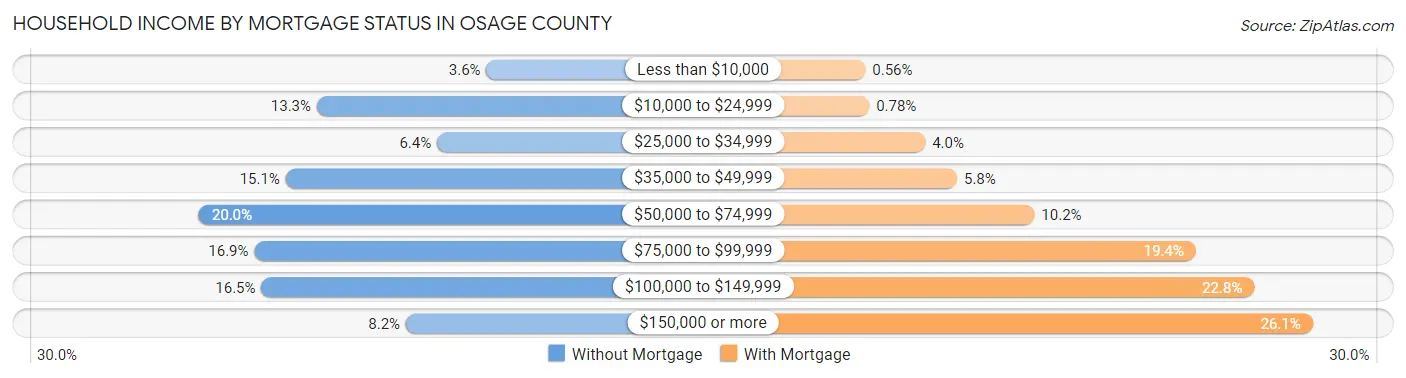
| Household Income | Without Mortgage | With Mortgage |
| Less than $10,000 | 81 (3.6%) | 15 (0.6%) |
| $10,000 to $24,999 | 298 (13.3%) | 21 (0.8%) |
| $25,000 to $34,999 | 144 (6.4%) | 107 (4.0%) |
| $35,000 to $49,999 | 338 (15.1%) | 156 (5.8%) |
| $50,000 to $74,999 | 449 (20.0%) | 275 (10.2%) |
| $75,000 to $99,999 | 378 (16.9%) | 523 (19.4%) |
| $100,000 to $149,999 | 369 (16.5%) | 613 (22.8%) |
| $150,000 or more | 184 (8.2%) | 703 (26.1%) |
| Total | 2,241 (100.0%) | 2,691 (100.0%) |
Property Value to Household Income Ratio in Osage County
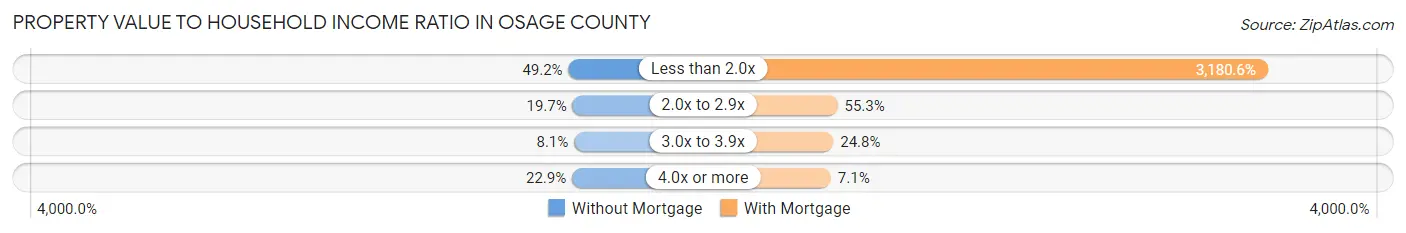
| Value-to-Income Ratio | Without Mortgage | With Mortgage |
| Less than 2.0x | 1,102 (49.2%) | 85,590 (3,180.6%) |
| 2.0x to 2.9x | 442 (19.7%) | 1,487 (55.3%) |
| 3.0x to 3.9x | 182 (8.1%) | 666 (24.7%) |
| 4.0x or more | 512 (22.9%) | 192 (7.1%) |
| Total | 2,241 (100.0%) | 2,691 (100.0%) |
Real Estate Taxes by Mortgage Status in Osage County
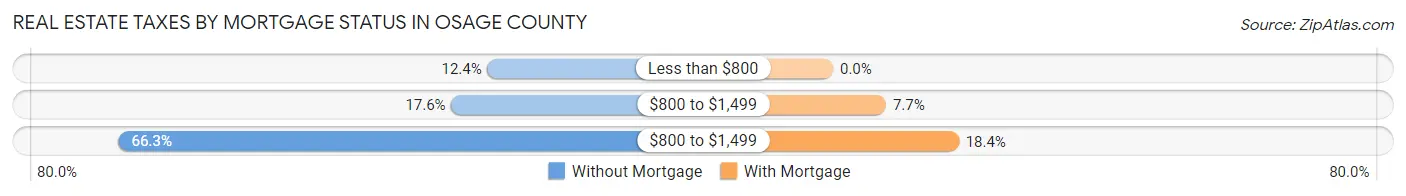
| Property Taxes | Without Mortgage | With Mortgage |
| Less than $800 | 277 (12.4%) | 0 (0.0%) |
| $800 to $1,499 | 395 (17.6%) | 208 (7.7%) |
| $800 to $1,499 | 1,485 (66.3%) | 494 (18.4%) |
| Total | 2,241 (100.0%) | 2,691 (100.0%) |
Health & Disability in Osage County
Health Insurance Coverage by Age in Osage County
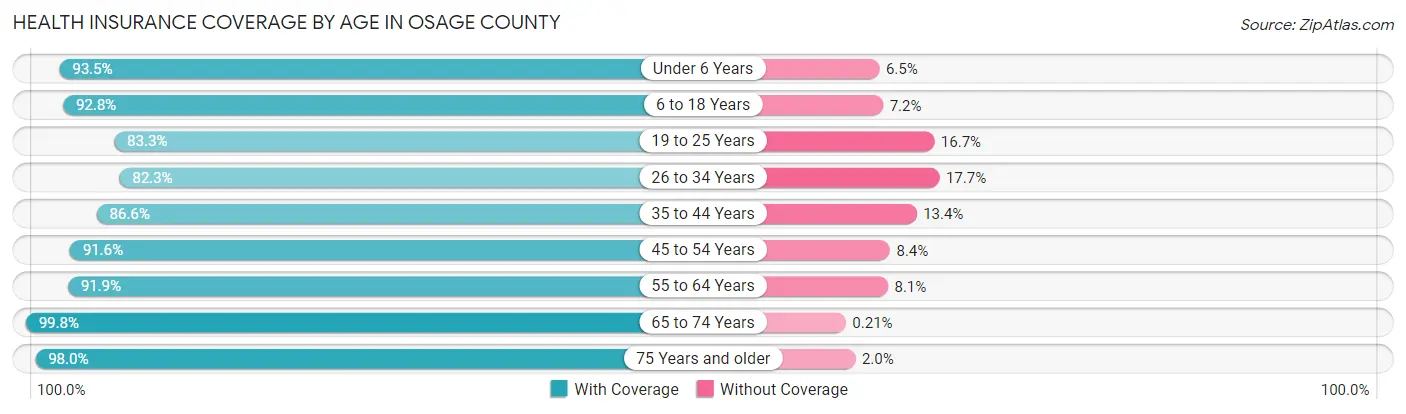
| Age Bracket | With Coverage | Without Coverage |
| Under 6 Years | 939 (93.5%) | 65 (6.5%) |
| 6 to 18 Years | 2,684 (92.8%) | 207 (7.2%) |
| 19 to 25 Years | 937 (83.3%) | 188 (16.7%) |
| 26 to 34 Years | 1,189 (82.3%) | 255 (17.7%) |
| 35 to 44 Years | 1,530 (86.6%) | 237 (13.4%) |
| 45 to 54 Years | 1,692 (91.6%) | 156 (8.4%) |
| 55 to 64 Years | 2,292 (91.9%) | 201 (8.1%) |
| 65 to 74 Years | 1,859 (99.8%) | 4 (0.2%) |
| 75 Years and older | 1,131 (98.0%) | 23 (2.0%) |
| Total | 14,253 (91.4%) | 1,336 (8.6%) |
Health Insurance Coverage by Citizenship Status in Osage County
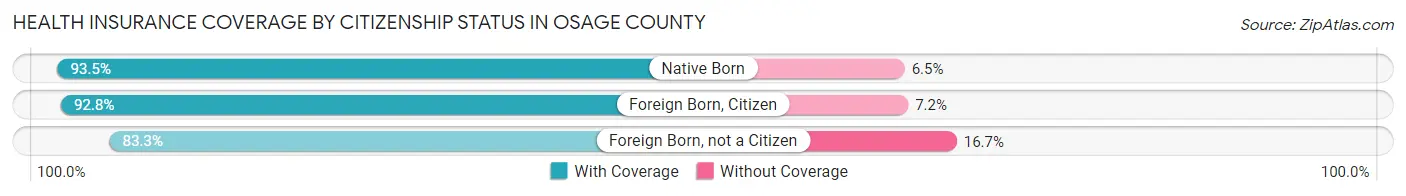
| Citizenship Status | With Coverage | Without Coverage |
| Native Born | 939 (93.5%) | 65 (6.5%) |
| Foreign Born, Citizen | 2,684 (92.8%) | 207 (7.2%) |
| Foreign Born, not a Citizen | 937 (83.3%) | 188 (16.7%) |
Health Insurance Coverage by Household Income in Osage County
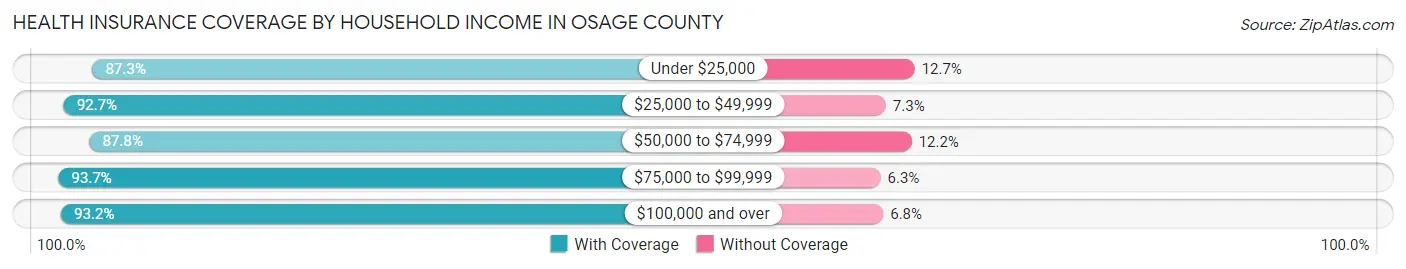
| Household Income | With Coverage | Without Coverage |
| Under $25,000 | 1,345 (87.3%) | 196 (12.7%) |
| $25,000 to $49,999 | 2,416 (92.7%) | 191 (7.3%) |
| $50,000 to $74,999 | 2,948 (87.8%) | 408 (12.2%) |
| $75,000 to $99,999 | 2,734 (93.7%) | 185 (6.3%) |
| $100,000 and over | 4,779 (93.2%) | 351 (6.8%) |
Public vs Private Health Insurance Coverage by Age in Osage County
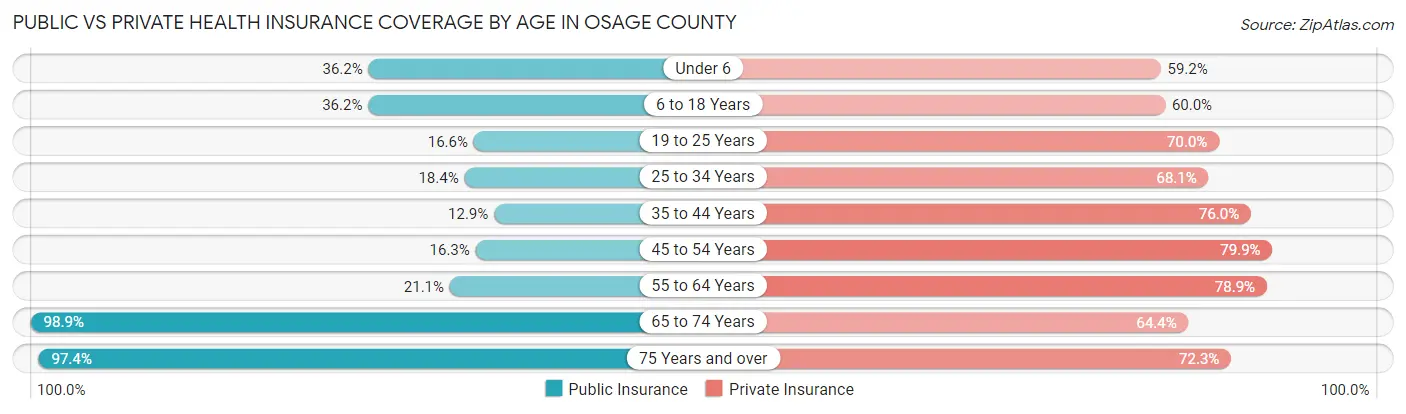
| Age Bracket | Public Insurance | Private Insurance |
| Under 6 | 363 (36.2%) | 594 (59.2%) |
| 6 to 18 Years | 1,047 (36.2%) | 1,734 (60.0%) |
| 19 to 25 Years | 187 (16.6%) | 788 (70.0%) |
| 25 to 34 Years | 265 (18.3%) | 983 (68.1%) |
| 35 to 44 Years | 227 (12.9%) | 1,342 (75.9%) |
| 45 to 54 Years | 301 (16.3%) | 1,477 (79.9%) |
| 55 to 64 Years | 525 (21.1%) | 1,967 (78.9%) |
| 65 to 74 Years | 1,842 (98.9%) | 1,199 (64.4%) |
| 75 Years and over | 1,124 (97.4%) | 834 (72.3%) |
| Total | 5,881 (37.7%) | 10,918 (70.0%) |
Disability Status by Sex by Age in Osage County
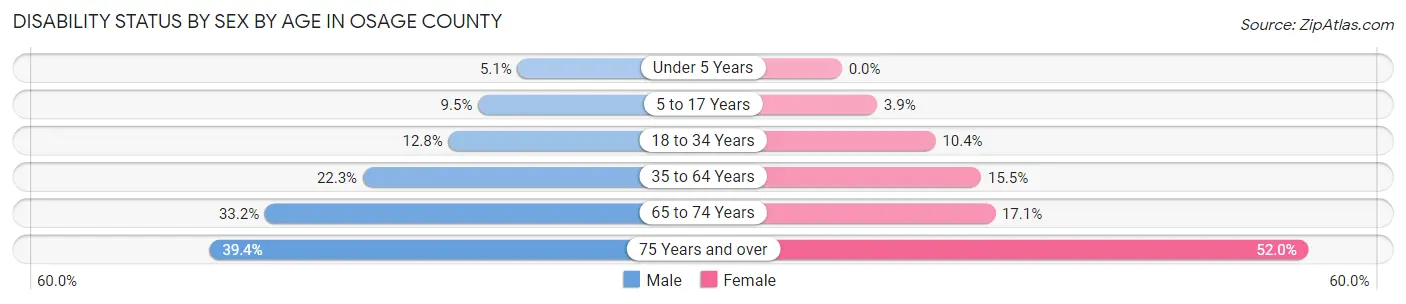
| Age Bracket | Male | Female |
| Under 5 Years | 23 (5.1%) | 0 (0.0%) |
| 5 to 17 Years | 141 (9.5%) | 53 (3.9%) |
| 18 to 34 Years | 187 (12.8%) | 137 (10.4%) |
| 35 to 64 Years | 694 (22.3%) | 465 (15.5%) |
| 65 to 74 Years | 321 (33.2%) | 153 (17.1%) |
| 75 Years and over | 216 (39.4%) | 315 (52.0%) |
Disability Class by Sex by Age in Osage County
Disability Class: Hearing Difficulty
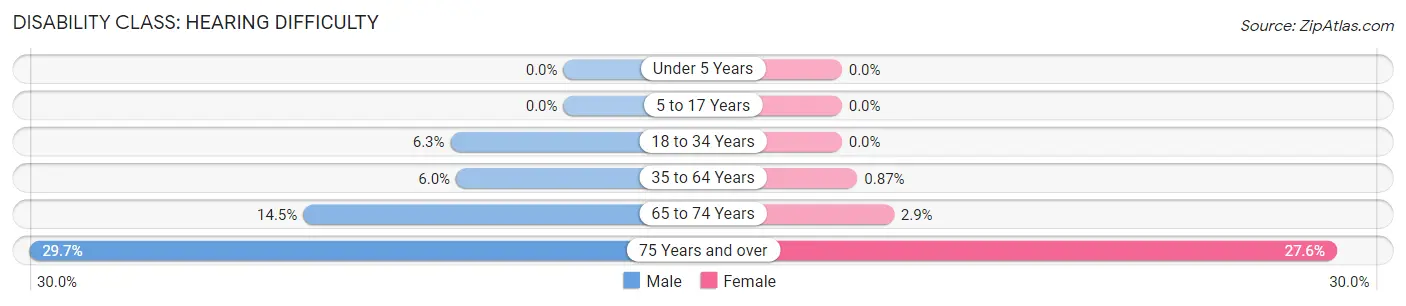
| Age Bracket | Male | Female |
| Under 5 Years | 0 (0.0%) | 0 (0.0%) |
| 5 to 17 Years | 0 (0.0%) | 0 (0.0%) |
| 18 to 34 Years | 92 (6.3%) | 0 (0.0%) |
| 35 to 64 Years | 186 (6.0%) | 26 (0.9%) |
| 65 to 74 Years | 140 (14.5%) | 26 (2.9%) |
| 75 Years and over | 163 (29.7%) | 167 (27.6%) |
Disability Class: Vision Difficulty
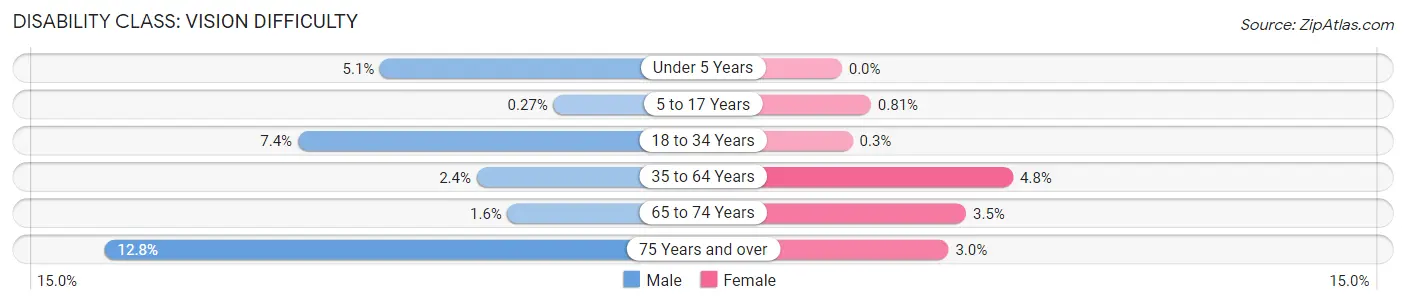
| Age Bracket | Male | Female |
| Under 5 Years | 23 (5.1%) | 0 (0.0%) |
| 5 to 17 Years | 4 (0.3%) | 11 (0.8%) |
| 18 to 34 Years | 108 (7.4%) | 4 (0.3%) |
| 35 to 64 Years | 75 (2.4%) | 143 (4.8%) |
| 65 to 74 Years | 15 (1.5%) | 31 (3.5%) |
| 75 Years and over | 70 (12.8%) | 18 (3.0%) |
Disability Class: Cognitive Difficulty
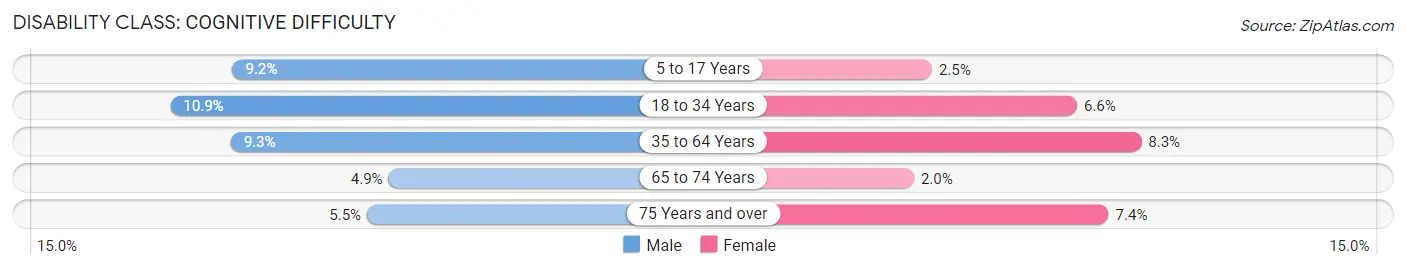
| Age Bracket | Male | Female |
| 5 to 17 Years | 137 (9.2%) | 34 (2.5%) |
| 18 to 34 Years | 160 (10.9%) | 86 (6.6%) |
| 35 to 64 Years | 288 (9.3%) | 250 (8.3%) |
| 65 to 74 Years | 47 (4.9%) | 18 (2.0%) |
| 75 Years and over | 30 (5.5%) | 45 (7.4%) |
Disability Class: Ambulatory Difficulty
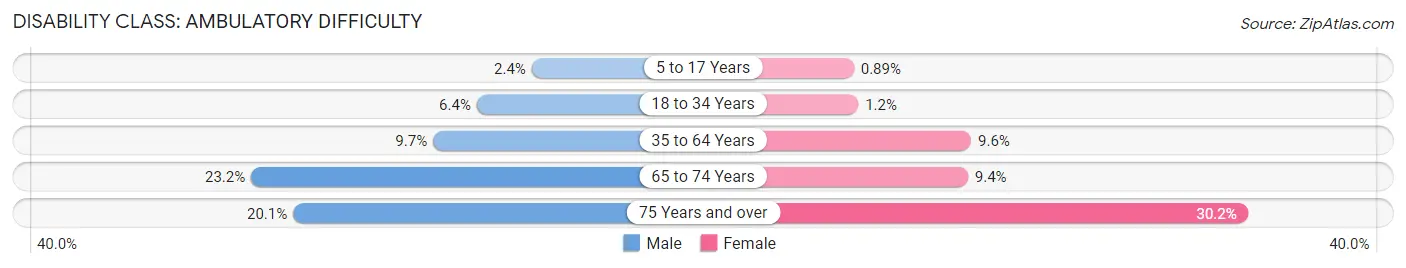
| Age Bracket | Male | Female |
| 5 to 17 Years | 35 (2.4%) | 12 (0.9%) |
| 18 to 34 Years | 94 (6.4%) | 16 (1.2%) |
| 35 to 64 Years | 301 (9.7%) | 288 (9.6%) |
| 65 to 74 Years | 224 (23.2%) | 84 (9.4%) |
| 75 Years and over | 110 (20.1%) | 183 (30.2%) |
Disability Class: Self-Care Difficulty
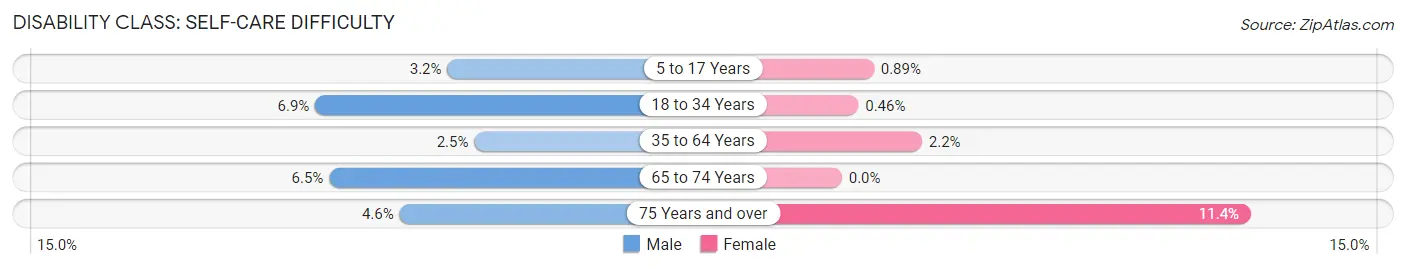
| Age Bracket | Male | Female |
| 5 to 17 Years | 48 (3.2%) | 12 (0.9%) |
| 18 to 34 Years | 101 (6.9%) | 6 (0.5%) |
| 35 to 64 Years | 77 (2.5%) | 67 (2.2%) |
| 65 to 74 Years | 63 (6.5%) | 0 (0.0%) |
| 75 Years and over | 25 (4.6%) | 69 (11.4%) |
Technology Access in Osage County
Computing Device Access in Osage County
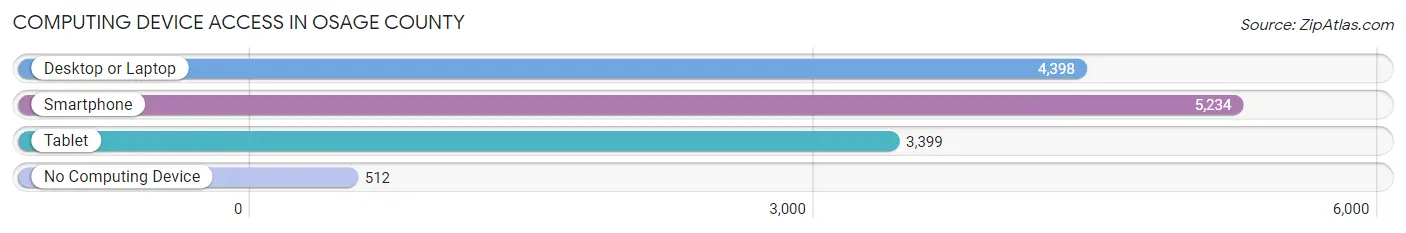
| Device Type | # Households | % Households |
| Desktop or Laptop | 4,398 | 70.0% |
| Smartphone | 5,234 | 83.3% |
| Tablet | 3,399 | 54.1% |
| No Computing Device | 512 | 8.2% |
| Total | 6,280 | 100.0% |
Internet Access in Osage County
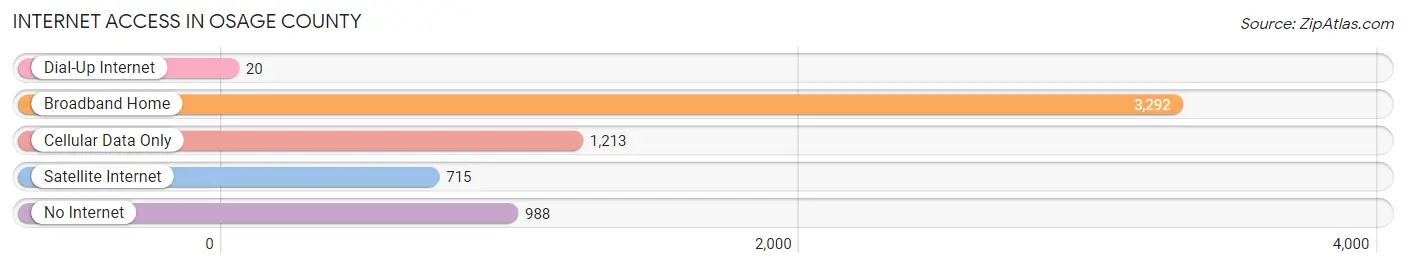
| Internet Type | # Households | % Households |
| Dial-Up Internet | 20 | 0.3% |
| Broadband Home | 3,292 | 52.4% |
| Cellular Data Only | 1,213 | 19.3% |
| Satellite Internet | 715 | 11.4% |
| No Internet | 988 | 15.7% |
| Total | 6,280 | 100.0% |
Osage County Summary
Osage County, Kansas is located in the east-central part of the state and is bordered by Shawnee, Douglas, Franklin, Coffey, and Lyon counties. The county seat is Lyndon, and the largest city is Osage City. The county was established in 1855 and named after the Osage Indians who once inhabited the area. As of the 2010 census, the population was estimated to be 16,295.
Geography
Osage County is located in the Flint Hills region of Kansas and is characterized by rolling hills and prairies. The county is drained by the Marais des Cygnes River and its tributaries. The highest point in the county is located in the northwest corner, at an elevation of 1,092 feet. The county has a total area of 576 square miles, of which 575 square miles is land and 1 square mile is water.
Economy
Agriculture is the primary economic activity in Osage County. The county is home to a variety of crops, including corn, soybeans, wheat, and hay. Livestock production is also important, with cattle, hogs, and sheep being the primary species raised.
Osage County is also home to several manufacturing companies, including a concrete plant, a metal fabrication plant, and a plastics plant. The county is also home to several retail businesses, including a grocery store, a hardware store, and a variety of restaurants.
Demographics
As of the 2010 census, the population of Osage County was 16,295. The racial makeup of the county was 95.3% White, 0.7% Black or African American, 0.5% Native American, 0.3% Asian, 0.1% Pacific Islander, 1.7% from other races, and 1.4% from two or more races. Hispanic or Latino of any race were 3.3% of the population.
The median household income in the county was $45,945, and the median family income was $53,945. The per capita income was $21,945. About 10.3% of families and 13.2% of the population were below the poverty line, including 17.2% of those under age 18 and 8.2% of those age 65 or over.
Education
Osage County is served by several school districts, including Lyndon USD 421, Osage City USD 420, and Burlingame USD 454. The county is also home to several private schools, including Lyndon Christian Academy and Osage City Christian Academy.
The county is also home to several higher education institutions, including Washburn University in Topeka and Emporia State University in Emporia.
Conclusion
Osage County, Kansas is a rural county located in the east-central part of the state. The county is characterized by rolling hills and prairies and is home to a variety of crops and livestock. The economy is primarily based on agriculture, but there are also several manufacturing and retail businesses in the county. The population of the county is estimated to be 16,295, and the median household income is $45,945. The county is served by several school districts and higher education institutions.
Common Questions
What is Per Capita Income in Osage County?
Per Capita income in Osage County is $32,120.
What is the Median Family Income in Osage County?
Median Family Income in Osage County is $78,712.
What is the Median Household income in Osage County?
Median Household Income in Osage County is $66,155.
What is Income or Wage Gap in Osage County?
Income or Wage Gap in Osage County is 27.1%.
Women in Osage County earn 72.9 cents for every dollar earned by a man.
What is Family Income Deficit in Osage County?
Family Income Deficit in Osage County is $13,488.
Families that are below poverty line in Osage County earn $13,488 less on average than the poverty threshold level.
What is Inequality or Gini Index in Osage County?
Inequality or Gini Index in Osage County is 0.38.
What is the Total Population of Osage County?
Total Population of Osage County is 15,787.
What is the Total Male Population of Osage County?
Total Male Population of Osage County is 8,107.
What is the Total Female Population of Osage County?
Total Female Population of Osage County is 7,680.
What is the Ratio of Males per 100 Females in Osage County?
There are 105.56 Males per 100 Females in Osage County.
What is the Ratio of Females per 100 Males in Osage County?
There are 94.73 Females per 100 Males in Osage County.
What is the Median Population Age in Osage County?
Median Population Age in Osage County is 42.6 Years.
What is the Average Family Size in Osage County
Average Family Size in Osage County is 3.0 People.
What is the Average Household Size in Osage County
Average Household Size in Osage County is 2.5 People.
How Large is the Labor Force in Osage County?
There are 7,794 People in the Labor Forcein in Osage County.
What is the Percentage of People in the Labor Force in Osage County?
62.1% of People are in the Labor Force in Osage County.
What is the Unemployment Rate in Osage County?
Unemployment Rate in Osage County is 3.4%.