Ness County, KS Map & Demographics
Ness County Map
Ness County Overview
$39,978
PER CAPITA INCOME
$91,042
AVG FAMILY INCOME
$64,907
AVG HOUSEHOLD INCOME
58.8%
WAGE / INCOME GAP [ % ]
41.2¢/ $1
WAGE / INCOME GAP [ $ ]
0.44
INEQUALITY / GINI INDEX
2,677
TOTAL POPULATION
1,370
MALE POPULATION
1,307
FEMALE POPULATION
104.82
MALES / 100 FEMALES
95.40
FEMALES / 100 MALES
48.4
MEDIAN AGE
2.8
AVG FAMILY SIZE
2.3
AVG HOUSEHOLD SIZE
1,431
LABOR FORCE [ PEOPLE ]
64.3%
PERCENT IN LABOR FORCE
0.6%
UNEMPLOYMENT RATE
Ness County Area Codes
Income in Ness County
Income Overview in Ness County
Per Capita Income in Ness County is $39,978, while median incomes of families and households are $91,042 and $64,907 respectively.
| Characteristic | Number | Measure |
| Per Capita Income | 2,677 | $39,978 |
| Median Family Income | 769 | $91,042 |
| Mean Family Income | 769 | $108,045 |
| Median Household Income | 1,144 | $64,907 |
| Mean Household Income | 1,144 | $89,559 |
| Income Deficit | 769 | $0 |
| Wage / Income Gap (%) | 2,677 | 58.81% |
| Wage / Income Gap ($) | 2,677 | 41.19¢ per $1 |
| Gini / Inequality Index | 2,677 | 0.44 |
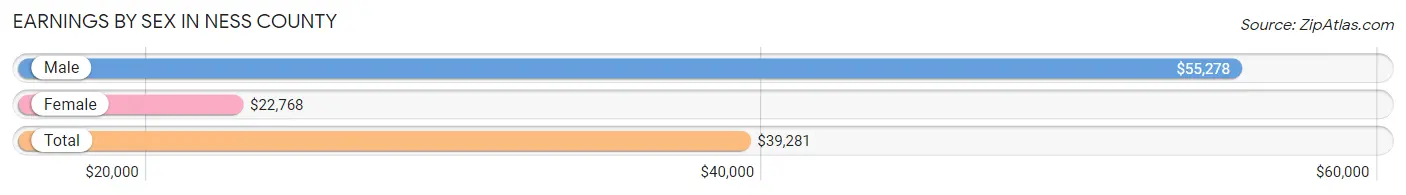
Earnings by Sex in Ness County
Average Earnings in Ness County are $39,281, $55,278 for men and $22,768 for women, a difference of 58.8%.
| Sex | Number | Average Earnings |
| Male | 860 (54.6%) | $55,278 |
| Female | 715 (45.4%) | $22,768 |
| Total | 1,575 (100.0%) | $39,281 |
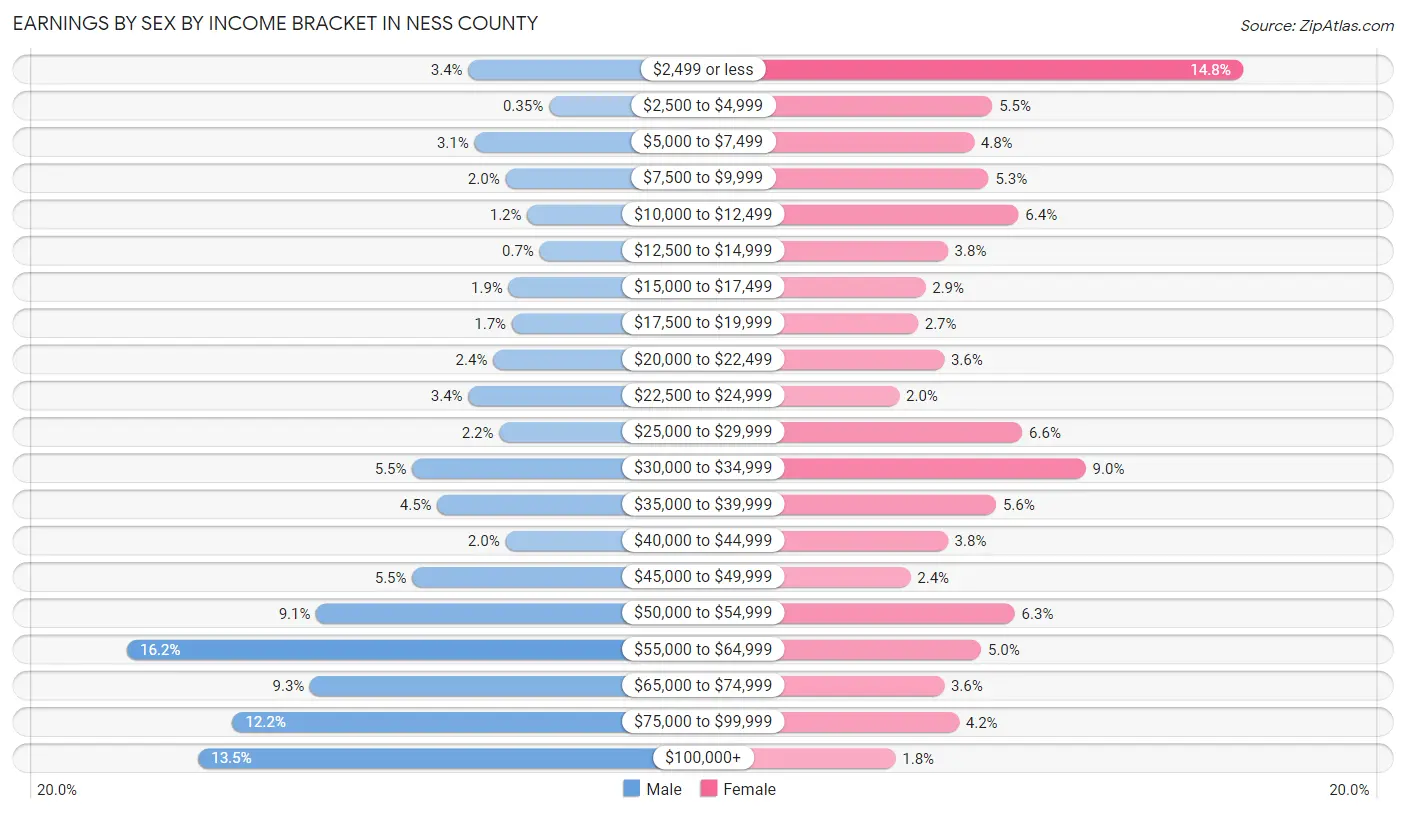
Earnings by Sex by Income Bracket in Ness County
The most common earnings brackets in Ness County are $55,000 to $64,999 for men (139 | 16.2%) and $2,499 or less for women (106 | 14.8%).
| Income | Male | Female |
| $2,499 or less | 29 (3.4%) | 106 (14.8%) |
| $2,500 to $4,999 | 3 (0.4%) | 39 (5.4%) |
| $5,000 to $7,499 | 27 (3.1%) | 34 (4.8%) |
| $7,500 to $9,999 | 17 (2.0%) | 38 (5.3%) |
| $10,000 to $12,499 | 10 (1.2%) | 46 (6.4%) |
| $12,500 to $14,999 | 6 (0.7%) | 27 (3.8%) |
| $15,000 to $17,499 | 16 (1.9%) | 21 (2.9%) |
| $17,500 to $19,999 | 15 (1.7%) | 19 (2.7%) |
| $20,000 to $22,499 | 21 (2.4%) | 26 (3.6%) |
| $22,500 to $24,999 | 29 (3.4%) | 14 (2.0%) |
| $25,000 to $29,999 | 19 (2.2%) | 47 (6.6%) |
| $30,000 to $34,999 | 47 (5.5%) | 64 (8.9%) |
| $35,000 to $39,999 | 39 (4.5%) | 40 (5.6%) |
| $40,000 to $44,999 | 17 (2.0%) | 27 (3.8%) |
| $45,000 to $49,999 | 47 (5.5%) | 17 (2.4%) |
| $50,000 to $54,999 | 78 (9.1%) | 45 (6.3%) |
| $55,000 to $64,999 | 139 (16.2%) | 36 (5.0%) |
| $65,000 to $74,999 | 80 (9.3%) | 26 (3.6%) |
| $75,000 to $99,999 | 105 (12.2%) | 30 (4.2%) |
| $100,000+ | 116 (13.5%) | 13 (1.8%) |
| Total | 860 (100.0%) | 715 (100.0%) |
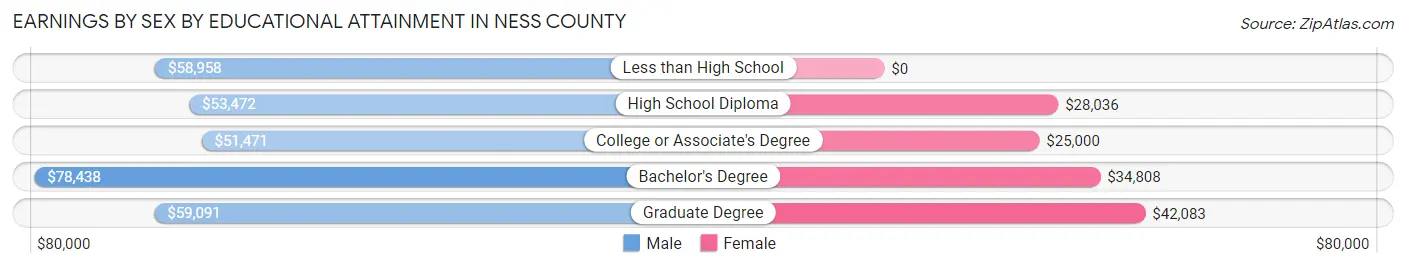
Earnings by Sex by Educational Attainment in Ness County
Average earnings in Ness County are $55,404 for men and $28,464 for women, a difference of 48.6%. Men with an educational attainment of bachelor's degree enjoy the highest average annual earnings of $78,438, while those with college or associate's degree education earn the least with $51,471. Women with an educational attainment of graduate degree earn the most with the average annual earnings of $42,083, while those with college or associate's degree education have the smallest earnings of $25,000.
| Educational Attainment | Male Income | Female Income |
| Less than High School | $58,958 | $0 |
| High School Diploma | $53,472 | $28,036 |
| College or Associate's Degree | $51,471 | $25,000 |
| Bachelor's Degree | $78,438 | $34,808 |
| Graduate Degree | $59,091 | $42,083 |
| Total | $55,404 | $28,464 |
Family Income in Ness County
Family Income Brackets in Ness County
According to the Ness County family income data, there are 231 families falling into the $100,000 to $149,999 income range, which is the most common income bracket and makes up 30.0% of all families. Conversely, the $10,000 to $14,999 income bracket is the least frequent group with only 7 families (0.9%) belonging to this category.
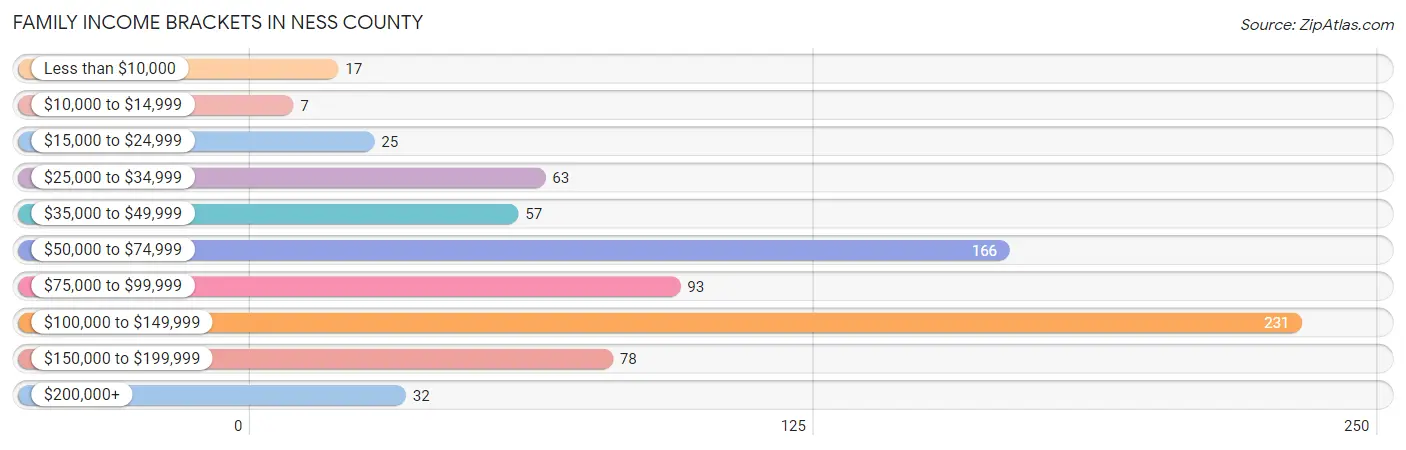
| Income Bracket | # Families | % Families |
| Less than $10,000 | 17 | 2.2% |
| $10,000 to $14,999 | 7 | 0.9% |
| $15,000 to $24,999 | 25 | 3.3% |
| $25,000 to $34,999 | 63 | 8.2% |
| $35,000 to $49,999 | 57 | 7.4% |
| $50,000 to $74,999 | 166 | 21.6% |
| $75,000 to $99,999 | 93 | 12.1% |
| $100,000 to $149,999 | 231 | 30.0% |
| $150,000 to $199,999 | 78 | 10.1% |
| $200,000+ | 32 | 4.2% |
Family Income by Famaliy Size in Ness County
5-person families (41 | 5.3%) account for the highest median family income in Ness County with $94,583 per family, while 2-person families (498 | 64.8%) have the highest median income of $45,580 per family member.
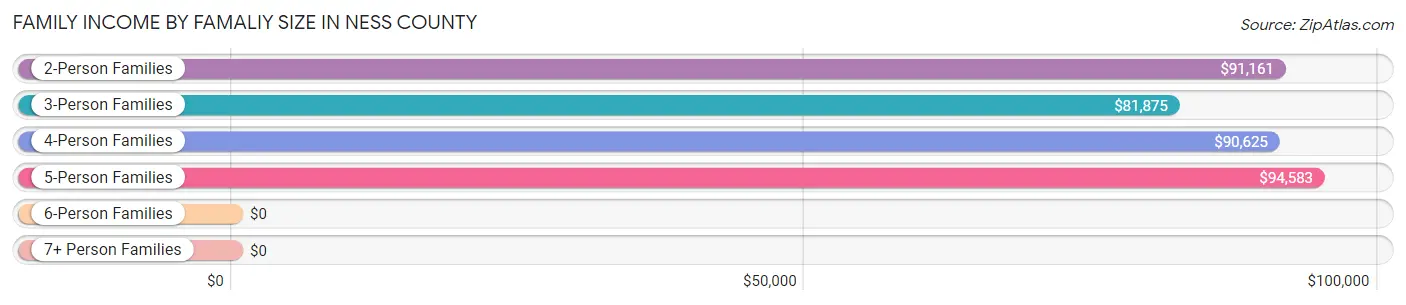
| Income Bracket | # Families | Median Income |
| 2-Person Families | 498 (64.8%) | $91,161 |
| 3-Person Families | 101 (13.1%) | $81,875 |
| 4-Person Families | 101 (13.1%) | $90,625 |
| 5-Person Families | 41 (5.3%) | $94,583 |
| 6-Person Families | 27 (3.5%) | $0 |
| 7+ Person Families | 1 (0.1%) | $0 |
| Total | 769 (100.0%) | $91,042 |
Family Income by Number of Earners in Ness County
The median family income in Ness County is $91,042, with families comprising 3+ earners (47) having the highest median family income of $101,964, while families with 1 earner (196) have the lowest median family income of $55,000, accounting for 6.1% and 25.5% of families, respectively.
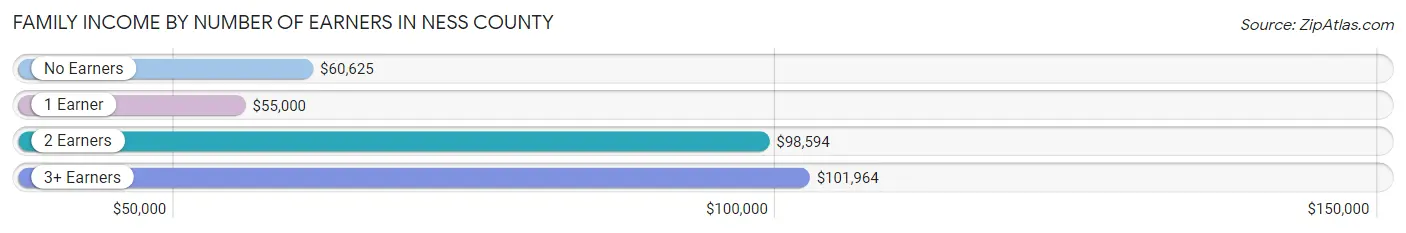
| Number of Earners | # Families | Median Income |
| No Earners | 119 (15.5%) | $60,625 |
| 1 Earner | 196 (25.5%) | $55,000 |
| 2 Earners | 407 (52.9%) | $98,594 |
| 3+ Earners | 47 (6.1%) | $101,964 |
| Total | 769 (100.0%) | $91,042 |
Household Income in Ness County
Household Income Brackets in Ness County
With 263 households falling in the category, the $100,000 to $149,999 income range is the most frequent in Ness County, accounting for 23.0% of all households. In contrast, only 30 households (2.6%) fall into the $10,000 to $14,999 income bracket, making it the least populous group.
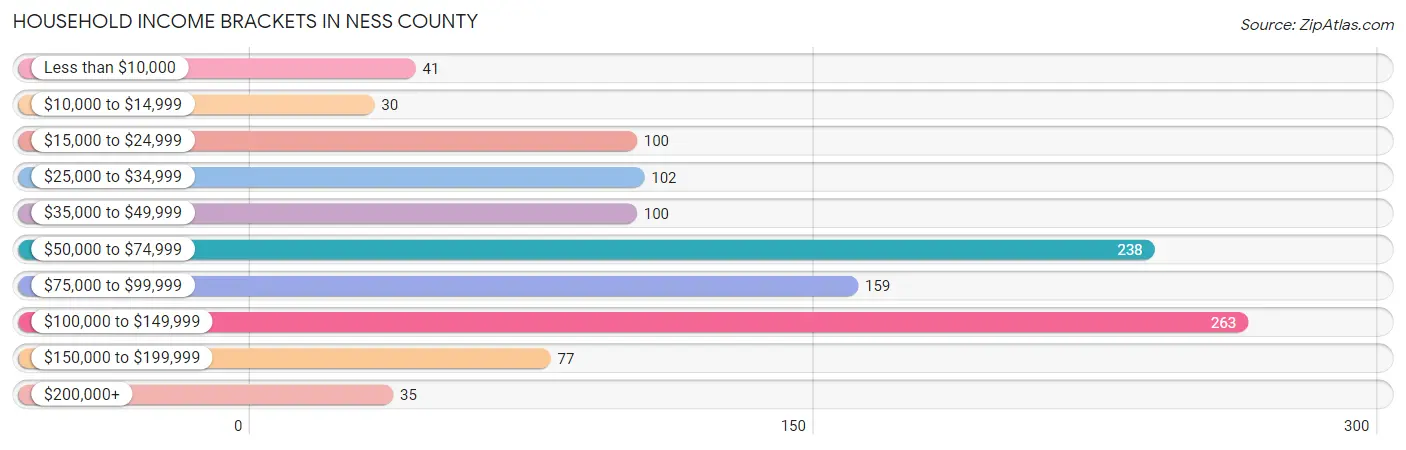
| Income Bracket | # Households | % Households |
| Less than $10,000 | 41 | 3.6% |
| $10,000 to $14,999 | 30 | 2.6% |
| $15,000 to $24,999 | 100 | 8.7% |
| $25,000 to $34,999 | 102 | 8.9% |
| $35,000 to $49,999 | 100 | 8.7% |
| $50,000 to $74,999 | 238 | 20.8% |
| $75,000 to $99,999 | 159 | 13.9% |
| $100,000 to $149,999 | 263 | 23.0% |
| $150,000 to $199,999 | 77 | 6.7% |
| $200,000+ | 35 | 3.1% |
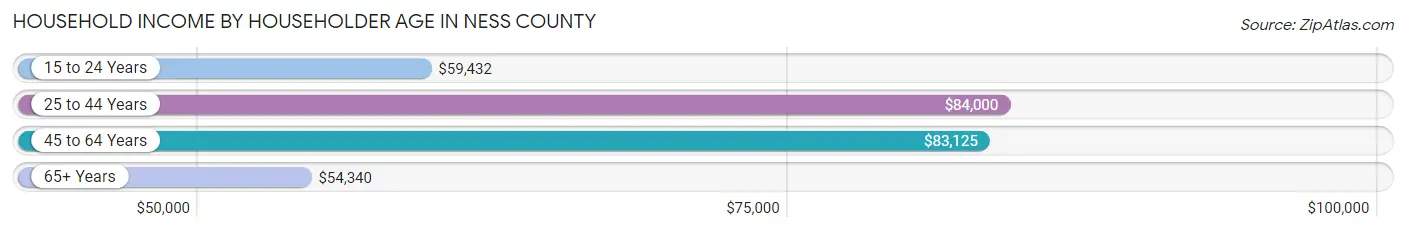
Household Income by Householder Age in Ness County
The median household income in Ness County is $64,907, with the highest median household income of $84,000 found in the 25 to 44 years age bracket for the primary householder. A total of 250 households (21.8%) fall into this category. Meanwhile, the 65+ years age bracket for the primary householder has the lowest median household income of $54,340, with 397 households (34.7%) in this group.
| Income Bracket | # Households | Median Income |
| 15 to 24 Years | 88 (7.7%) | $59,432 |
| 25 to 44 Years | 250 (21.8%) | $84,000 |
| 45 to 64 Years | 409 (35.7%) | $83,125 |
| 65+ Years | 397 (34.7%) | $54,340 |
| Total | 1,144 (100.0%) | $64,907 |
Poverty in Ness County
Income Below Poverty by Sex and Age in Ness County
With 8.6% poverty level for males and 12.6% for females among the residents of Ness County, 6 to 11 year old males and under 5 year old females are the most vulnerable to poverty, with 39 males (41.5%) and 29 females (34.5%) in their respective age groups living below the poverty level.
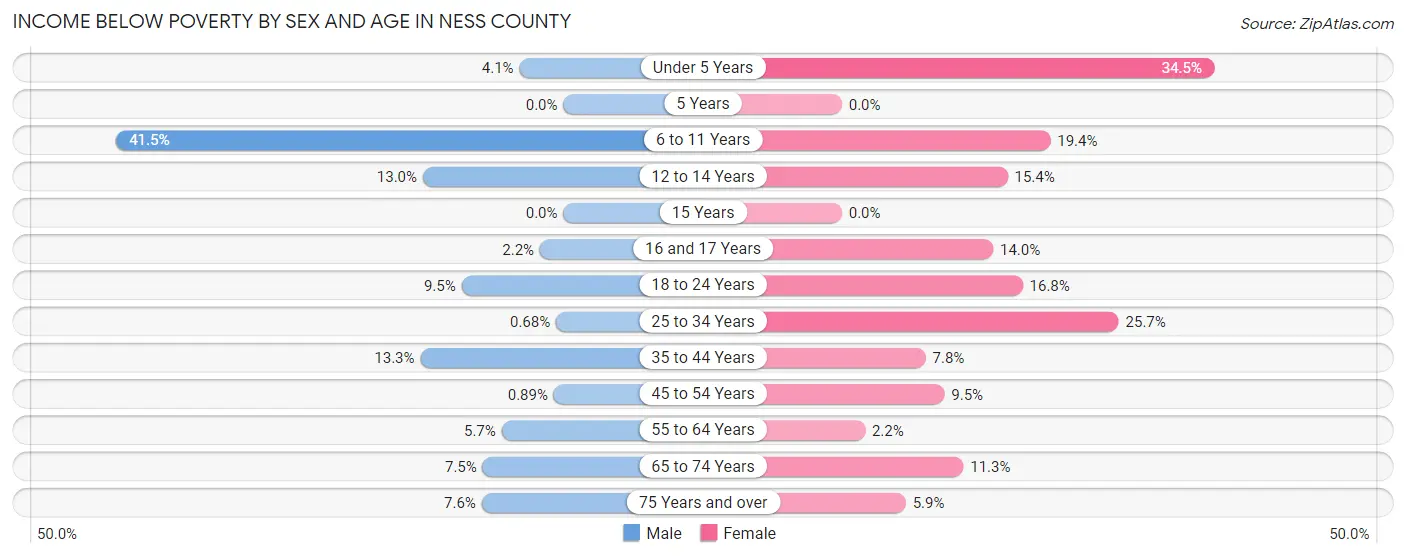
| Age Bracket | Male | Female |
| Under 5 Years | 2 (4.1%) | 29 (34.5%) |
| 5 Years | 0 (0.0%) | 0 (0.0%) |
| 6 to 11 Years | 39 (41.5%) | 12 (19.4%) |
| 12 to 14 Years | 6 (13.0%) | 10 (15.4%) |
| 15 Years | 0 (0.0%) | 0 (0.0%) |
| 16 and 17 Years | 1 (2.2%) | 8 (14.0%) |
| 18 to 24 Years | 12 (9.5%) | 24 (16.8%) |
| 25 to 34 Years | 1 (0.7%) | 28 (25.7%) |
| 35 to 44 Years | 15 (13.3%) | 7 (7.8%) |
| 45 to 54 Years | 1 (0.9%) | 14 (9.5%) |
| 55 to 64 Years | 15 (5.7%) | 5 (2.1%) |
| 65 to 74 Years | 14 (7.5%) | 15 (11.3%) |
| 75 Years and over | 10 (7.6%) | 8 (5.9%) |
| Total | 116 (8.6%) | 160 (12.6%) |
Income Above Poverty by Sex and Age in Ness County
According to the poverty statistics in Ness County, males aged 5 years and females aged 5 years are the age groups that are most secure financially, with 100.0% of males and 100.0% of females in these age groups living above the poverty line.
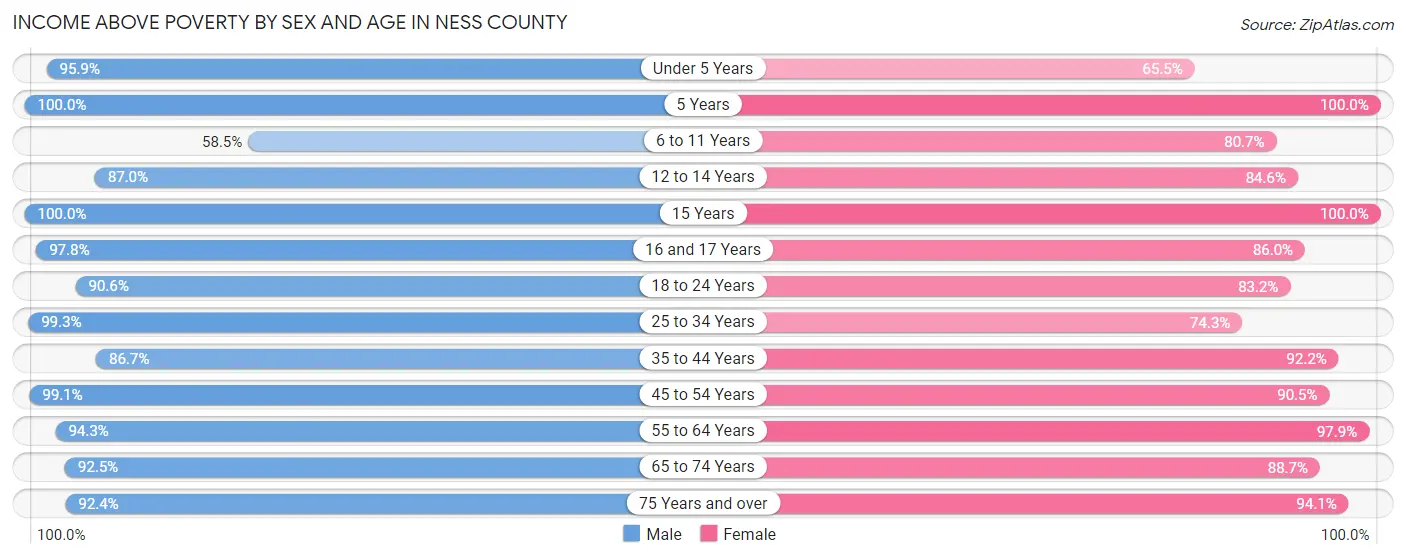
| Age Bracket | Male | Female |
| Under 5 Years | 47 (95.9%) | 55 (65.5%) |
| 5 Years | 13 (100.0%) | 12 (100.0%) |
| 6 to 11 Years | 55 (58.5%) | 50 (80.6%) |
| 12 to 14 Years | 40 (87.0%) | 55 (84.6%) |
| 15 Years | 22 (100.0%) | 2 (100.0%) |
| 16 and 17 Years | 45 (97.8%) | 49 (86.0%) |
| 18 to 24 Years | 115 (90.5%) | 119 (83.2%) |
| 25 to 34 Years | 147 (99.3%) | 81 (74.3%) |
| 35 to 44 Years | 98 (86.7%) | 83 (92.2%) |
| 45 to 54 Years | 111 (99.1%) | 133 (90.5%) |
| 55 to 64 Years | 247 (94.3%) | 228 (97.9%) |
| 65 to 74 Years | 173 (92.5%) | 118 (88.7%) |
| 75 Years and over | 122 (92.4%) | 127 (94.1%) |
| Total | 1,235 (91.4%) | 1,112 (87.4%) |
Income Below Poverty Among Married-Couple Families in Ness County
The poverty statistics for married-couple families in Ness County show that 4.4% or 31 of the total 706 families live below the poverty line. Families with 3 or 4 children have the highest poverty rate of 28.8%, comprising of 19 families. On the other hand, families with 5 or more children have the lowest poverty rate of 0.0%, which includes 0 families.
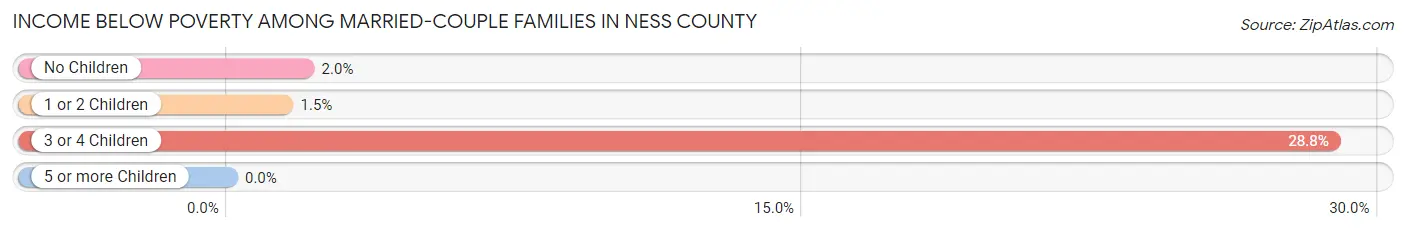
| Children | Above Poverty | Below Poverty |
| No Children | 491 (98.0%) | 10 (2.0%) |
| 1 or 2 Children | 136 (98.6%) | 2 (1.5%) |
| 3 or 4 Children | 47 (71.2%) | 19 (28.8%) |
| 5 or more Children | 1 (100.0%) | 0 (0.0%) |
| Total | 675 (95.6%) | 31 (4.4%) |
Income Below Poverty Among Single-Parent Households in Ness County
According to the poverty data in Ness County, 15.4% or 4 single-father households and 27.0% or 10 single-mother households are living below the poverty line. Among single-father households, those with 1 or 2 children have the highest poverty rate, with 4 households (30.8%) experiencing poverty. Likewise, among single-mother households, those with 1 or 2 children have the highest poverty rate, with 10 households (43.5%) falling below the poverty line.
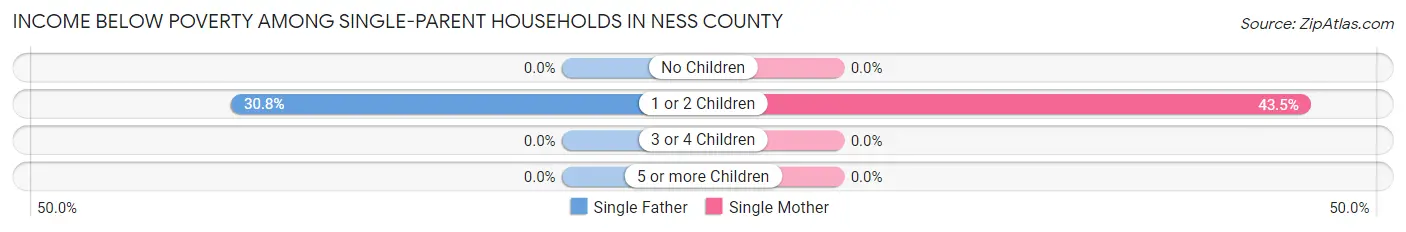
| Children | Single Father | Single Mother |
| No Children | 0 (0.0%) | 0 (0.0%) |
| 1 or 2 Children | 4 (30.8%) | 10 (43.5%) |
| 3 or 4 Children | 0 (0.0%) | 0 (0.0%) |
| 5 or more Children | 0 (0.0%) | 0 (0.0%) |
| Total | 4 (15.4%) | 10 (27.0%) |
Income Below Poverty Among Married-Couple vs Single-Parent Households in Ness County
The poverty data for Ness County shows that 31 of the married-couple family households (4.4%) and 14 of the single-parent households (22.2%) are living below the poverty level. Within the married-couple family households, those with 3 or 4 children have the highest poverty rate, with 19 households (28.8%) falling below the poverty line. Among the single-parent households, those with 1 or 2 children have the highest poverty rate, with 14 household (38.9%) living below poverty.
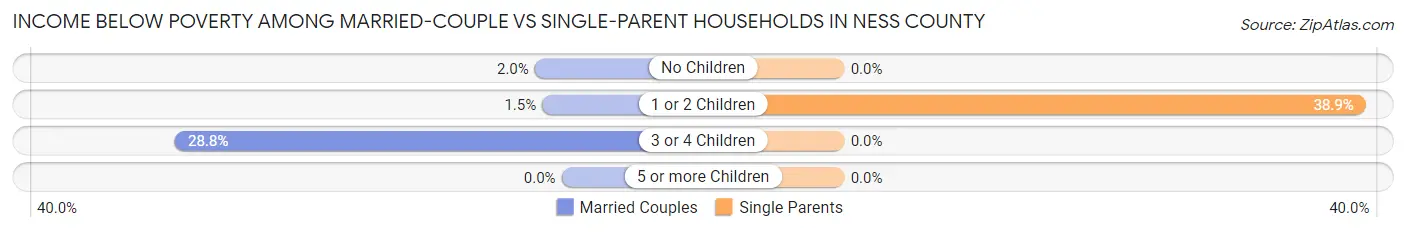
| Children | Married-Couple Families | Single-Parent Households |
| No Children | 10 (2.0%) | 0 (0.0%) |
| 1 or 2 Children | 2 (1.5%) | 14 (38.9%) |
| 3 or 4 Children | 19 (28.8%) | 0 (0.0%) |
| 5 or more Children | 0 (0.0%) | 0 (0.0%) |
| Total | 31 (4.4%) | 14 (22.2%) |
Race in Ness County
The most populous races in Ness County are White / Caucasian (2,223 | 83.0%), Hispanic or Latino (367 | 13.7%), and Some other Race (312 | 11.7%).
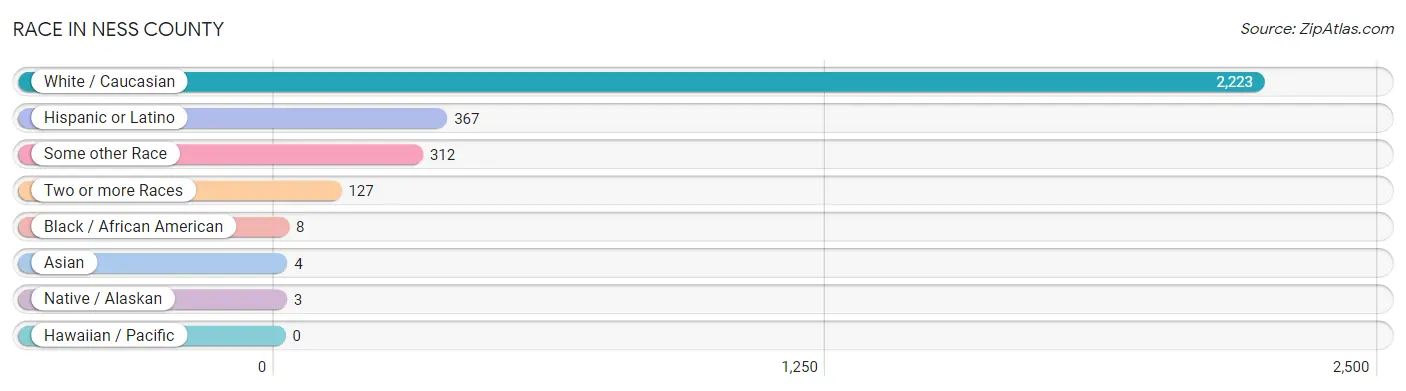
| Race | # Population | % Population |
| Asian | 4 | 0.2% |
| Black / African American | 8 | 0.3% |
| Hawaiian / Pacific | 0 | 0.0% |
| Hispanic or Latino | 367 | 13.7% |
| Native / Alaskan | 3 | 0.1% |
| White / Caucasian | 2,223 | 83.0% |
| Two or more Races | 127 | 4.7% |
| Some other Race | 312 | 11.7% |
| Total | 2,677 | 100.0% |
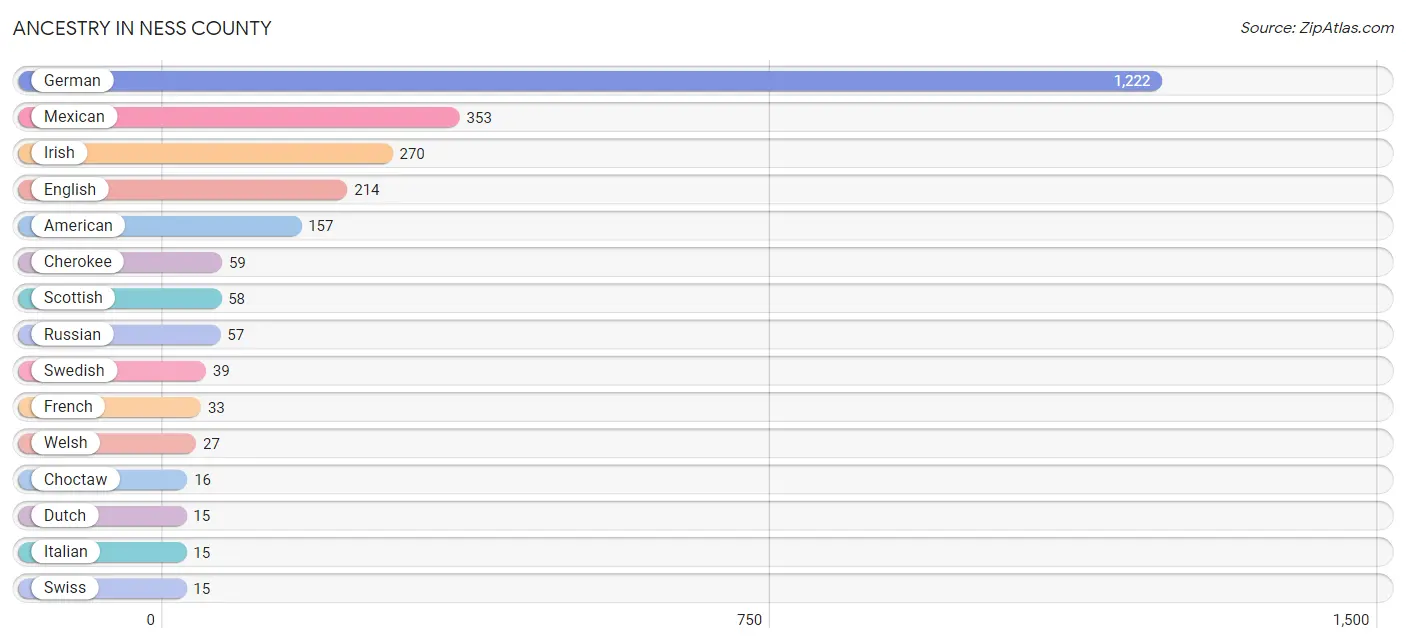
Ancestry in Ness County
The most populous ancestries reported in Ness County are German (1,222 | 45.7%), Mexican (353 | 13.2%), Irish (270 | 10.1%), English (214 | 8.0%), and American (157 | 5.9%), together accounting for 82.8% of all Ness County residents.
| Ancestry | # Population | % Population |
| American | 157 | 5.9% |
| Apache | 1 | 0.0% |
| Arab | 1 | 0.0% |
| Austrian | 7 | 0.3% |
| Bhutanese | 3 | 0.1% |
| British | 3 | 0.1% |
| Burmese | 9 | 0.3% |
| Cherokee | 59 | 2.2% |
| Choctaw | 16 | 0.6% |
| Czech | 11 | 0.4% |
| Danish | 5 | 0.2% |
| Dutch | 15 | 0.6% |
| Dutch West Indian | 11 | 0.4% |
| English | 214 | 8.0% |
| European | 14 | 0.5% |
| Finnish | 11 | 0.4% |
| French | 33 | 1.2% |
| French Canadian | 5 | 0.2% |
| German | 1,222 | 45.7% |
| German Russian | 6 | 0.2% |
| Irish | 270 | 10.1% |
| Italian | 15 | 0.6% |
| Korean | 2 | 0.1% |
| Mexican | 353 | 13.2% |
| Norwegian | 4 | 0.2% |
| Osage | 4 | 0.2% |
| Pennsylvania German | 4 | 0.2% |
| Polish | 8 | 0.3% |
| Russian | 57 | 2.1% |
| Scandinavian | 9 | 0.3% |
| Scotch-Irish | 11 | 0.4% |
| Scottish | 58 | 2.2% |
| South African | 6 | 0.2% |
| Subsaharan African | 6 | 0.2% |
| Swedish | 39 | 1.5% |
| Swiss | 15 | 0.6% |
| Ukrainian | 4 | 0.2% |
| Welsh | 27 | 1.0% | View All 38 Rows |
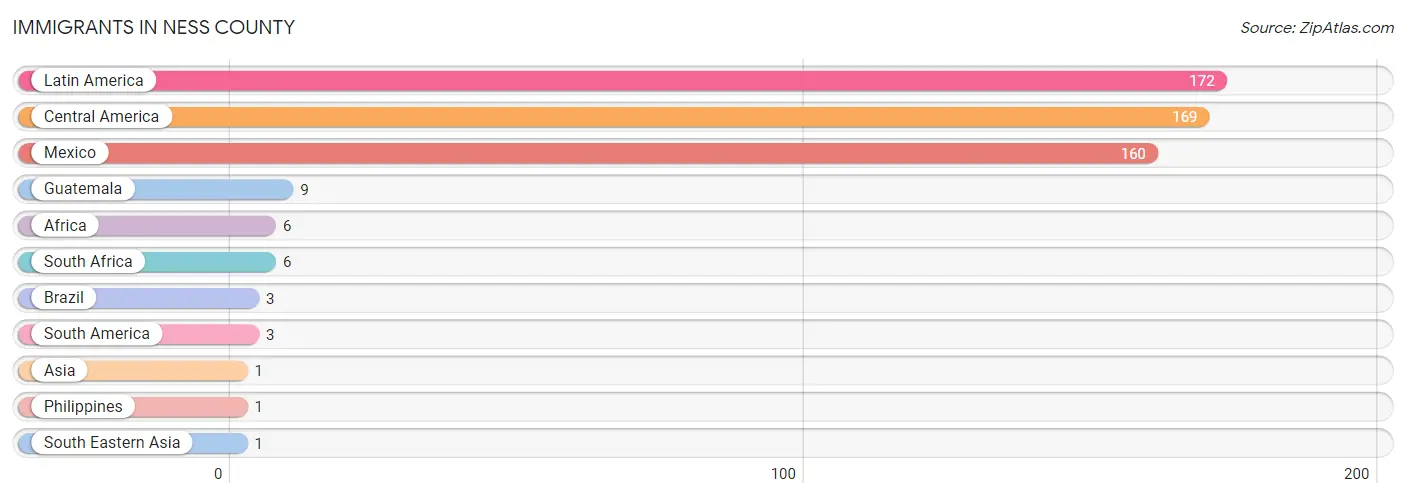
Immigrants in Ness County
The most numerous immigrant groups reported in Ness County came from Latin America (172 | 6.4%), Central America (169 | 6.3%), Mexico (160 | 6.0%), Guatemala (9 | 0.3%), and Africa (6 | 0.2%), together accounting for 19.3% of all Ness County residents.
| Immigration Origin | # Population | % Population |
| Africa | 6 | 0.2% |
| Asia | 1 | 0.0% |
| Brazil | 3 | 0.1% |
| Central America | 169 | 6.3% |
| Guatemala | 9 | 0.3% |
| Latin America | 172 | 6.4% |
| Mexico | 160 | 6.0% |
| Philippines | 1 | 0.0% |
| South Africa | 6 | 0.2% |
| South America | 3 | 0.1% |
| South Eastern Asia | 1 | 0.0% | View All 11 Rows |
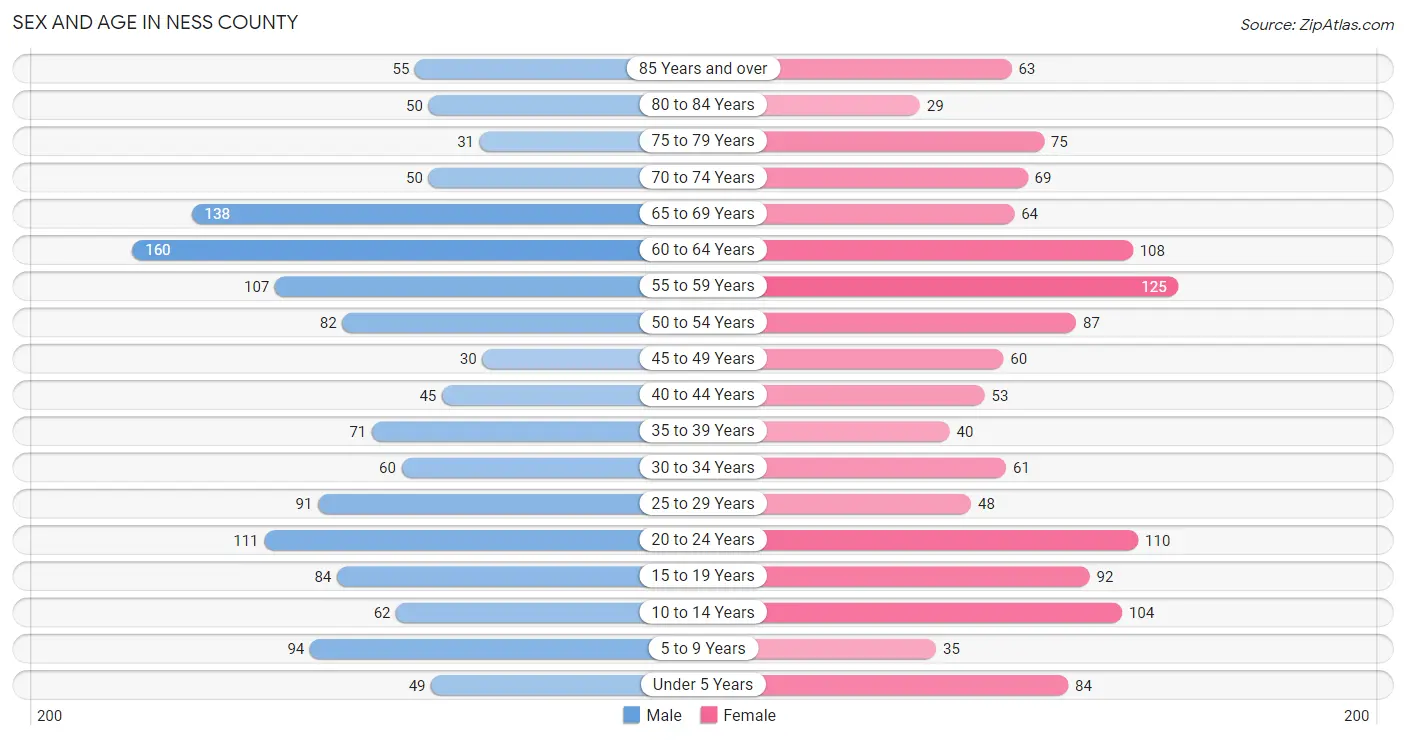
Sex and Age in Ness County
Sex and Age in Ness County
The most populous age groups in Ness County are 60 to 64 Years (160 | 11.7%) for men and 55 to 59 Years (125 | 9.6%) for women.
| Age Bracket | Male | Female |
| Under 5 Years | 49 (3.6%) | 84 (6.4%) |
| 5 to 9 Years | 94 (6.9%) | 35 (2.7%) |
| 10 to 14 Years | 62 (4.5%) | 104 (8.0%) |
| 15 to 19 Years | 84 (6.1%) | 92 (7.0%) |
| 20 to 24 Years | 111 (8.1%) | 110 (8.4%) |
| 25 to 29 Years | 91 (6.6%) | 48 (3.7%) |
| 30 to 34 Years | 60 (4.4%) | 61 (4.7%) |
| 35 to 39 Years | 71 (5.2%) | 40 (3.1%) |
| 40 to 44 Years | 45 (3.3%) | 53 (4.1%) |
| 45 to 49 Years | 30 (2.2%) | 60 (4.6%) |
| 50 to 54 Years | 82 (6.0%) | 87 (6.7%) |
| 55 to 59 Years | 107 (7.8%) | 125 (9.6%) |
| 60 to 64 Years | 160 (11.7%) | 108 (8.3%) |
| 65 to 69 Years | 138 (10.1%) | 64 (4.9%) |
| 70 to 74 Years | 50 (3.6%) | 69 (5.3%) |
| 75 to 79 Years | 31 (2.3%) | 75 (5.7%) |
| 80 to 84 Years | 50 (3.6%) | 29 (2.2%) |
| 85 Years and over | 55 (4.0%) | 63 (4.8%) |
| Total | 1,370 (100.0%) | 1,307 (100.0%) |
Families and Households in Ness County
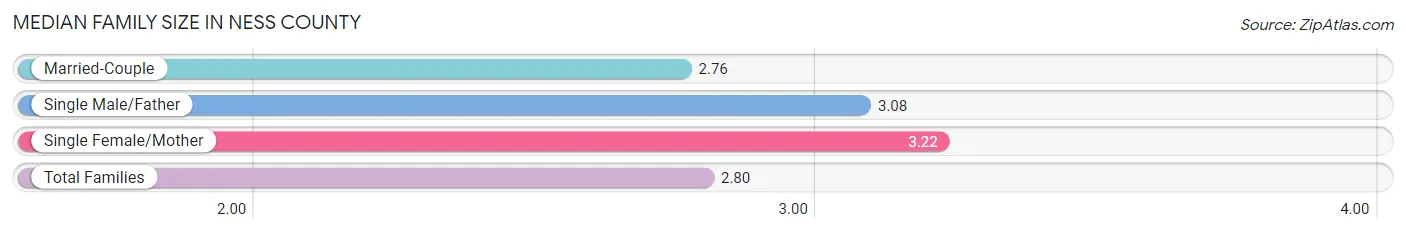
Median Family Size in Ness County
The median family size in Ness County is 2.80 persons per family, with single female/mother families (37 | 4.8%) accounting for the largest median family size of 3.22 persons per family. On the other hand, married-couple families (706 | 91.8%) represent the smallest median family size with 2.76 persons per family.
| Family Type | # Families | Family Size |
| Married-Couple | 706 (91.8%) | 2.76 |
| Single Male/Father | 26 (3.4%) | 3.08 |
| Single Female/Mother | 37 (4.8%) | 3.22 |
| Total Families | 769 (100.0%) | 2.80 |
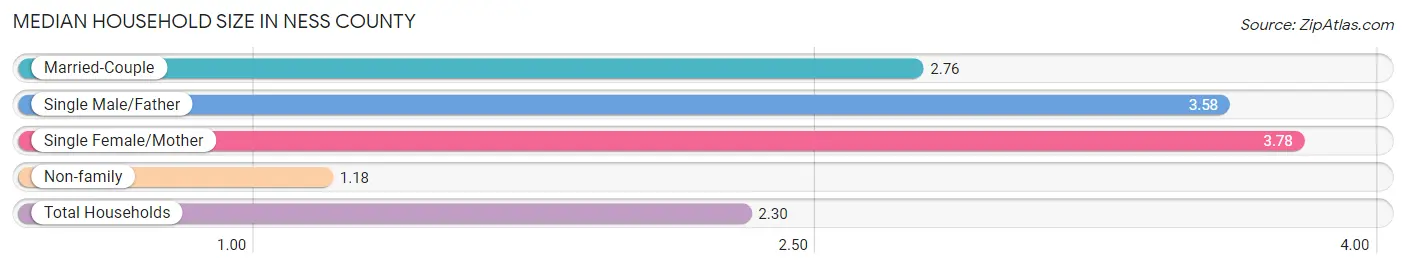
Median Household Size in Ness County
The median household size in Ness County is 2.30 persons per household, with single female/mother households (37 | 3.2%) accounting for the largest median household size of 3.78 persons per household. non-family households (375 | 32.8%) represent the smallest median household size with 1.18 persons per household.
| Household Type | # Households | Household Size |
| Married-Couple | 706 (61.7%) | 2.76 |
| Single Male/Father | 26 (2.3%) | 3.58 |
| Single Female/Mother | 37 (3.2%) | 3.78 |
| Non-family | 375 (32.8%) | 1.18 |
| Total Households | 1,144 (100.0%) | 2.30 |
Household Size by Marriage Status in Ness County
Out of a total of 1,144 households in Ness County, 769 (67.2%) are family households, while 375 (32.8%) are nonfamily households. The most numerous type of family households are 2-person households, comprising 496, and the most common type of nonfamily households are 1-person households, comprising 305.
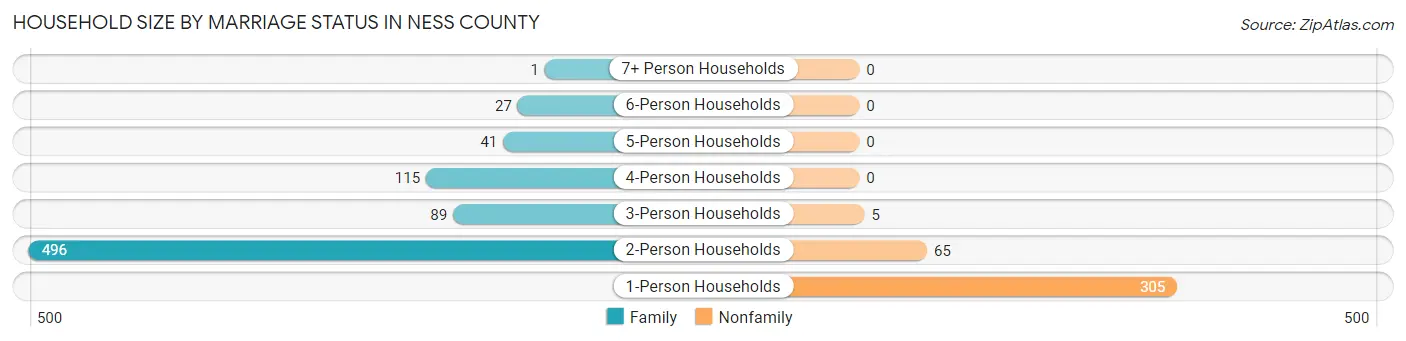
| Household Size | Family Households | Nonfamily Households |
| 1-Person Households | - | 305 (26.7%) |
| 2-Person Households | 496 (43.4%) | 65 (5.7%) |
| 3-Person Households | 89 (7.8%) | 5 (0.4%) |
| 4-Person Households | 115 (10.1%) | 0 (0.0%) |
| 5-Person Households | 41 (3.6%) | 0 (0.0%) |
| 6-Person Households | 27 (2.4%) | 0 (0.0%) |
| 7+ Person Households | 1 (0.1%) | 0 (0.0%) |
| Total | 769 (67.2%) | 375 (32.8%) |
Female Fertility in Ness County
Fertility by Age in Ness County
Average fertility rate in Ness County is 88.0 births per 1,000 women. Women in the age bracket of 20 to 34 years have the highest fertility rate with 192.0 births per 1,000 women. Women in the age bracket of 20 to 34 years acount for 100.0% of all women with births.
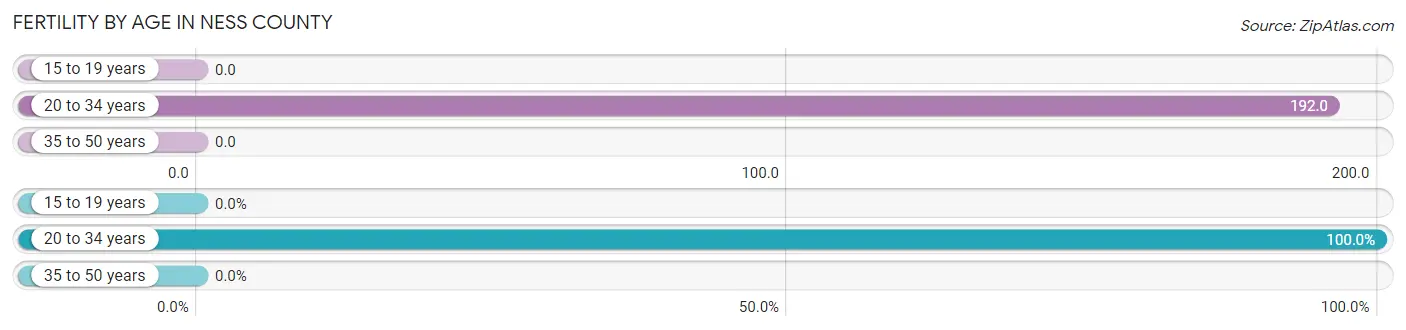
| Age Bracket | Women with Births | Births / 1,000 Women |
| 15 to 19 years | 0 (0.0%) | 0.0 |
| 20 to 34 years | 42 (100.0%) | 192.0 |
| 35 to 50 years | 0 (0.0%) | 0.0 |
| Total | 42 (100.0%) | 88.0 |
Fertility by Age by Marriage Status in Ness County
88.1% of women with births (42) in Ness County are married. The highest percentage of unmarried women with births falls into 20 to 34 years age bracket with 11.9% of them unmarried at the time of birth, while the lowest percentage of unmarried women with births belong to 20 to 34 years age bracket with 11.9% of them unmarried.
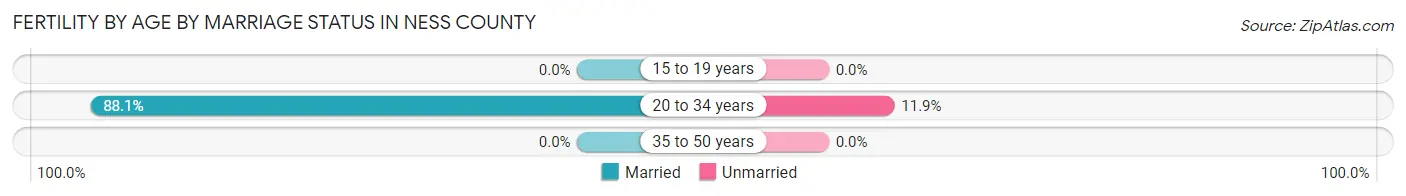
| Age Bracket | Married | Unmarried |
| 15 to 19 years | 0 (0.0%) | 0 (0.0%) |
| 20 to 34 years | 37 (88.1%) | 5 (11.9%) |
| 35 to 50 years | 0 (0.0%) | 0 (0.0%) |
| Total | 37 (88.1%) | 5 (11.9%) |
Fertility by Education in Ness County
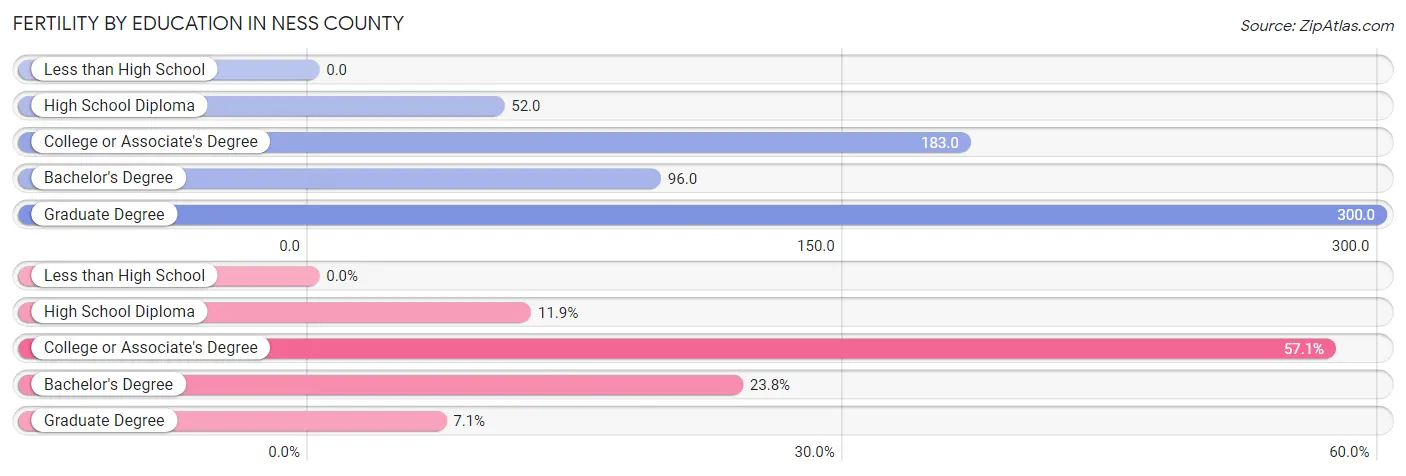
| Educational Attainment | Women with Births | Births / 1,000 Women |
| Less than High School | 0 (0.0%) | 0.0 |
| High School Diploma | 5 (11.9%) | 52.0 |
| College or Associate's Degree | 24 (57.1%) | 183.0 |
| Bachelor's Degree | 10 (23.8%) | 96.0 |
| Graduate Degree | 3 (7.1%) | 300.0 |
| Total | 42 (100.0%) | 88.0 |
Fertility by Education by Marriage Status in Ness County
11.9% of women with births in Ness County are unmarried. Women with the educational attainment of college or associate's degree are most likely to be married with 100.0% of them married at childbirth, while women with the educational attainment of high school diploma are least likely to be married with 100.0% of them unmarried at childbirth.
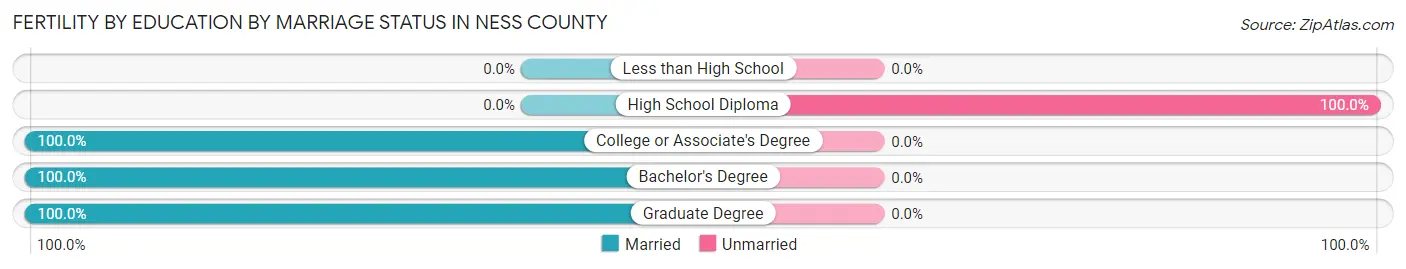
| Educational Attainment | Married | Unmarried |
| Less than High School | 0 (0.0%) | 0 (0.0%) |
| High School Diploma | 0 (0.0%) | 5 (100.0%) |
| College or Associate's Degree | 24 (100.0%) | 0 (0.0%) |
| Bachelor's Degree | 10 (100.0%) | 0 (0.0%) |
| Graduate Degree | 3 (100.0%) | 0 (0.0%) |
| Total | 37 (88.1%) | 5 (11.9%) |
Employment Characteristics in Ness County
Employment by Class of Employer in Ness County
Among the 1,395 employed individuals in Ness County, private company employees (762 | 54.6%), self-employed (not incorporated) (207 | 14.8%), and local government employees (154 | 11.0%) make up the most common classes of employment.
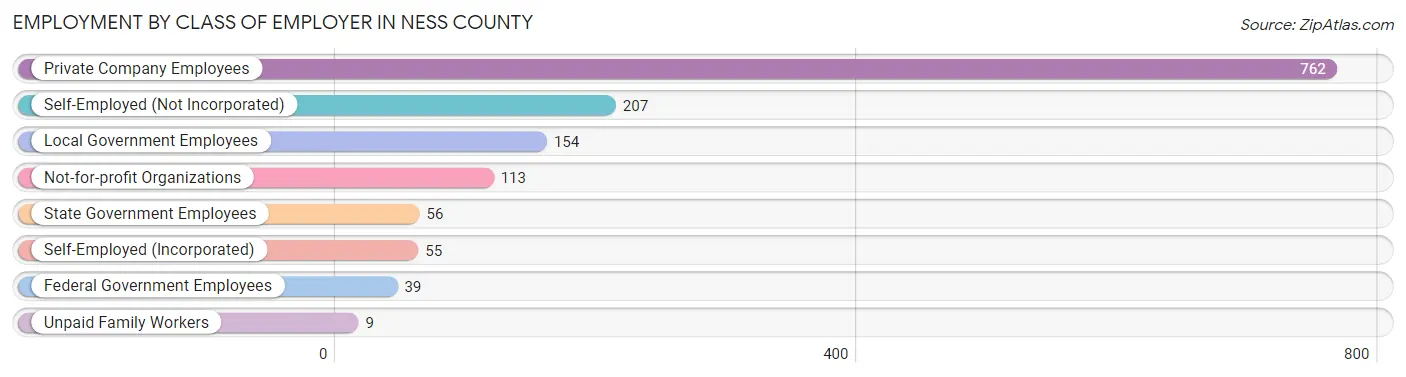
| Employer Class | # Employees | % Employees |
| Private Company Employees | 762 | 54.6% |
| Self-Employed (Incorporated) | 55 | 3.9% |
| Self-Employed (Not Incorporated) | 207 | 14.8% |
| Not-for-profit Organizations | 113 | 8.1% |
| Local Government Employees | 154 | 11.0% |
| State Government Employees | 56 | 4.0% |
| Federal Government Employees | 39 | 2.8% |
| Unpaid Family Workers | 9 | 0.6% |
| Total | 1,395 | 100.0% |
Employment Status by Age in Ness County
According to the labor force statistics for Ness County, out of the total population over 16 years of age (2,225), 64.3% or 1,431 individuals are in the labor force, with 0.6% or 9 of them unemployed. The age group with the highest labor force participation rate is 20 to 24 years, with 92.8% or 205 individuals in the labor force. Within the labor force, the 65 to 74 years age range has the highest percentage of unemployed individuals, with 2.9% or 4 of them being unemployed.
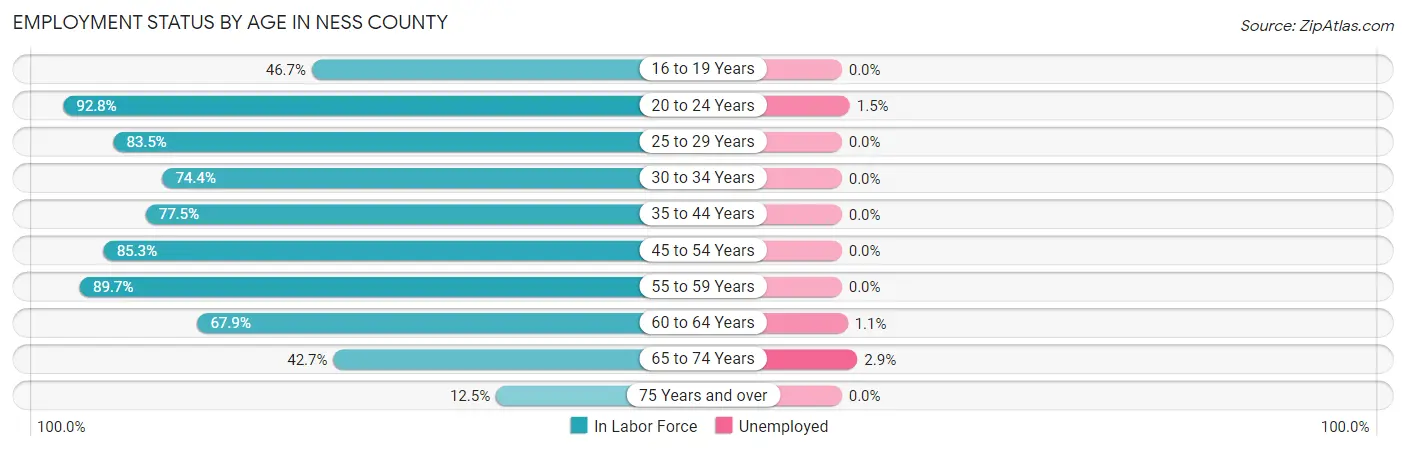
| Age Bracket | In Labor Force | Unemployed |
| 16 to 19 Years | 71 (46.7%) | 0 (0.0%) |
| 20 to 24 Years | 205 (92.8%) | 3 (1.5%) |
| 25 to 29 Years | 116 (83.5%) | 0 (0.0%) |
| 30 to 34 Years | 90 (74.4%) | 0 (0.0%) |
| 35 to 44 Years | 162 (77.5%) | 0 (0.0%) |
| 45 to 54 Years | 221 (85.3%) | 0 (0.0%) |
| 55 to 59 Years | 208 (89.7%) | 0 (0.0%) |
| 60 to 64 Years | 182 (67.9%) | 2 (1.1%) |
| 65 to 74 Years | 137 (42.7%) | 4 (2.9%) |
| 75 Years and over | 38 (12.5%) | 0 (0.0%) |
| Total | 1,431 (64.3%) | 9 (0.6%) |
Employment Status by Educational Attainment in Ness County
According to labor force statistics for Ness County, 79.7% of individuals (979) out of the total population between 25 and 64 years of age (1,228) are in the labor force, with 0.2% or 2 of them being unemployed. The group with the highest labor force participation rate are those with the educational attainment of bachelor's degree or higher, with 84.2% or 219 individuals in the labor force. Within the labor force, individuals with high school diploma education have the highest percentage of unemployment, with 0.6% or 2 of them being unemployed.
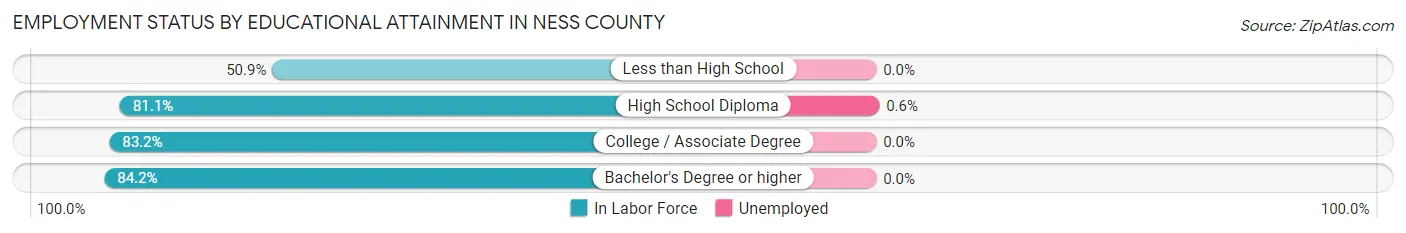
| Educational Attainment | In Labor Force | Unemployed |
| Less than High School | 58 (50.9%) | 0 (0.0%) |
| High School Diploma | 335 (81.1%) | 2 (0.6%) |
| College / Associate Degree | 367 (83.2%) | 0 (0.0%) |
| Bachelor's Degree or higher | 219 (84.2%) | 0 (0.0%) |
| Total | 979 (79.7%) | 2 (0.2%) |
Employment Occupations by Sex in Ness County
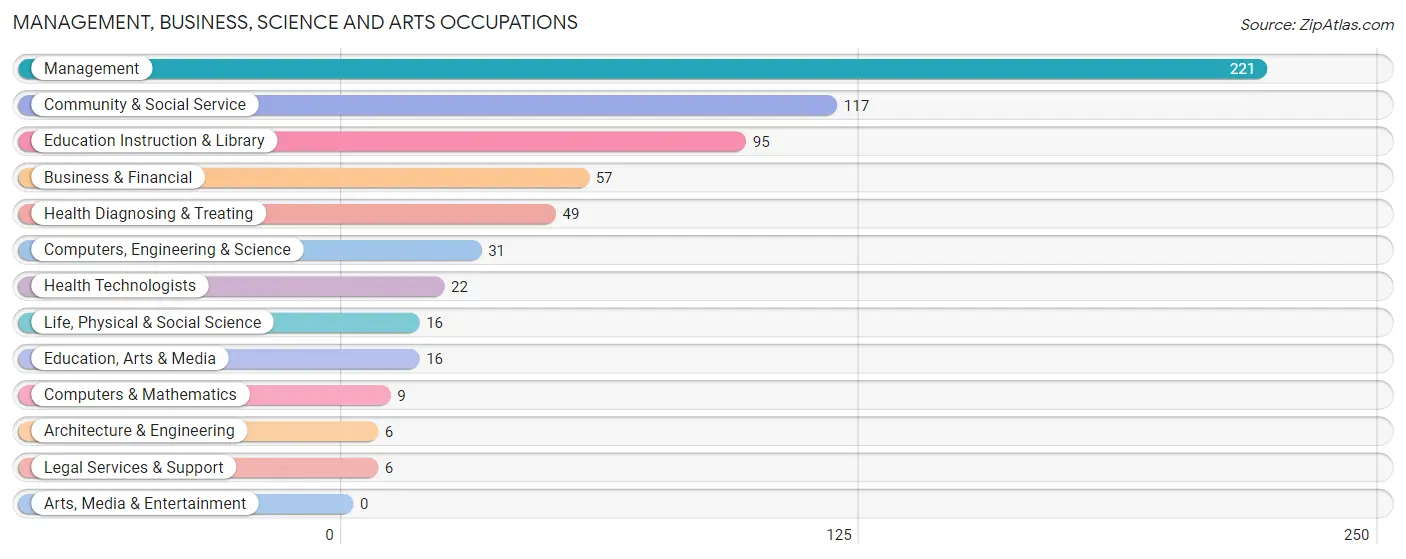
Management, Business, Science and Arts Occupations
The most common Management, Business, Science and Arts occupations in Ness County are Management (221 | 15.5%), Community & Social Service (117 | 8.2%), Education Instruction & Library (95 | 6.7%), Business & Financial (57 | 4.0%), and Health Diagnosing & Treating (49 | 3.5%).
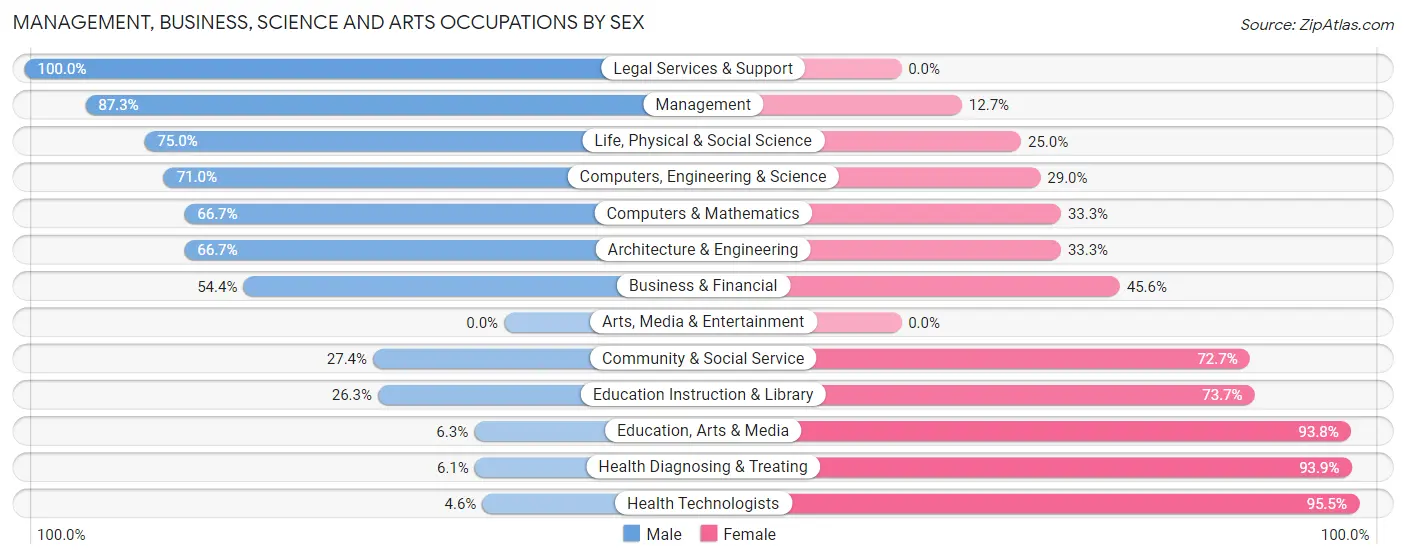
Management, Business, Science and Arts Occupations by Sex
Within the Management, Business, Science and Arts occupations in Ness County, the most male-oriented occupations are Legal Services & Support (100.0%), Management (87.3%), and Life, Physical & Social Science (75.0%), while the most female-oriented occupations are Health Technologists (95.5%), Health Diagnosing & Treating (93.9%), and Education, Arts & Media (93.8%).
| Occupation | Male | Female |
| Management | 193 (87.3%) | 28 (12.7%) |
| Business & Financial | 31 (54.4%) | 26 (45.6%) |
| Computers, Engineering & Science | 22 (71.0%) | 9 (29.0%) |
| Computers & Mathematics | 6 (66.7%) | 3 (33.3%) |
| Architecture & Engineering | 4 (66.7%) | 2 (33.3%) |
| Life, Physical & Social Science | 12 (75.0%) | 4 (25.0%) |
| Community & Social Service | 32 (27.4%) | 85 (72.7%) |
| Education, Arts & Media | 1 (6.2%) | 15 (93.8%) |
| Legal Services & Support | 6 (100.0%) | 0 (0.0%) |
| Education Instruction & Library | 25 (26.3%) | 70 (73.7%) |
| Arts, Media & Entertainment | 0 (0.0%) | 0 (0.0%) |
| Health Diagnosing & Treating | 3 (6.1%) | 46 (93.9%) |
| Health Technologists | 1 (4.5%) | 21 (95.5%) |
| Total (Category) | 281 (59.2%) | 194 (40.8%) |
| Total (Overall) | 796 (56.0%) | 625 (44.0%) |
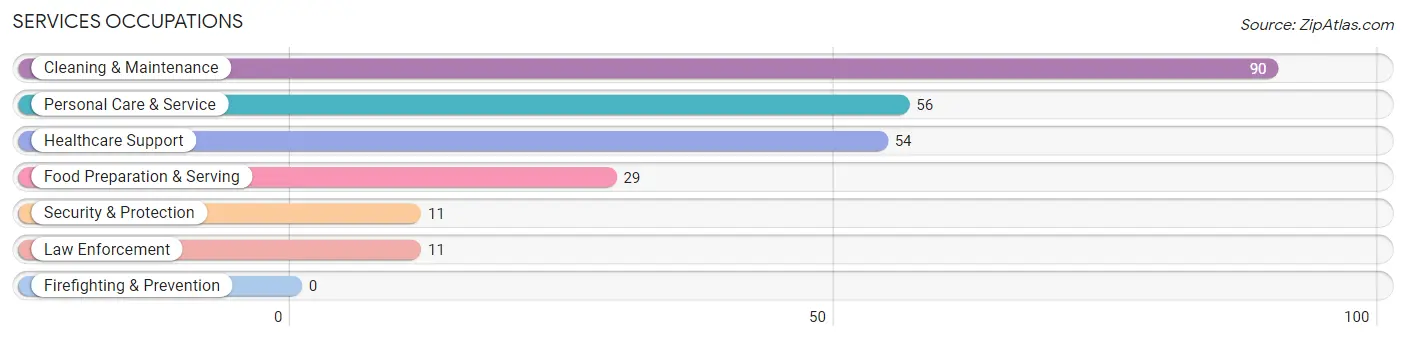
Services Occupations
The most common Services occupations in Ness County are Cleaning & Maintenance (90 | 6.3%), Personal Care & Service (56 | 3.9%), Healthcare Support (54 | 3.8%), Food Preparation & Serving (29 | 2.0%), and Security & Protection (11 | 0.8%).
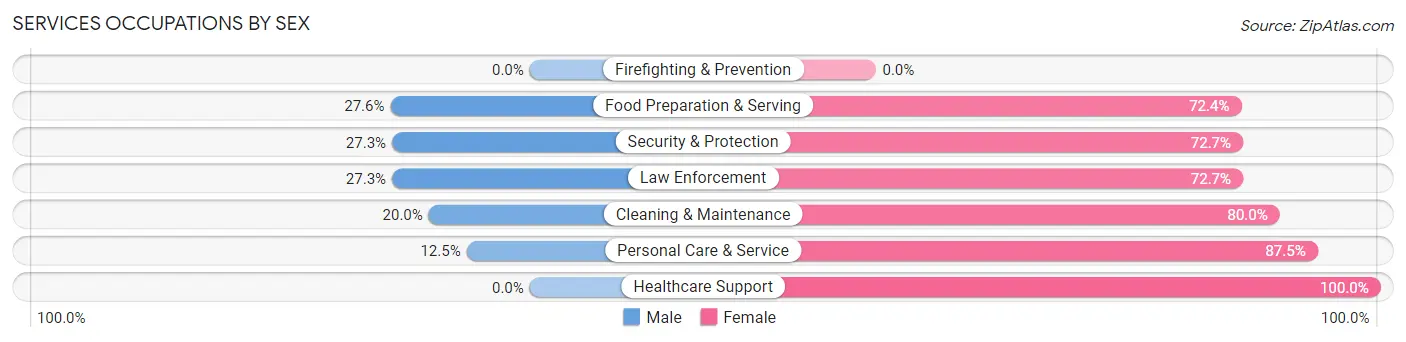
Services Occupations by Sex
Within the Services occupations in Ness County, the most male-oriented occupations are Food Preparation & Serving (27.6%), Security & Protection (27.3%), and Law Enforcement (27.3%), while the most female-oriented occupations are Healthcare Support (100.0%), Personal Care & Service (87.5%), and Cleaning & Maintenance (80.0%).
| Occupation | Male | Female |
| Healthcare Support | 0 (0.0%) | 54 (100.0%) |
| Security & Protection | 3 (27.3%) | 8 (72.7%) |
| Firefighting & Prevention | 0 (0.0%) | 0 (0.0%) |
| Law Enforcement | 3 (27.3%) | 8 (72.7%) |
| Food Preparation & Serving | 8 (27.6%) | 21 (72.4%) |
| Cleaning & Maintenance | 18 (20.0%) | 72 (80.0%) |
| Personal Care & Service | 7 (12.5%) | 49 (87.5%) |
| Total (Category) | 36 (15.0%) | 204 (85.0%) |
| Total (Overall) | 796 (56.0%) | 625 (44.0%) |
Sales and Office Occupations
The most common Sales and Office occupations in Ness County are Office & Administration (157 | 11.1%), and Sales & Related (80 | 5.6%).
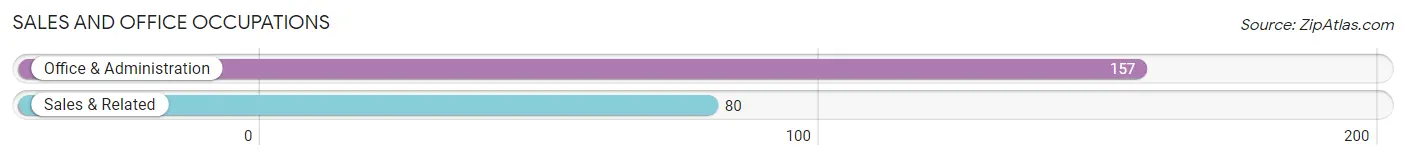
Sales and Office Occupations by Sex
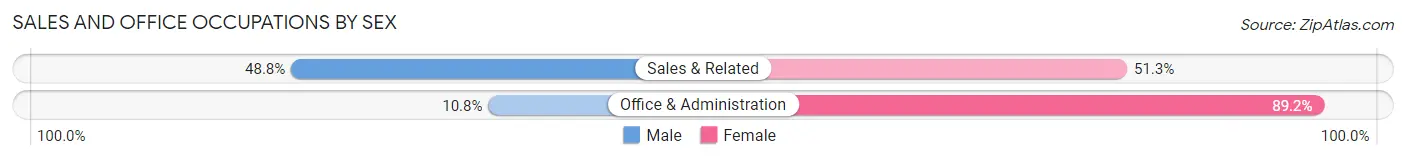
| Occupation | Male | Female |
| Sales & Related | 39 (48.7%) | 41 (51.2%) |
| Office & Administration | 17 (10.8%) | 140 (89.2%) |
| Total (Category) | 56 (23.6%) | 181 (76.4%) |
| Total (Overall) | 796 (56.0%) | 625 (44.0%) |
Natural Resources, Construction and Maintenance Occupations
The most common Natural Resources, Construction and Maintenance occupations in Ness County are Construction & Extraction (126 | 8.9%), Farming, Fishing & Forestry (91 | 6.4%), and Installation, Maintenance & Repair (42 | 3.0%).
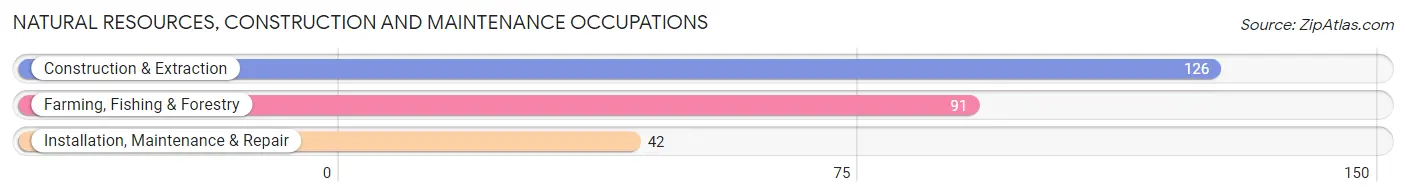
Natural Resources, Construction and Maintenance Occupations by Sex
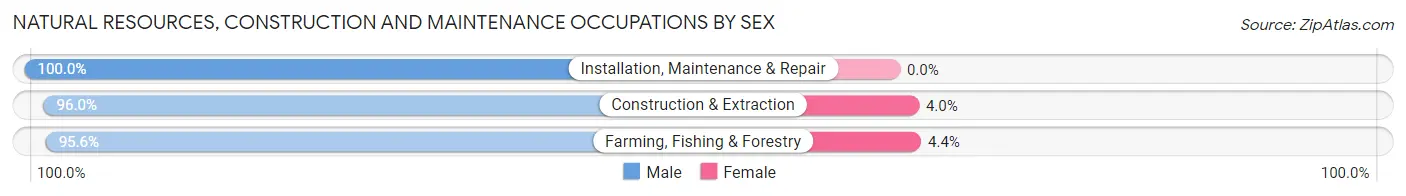
| Occupation | Male | Female |
| Farming, Fishing & Forestry | 87 (95.6%) | 4 (4.4%) |
| Construction & Extraction | 121 (96.0%) | 5 (4.0%) |
| Installation, Maintenance & Repair | 42 (100.0%) | 0 (0.0%) |
| Total (Category) | 250 (96.5%) | 9 (3.5%) |
| Total (Overall) | 796 (56.0%) | 625 (44.0%) |
Production, Transportation and Moving Occupations
The most common Production, Transportation and Moving occupations in Ness County are Transportation (130 | 9.1%), Production (40 | 2.8%), and Material Moving (40 | 2.8%).
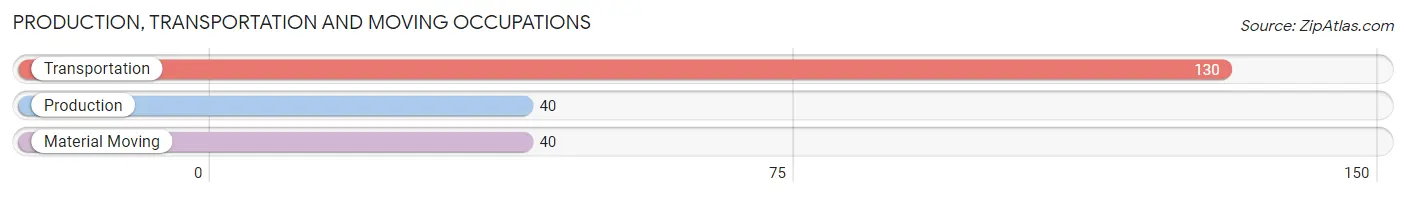
Production, Transportation and Moving Occupations by Sex
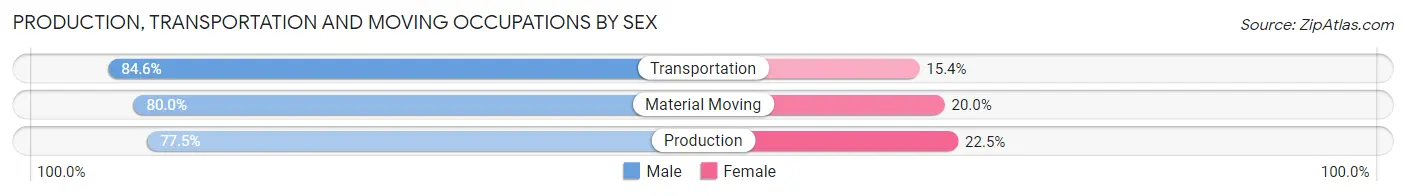
| Occupation | Male | Female |
| Production | 31 (77.5%) | 9 (22.5%) |
| Transportation | 110 (84.6%) | 20 (15.4%) |
| Material Moving | 32 (80.0%) | 8 (20.0%) |
| Total (Category) | 173 (82.4%) | 37 (17.6%) |
| Total (Overall) | 796 (56.0%) | 625 (44.0%) |
Employment Industries by Sex in Ness County
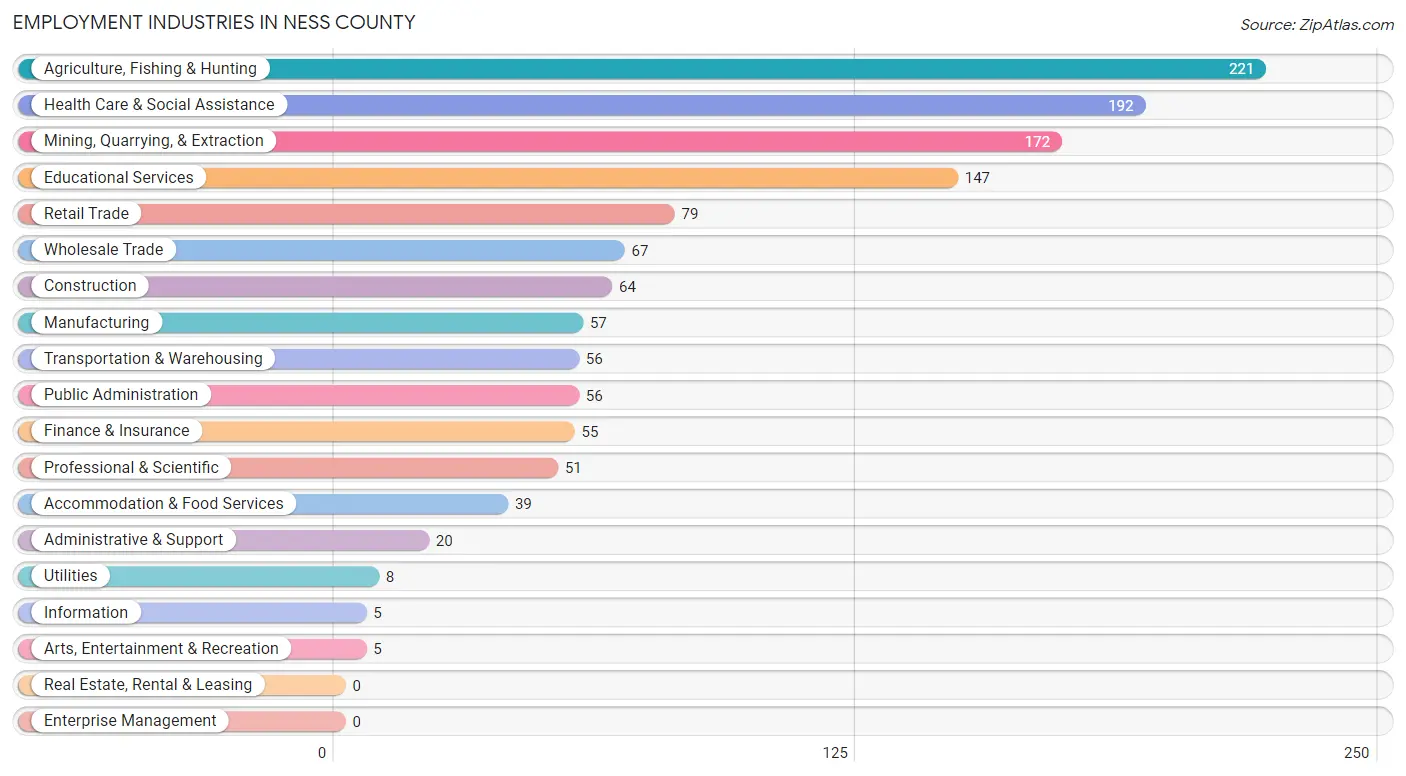
Employment Industries in Ness County
The major employment industries in Ness County include Agriculture, Fishing & Hunting (221 | 15.5%), Health Care & Social Assistance (192 | 13.5%), Mining, Quarrying, & Extraction (172 | 12.1%), Educational Services (147 | 10.3%), and Retail Trade (79 | 5.6%).
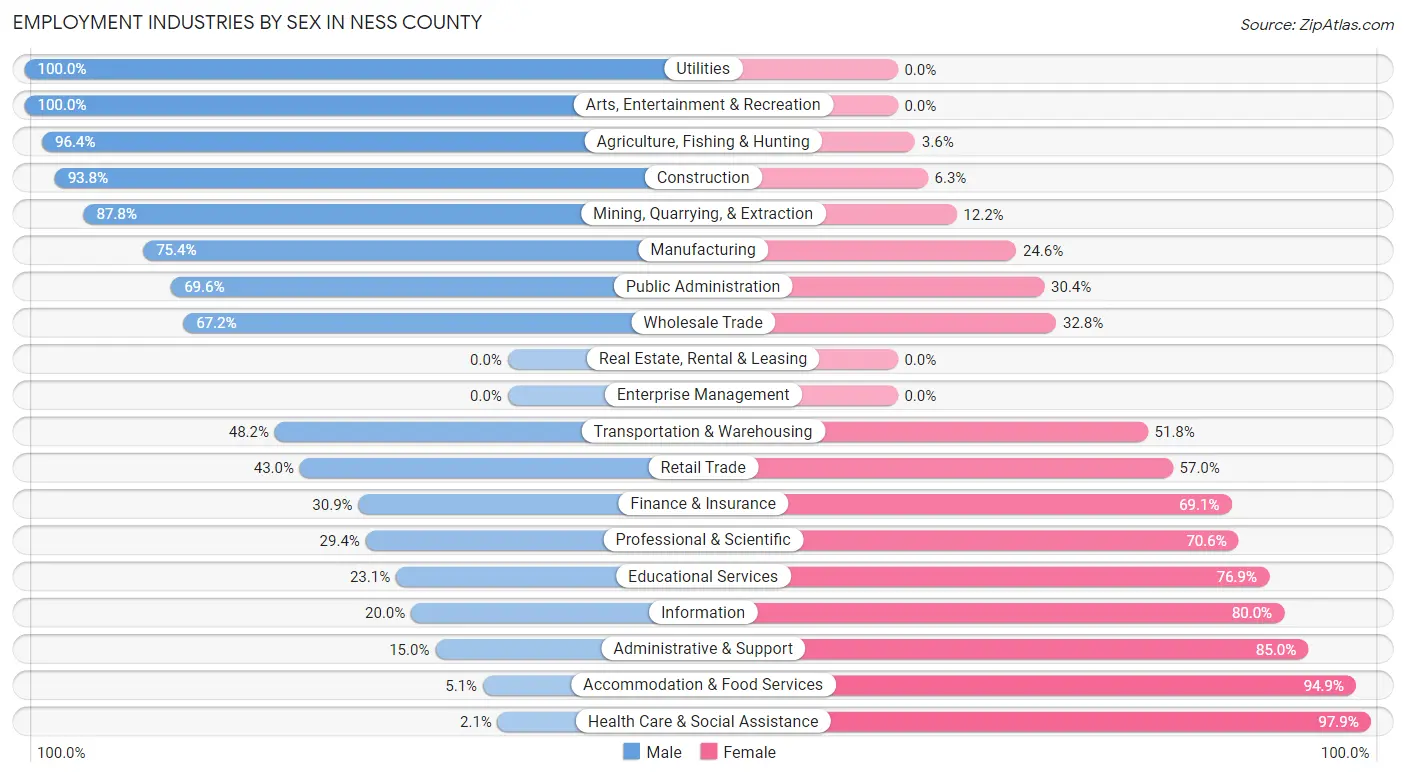
Employment Industries by Sex in Ness County
The Ness County industries that see more men than women are Utilities (100.0%), Arts, Entertainment & Recreation (100.0%), and Agriculture, Fishing & Hunting (96.4%), whereas the industries that tend to have a higher number of women are Health Care & Social Assistance (97.9%), Accommodation & Food Services (94.9%), and Administrative & Support (85.0%).
| Industry | Male | Female |
| Agriculture, Fishing & Hunting | 213 (96.4%) | 8 (3.6%) |
| Mining, Quarrying, & Extraction | 151 (87.8%) | 21 (12.2%) |
| Construction | 60 (93.8%) | 4 (6.2%) |
| Manufacturing | 43 (75.4%) | 14 (24.6%) |
| Wholesale Trade | 45 (67.2%) | 22 (32.8%) |
| Retail Trade | 34 (43.0%) | 45 (57.0%) |
| Transportation & Warehousing | 27 (48.2%) | 29 (51.8%) |
| Utilities | 8 (100.0%) | 0 (0.0%) |
| Information | 1 (20.0%) | 4 (80.0%) |
| Finance & Insurance | 17 (30.9%) | 38 (69.1%) |
| Real Estate, Rental & Leasing | 0 (0.0%) | 0 (0.0%) |
| Professional & Scientific | 15 (29.4%) | 36 (70.6%) |
| Enterprise Management | 0 (0.0%) | 0 (0.0%) |
| Administrative & Support | 3 (15.0%) | 17 (85.0%) |
| Educational Services | 34 (23.1%) | 113 (76.9%) |
| Health Care & Social Assistance | 4 (2.1%) | 188 (97.9%) |
| Arts, Entertainment & Recreation | 5 (100.0%) | 0 (0.0%) |
| Accommodation & Food Services | 2 (5.1%) | 37 (94.9%) |
| Public Administration | 39 (69.6%) | 17 (30.4%) |
| Total | 796 (56.0%) | 625 (44.0%) |
Education in Ness County
School Enrollment in Ness County
The most common levels of schooling among the 577 students in Ness County are high school (156 | 27.0%), middle school (141 | 24.4%), and elementary school (118 | 20.4%).
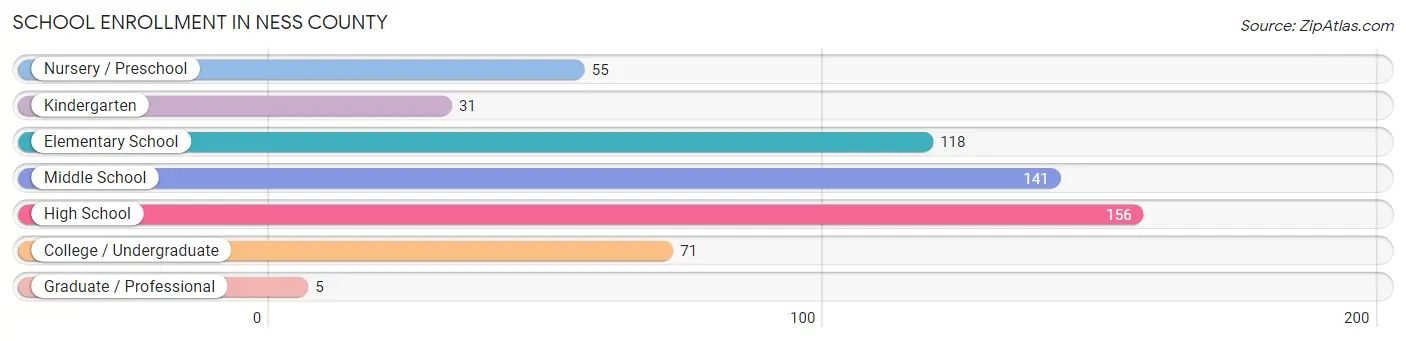
| School Level | # Students | % Students |
| Nursery / Preschool | 55 | 9.5% |
| Kindergarten | 31 | 5.4% |
| Elementary School | 118 | 20.4% |
| Middle School | 141 | 24.4% |
| High School | 156 | 27.0% |
| College / Undergraduate | 71 | 12.3% |
| Graduate / Professional | 5 | 0.9% |
| Total | 577 | 100.0% |
School Enrollment by Age by Funding Source in Ness County
Out of a total of 577 students who are enrolled in schools in Ness County, 100 (17.3%) attend a private institution, while the remaining 477 (82.7%) are enrolled in public schools. The age group of 10 to 14 year olds has the highest likelihood of being enrolled in private schools, with 54 (32.5% in the age bracket) enrolled. Conversely, the age group of 3 to 4 year olds has the lowest likelihood of being enrolled in a private school, with 49 (100.0% in the age bracket) attending a public institution.
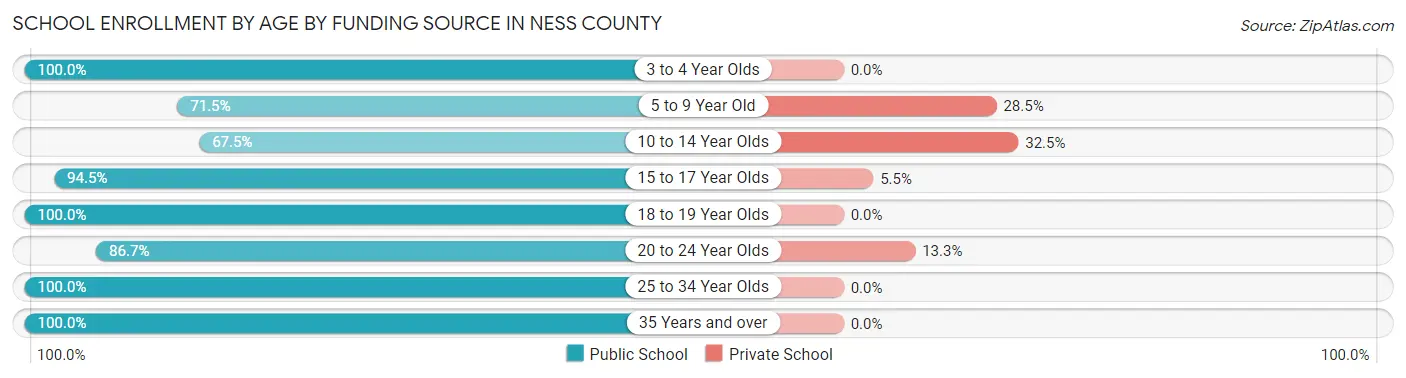
| Age Bracket | Public School | Private School |
| 3 to 4 Year Olds | 49 (100.0%) | 0 (0.0%) |
| 5 to 9 Year Old | 88 (71.5%) | 35 (28.5%) |
| 10 to 14 Year Olds | 112 (67.5%) | 54 (32.5%) |
| 15 to 17 Year Olds | 120 (94.5%) | 7 (5.5%) |
| 18 to 19 Year Olds | 47 (100.0%) | 0 (0.0%) |
| 20 to 24 Year Olds | 26 (86.7%) | 4 (13.3%) |
| 25 to 34 Year Olds | 14 (100.0%) | 0 (0.0%) |
| 35 Years and over | 21 (100.0%) | 0 (0.0%) |
| Total | 477 (82.7%) | 100 (17.3%) |
Educational Attainment by Field of Study in Ness County
Bio, nature & agricultural (93 | 23.4%), education (85 | 21.4%), psychology (45 | 11.3%), business (41 | 10.3%), and arts & humanities (40 | 10.1%) are the most common fields of study among 398 individuals in Ness County who have obtained a bachelor's degree or higher.
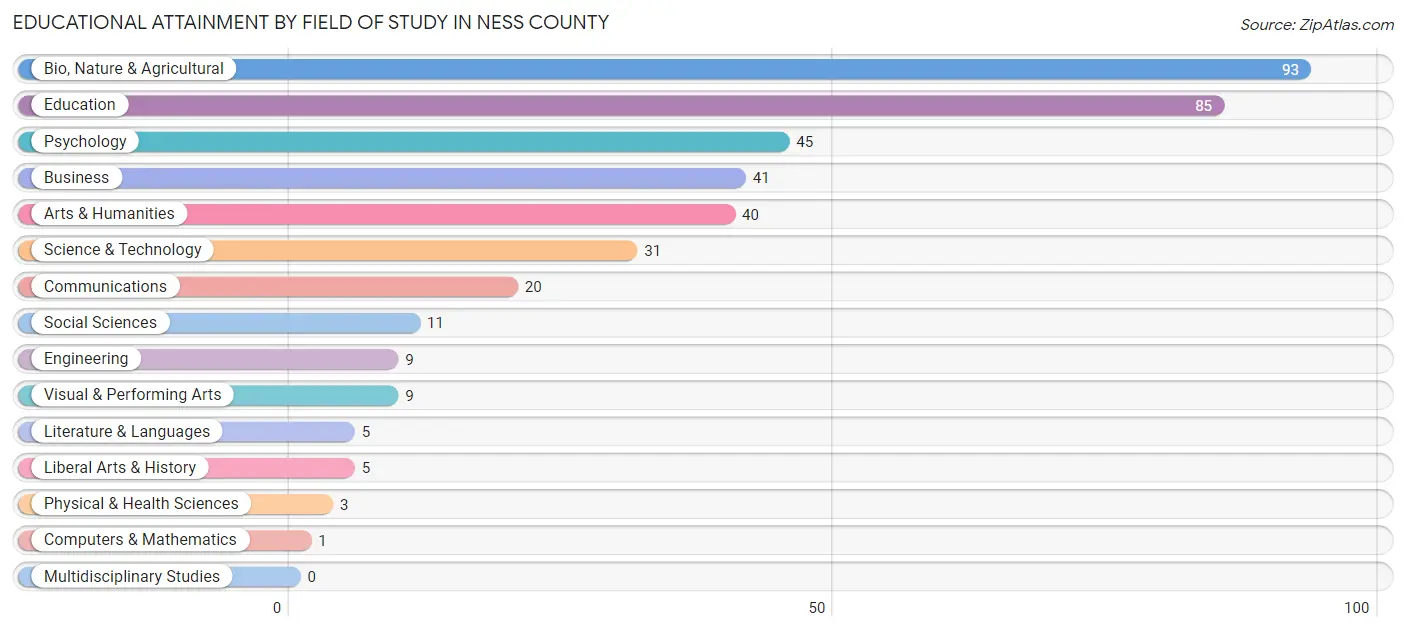
| Field of Study | # Graduates | % Graduates |
| Computers & Mathematics | 1 | 0.3% |
| Bio, Nature & Agricultural | 93 | 23.4% |
| Physical & Health Sciences | 3 | 0.7% |
| Psychology | 45 | 11.3% |
| Social Sciences | 11 | 2.8% |
| Engineering | 9 | 2.3% |
| Multidisciplinary Studies | 0 | 0.0% |
| Science & Technology | 31 | 7.8% |
| Business | 41 | 10.3% |
| Education | 85 | 21.4% |
| Literature & Languages | 5 | 1.3% |
| Liberal Arts & History | 5 | 1.3% |
| Visual & Performing Arts | 9 | 2.3% |
| Communications | 20 | 5.0% |
| Arts & Humanities | 40 | 10.1% |
| Total | 398 | 100.0% |
Transportation & Commute in Ness County
Vehicle Availability by Sex in Ness County
The most prevalent vehicle ownership categories in Ness County are males with 2 vehicles (301, accounting for 38.3%) and females with 2 vehicles (217, making up 49.3%).
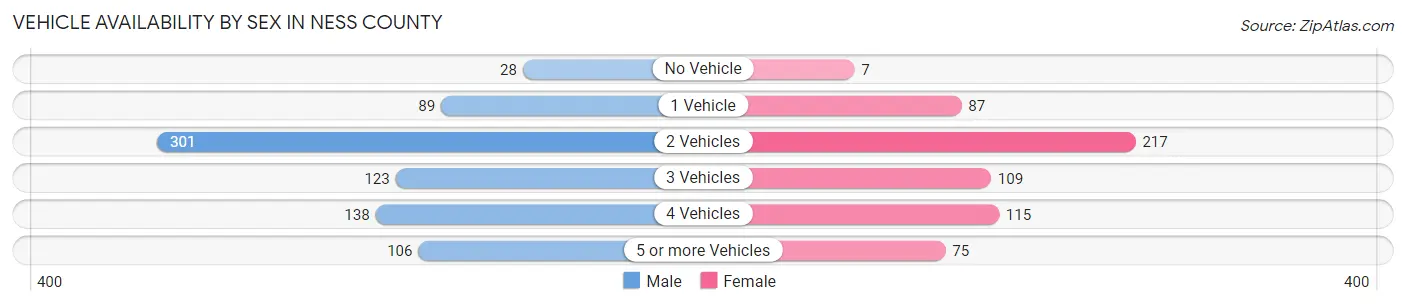
| Vehicles Available | Male | Female |
| No Vehicle | 28 (3.6%) | 7 (1.1%) |
| 1 Vehicle | 89 (11.3%) | 87 (14.3%) |
| 2 Vehicles | 301 (38.3%) | 217 (35.6%) |
| 3 Vehicles | 123 (15.7%) | 109 (17.9%) |
| 4 Vehicles | 138 (17.6%) | 115 (18.9%) |
| 5 or more Vehicles | 106 (13.5%) | 75 (12.3%) |
| Total | 785 (100.0%) | 610 (100.0%) |
Commute Time in Ness County
The most frequently occuring commute durations in Ness County are 5 to 9 minutes (324 commuters, 25.0%), less than 5 minutes (310 commuters, 23.9%), and 15 to 19 minutes (194 commuters, 15.0%).
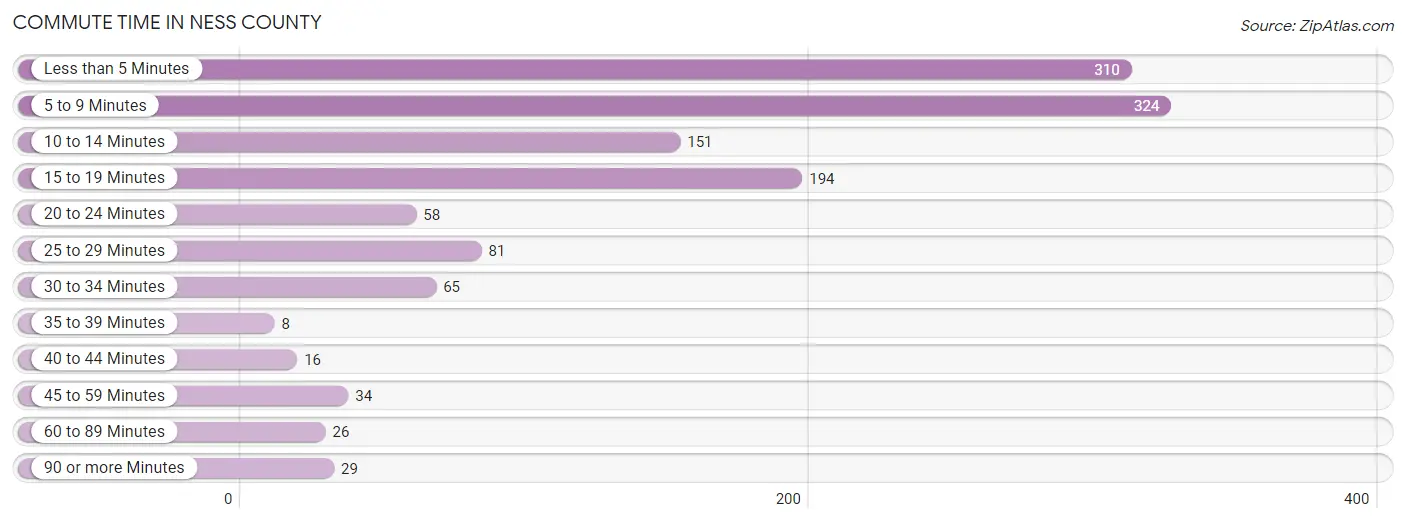
| Commute Time | # Commuters | % Commuters |
| Less than 5 Minutes | 310 | 23.9% |
| 5 to 9 Minutes | 324 | 25.0% |
| 10 to 14 Minutes | 151 | 11.7% |
| 15 to 19 Minutes | 194 | 15.0% |
| 20 to 24 Minutes | 58 | 4.5% |
| 25 to 29 Minutes | 81 | 6.2% |
| 30 to 34 Minutes | 65 | 5.0% |
| 35 to 39 Minutes | 8 | 0.6% |
| 40 to 44 Minutes | 16 | 1.2% |
| 45 to 59 Minutes | 34 | 2.6% |
| 60 to 89 Minutes | 26 | 2.0% |
| 90 or more Minutes | 29 | 2.2% |
Commute Time by Sex in Ness County
The most common commute times in Ness County are less than 5 minutes (199 commuters, 27.2%) for males and 5 to 9 minutes (164 commuters, 29.1%) for females.
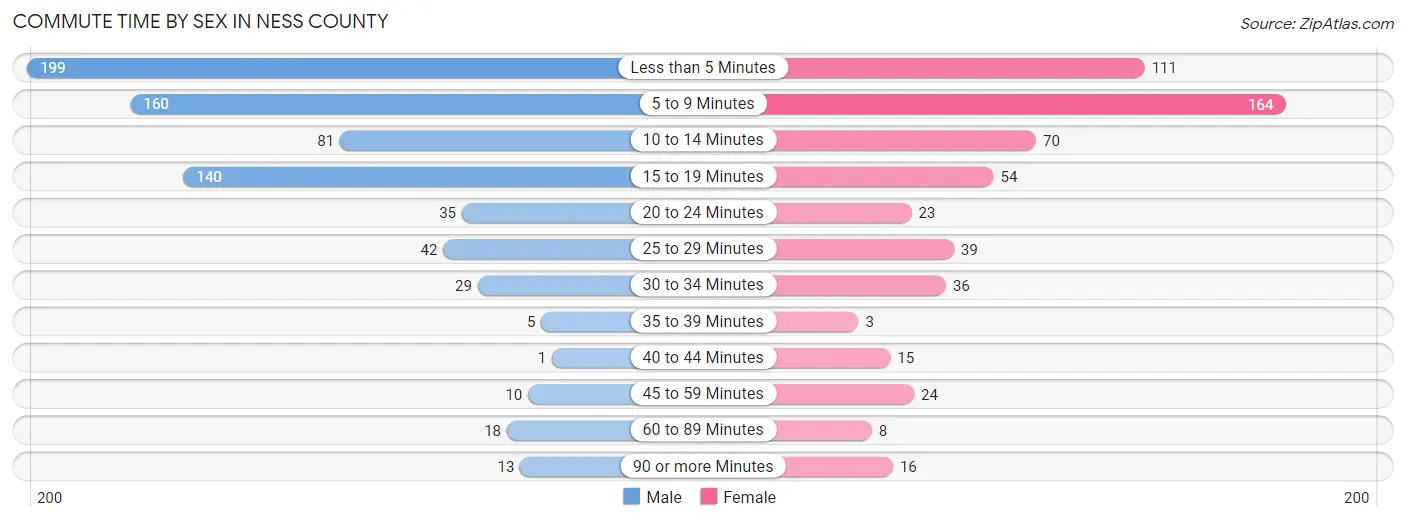
| Commute Time | Male | Female |
| Less than 5 Minutes | 199 (27.2%) | 111 (19.7%) |
| 5 to 9 Minutes | 160 (21.8%) | 164 (29.1%) |
| 10 to 14 Minutes | 81 (11.1%) | 70 (12.4%) |
| 15 to 19 Minutes | 140 (19.1%) | 54 (9.6%) |
| 20 to 24 Minutes | 35 (4.8%) | 23 (4.1%) |
| 25 to 29 Minutes | 42 (5.7%) | 39 (6.9%) |
| 30 to 34 Minutes | 29 (4.0%) | 36 (6.4%) |
| 35 to 39 Minutes | 5 (0.7%) | 3 (0.5%) |
| 40 to 44 Minutes | 1 (0.1%) | 15 (2.7%) |
| 45 to 59 Minutes | 10 (1.4%) | 24 (4.3%) |
| 60 to 89 Minutes | 18 (2.5%) | 8 (1.4%) |
| 90 or more Minutes | 13 (1.8%) | 16 (2.8%) |
Time of Departure to Work by Sex in Ness County
The most frequent times of departure to work in Ness County are 7:00 AM to 7:29 AM (182, 24.8%) for males and 7:30 AM to 7:59 AM (177, 31.4%) for females.
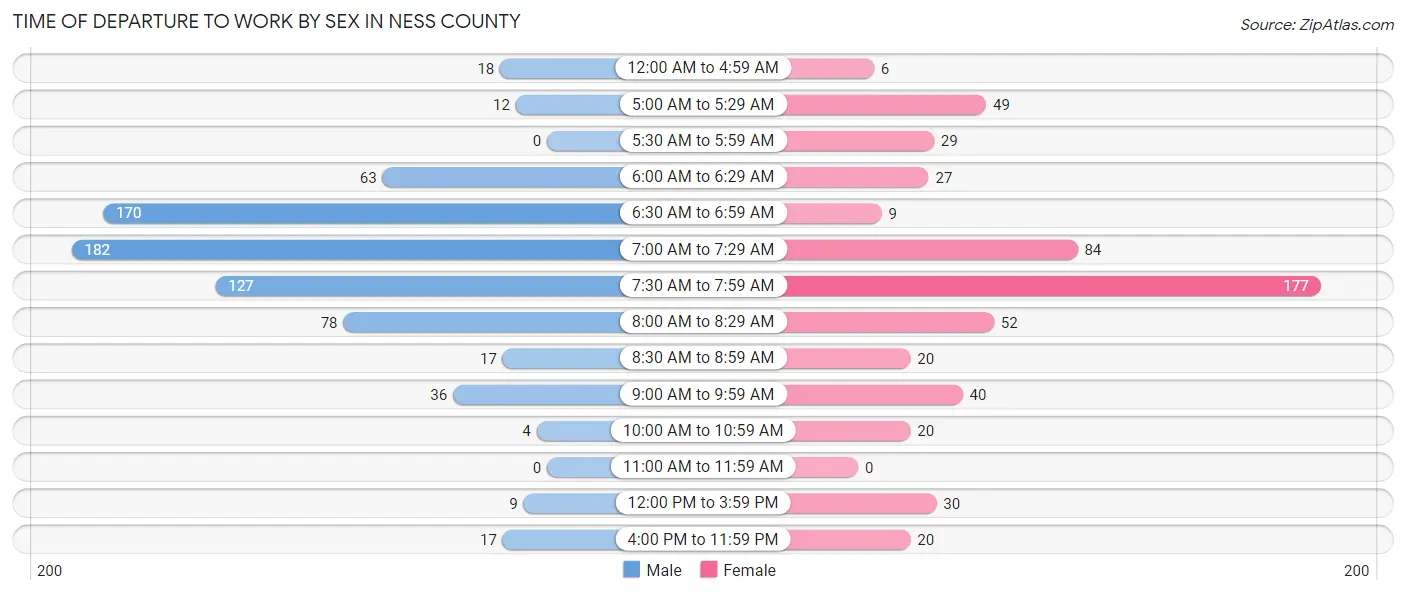
| Time of Departure | Male | Female |
| 12:00 AM to 4:59 AM | 18 (2.5%) | 6 (1.1%) |
| 5:00 AM to 5:29 AM | 12 (1.6%) | 49 (8.7%) |
| 5:30 AM to 5:59 AM | 0 (0.0%) | 29 (5.1%) |
| 6:00 AM to 6:29 AM | 63 (8.6%) | 27 (4.8%) |
| 6:30 AM to 6:59 AM | 170 (23.2%) | 9 (1.6%) |
| 7:00 AM to 7:29 AM | 182 (24.8%) | 84 (14.9%) |
| 7:30 AM to 7:59 AM | 127 (17.3%) | 177 (31.4%) |
| 8:00 AM to 8:29 AM | 78 (10.6%) | 52 (9.2%) |
| 8:30 AM to 8:59 AM | 17 (2.3%) | 20 (3.5%) |
| 9:00 AM to 9:59 AM | 36 (4.9%) | 40 (7.1%) |
| 10:00 AM to 10:59 AM | 4 (0.5%) | 20 (3.5%) |
| 11:00 AM to 11:59 AM | 0 (0.0%) | 0 (0.0%) |
| 12:00 PM to 3:59 PM | 9 (1.2%) | 30 (5.3%) |
| 4:00 PM to 11:59 PM | 17 (2.3%) | 20 (3.5%) |
| Total | 733 (100.0%) | 563 (100.0%) |
Housing Occupancy in Ness County
Occupancy by Ownership in Ness County
Of the total 1,144 dwellings in Ness County, owner-occupied units account for 927 (81.0%), while renter-occupied units make up 217 (19.0%).
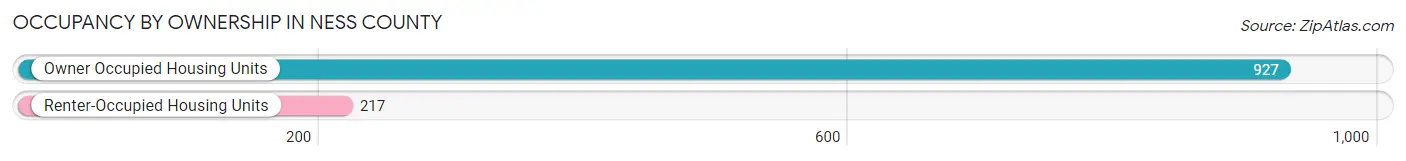
| Occupancy | # Housing Units | % Housing Units |
| Owner Occupied Housing Units | 927 | 81.0% |
| Renter-Occupied Housing Units | 217 | 19.0% |
| Total Occupied Housing Units | 1,144 | 100.0% |
Occupancy by Household Size in Ness County
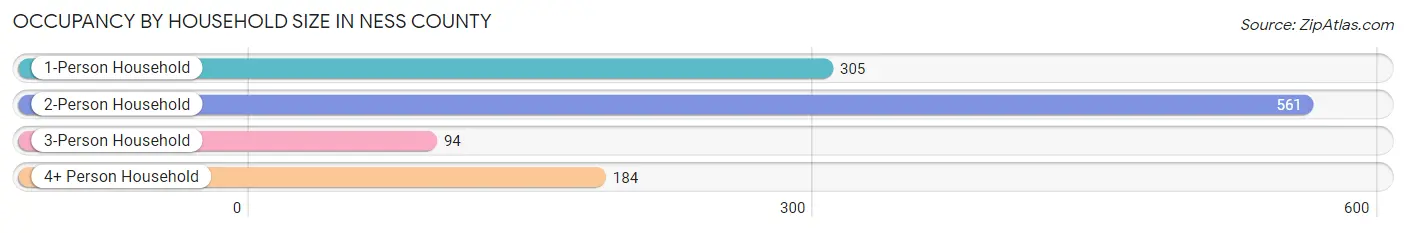
| Household Size | # Housing Units | % Housing Units |
| 1-Person Household | 305 | 26.7% |
| 2-Person Household | 561 | 49.0% |
| 3-Person Household | 94 | 8.2% |
| 4+ Person Household | 184 | 16.1% |
| Total Housing Units | 1,144 | 100.0% |
Occupancy by Ownership by Household Size in Ness County
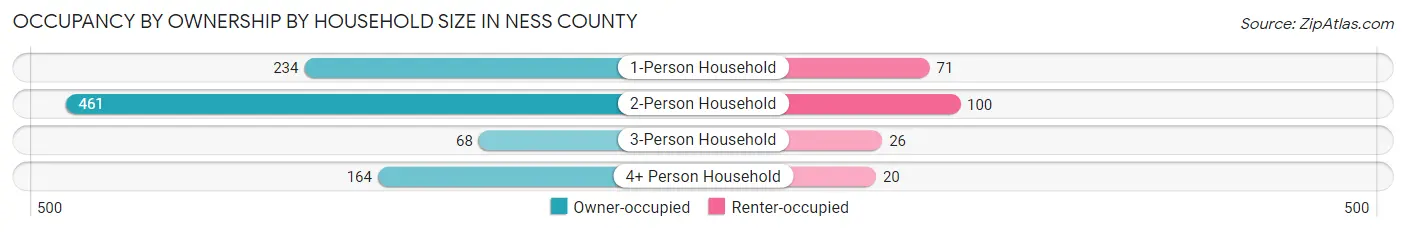
| Household Size | Owner-occupied | Renter-occupied |
| 1-Person Household | 234 (76.7%) | 71 (23.3%) |
| 2-Person Household | 461 (82.2%) | 100 (17.8%) |
| 3-Person Household | 68 (72.3%) | 26 (27.7%) |
| 4+ Person Household | 164 (89.1%) | 20 (10.9%) |
| Total Housing Units | 927 (81.0%) | 217 (19.0%) |
Occupancy by Educational Attainment in Ness County
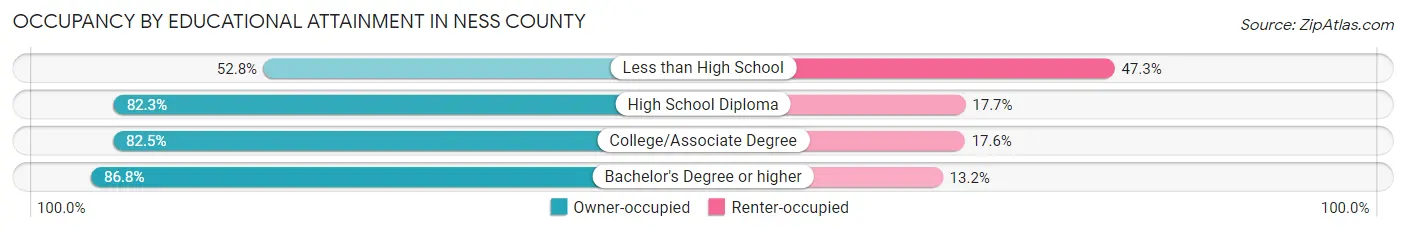
| Household Size | Owner-occupied | Renter-occupied |
| Less than High School | 48 (52.7%) | 43 (47.2%) |
| High School Diploma | 312 (82.3%) | 67 (17.7%) |
| College/Associate Degree | 343 (82.5%) | 73 (17.5%) |
| Bachelor's Degree or higher | 224 (86.8%) | 34 (13.2%) |
Occupancy by Age of Householder in Ness County
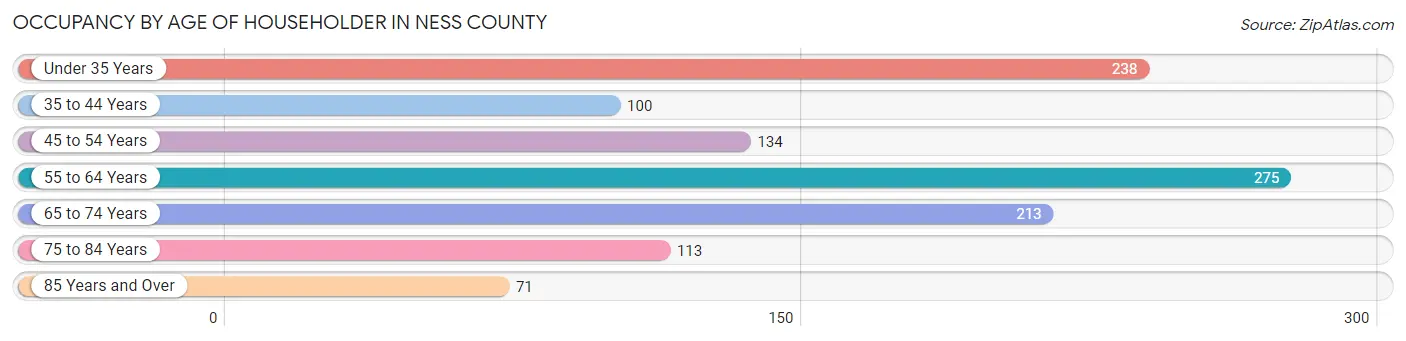
| Age Bracket | # Households | % Households |
| Under 35 Years | 238 | 20.8% |
| 35 to 44 Years | 100 | 8.7% |
| 45 to 54 Years | 134 | 11.7% |
| 55 to 64 Years | 275 | 24.0% |
| 65 to 74 Years | 213 | 18.6% |
| 75 to 84 Years | 113 | 9.9% |
| 85 Years and Over | 71 | 6.2% |
| Total | 1,144 | 100.0% |
Housing Finances in Ness County
Median Income by Occupancy in Ness County
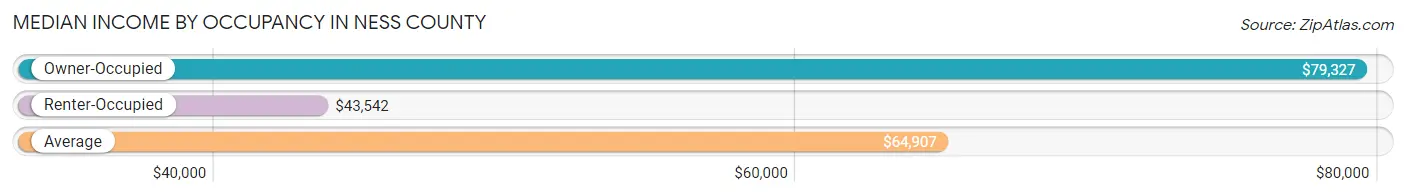
| Occupancy Type | # Households | Median Income |
| Owner-Occupied | 927 (81.0%) | $79,327 |
| Renter-Occupied | 217 (19.0%) | $43,542 |
| Average | 1,144 (100.0%) | $64,907 |
Occupancy by Householder Income Bracket in Ness County
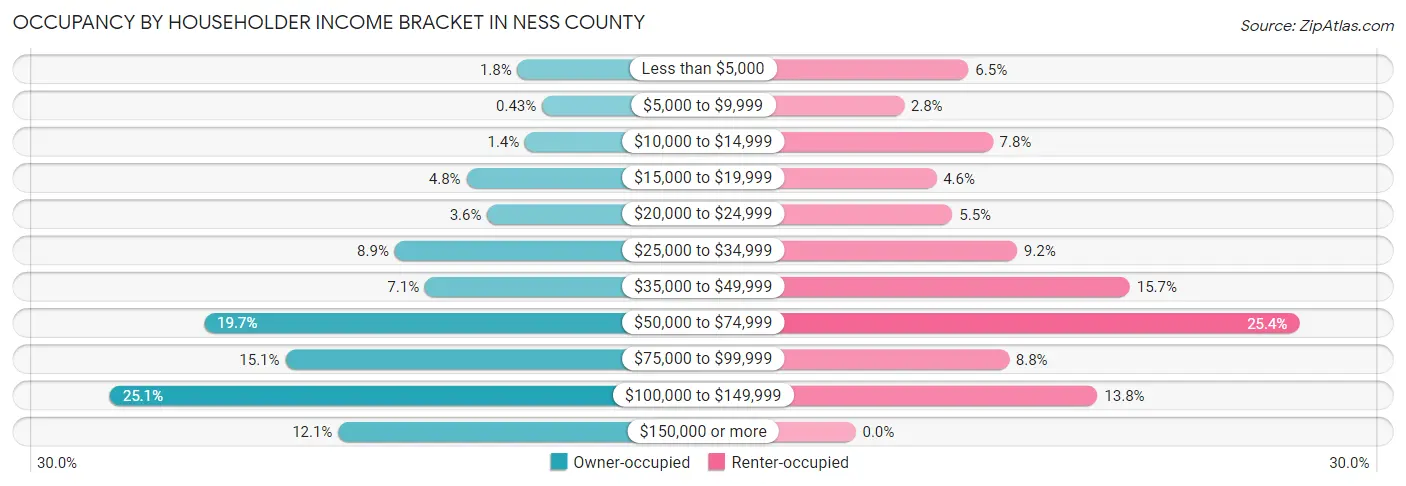
| Income Bracket | Owner-occupied | Renter-occupied |
| Less than $5,000 | 17 (1.8%) | 14 (6.5%) |
| $5,000 to $9,999 | 4 (0.4%) | 6 (2.8%) |
| $10,000 to $14,999 | 13 (1.4%) | 17 (7.8%) |
| $15,000 to $19,999 | 44 (4.8%) | 10 (4.6%) |
| $20,000 to $24,999 | 33 (3.6%) | 12 (5.5%) |
| $25,000 to $34,999 | 82 (8.8%) | 20 (9.2%) |
| $35,000 to $49,999 | 66 (7.1%) | 34 (15.7%) |
| $50,000 to $74,999 | 183 (19.7%) | 55 (25.4%) |
| $75,000 to $99,999 | 140 (15.1%) | 19 (8.8%) |
| $100,000 to $149,999 | 233 (25.1%) | 30 (13.8%) |
| $150,000 or more | 112 (12.1%) | 0 (0.0%) |
| Total | 927 (100.0%) | 217 (100.0%) |
Monthly Housing Cost Tiers in Ness County
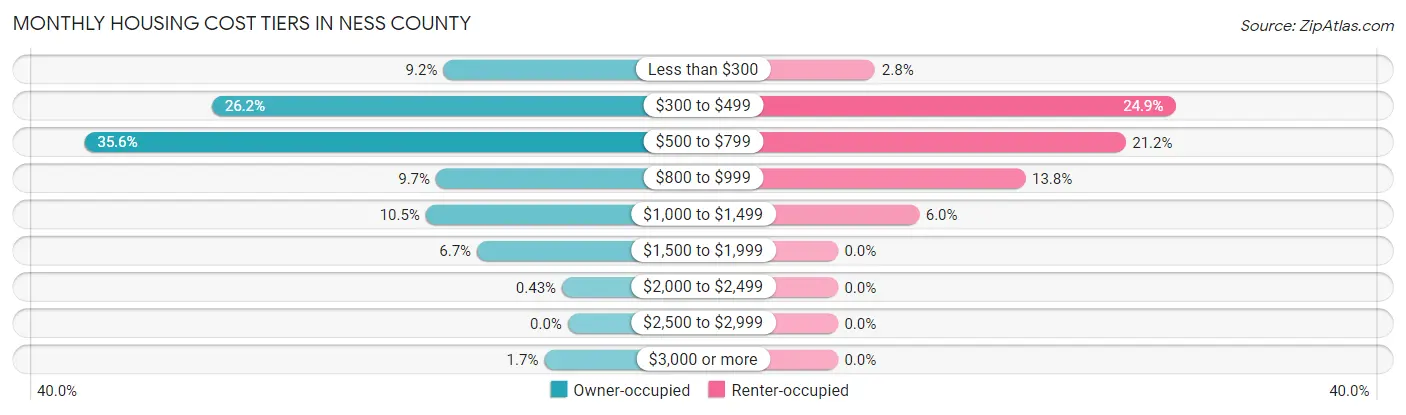
| Monthly Cost | Owner-occupied | Renter-occupied |
| Less than $300 | 85 (9.2%) | 6 (2.8%) |
| $300 to $499 | 243 (26.2%) | 54 (24.9%) |
| $500 to $799 | 330 (35.6%) | 46 (21.2%) |
| $800 to $999 | 90 (9.7%) | 30 (13.8%) |
| $1,000 to $1,499 | 97 (10.5%) | 13 (6.0%) |
| $1,500 to $1,999 | 62 (6.7%) | 0 (0.0%) |
| $2,000 to $2,499 | 4 (0.4%) | 0 (0.0%) |
| $2,500 to $2,999 | 0 (0.0%) | 0 (0.0%) |
| $3,000 or more | 16 (1.7%) | 0 (0.0%) |
| Total | 927 (100.0%) | 217 (100.0%) |
Physical Housing Characteristics in Ness County
Housing Structures in Ness County
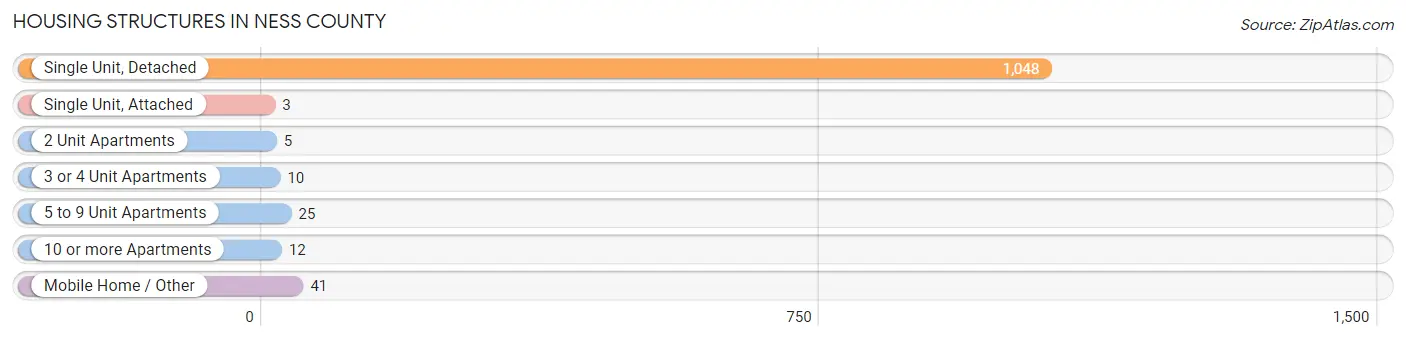
| Structure Type | # Housing Units | % Housing Units |
| Single Unit, Detached | 1,048 | 91.6% |
| Single Unit, Attached | 3 | 0.3% |
| 2 Unit Apartments | 5 | 0.4% |
| 3 or 4 Unit Apartments | 10 | 0.9% |
| 5 to 9 Unit Apartments | 25 | 2.2% |
| 10 or more Apartments | 12 | 1.1% |
| Mobile Home / Other | 41 | 3.6% |
| Total | 1,144 | 100.0% |
Housing Structures by Occupancy in Ness County
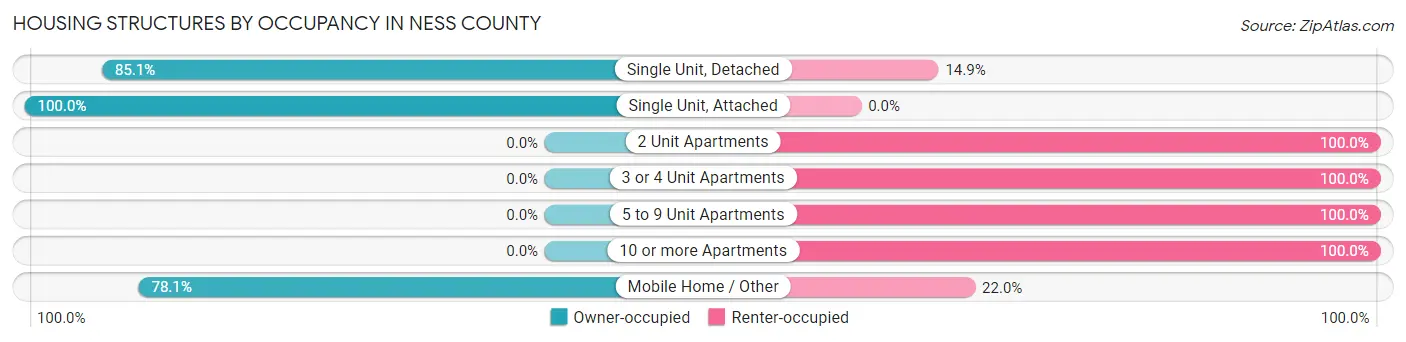
| Structure Type | Owner-occupied | Renter-occupied |
| Single Unit, Detached | 892 (85.1%) | 156 (14.9%) |
| Single Unit, Attached | 3 (100.0%) | 0 (0.0%) |
| 2 Unit Apartments | 0 (0.0%) | 5 (100.0%) |
| 3 or 4 Unit Apartments | 0 (0.0%) | 10 (100.0%) |
| 5 to 9 Unit Apartments | 0 (0.0%) | 25 (100.0%) |
| 10 or more Apartments | 0 (0.0%) | 12 (100.0%) |
| Mobile Home / Other | 32 (78.0%) | 9 (22.0%) |
| Total | 927 (81.0%) | 217 (19.0%) |
Housing Structures by Number of Rooms in Ness County
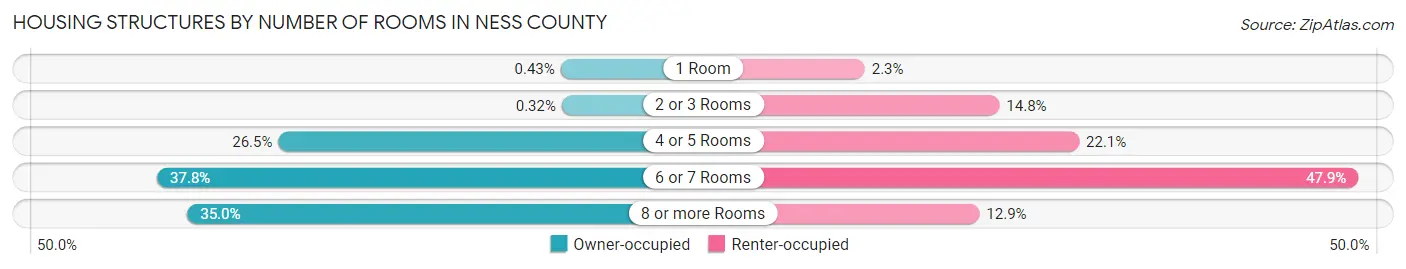
| Number of Rooms | Owner-occupied | Renter-occupied |
| 1 Room | 4 (0.4%) | 5 (2.3%) |
| 2 or 3 Rooms | 3 (0.3%) | 32 (14.7%) |
| 4 or 5 Rooms | 246 (26.5%) | 48 (22.1%) |
| 6 or 7 Rooms | 350 (37.8%) | 104 (47.9%) |
| 8 or more Rooms | 324 (34.9%) | 28 (12.9%) |
| Total | 927 (100.0%) | 217 (100.0%) |
Housing Structure by Heating Type in Ness County
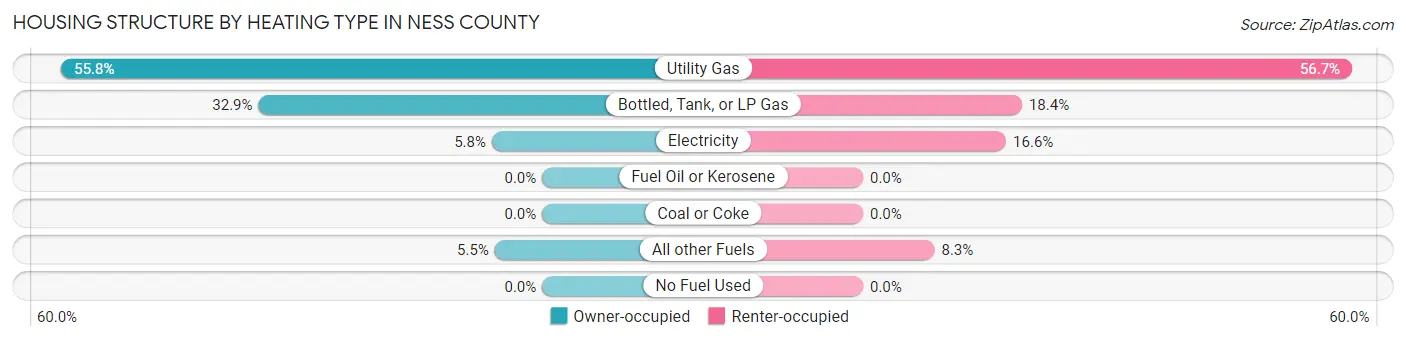
| Heating Type | Owner-occupied | Renter-occupied |
| Utility Gas | 517 (55.8%) | 123 (56.7%) |
| Bottled, Tank, or LP Gas | 305 (32.9%) | 40 (18.4%) |
| Electricity | 54 (5.8%) | 36 (16.6%) |
| Fuel Oil or Kerosene | 0 (0.0%) | 0 (0.0%) |
| Coal or Coke | 0 (0.0%) | 0 (0.0%) |
| All other Fuels | 51 (5.5%) | 18 (8.3%) |
| No Fuel Used | 0 (0.0%) | 0 (0.0%) |
| Total | 927 (100.0%) | 217 (100.0%) |
Household Vehicle Usage in Ness County
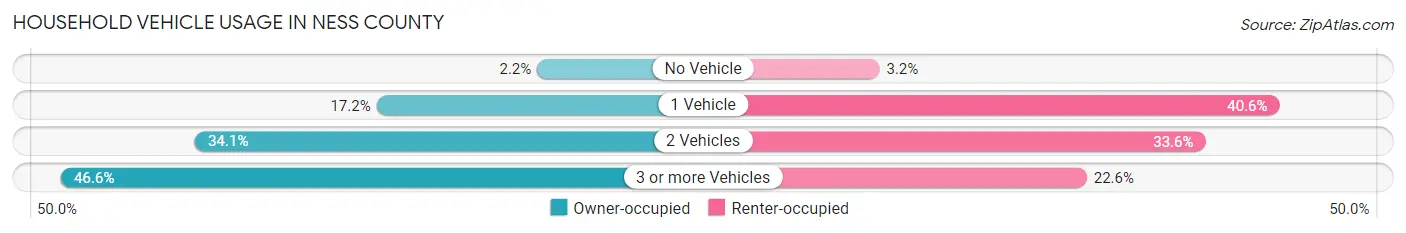
| Vehicles per Household | Owner-occupied | Renter-occupied |
| No Vehicle | 20 (2.2%) | 7 (3.2%) |
| 1 Vehicle | 159 (17.2%) | 88 (40.6%) |
| 2 Vehicles | 316 (34.1%) | 73 (33.6%) |
| 3 or more Vehicles | 432 (46.6%) | 49 (22.6%) |
| Total | 927 (100.0%) | 217 (100.0%) |
Real Estate & Mortgages in Ness County
Real Estate and Mortgage Overview in Ness County
| Characteristic | Without Mortgage | With Mortgage |
| Housing Units | 637 | 290 |
| Median Property Value | $74,900 | $97,300 |
| Median Household Income | $63,162 | $49 |
| Monthly Housing Costs | $494 | $16 |
| Real Estate Taxes | $1,408 | $0 |
Property Value by Mortgage Status in Ness County
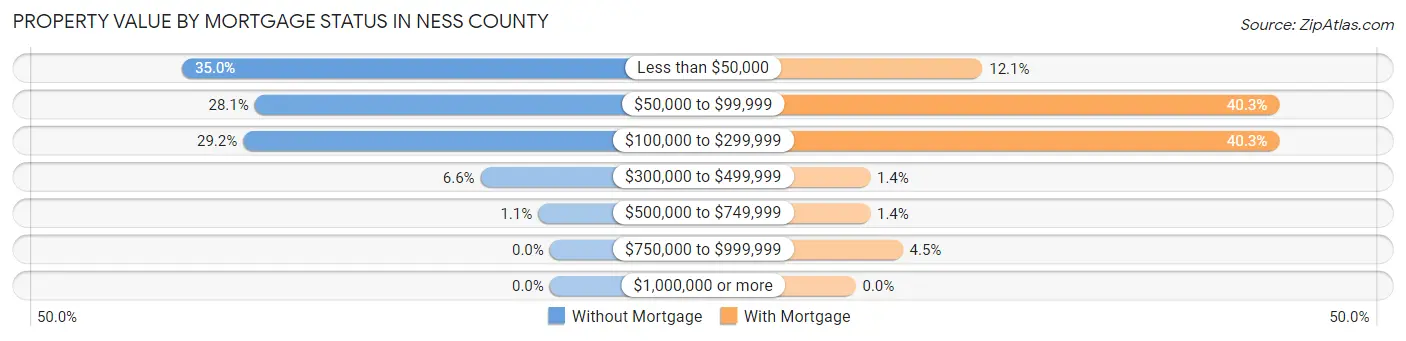
| Property Value | Without Mortgage | With Mortgage |
| Less than $50,000 | 223 (35.0%) | 35 (12.1%) |
| $50,000 to $99,999 | 179 (28.1%) | 117 (40.3%) |
| $100,000 to $299,999 | 186 (29.2%) | 117 (40.3%) |
| $300,000 to $499,999 | 42 (6.6%) | 4 (1.4%) |
| $500,000 to $749,999 | 7 (1.1%) | 4 (1.4%) |
| $750,000 to $999,999 | 0 (0.0%) | 13 (4.5%) |
| $1,000,000 or more | 0 (0.0%) | 0 (0.0%) |
| Total | 637 (100.0%) | 290 (100.0%) |
Household Income by Mortgage Status in Ness County
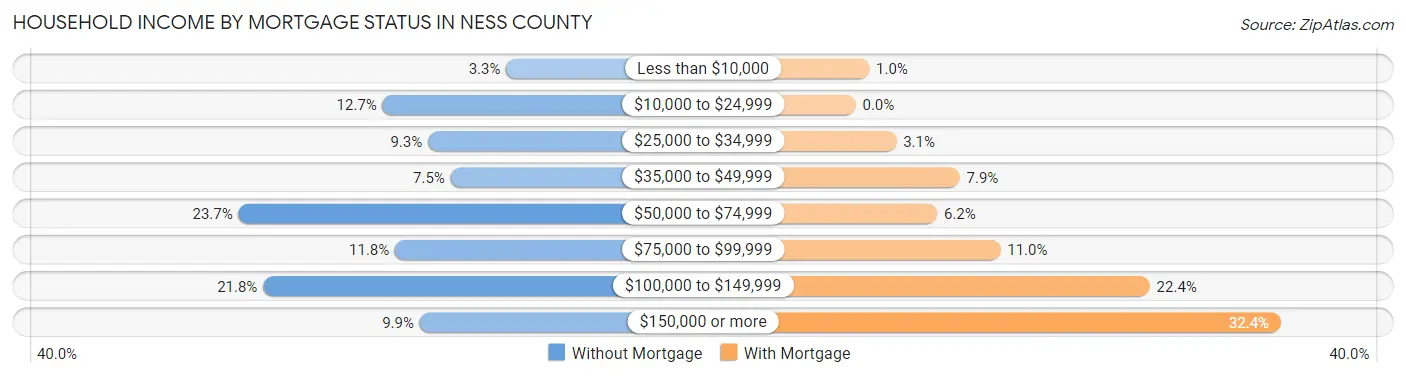
| Household Income | Without Mortgage | With Mortgage |
| Less than $10,000 | 21 (3.3%) | 3 (1.0%) |
| $10,000 to $24,999 | 81 (12.7%) | 0 (0.0%) |
| $25,000 to $34,999 | 59 (9.3%) | 9 (3.1%) |
| $35,000 to $49,999 | 48 (7.5%) | 23 (7.9%) |
| $50,000 to $74,999 | 151 (23.7%) | 18 (6.2%) |
| $75,000 to $99,999 | 75 (11.8%) | 32 (11.0%) |
| $100,000 to $149,999 | 139 (21.8%) | 65 (22.4%) |
| $150,000 or more | 63 (9.9%) | 94 (32.4%) |
| Total | 637 (100.0%) | 290 (100.0%) |
Property Value to Household Income Ratio in Ness County
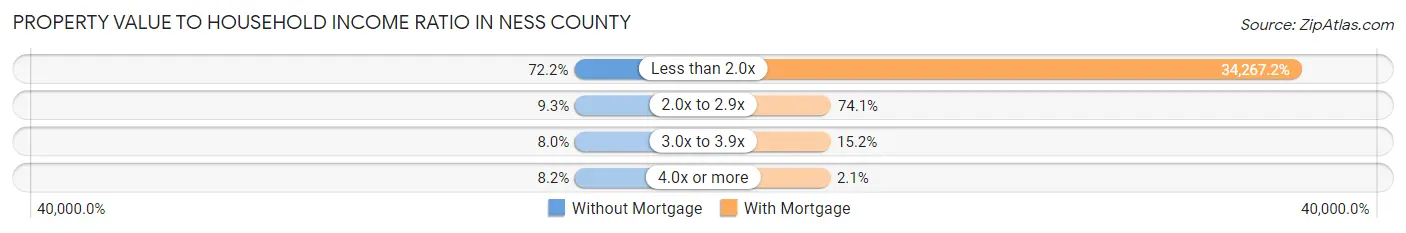
| Value-to-Income Ratio | Without Mortgage | With Mortgage |
| Less than 2.0x | 460 (72.2%) | 99,375 (34,267.2%) |
| 2.0x to 2.9x | 59 (9.3%) | 215 (74.1%) |
| 3.0x to 3.9x | 51 (8.0%) | 44 (15.2%) |
| 4.0x or more | 52 (8.2%) | 6 (2.1%) |
| Total | 637 (100.0%) | 290 (100.0%) |
Real Estate Taxes by Mortgage Status in Ness County
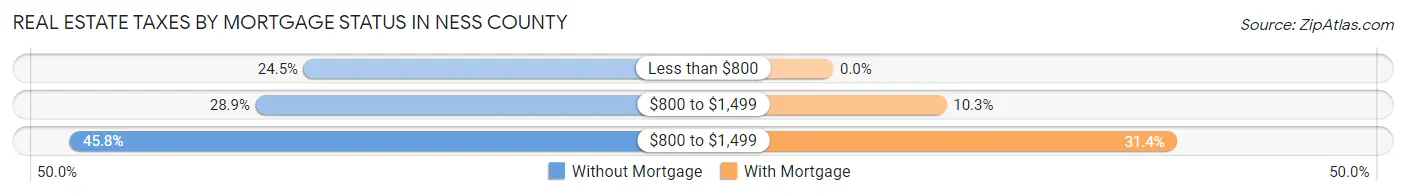
| Property Taxes | Without Mortgage | With Mortgage |
| Less than $800 | 156 (24.5%) | 0 (0.0%) |
| $800 to $1,499 | 184 (28.9%) | 30 (10.3%) |
| $800 to $1,499 | 292 (45.8%) | 91 (31.4%) |
| Total | 637 (100.0%) | 290 (100.0%) |
Health & Disability in Ness County
Health Insurance Coverage by Age in Ness County
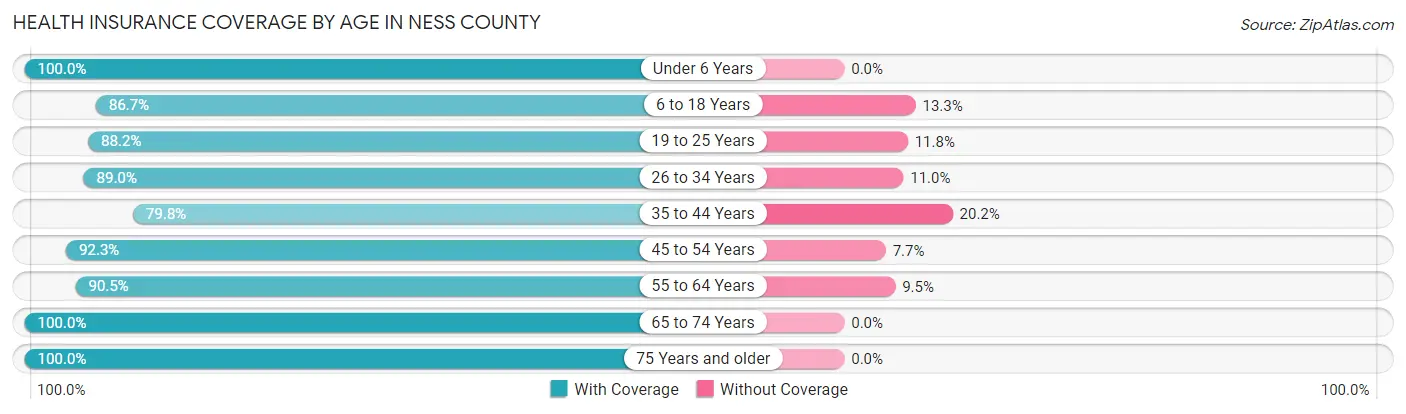
| Age Bracket | With Coverage | Without Coverage |
| Under 6 Years | 158 (100.0%) | 0 (0.0%) |
| 6 to 18 Years | 385 (86.7%) | 59 (13.3%) |
| 19 to 25 Years | 231 (88.2%) | 31 (11.8%) |
| 26 to 34 Years | 194 (89.0%) | 24 (11.0%) |
| 35 to 44 Years | 162 (79.8%) | 41 (20.2%) |
| 45 to 54 Years | 239 (92.3%) | 20 (7.7%) |
| 55 to 64 Years | 448 (90.5%) | 47 (9.5%) |
| 65 to 74 Years | 320 (100.0%) | 0 (0.0%) |
| 75 Years and older | 267 (100.0%) | 0 (0.0%) |
| Total | 2,404 (91.5%) | 222 (8.5%) |
Health Insurance Coverage by Citizenship Status in Ness County
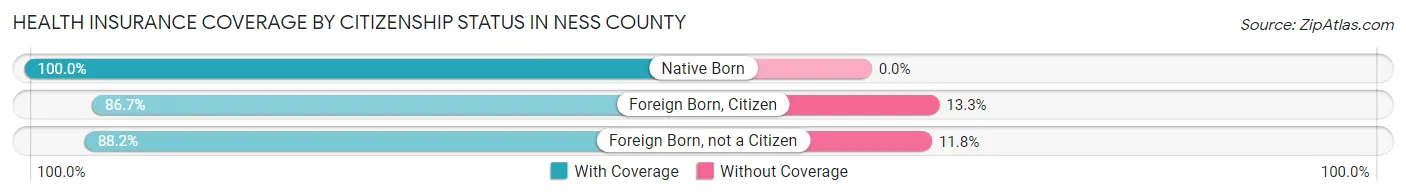
| Citizenship Status | With Coverage | Without Coverage |
| Native Born | 158 (100.0%) | 0 (0.0%) |
| Foreign Born, Citizen | 385 (86.7%) | 59 (13.3%) |
| Foreign Born, not a Citizen | 231 (88.2%) | 31 (11.8%) |
Health Insurance Coverage by Household Income in Ness County
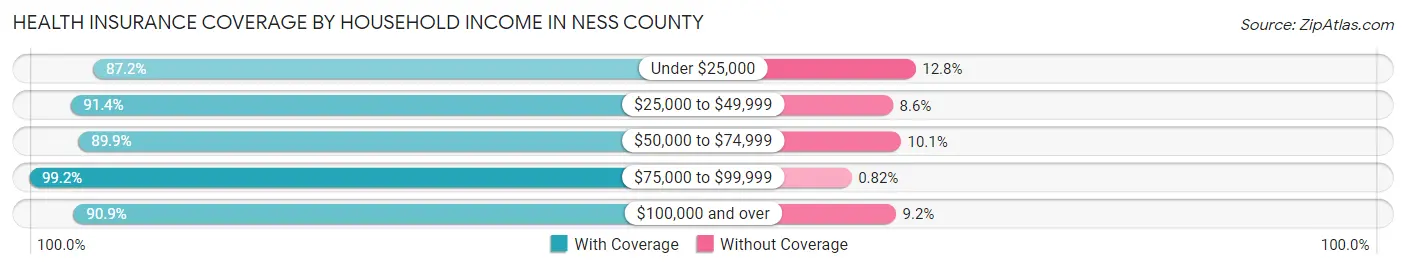
| Household Income | With Coverage | Without Coverage |
| Under $25,000 | 224 (87.2%) | 33 (12.8%) |
| $25,000 to $49,999 | 405 (91.4%) | 38 (8.6%) |
| $50,000 to $74,999 | 509 (89.9%) | 57 (10.1%) |
| $75,000 to $99,999 | 362 (99.2%) | 3 (0.8%) |
| $100,000 and over | 904 (90.8%) | 91 (9.1%) |
Public vs Private Health Insurance Coverage by Age in Ness County
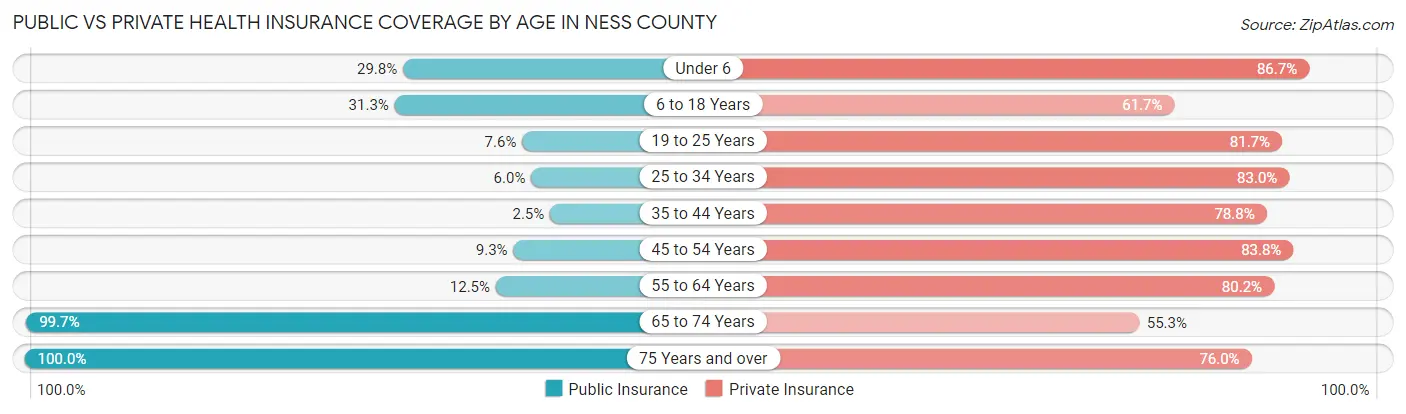
| Age Bracket | Public Insurance | Private Insurance |
| Under 6 | 47 (29.7%) | 137 (86.7%) |
| 6 to 18 Years | 139 (31.3%) | 274 (61.7%) |
| 19 to 25 Years | 20 (7.6%) | 214 (81.7%) |
| 25 to 34 Years | 13 (6.0%) | 181 (83.0%) |
| 35 to 44 Years | 5 (2.5%) | 160 (78.8%) |
| 45 to 54 Years | 24 (9.3%) | 217 (83.8%) |
| 55 to 64 Years | 62 (12.5%) | 397 (80.2%) |
| 65 to 74 Years | 319 (99.7%) | 177 (55.3%) |
| 75 Years and over | 267 (100.0%) | 203 (76.0%) |
| Total | 896 (34.1%) | 1,960 (74.6%) |
Disability Status by Sex by Age in Ness County
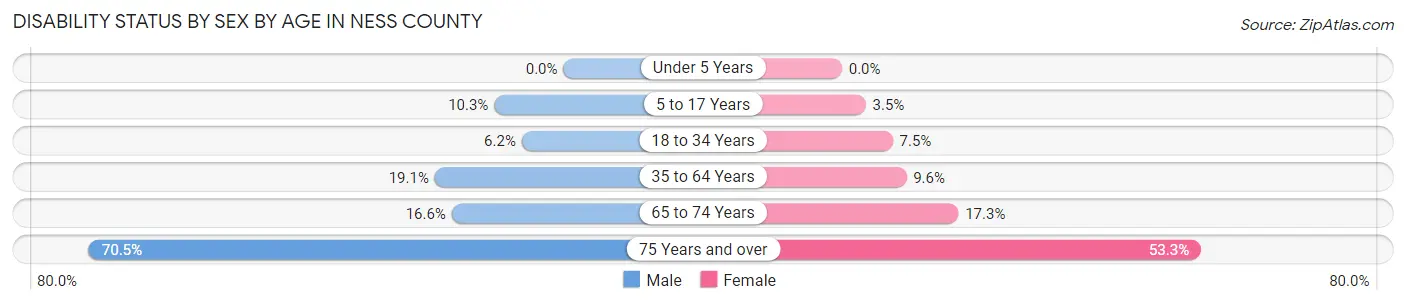
| Age Bracket | Male | Female |
| Under 5 Years | 0 (0.0%) | 0 (0.0%) |
| 5 to 17 Years | 23 (10.3%) | 7 (3.5%) |
| 18 to 34 Years | 17 (6.2%) | 19 (7.5%) |
| 35 to 64 Years | 93 (19.1%) | 45 (9.6%) |
| 65 to 74 Years | 31 (16.6%) | 23 (17.3%) |
| 75 Years and over | 93 (70.5%) | 72 (53.3%) |
Disability Class by Sex by Age in Ness County
Disability Class: Hearing Difficulty
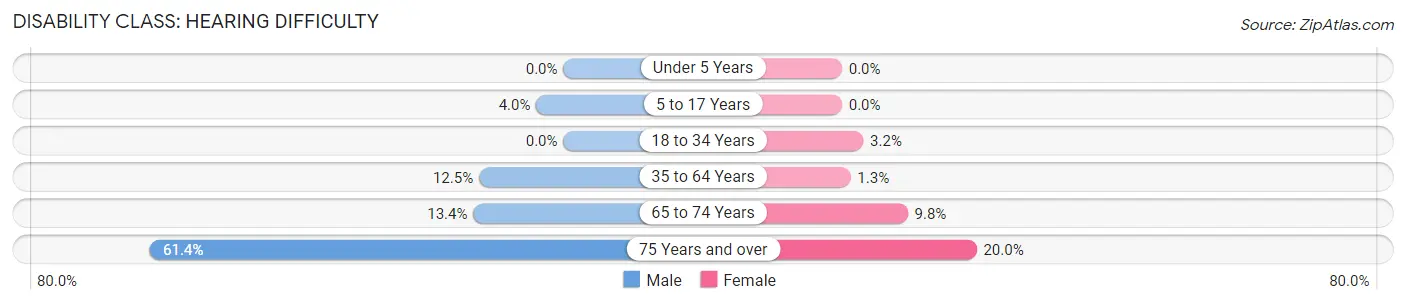
| Age Bracket | Male | Female |
| Under 5 Years | 0 (0.0%) | 0 (0.0%) |
| 5 to 17 Years | 9 (4.0%) | 0 (0.0%) |
| 18 to 34 Years | 0 (0.0%) | 8 (3.2%) |
| 35 to 64 Years | 61 (12.5%) | 6 (1.3%) |
| 65 to 74 Years | 25 (13.4%) | 13 (9.8%) |
| 75 Years and over | 81 (61.4%) | 27 (20.0%) |
Disability Class: Vision Difficulty
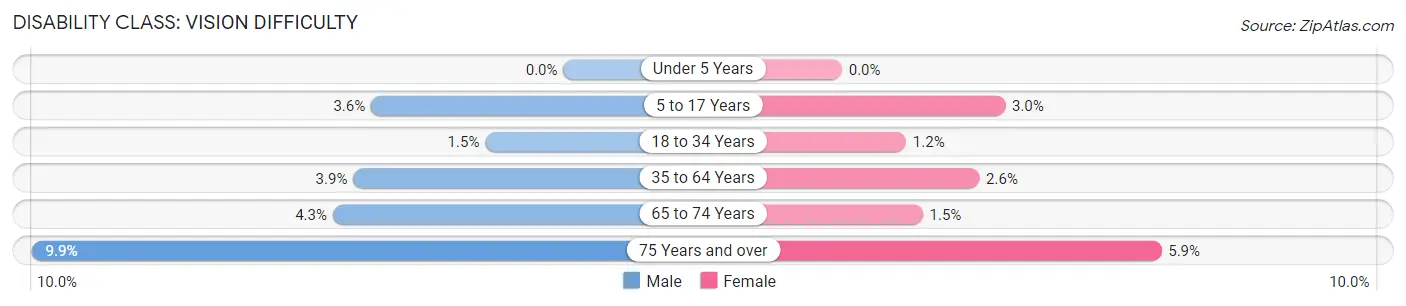
| Age Bracket | Male | Female |
| Under 5 Years | 0 (0.0%) | 0 (0.0%) |
| 5 to 17 Years | 8 (3.6%) | 6 (3.0%) |
| 18 to 34 Years | 4 (1.5%) | 3 (1.2%) |
| 35 to 64 Years | 19 (3.9%) | 12 (2.5%) |
| 65 to 74 Years | 8 (4.3%) | 2 (1.5%) |
| 75 Years and over | 13 (9.9%) | 8 (5.9%) |
Disability Class: Cognitive Difficulty
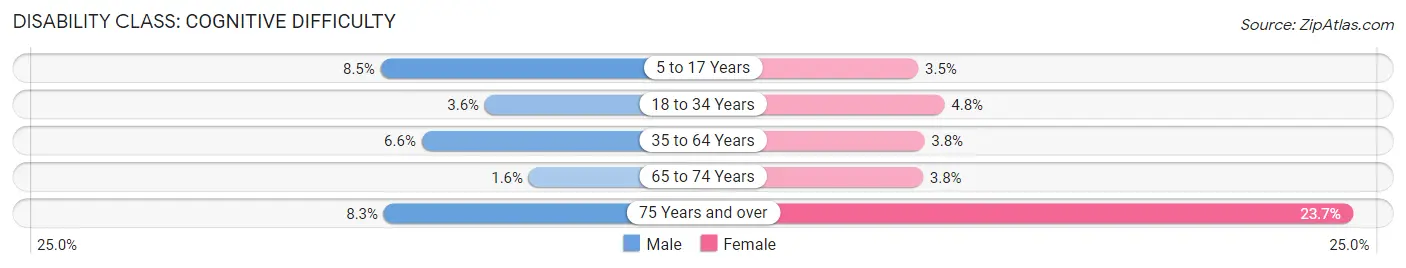
| Age Bracket | Male | Female |
| 5 to 17 Years | 19 (8.5%) | 7 (3.5%) |
| 18 to 34 Years | 10 (3.6%) | 12 (4.8%) |
| 35 to 64 Years | 32 (6.6%) | 18 (3.8%) |
| 65 to 74 Years | 3 (1.6%) | 5 (3.8%) |
| 75 Years and over | 11 (8.3%) | 32 (23.7%) |
Disability Class: Ambulatory Difficulty
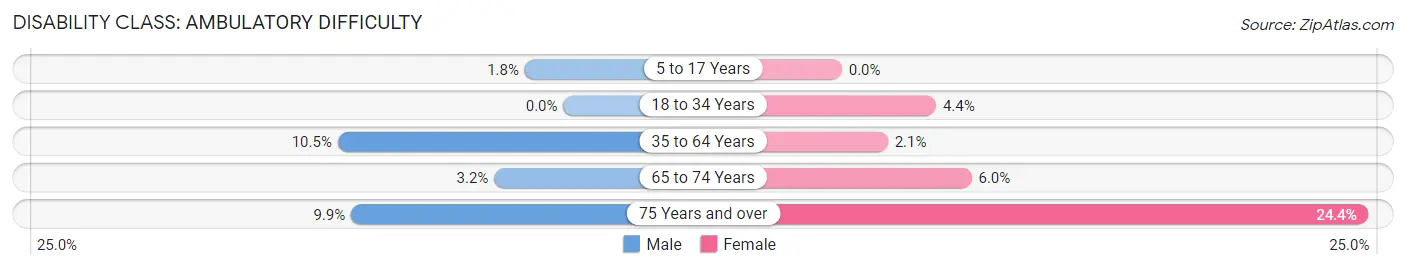
| Age Bracket | Male | Female |
| 5 to 17 Years | 4 (1.8%) | 0 (0.0%) |
| 18 to 34 Years | 0 (0.0%) | 11 (4.4%) |
| 35 to 64 Years | 51 (10.5%) | 10 (2.1%) |
| 65 to 74 Years | 6 (3.2%) | 8 (6.0%) |
| 75 Years and over | 13 (9.9%) | 33 (24.4%) |
Disability Class: Self-Care Difficulty
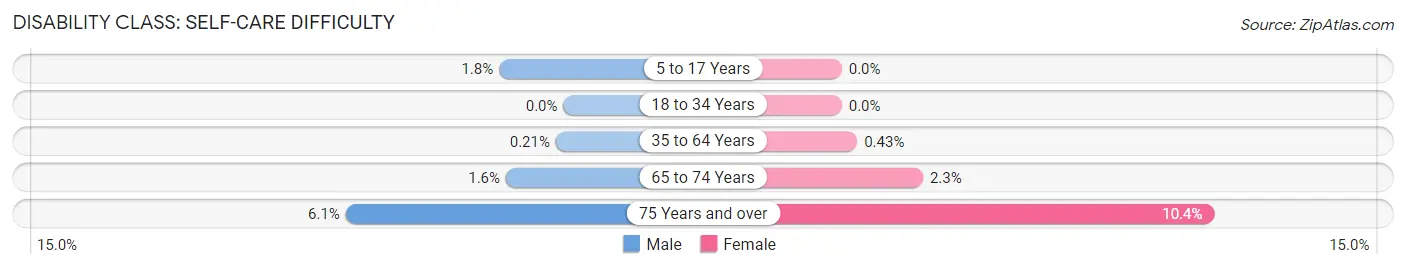
| Age Bracket | Male | Female |
| 5 to 17 Years | 4 (1.8%) | 0 (0.0%) |
| 18 to 34 Years | 0 (0.0%) | 0 (0.0%) |
| 35 to 64 Years | 1 (0.2%) | 2 (0.4%) |
| 65 to 74 Years | 3 (1.6%) | 3 (2.3%) |
| 75 Years and over | 8 (6.1%) | 14 (10.4%) |
Technology Access in Ness County
Computing Device Access in Ness County
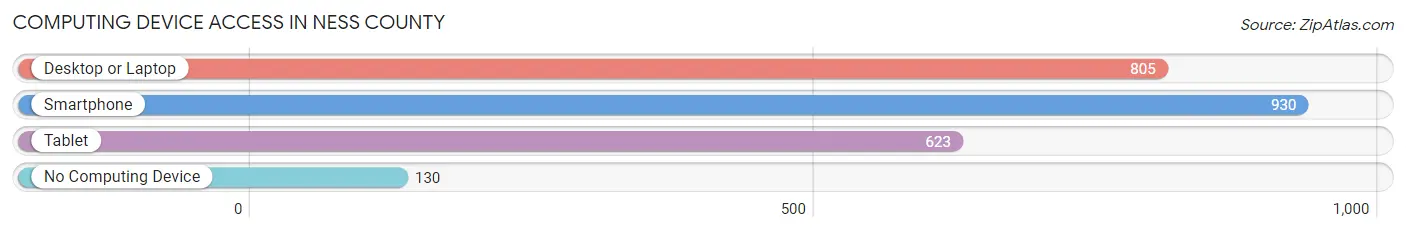
| Device Type | # Households | % Households |
| Desktop or Laptop | 805 | 70.4% |
| Smartphone | 930 | 81.3% |
| Tablet | 623 | 54.5% |
| No Computing Device | 130 | 11.4% |
| Total | 1,144 | 100.0% |
Internet Access in Ness County
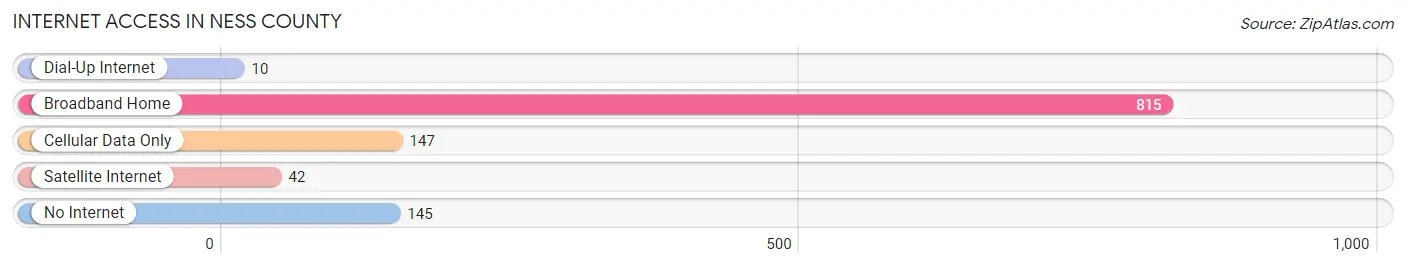
| Internet Type | # Households | % Households |
| Dial-Up Internet | 10 | 0.9% |
| Broadband Home | 815 | 71.2% |
| Cellular Data Only | 147 | 12.9% |
| Satellite Internet | 42 | 3.7% |
| No Internet | 145 | 12.7% |
| Total | 1,144 | 100.0% |
Ness County Summary
Ness County is located in the western part of the state of Kansas, in the Great Plains region of the United States. It is bordered by Hodgeman County to the north, Lane County to the east, Rush County to the south, and Pawnee County to the west. The county seat is Ness City, and the largest city is Ransom. As of the 2010 census, the population was 3,107, making it the second-least populous county in Kansas.
Geography
Ness County covers an area of 890 square miles, making it the fifth-smallest county in Kansas. The county is located in the High Plains region of the Great Plains, and is mostly flat with some rolling hills. The county is drained by the Arkansas River, which flows through the northern part of the county. The county is mostly covered in grassland, with some cropland and wooded areas.
Climate
Ness County has a semi-arid climate, with hot summers and cold winters. The average annual temperature is 54°F, and the average annual precipitation is 22 inches.
Demographics
As of the 2010 census, there were 3,107 people, 1,213 households, and 845 families living in Ness County. The population density was 3.5 people per square mile. The racial makeup of the county was 97.2% White, 0.3% Black or African American, 0.3% Native American, 0.2% Asian, 0.1% Pacific Islander, 0.7% from other races, and 1.2% from two or more races. Hispanic or Latino of any race were 2.2% of the population.
The median income for a household in the county was $41,944, and the median income for a family was $50,000. The per capita income for the county was $19,945. About 8.2% of families and 11.2% of the population were below the poverty line, including 14.2% of those under age 18 and 8.2% of those age 65 or over.
Economy
Agriculture is the main economic activity in Ness County. The county is home to a variety of crops, including wheat, corn, sorghum, soybeans, and sunflowers. Livestock production is also important, with cattle, hogs, and sheep being raised in the county.
The county also has a few small businesses, including a few restaurants, a grocery store, and a few retail stores. There is also a small manufacturing sector, with a few small factories producing a variety of products.
History
Ness County was established in 1867, and was named after Fort Ness, which was located in the area. The county was originally populated by Native Americans, and was later settled by European immigrants. The county was largely agricultural, and the population grew slowly over the years.
In the early 20th century, oil was discovered in the county, and the population began to grow rapidly. The oil industry was the main economic activity in the county for many years, and the population peaked in the 1950s. Since then, the population has declined, and the economy has shifted back to agriculture.
Common Questions
What is Per Capita Income in Ness County?
Per Capita income in Ness County is $39,978.
What is the Median Family Income in Ness County?
Median Family Income in Ness County is $91,042.
What is the Median Household income in Ness County?
Median Household Income in Ness County is $64,907.
What is Income or Wage Gap in Ness County?
Income or Wage Gap in Ness County is 58.8%.
Women in Ness County earn 41.2 cents for every dollar earned by a man.
What is Inequality or Gini Index in Ness County?
Inequality or Gini Index in Ness County is 0.44.
What is the Total Population of Ness County?
Total Population of Ness County is 2,677.
What is the Total Male Population of Ness County?
Total Male Population of Ness County is 1,370.
What is the Total Female Population of Ness County?
Total Female Population of Ness County is 1,307.
What is the Ratio of Males per 100 Females in Ness County?
There are 104.82 Males per 100 Females in Ness County.
What is the Ratio of Females per 100 Males in Ness County?
There are 95.40 Females per 100 Males in Ness County.
What is the Median Population Age in Ness County?
Median Population Age in Ness County is 48.4 Years.
What is the Average Family Size in Ness County
Average Family Size in Ness County is 2.8 People.
What is the Average Household Size in Ness County
Average Household Size in Ness County is 2.3 People.
How Large is the Labor Force in Ness County?
There are 1,431 People in the Labor Forcein in Ness County.
What is the Percentage of People in the Labor Force in Ness County?
64.3% of People are in the Labor Force in Ness County.
What is the Unemployment Rate in Ness County?
Unemployment Rate in Ness County is 0.6%.