Morton County, KS Map & Demographics
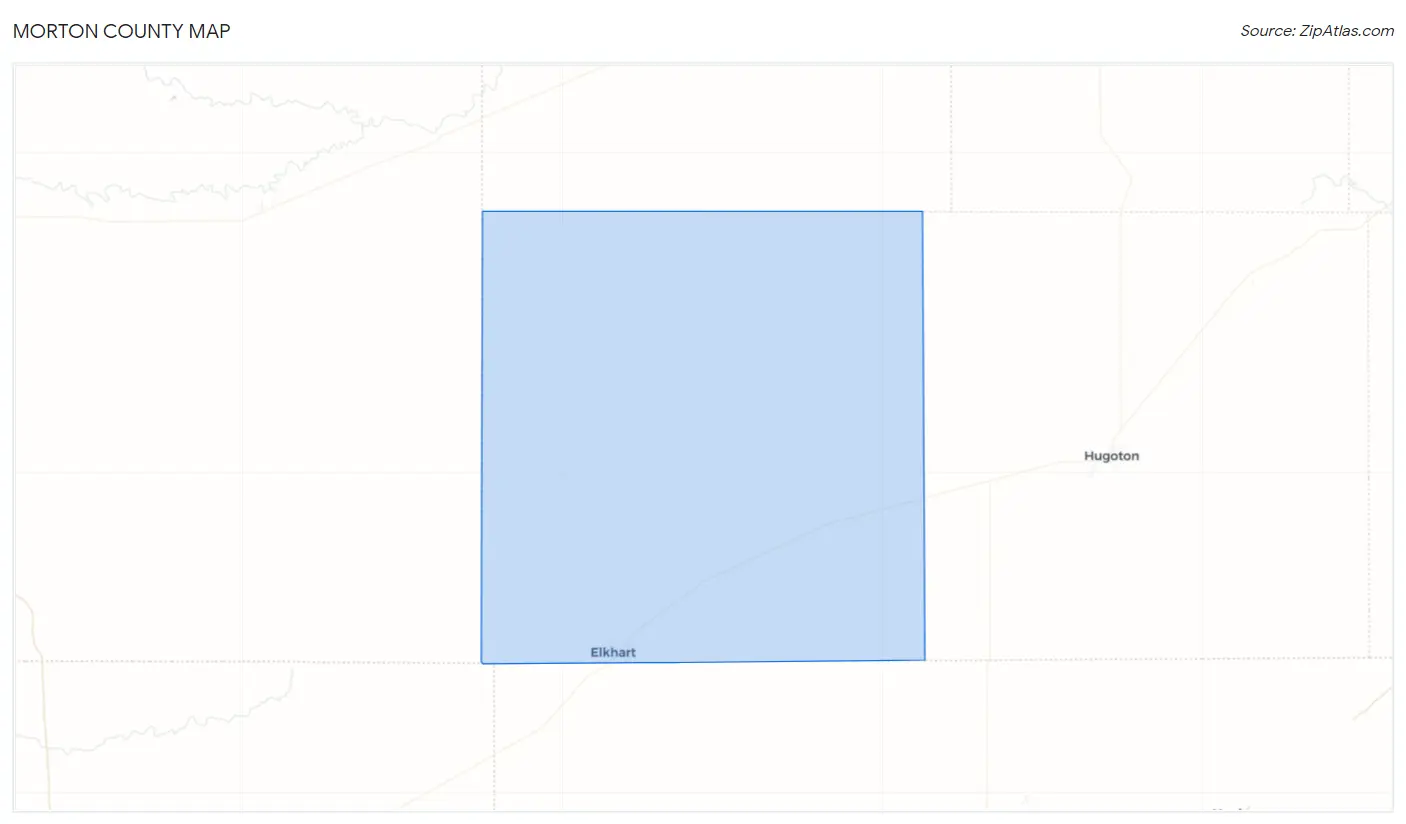
Morton County Map
Morton County Overview
$27,423
PER CAPITA INCOME
$80,563
AVG FAMILY INCOME
$57,943
AVG HOUSEHOLD INCOME
39.2%
WAGE / INCOME GAP [ % ]
60.8¢/ $1
WAGE / INCOME GAP [ $ ]
0.39
INEQUALITY / GINI INDEX
2,688
TOTAL POPULATION
1,268
MALE POPULATION
1,420
FEMALE POPULATION
89.30
MALES / 100 FEMALES
111.99
FEMALES / 100 MALES
39.5
MEDIAN AGE
3.9
AVG FAMILY SIZE
2.8
AVG HOUSEHOLD SIZE
1,220
LABOR FORCE [ PEOPLE ]
59.2%
PERCENT IN LABOR FORCE
3.3%
UNEMPLOYMENT RATE
Morton County Area Codes
Income in Morton County
Income Overview in Morton County
Per Capita Income in Morton County is $27,423, while median incomes of families and households are $80,563 and $57,943 respectively.
| Characteristic | Number | Measure |
| Per Capita Income | 2,688 | $27,423 |
| Median Family Income | 542 | $80,563 |
| Mean Family Income | 542 | $89,140 |
| Median Household Income | 939 | $57,943 |
| Mean Household Income | 939 | $72,181 |
| Income Deficit | 542 | $0 |
| Wage / Income Gap (%) | 2,688 | 39.16% |
| Wage / Income Gap ($) | 2,688 | 60.84¢ per $1 |
| Gini / Inequality Index | 2,688 | 0.39 |
Earnings by Sex in Morton County
Average Earnings in Morton County are $40,093, $49,489 for men and $30,110 for women, a difference of 39.2%.
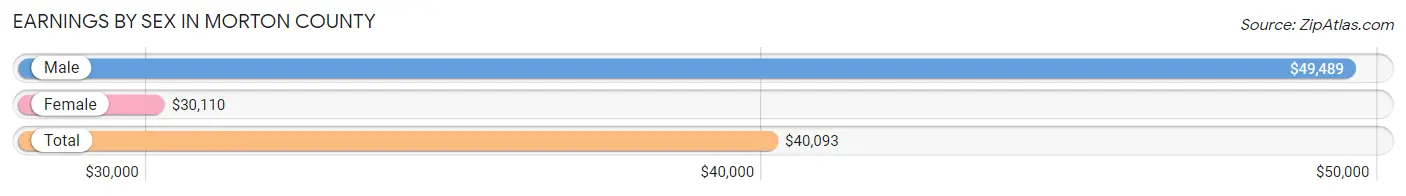
| Sex | Number | Average Earnings |
| Male | 651 (52.9%) | $49,489 |
| Female | 579 (47.1%) | $30,110 |
| Total | 1,230 (100.0%) | $40,093 |
Earnings by Sex by Income Bracket in Morton County
The most common earnings brackets in Morton County are $75,000 to $99,999 for men (118 | 18.1%) and $25,000 to $29,999 for women (132 | 22.8%).
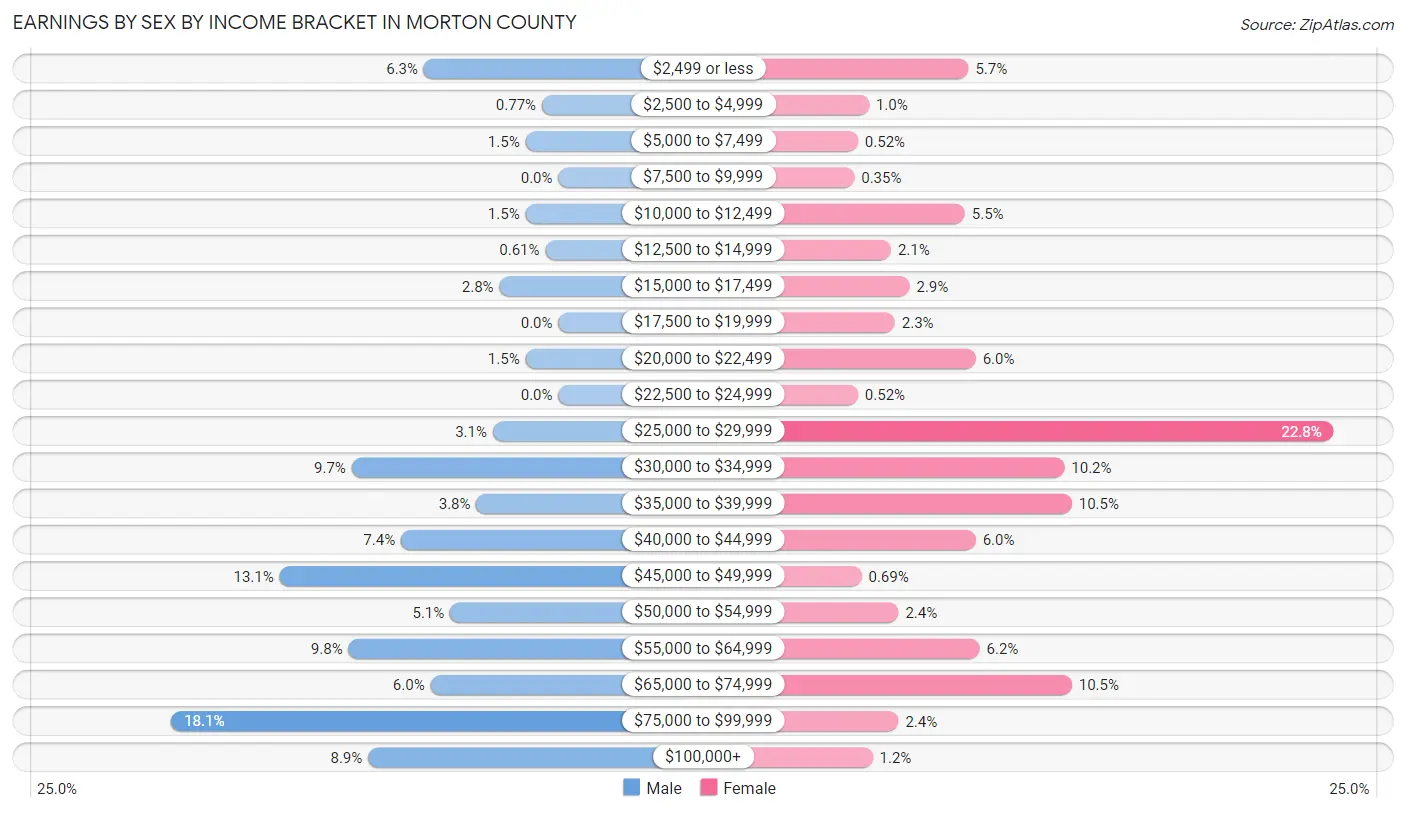
| Income | Male | Female |
| $2,499 or less | 41 (6.3%) | 33 (5.7%) |
| $2,500 to $4,999 | 5 (0.8%) | 6 (1.0%) |
| $5,000 to $7,499 | 10 (1.5%) | 3 (0.5%) |
| $7,500 to $9,999 | 0 (0.0%) | 2 (0.4%) |
| $10,000 to $12,499 | 10 (1.5%) | 32 (5.5%) |
| $12,500 to $14,999 | 4 (0.6%) | 12 (2.1%) |
| $15,000 to $17,499 | 18 (2.8%) | 17 (2.9%) |
| $17,500 to $19,999 | 0 (0.0%) | 13 (2.2%) |
| $20,000 to $22,499 | 10 (1.5%) | 35 (6.0%) |
| $22,500 to $24,999 | 0 (0.0%) | 3 (0.5%) |
| $25,000 to $29,999 | 20 (3.1%) | 132 (22.8%) |
| $30,000 to $34,999 | 63 (9.7%) | 59 (10.2%) |
| $35,000 to $39,999 | 25 (3.8%) | 61 (10.5%) |
| $40,000 to $44,999 | 48 (7.4%) | 35 (6.0%) |
| $45,000 to $49,999 | 85 (13.1%) | 4 (0.7%) |
| $50,000 to $54,999 | 33 (5.1%) | 14 (2.4%) |
| $55,000 to $64,999 | 64 (9.8%) | 36 (6.2%) |
| $65,000 to $74,999 | 39 (6.0%) | 61 (10.5%) |
| $75,000 to $99,999 | 118 (18.1%) | 14 (2.4%) |
| $100,000+ | 58 (8.9%) | 7 (1.2%) |
| Total | 651 (100.0%) | 579 (100.0%) |
Earnings by Sex by Educational Attainment in Morton County
Average earnings in Morton County are $50,956 for men and $32,059 for women, a difference of 37.1%. Men with an educational attainment of graduate degree enjoy the highest average annual earnings of $228,333, while those with bachelor's degree education earn the least with $45,987. Women with an educational attainment of graduate degree earn the most with the average annual earnings of $66,063, while those with high school diploma education have the smallest earnings of $28,415.
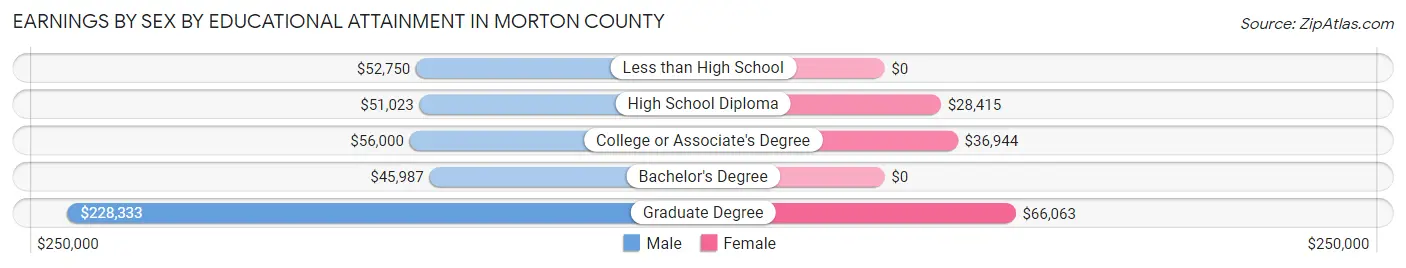
| Educational Attainment | Male Income | Female Income |
| Less than High School | $52,750 | $0 |
| High School Diploma | $51,023 | $28,415 |
| College or Associate's Degree | $56,000 | $36,944 |
| Bachelor's Degree | $45,987 | $0 |
| Graduate Degree | $228,333 | $66,063 |
| Total | $50,956 | $32,059 |
Family Income in Morton County
Family Income Brackets in Morton County
According to the Morton County family income data, there are 121 families falling into the $75,000 to $99,999 income range, which is the most common income bracket and makes up 22.3% of all families.
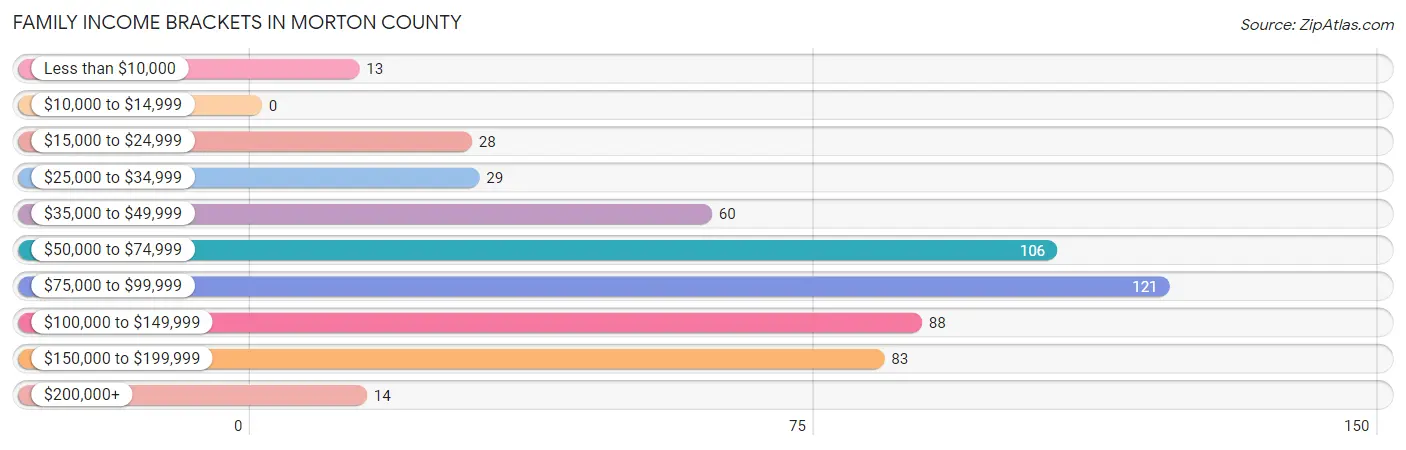
| Income Bracket | # Families | % Families |
| Less than $10,000 | 13 | 2.4% |
| $10,000 to $14,999 | 0 | 0.0% |
| $15,000 to $24,999 | 28 | 5.2% |
| $25,000 to $34,999 | 29 | 5.4% |
| $35,000 to $49,999 | 60 | 11.1% |
| $50,000 to $74,999 | 106 | 19.6% |
| $75,000 to $99,999 | 121 | 22.3% |
| $100,000 to $149,999 | 88 | 16.2% |
| $150,000 to $199,999 | 83 | 15.3% |
| $200,000+ | 14 | 2.6% |
Family Income by Famaliy Size in Morton County
5-person families (56 | 10.3%) account for the highest median family income in Morton County with $126,250 per family, while 2-person families (225 | 41.5%) have the highest median income of $31,682 per family member.
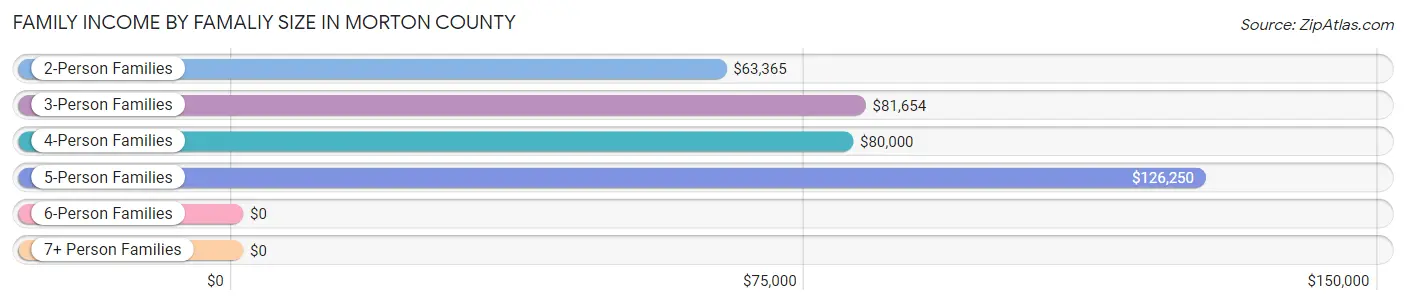
| Income Bracket | # Families | Median Income |
| 2-Person Families | 225 (41.5%) | $63,365 |
| 3-Person Families | 145 (26.8%) | $81,654 |
| 4-Person Families | 104 (19.2%) | $80,000 |
| 5-Person Families | 56 (10.3%) | $126,250 |
| 6-Person Families | 12 (2.2%) | $0 |
| 7+ Person Families | 0 (0.0%) | $0 |
| Total | 542 (100.0%) | $80,563 |
Family Income by Number of Earners in Morton County
The median family income in Morton County is $80,563, with families comprising 3+ earners (49) having the highest median family income of $155,724, while families with 1 earner (193) have the lowest median family income of $54,076, accounting for 9.0% and 35.6% of families, respectively.
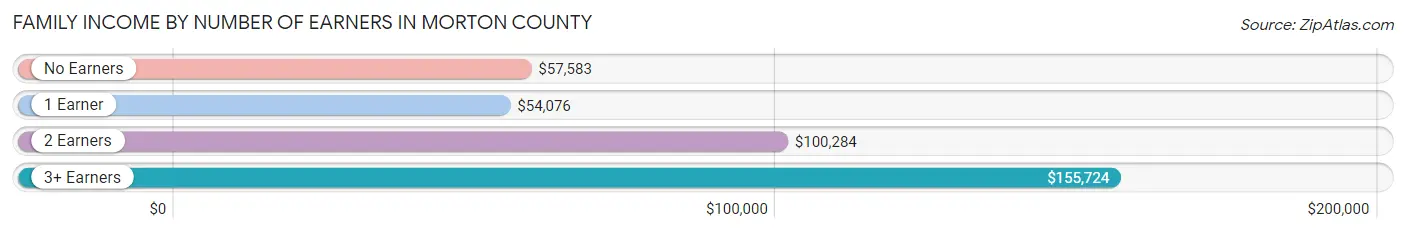
| Number of Earners | # Families | Median Income |
| No Earners | 67 (12.4%) | $57,583 |
| 1 Earner | 193 (35.6%) | $54,076 |
| 2 Earners | 233 (43.0%) | $100,284 |
| 3+ Earners | 49 (9.0%) | $155,724 |
| Total | 542 (100.0%) | $80,563 |
Household Income in Morton County
Household Income Brackets in Morton County
With 196 households falling in the category, the $50,000 to $74,999 income range is the most frequent in Morton County, accounting for 20.9% of all households. In contrast, only 17 households (1.8%) fall into the $200,000+ income bracket, making it the least populous group.
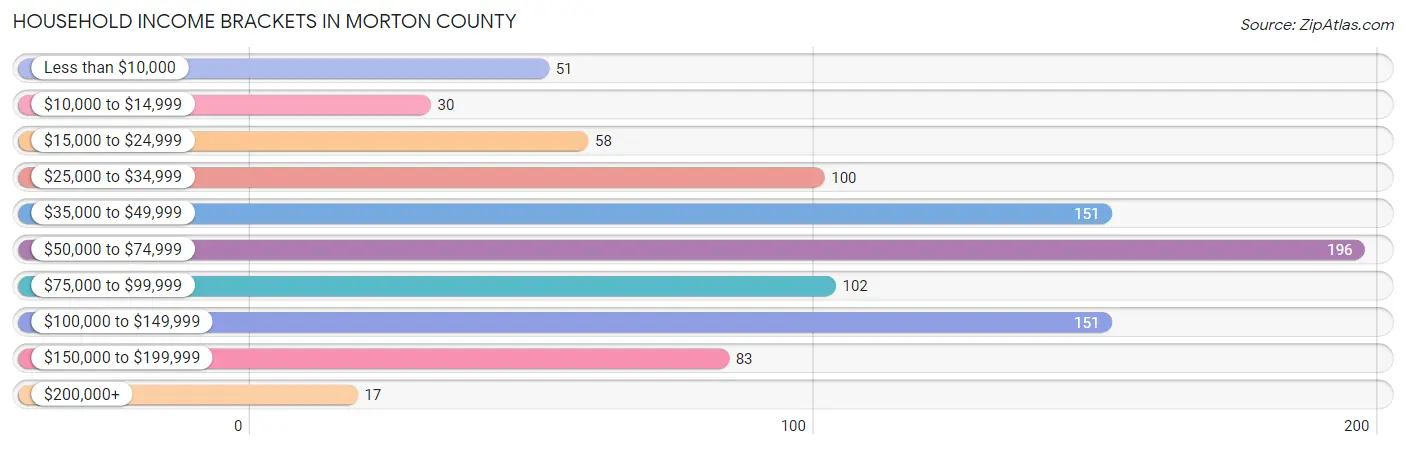
| Income Bracket | # Households | % Households |
| Less than $10,000 | 51 | 5.4% |
| $10,000 to $14,999 | 30 | 3.2% |
| $15,000 to $24,999 | 58 | 6.2% |
| $25,000 to $34,999 | 100 | 10.6% |
| $35,000 to $49,999 | 151 | 16.1% |
| $50,000 to $74,999 | 196 | 20.9% |
| $75,000 to $99,999 | 102 | 10.9% |
| $100,000 to $149,999 | 151 | 16.1% |
| $150,000 to $199,999 | 83 | 8.8% |
| $200,000+ | 17 | 1.8% |
Household Income by Householder Age in Morton County
The median household income in Morton County is $57,943, with the highest median household income of $77,625 found in the 25 to 44 years age bracket for the primary householder. A total of 261 households (27.8%) fall into this category. Meanwhile, the 15 to 24 years age bracket for the primary householder has the lowest median household income of $0, with 6 households (0.6%) in this group.
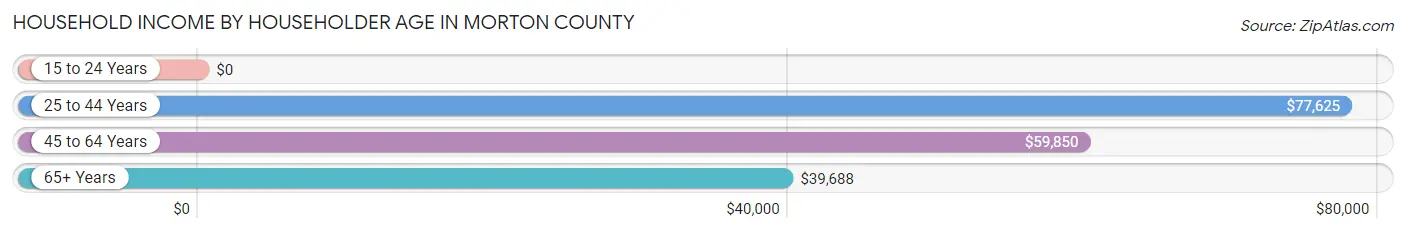
| Income Bracket | # Households | Median Income |
| 15 to 24 Years | 6 (0.6%) | $0 |
| 25 to 44 Years | 261 (27.8%) | $77,625 |
| 45 to 64 Years | 375 (39.9%) | $59,850 |
| 65+ Years | 297 (31.6%) | $39,688 |
| Total | 939 (100.0%) | $57,943 |
Poverty in Morton County
Income Below Poverty by Sex and Age in Morton County
With 11.3% poverty level for males and 14.8% for females among the residents of Morton County, 65 to 74 year old males and 5 year old females are the most vulnerable to poverty, with 32 males (22.4%) and 7 females (77.8%) in their respective age groups living below the poverty level.
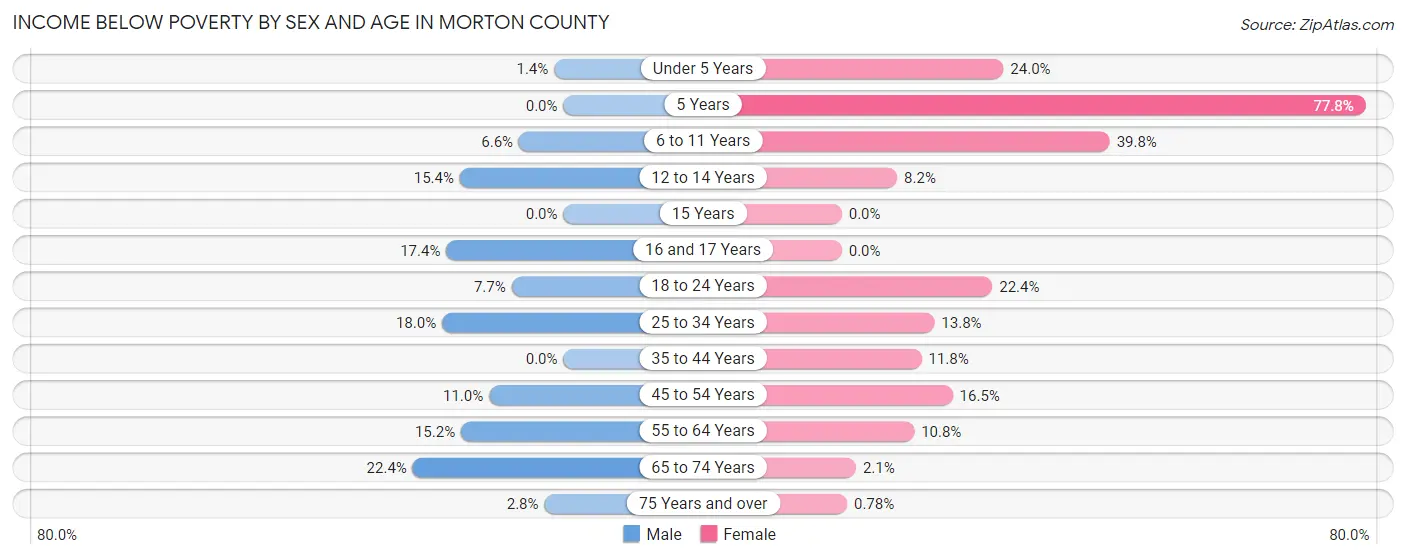
| Age Bracket | Male | Female |
| Under 5 Years | 1 (1.4%) | 12 (24.0%) |
| 5 Years | 0 (0.0%) | 7 (77.8%) |
| 6 to 11 Years | 7 (6.6%) | 72 (39.8%) |
| 12 to 14 Years | 6 (15.4%) | 6 (8.2%) |
| 15 Years | 0 (0.0%) | 0 (0.0%) |
| 16 and 17 Years | 4 (17.4%) | 0 (0.0%) |
| 18 to 24 Years | 4 (7.7%) | 19 (22.4%) |
| 25 to 34 Years | 40 (18.0%) | 22 (13.8%) |
| 35 to 44 Years | 0 (0.0%) | 18 (11.8%) |
| 45 to 54 Years | 16 (11.0%) | 27 (16.5%) |
| 55 to 64 Years | 26 (15.2%) | 20 (10.7%) |
| 65 to 74 Years | 32 (22.4%) | 3 (2.1%) |
| 75 Years and over | 2 (2.8%) | 1 (0.8%) |
| Total | 138 (11.3%) | 207 (14.8%) |
Income Above Poverty by Sex and Age in Morton County
According to the poverty statistics in Morton County, males aged 5 years and females aged 15 years are the age groups that are most secure financially, with 100.0% of males and 100.0% of females in these age groups living above the poverty line.
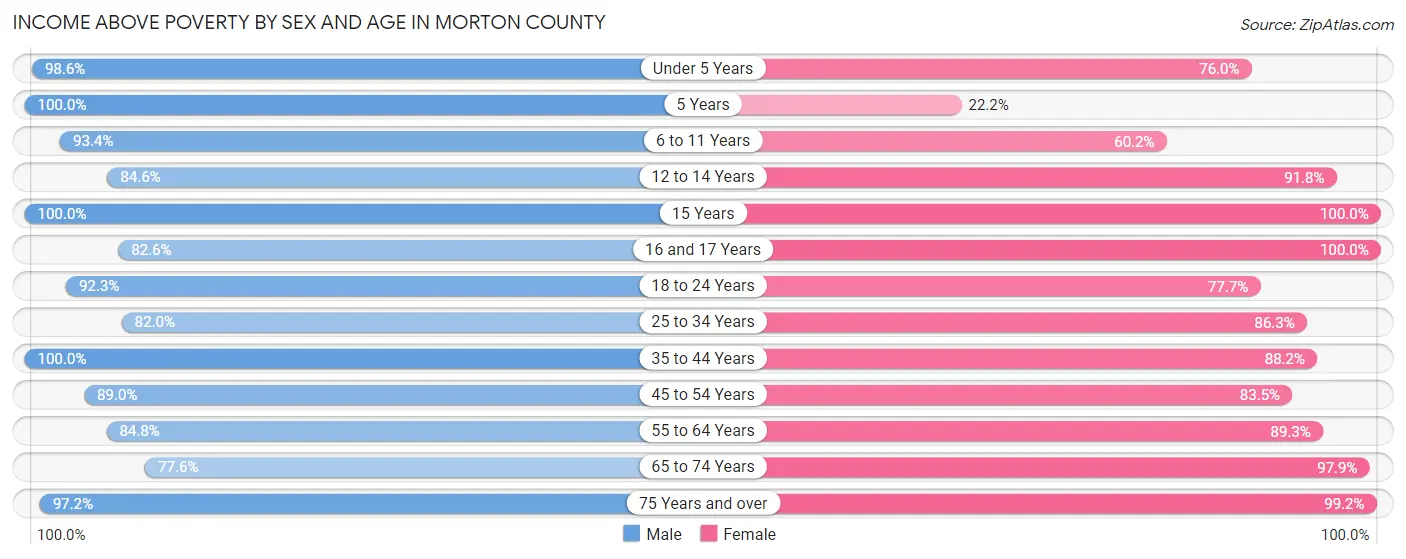
| Age Bracket | Male | Female |
| Under 5 Years | 72 (98.6%) | 38 (76.0%) |
| 5 Years | 65 (100.0%) | 2 (22.2%) |
| 6 to 11 Years | 99 (93.4%) | 109 (60.2%) |
| 12 to 14 Years | 33 (84.6%) | 67 (91.8%) |
| 15 Years | 5 (100.0%) | 27 (100.0%) |
| 16 and 17 Years | 19 (82.6%) | 36 (100.0%) |
| 18 to 24 Years | 48 (92.3%) | 66 (77.6%) |
| 25 to 34 Years | 182 (82.0%) | 138 (86.3%) |
| 35 to 44 Years | 105 (100.0%) | 134 (88.2%) |
| 45 to 54 Years | 129 (89.0%) | 137 (83.5%) |
| 55 to 64 Years | 145 (84.8%) | 166 (89.2%) |
| 65 to 74 Years | 111 (77.6%) | 140 (97.9%) |
| 75 Years and over | 69 (97.2%) | 128 (99.2%) |
| Total | 1,082 (88.7%) | 1,188 (85.2%) |
Income Below Poverty Among Married-Couple Families in Morton County
The poverty statistics for married-couple families in Morton County show that 5.7% or 24 of the total 419 families live below the poverty line. Families with 1 or 2 children have the highest poverty rate of 7.3%, comprising of 12 families. On the other hand, families with 3 or 4 children have the lowest poverty rate of 0.0%, which includes 0 families.
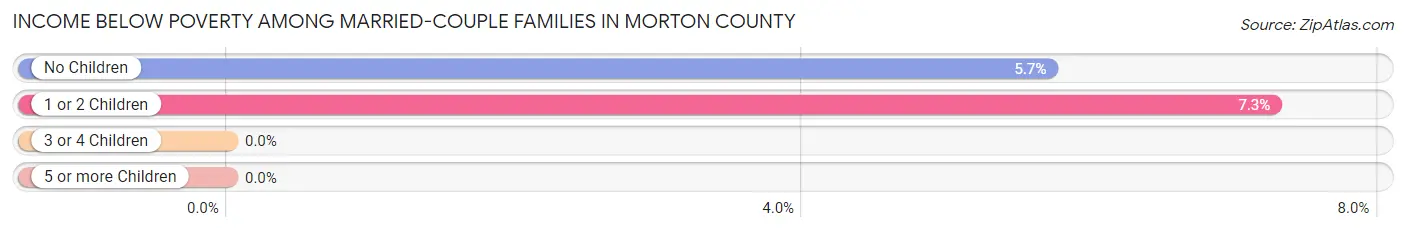
| Children | Above Poverty | Below Poverty |
| No Children | 198 (94.3%) | 12 (5.7%) |
| 1 or 2 Children | 153 (92.7%) | 12 (7.3%) |
| 3 or 4 Children | 44 (100.0%) | 0 (0.0%) |
| 5 or more Children | 0 (0.0%) | 0 (0.0%) |
| Total | 395 (94.3%) | 24 (5.7%) |
Income Below Poverty Among Single-Parent Households in Morton County
According to the poverty data in Morton County, 16.7% or 13 single-father households and 33.3% or 15 single-mother households are living below the poverty line. Among single-father households, those with 3 or 4 children have the highest poverty rate, with 8 households (100.0%) experiencing poverty. Likewise, among single-mother households, those with 1 or 2 children have the highest poverty rate, with 15 households (45.5%) falling below the poverty line.
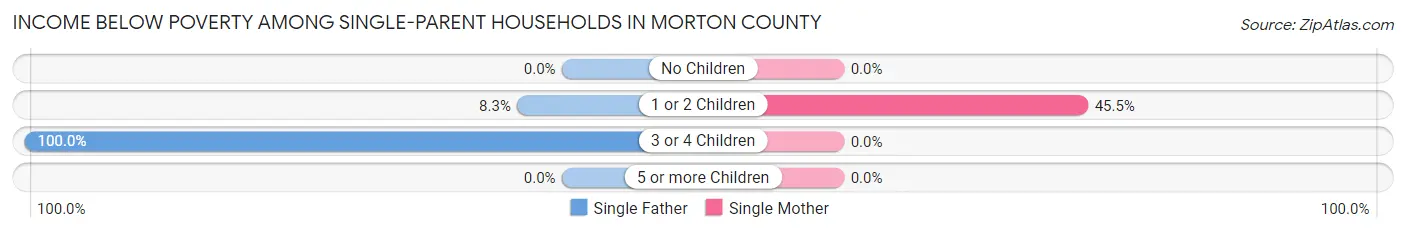
| Children | Single Father | Single Mother |
| No Children | 0 (0.0%) | 0 (0.0%) |
| 1 or 2 Children | 5 (8.3%) | 15 (45.5%) |
| 3 or 4 Children | 8 (100.0%) | 0 (0.0%) |
| 5 or more Children | 0 (0.0%) | 0 (0.0%) |
| Total | 13 (16.7%) | 15 (33.3%) |
Income Below Poverty Among Married-Couple vs Single-Parent Households in Morton County
The poverty data for Morton County shows that 24 of the married-couple family households (5.7%) and 28 of the single-parent households (22.8%) are living below the poverty level. Within the married-couple family households, those with 1 or 2 children have the highest poverty rate, with 12 households (7.3%) falling below the poverty line. Among the single-parent households, those with 3 or 4 children have the highest poverty rate, with 8 household (100.0%) living below poverty.
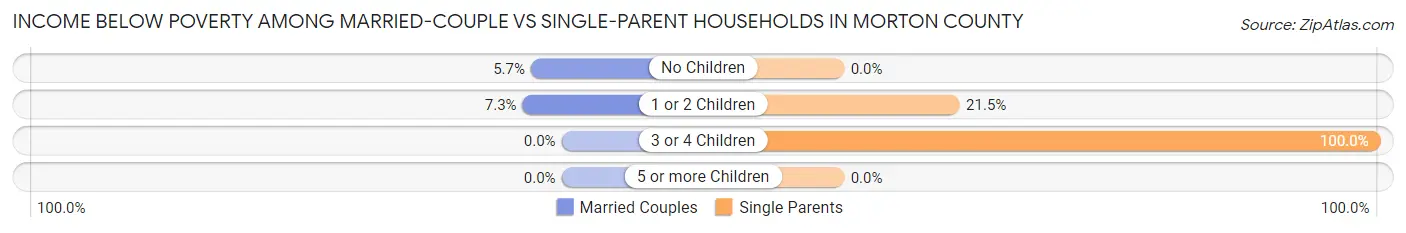
| Children | Married-Couple Families | Single-Parent Households |
| No Children | 12 (5.7%) | 0 (0.0%) |
| 1 or 2 Children | 12 (7.3%) | 20 (21.5%) |
| 3 or 4 Children | 0 (0.0%) | 8 (100.0%) |
| 5 or more Children | 0 (0.0%) | 0 (0.0%) |
| Total | 24 (5.7%) | 28 (22.8%) |
Race in Morton County
The most populous races in Morton County are White / Caucasian (2,230 | 83.0%), Hispanic or Latino (643 | 23.9%), and Two or more Races (353 | 13.1%).
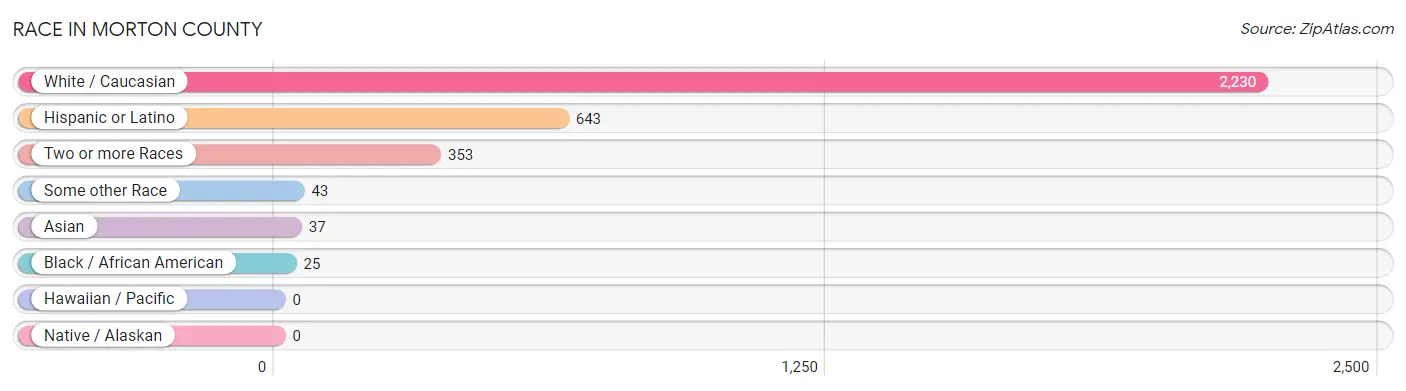
| Race | # Population | % Population |
| Asian | 37 | 1.4% |
| Black / African American | 25 | 0.9% |
| Hawaiian / Pacific | 0 | 0.0% |
| Hispanic or Latino | 643 | 23.9% |
| Native / Alaskan | 0 | 0.0% |
| White / Caucasian | 2,230 | 83.0% |
| Two or more Races | 353 | 13.1% |
| Some other Race | 43 | 1.6% |
| Total | 2,688 | 100.0% |
Ancestry in Morton County
The most populous ancestries reported in Morton County are Mexican (620 | 23.1%), German (356 | 13.2%), English (287 | 10.7%), Irish (234 | 8.7%), and American (200 | 7.4%), together accounting for 63.1% of all Morton County residents.
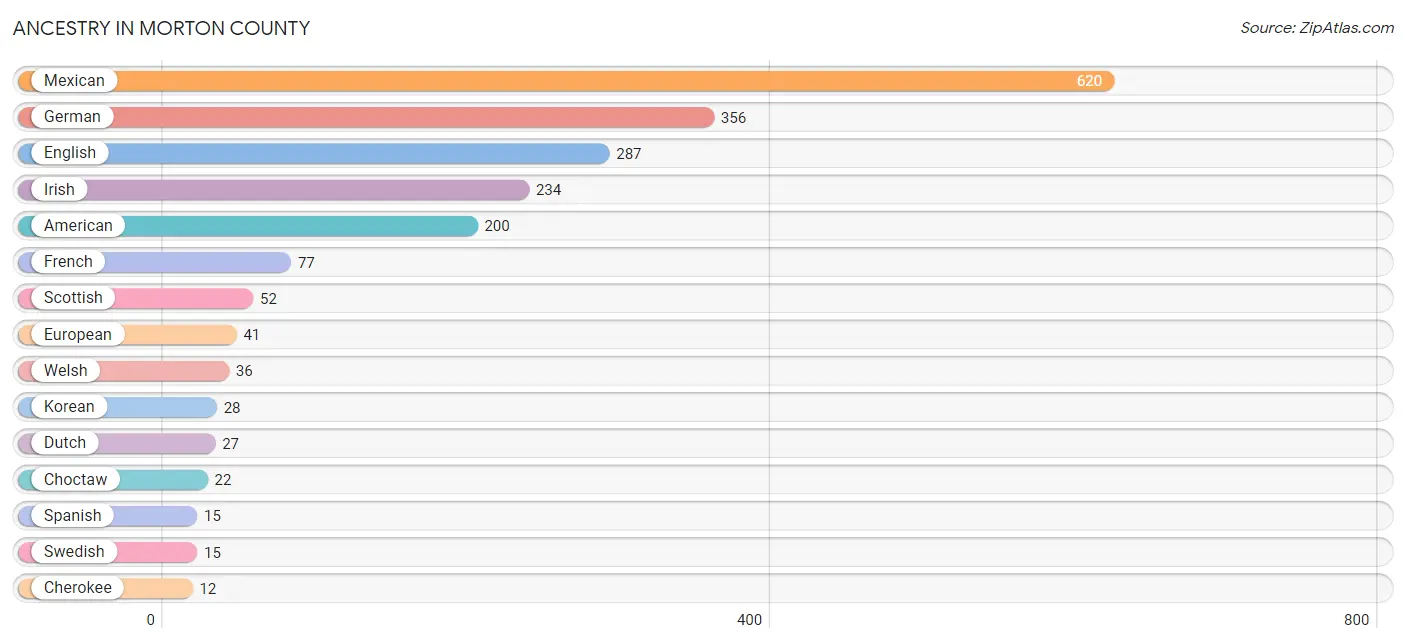
| Ancestry | # Population | % Population |
| American | 200 | 7.4% |
| Belgian | 6 | 0.2% |
| British | 8 | 0.3% |
| Burmese | 2 | 0.1% |
| Central American | 6 | 0.2% |
| Cherokee | 12 | 0.4% |
| Chickasaw | 2 | 0.1% |
| Choctaw | 22 | 0.8% |
| Comanche | 6 | 0.2% |
| Czech | 1 | 0.0% |
| Danish | 12 | 0.4% |
| Dutch | 27 | 1.0% |
| Dutch West Indian | 3 | 0.1% |
| English | 287 | 10.7% |
| European | 41 | 1.5% |
| French | 77 | 2.9% |
| German | 356 | 13.2% |
| Icelander | 3 | 0.1% |
| Irish | 234 | 8.7% |
| Italian | 3 | 0.1% |
| Korean | 28 | 1.0% |
| Lithuanian | 10 | 0.4% |
| Mexican | 620 | 23.1% |
| Nigerian | 3 | 0.1% |
| Panamanian | 6 | 0.2% |
| Polish | 9 | 0.3% |
| Russian | 12 | 0.4% |
| Scandinavian | 3 | 0.1% |
| Scotch-Irish | 3 | 0.1% |
| Scottish | 52 | 1.9% |
| Spanish | 15 | 0.6% |
| Subsaharan African | 5 | 0.2% |
| Swedish | 15 | 0.6% |
| Swiss | 1 | 0.0% |
| Thai | 9 | 0.3% |
| Welsh | 36 | 1.3% | View All 36 Rows |
Immigrants in Morton County
The most numerous immigrant groups reported in Morton County came from Latin America (264 | 9.8%), Central America (255 | 9.5%), Mexico (244 | 9.1%), Asia (28 | 1.0%), and Philippines (26 | 1.0%), together accounting for 30.4% of all Morton County residents.
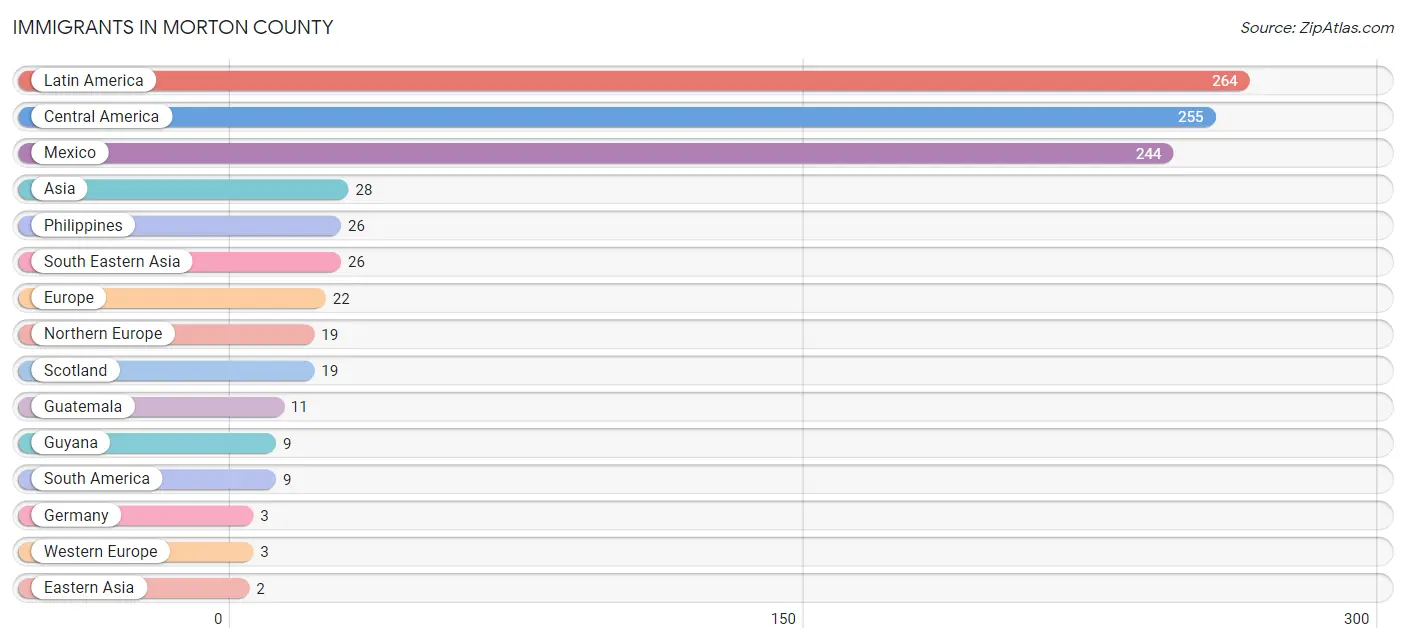
| Immigration Origin | # Population | % Population |
| Asia | 28 | 1.0% |
| Central America | 255 | 9.5% |
| Eastern Asia | 2 | 0.1% |
| Europe | 22 | 0.8% |
| Germany | 3 | 0.1% |
| Guatemala | 11 | 0.4% |
| Guyana | 9 | 0.3% |
| Korea | 2 | 0.1% |
| Latin America | 264 | 9.8% |
| Mexico | 244 | 9.1% |
| Northern Europe | 19 | 0.7% |
| Philippines | 26 | 1.0% |
| Scotland | 19 | 0.7% |
| South America | 9 | 0.3% |
| South Eastern Asia | 26 | 1.0% |
| Western Europe | 3 | 0.1% | View All 16 Rows |
Sex and Age in Morton County
Sex and Age in Morton County
The most populous age groups in Morton County are 5 to 9 Years (138 | 10.9%) for men and 5 to 9 Years (134 | 9.4%) for women.
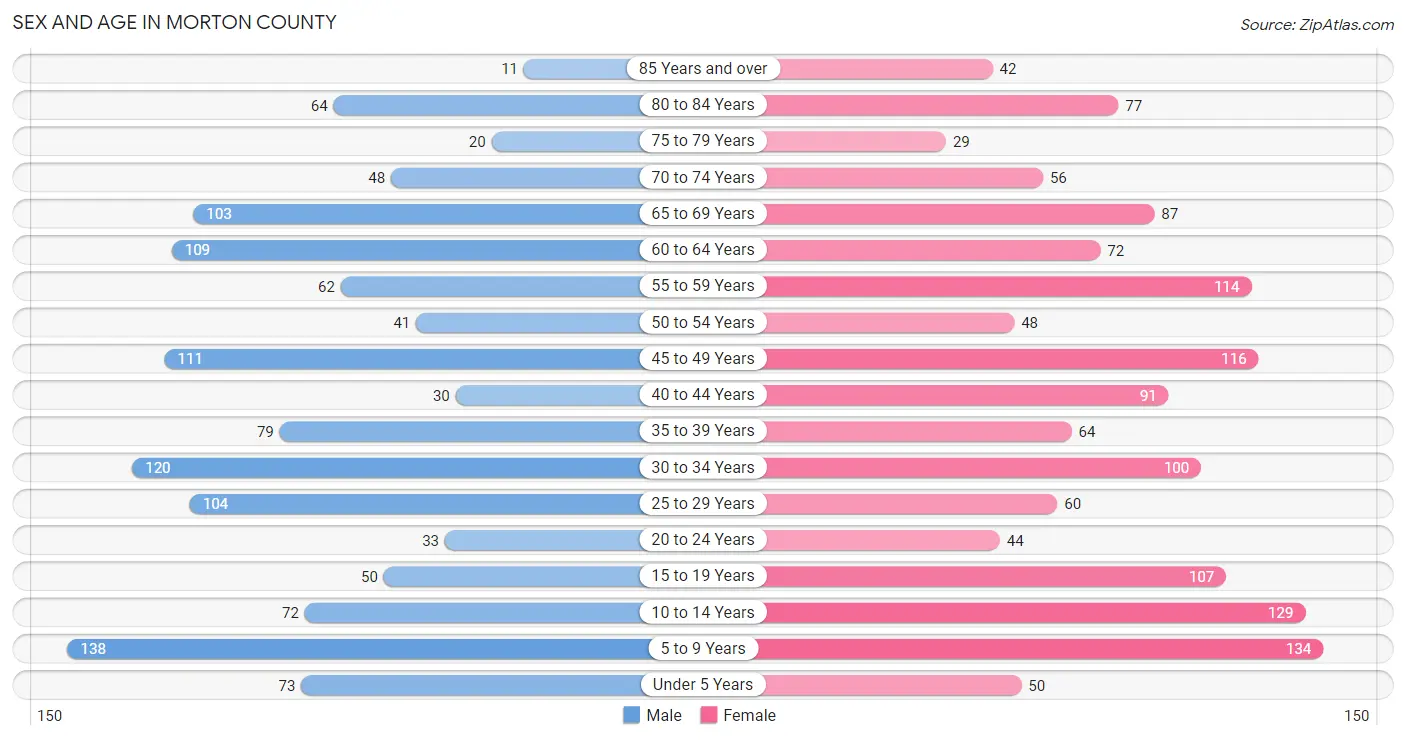
| Age Bracket | Male | Female |
| Under 5 Years | 73 (5.8%) | 50 (3.5%) |
| 5 to 9 Years | 138 (10.9%) | 134 (9.4%) |
| 10 to 14 Years | 72 (5.7%) | 129 (9.1%) |
| 15 to 19 Years | 50 (3.9%) | 107 (7.5%) |
| 20 to 24 Years | 33 (2.6%) | 44 (3.1%) |
| 25 to 29 Years | 104 (8.2%) | 60 (4.2%) |
| 30 to 34 Years | 120 (9.5%) | 100 (7.0%) |
| 35 to 39 Years | 79 (6.2%) | 64 (4.5%) |
| 40 to 44 Years | 30 (2.4%) | 91 (6.4%) |
| 45 to 49 Years | 111 (8.7%) | 116 (8.2%) |
| 50 to 54 Years | 41 (3.2%) | 48 (3.4%) |
| 55 to 59 Years | 62 (4.9%) | 114 (8.0%) |
| 60 to 64 Years | 109 (8.6%) | 72 (5.1%) |
| 65 to 69 Years | 103 (8.1%) | 87 (6.1%) |
| 70 to 74 Years | 48 (3.8%) | 56 (3.9%) |
| 75 to 79 Years | 20 (1.6%) | 29 (2.0%) |
| 80 to 84 Years | 64 (5.1%) | 77 (5.4%) |
| 85 Years and over | 11 (0.9%) | 42 (3.0%) |
| Total | 1,268 (100.0%) | 1,420 (100.0%) |
Families and Households in Morton County
Median Family Size in Morton County
The median family size in Morton County is 3.90 persons per family, with married-couple families (419 | 77.3%) accounting for the largest median family size of 4.13 persons per family. On the other hand, single female/mother families (45 | 8.3%) represent the smallest median family size with 2.89 persons per family.
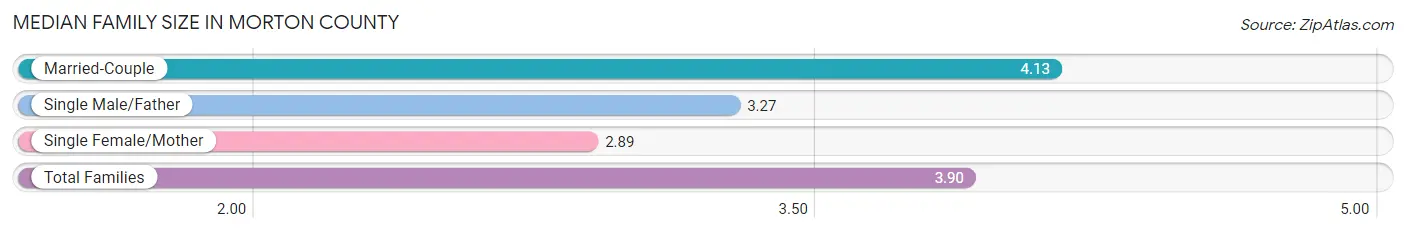
| Family Type | # Families | Family Size |
| Married-Couple | 419 (77.3%) | 4.13 |
| Single Male/Father | 78 (14.4%) | 3.27 |
| Single Female/Mother | 45 (8.3%) | 2.89 |
| Total Families | 542 (100.0%) | 3.90 |
Median Household Size in Morton County
The median household size in Morton County is 2.78 persons per household, with married-couple households (419 | 44.6%) accounting for the largest median household size of 4.22 persons per household. non-family households (397 | 42.3%) represent the smallest median household size with 1.12 persons per household.
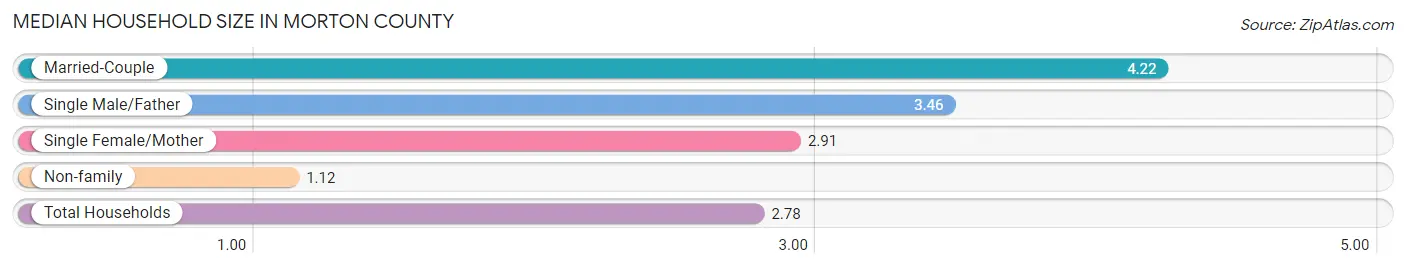
| Household Type | # Households | Household Size |
| Married-Couple | 419 (44.6%) | 4.22 |
| Single Male/Father | 78 (8.3%) | 3.46 |
| Single Female/Mother | 45 (4.8%) | 2.91 |
| Non-family | 397 (42.3%) | 1.12 |
| Total Households | 939 (100.0%) | 2.78 |
Household Size by Marriage Status in Morton County
Out of a total of 939 households in Morton County, 542 (57.7%) are family households, while 397 (42.3%) are nonfamily households. The most numerous type of family households are 2-person households, comprising 225, and the most common type of nonfamily households are 1-person households, comprising 344.
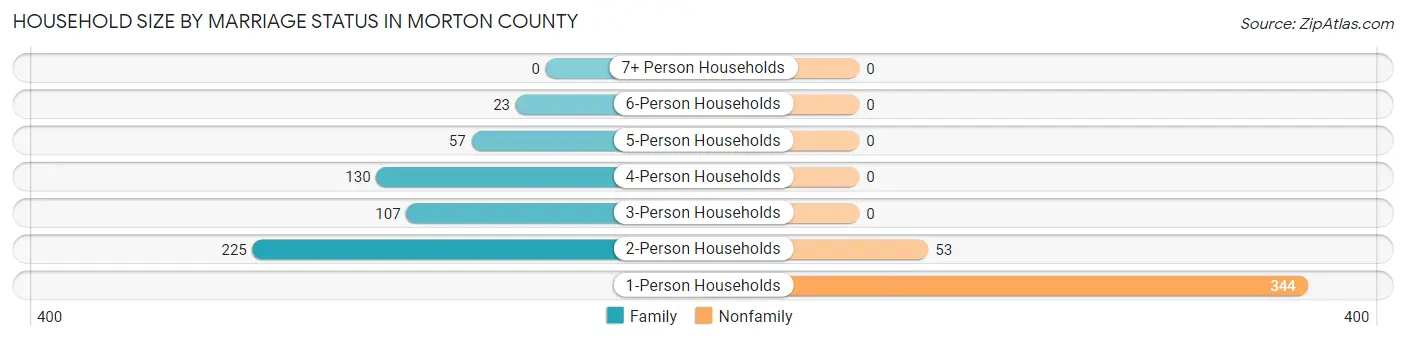
| Household Size | Family Households | Nonfamily Households |
| 1-Person Households | - | 344 (36.6%) |
| 2-Person Households | 225 (24.0%) | 53 (5.6%) |
| 3-Person Households | 107 (11.4%) | 0 (0.0%) |
| 4-Person Households | 130 (13.8%) | 0 (0.0%) |
| 5-Person Households | 57 (6.1%) | 0 (0.0%) |
| 6-Person Households | 23 (2.5%) | 0 (0.0%) |
| 7+ Person Households | 0 (0.0%) | 0 (0.0%) |
| Total | 542 (57.7%) | 397 (42.3%) |
Female Fertility in Morton County
Fertility by Age in Morton County
Average fertility rate in Morton County is 70.0 births per 1,000 women. Women in the age bracket of 15 to 19 years have the highest fertility rate with 168.0 births per 1,000 women. Women in the age bracket of 15 to 19 years acount for 43.9% of all women with births.
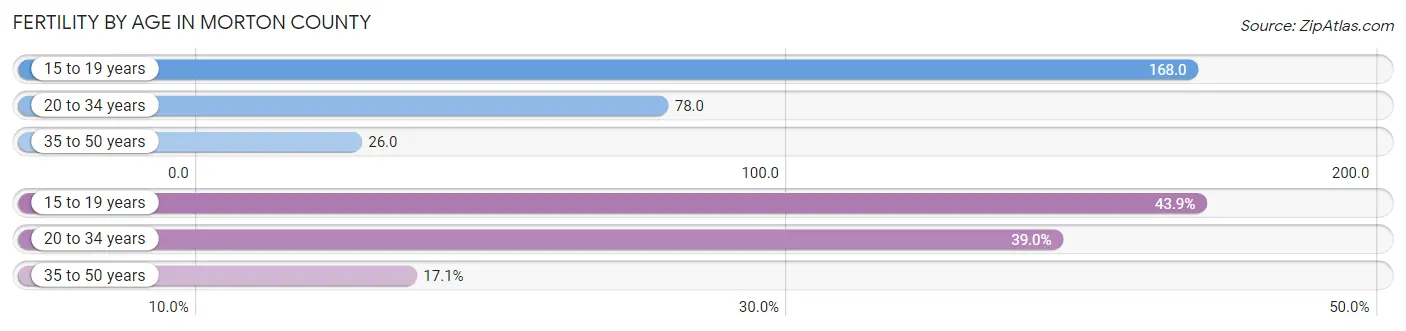
| Age Bracket | Women with Births | Births / 1,000 Women |
| 15 to 19 years | 18 (43.9%) | 168.0 |
| 20 to 34 years | 16 (39.0%) | 78.0 |
| 35 to 50 years | 7 (17.1%) | 26.0 |
| Total | 41 (100.0%) | 70.0 |
Fertility by Age by Marriage Status in Morton County
34.1% of women with births (41) in Morton County are married. The highest percentage of unmarried women with births falls into 15 to 19 years age bracket with 100.0% of them unmarried at the time of birth, while the lowest percentage of unmarried women with births belong to 35 to 50 years age bracket with 0.0% of them unmarried.
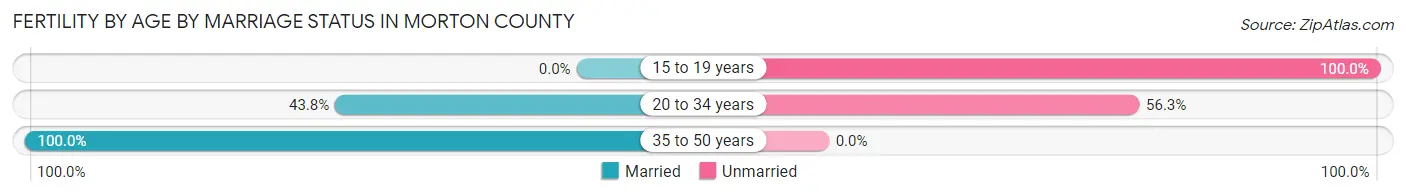
| Age Bracket | Married | Unmarried |
| 15 to 19 years | 0 (0.0%) | 18 (100.0%) |
| 20 to 34 years | 7 (43.8%) | 9 (56.2%) |
| 35 to 50 years | 7 (100.0%) | 0 (0.0%) |
| Total | 14 (34.2%) | 27 (65.8%) |
Fertility by Education in Morton County
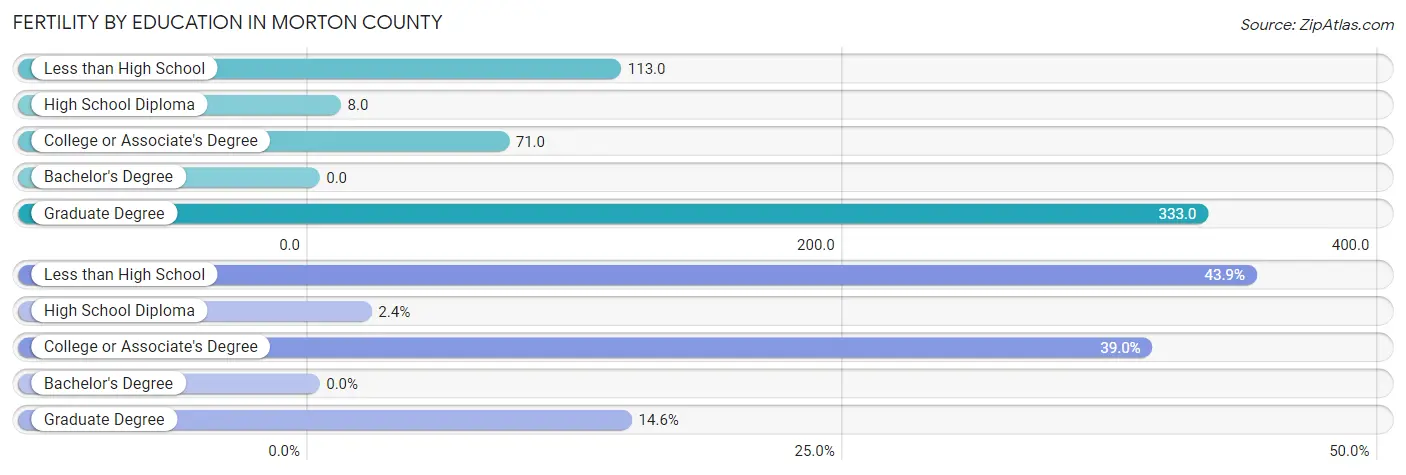
| Educational Attainment | Women with Births | Births / 1,000 Women |
| Less than High School | 18 (43.9%) | 113.0 |
| High School Diploma | 1 (2.4%) | 8.0 |
| College or Associate's Degree | 16 (39.0%) | 71.0 |
| Bachelor's Degree | 0 (0.0%) | 0.0 |
| Graduate Degree | 6 (14.6%) | 333.0 |
| Total | 41 (100.0%) | 70.0 |
Fertility by Education by Marriage Status in Morton County
65.8% of women with births in Morton County are unmarried. Women with the educational attainment of graduate degree are most likely to be married with 100.0% of them married at childbirth, while women with the educational attainment of less than high school are least likely to be married with 100.0% of them unmarried at childbirth.
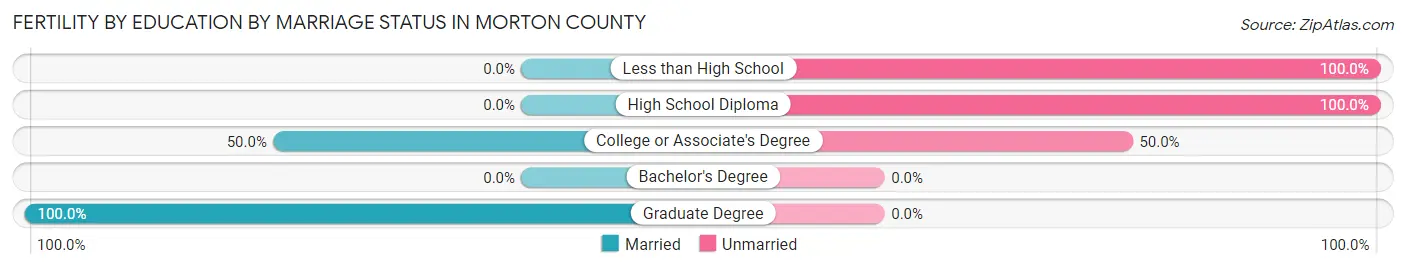
| Educational Attainment | Married | Unmarried |
| Less than High School | 0 (0.0%) | 18 (100.0%) |
| High School Diploma | 0 (0.0%) | 1 (100.0%) |
| College or Associate's Degree | 8 (50.0%) | 8 (50.0%) |
| Bachelor's Degree | 0 (0.0%) | 0 (0.0%) |
| Graduate Degree | 6 (100.0%) | 0 (0.0%) |
| Total | 14 (34.2%) | 27 (65.8%) |
Employment Characteristics in Morton County
Employment by Class of Employer in Morton County
Among the 1,143 employed individuals in Morton County, private company employees (595 | 52.1%), local government employees (265 | 23.2%), and self-employed (not incorporated) (129 | 11.3%) make up the most common classes of employment.
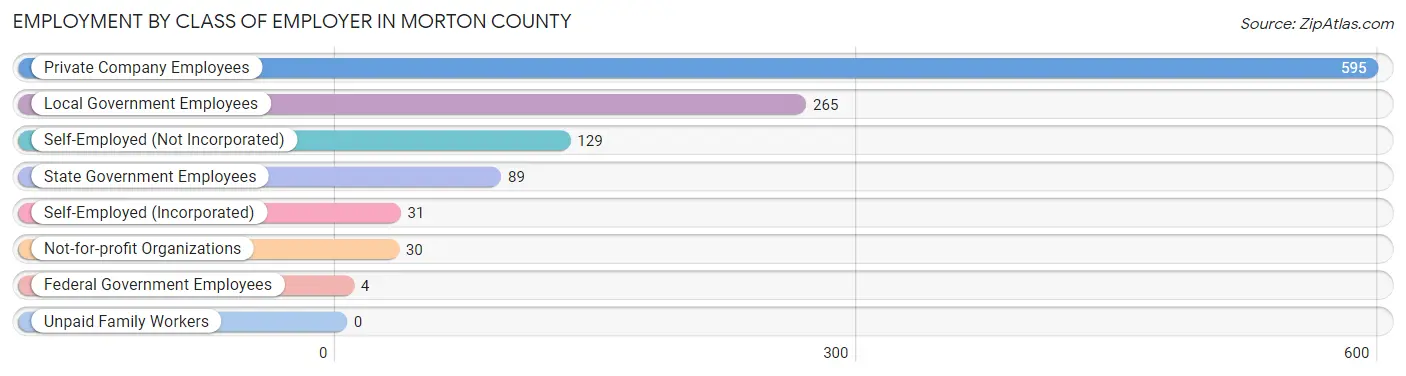
| Employer Class | # Employees | % Employees |
| Private Company Employees | 595 | 52.1% |
| Self-Employed (Incorporated) | 31 | 2.7% |
| Self-Employed (Not Incorporated) | 129 | 11.3% |
| Not-for-profit Organizations | 30 | 2.6% |
| Local Government Employees | 265 | 23.2% |
| State Government Employees | 89 | 7.8% |
| Federal Government Employees | 4 | 0.4% |
| Unpaid Family Workers | 0 | 0.0% |
| Total | 1,143 | 100.0% |
Employment Status by Age in Morton County
According to the labor force statistics for Morton County, out of the total population over 16 years of age (2,060), 59.2% or 1,220 individuals are in the labor force, with 3.3% or 40 of them unemployed. The age group with the highest labor force participation rate is 35 to 44 years, with 89.0% or 235 individuals in the labor force. Within the labor force, the 25 to 29 years age range has the highest percentage of unemployed individuals, with 23.2% or 32 of them being unemployed.
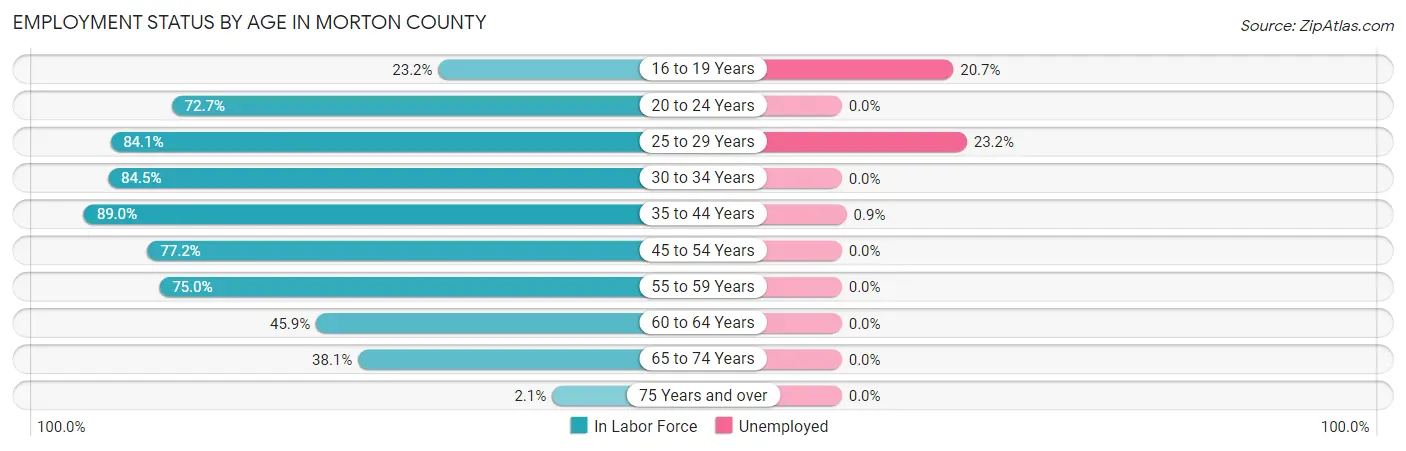
| Age Bracket | In Labor Force | Unemployed |
| 16 to 19 Years | 29 (23.2%) | 6 (20.7%) |
| 20 to 24 Years | 56 (72.7%) | 0 (0.0%) |
| 25 to 29 Years | 138 (84.1%) | 32 (23.2%) |
| 30 to 34 Years | 186 (84.5%) | 0 (0.0%) |
| 35 to 44 Years | 235 (89.0%) | 2 (0.9%) |
| 45 to 54 Years | 244 (77.2%) | 0 (0.0%) |
| 55 to 59 Years | 132 (75.0%) | 0 (0.0%) |
| 60 to 64 Years | 83 (45.9%) | 0 (0.0%) |
| 65 to 74 Years | 112 (38.1%) | 0 (0.0%) |
| 75 Years and over | 5 (2.1%) | 0 (0.0%) |
| Total | 1,220 (59.2%) | 40 (3.3%) |
Employment Status by Educational Attainment in Morton County
According to labor force statistics for Morton County, 77.1% of individuals (1,018) out of the total population between 25 and 64 years of age (1,321) are in the labor force, with 3.3% or 34 of them being unemployed. The group with the highest labor force participation rate are those with the educational attainment of high school diploma, with 81.7% or 385 individuals in the labor force. Within the labor force, individuals with high school diploma education have the highest percentage of unemployment, with 8.3% or 32 of them being unemployed.
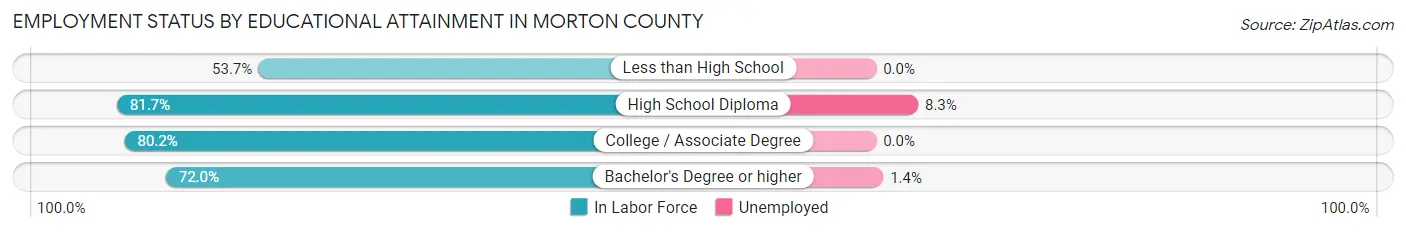
| Educational Attainment | In Labor Force | Unemployed |
| Less than High School | 65 (53.7%) | 0 (0.0%) |
| High School Diploma | 385 (81.7%) | 39 (8.3%) |
| College / Associate Degree | 424 (80.2%) | 0 (0.0%) |
| Bachelor's Degree or higher | 144 (72.0%) | 3 (1.4%) |
| Total | 1,018 (77.1%) | 44 (3.3%) |
Employment Occupations by Sex in Morton County
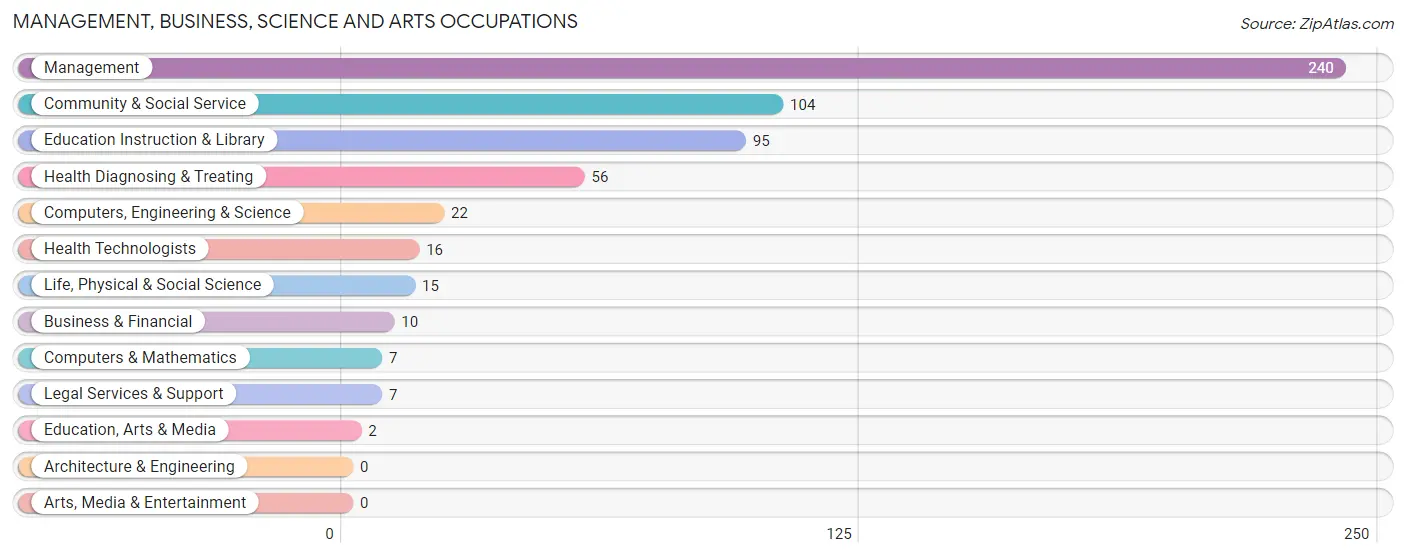
Management, Business, Science and Arts Occupations
The most common Management, Business, Science and Arts occupations in Morton County are Management (240 | 20.3%), Community & Social Service (104 | 8.8%), Education Instruction & Library (95 | 8.1%), Health Diagnosing & Treating (56 | 4.8%), and Computers, Engineering & Science (22 | 1.9%).
Management, Business, Science and Arts Occupations by Sex
Within the Management, Business, Science and Arts occupations in Morton County, the most male-oriented occupations are Business & Financial (80.0%), Computers & Mathematics (71.4%), and Computers, Engineering & Science (68.2%), while the most female-oriented occupations are Education, Arts & Media (100.0%), Legal Services & Support (100.0%), and Community & Social Service (95.2%).
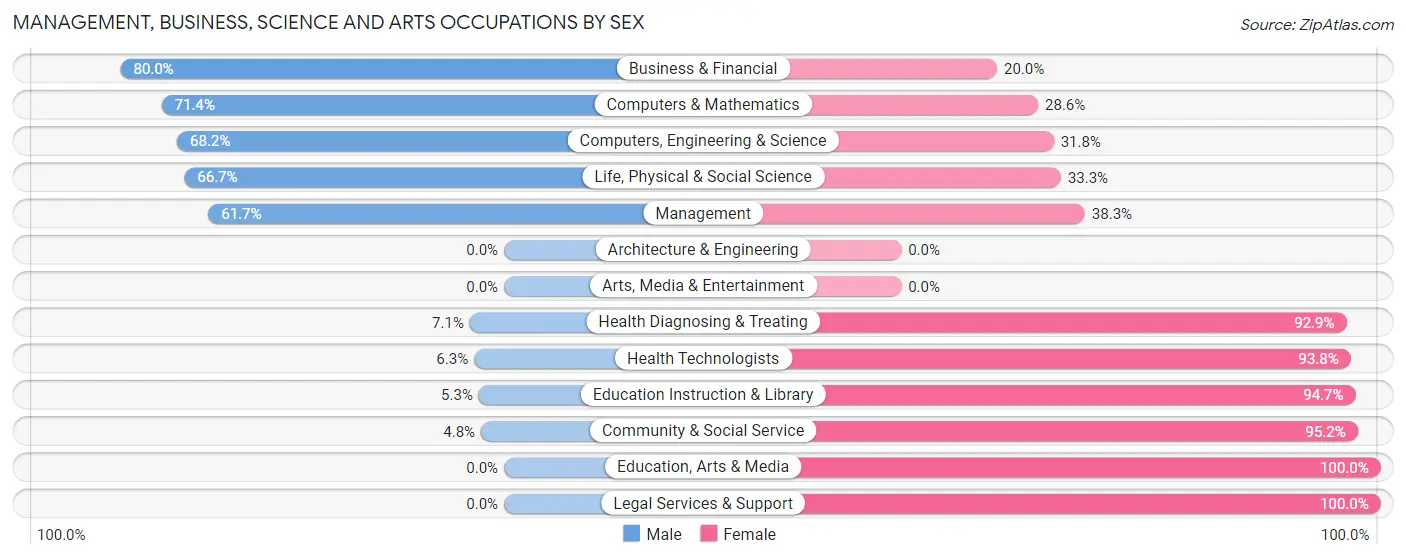
| Occupation | Male | Female |
| Management | 148 (61.7%) | 92 (38.3%) |
| Business & Financial | 8 (80.0%) | 2 (20.0%) |
| Computers, Engineering & Science | 15 (68.2%) | 7 (31.8%) |
| Computers & Mathematics | 5 (71.4%) | 2 (28.6%) |
| Architecture & Engineering | 0 (0.0%) | 0 (0.0%) |
| Life, Physical & Social Science | 10 (66.7%) | 5 (33.3%) |
| Community & Social Service | 5 (4.8%) | 99 (95.2%) |
| Education, Arts & Media | 0 (0.0%) | 2 (100.0%) |
| Legal Services & Support | 0 (0.0%) | 7 (100.0%) |
| Education Instruction & Library | 5 (5.3%) | 90 (94.7%) |
| Arts, Media & Entertainment | 0 (0.0%) | 0 (0.0%) |
| Health Diagnosing & Treating | 4 (7.1%) | 52 (92.9%) |
| Health Technologists | 1 (6.2%) | 15 (93.8%) |
| Total (Category) | 180 (41.7%) | 252 (58.3%) |
| Total (Overall) | 627 (53.1%) | 553 (46.9%) |
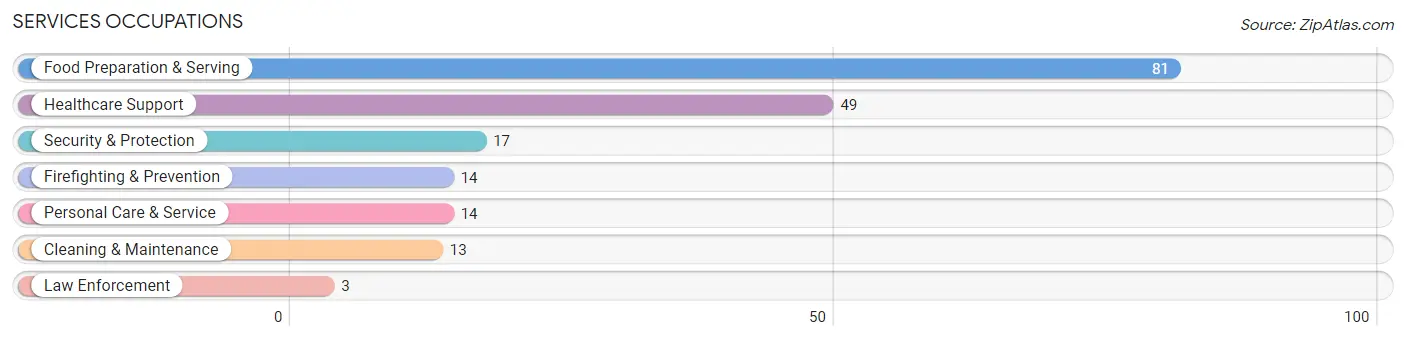
Services Occupations
The most common Services occupations in Morton County are Food Preparation & Serving (81 | 6.9%), Healthcare Support (49 | 4.2%), Security & Protection (17 | 1.4%), Firefighting & Prevention (14 | 1.2%), and Personal Care & Service (14 | 1.2%).
Services Occupations by Sex
Within the Services occupations in Morton County, the most male-oriented occupations are Firefighting & Prevention (100.0%), Cleaning & Maintenance (100.0%), and Security & Protection (88.2%), while the most female-oriented occupations are Healthcare Support (100.0%), Food Preparation & Serving (100.0%), and Personal Care & Service (71.4%).
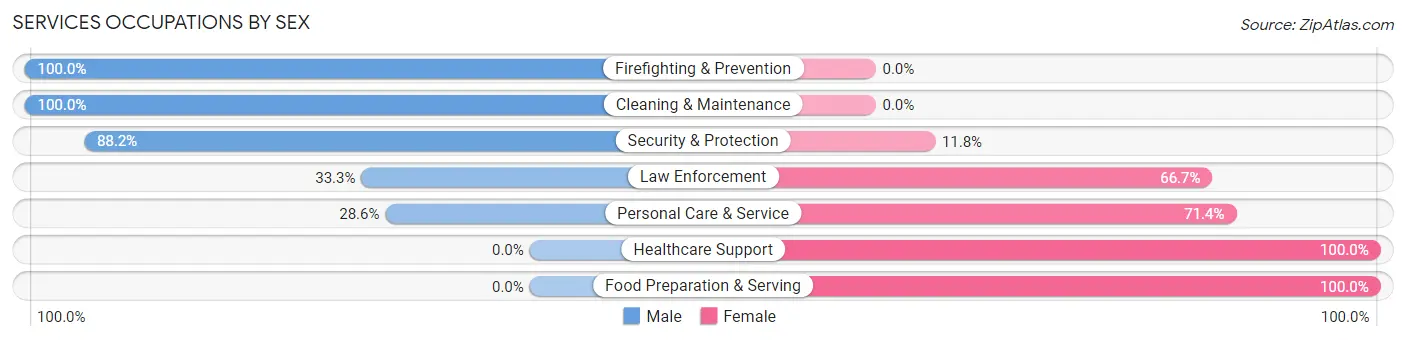
| Occupation | Male | Female |
| Healthcare Support | 0 (0.0%) | 49 (100.0%) |
| Security & Protection | 15 (88.2%) | 2 (11.8%) |
| Firefighting & Prevention | 14 (100.0%) | 0 (0.0%) |
| Law Enforcement | 1 (33.3%) | 2 (66.7%) |
| Food Preparation & Serving | 0 (0.0%) | 81 (100.0%) |
| Cleaning & Maintenance | 13 (100.0%) | 0 (0.0%) |
| Personal Care & Service | 4 (28.6%) | 10 (71.4%) |
| Total (Category) | 32 (18.4%) | 142 (81.6%) |
| Total (Overall) | 627 (53.1%) | 553 (46.9%) |
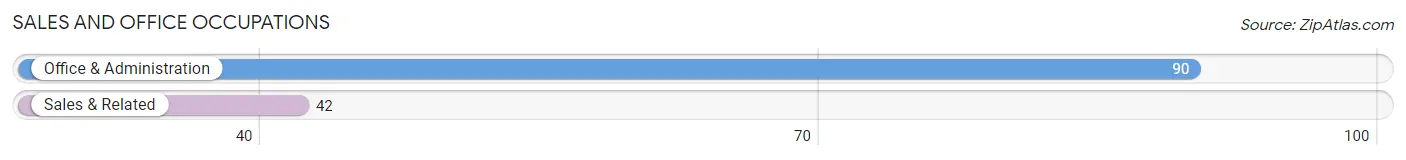
Sales and Office Occupations
The most common Sales and Office occupations in Morton County are Office & Administration (90 | 7.6%), and Sales & Related (42 | 3.6%).
Sales and Office Occupations by Sex
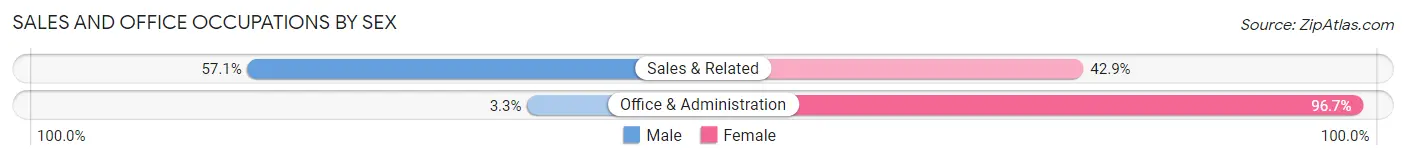
| Occupation | Male | Female |
| Sales & Related | 24 (57.1%) | 18 (42.9%) |
| Office & Administration | 3 (3.3%) | 87 (96.7%) |
| Total (Category) | 27 (20.4%) | 105 (79.5%) |
| Total (Overall) | 627 (53.1%) | 553 (46.9%) |
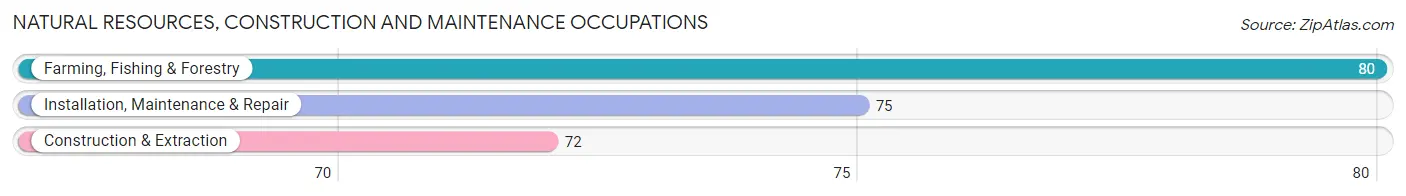
Natural Resources, Construction and Maintenance Occupations
The most common Natural Resources, Construction and Maintenance occupations in Morton County are Farming, Fishing & Forestry (80 | 6.8%), Installation, Maintenance & Repair (75 | 6.4%), and Construction & Extraction (72 | 6.1%).
Natural Resources, Construction and Maintenance Occupations by Sex
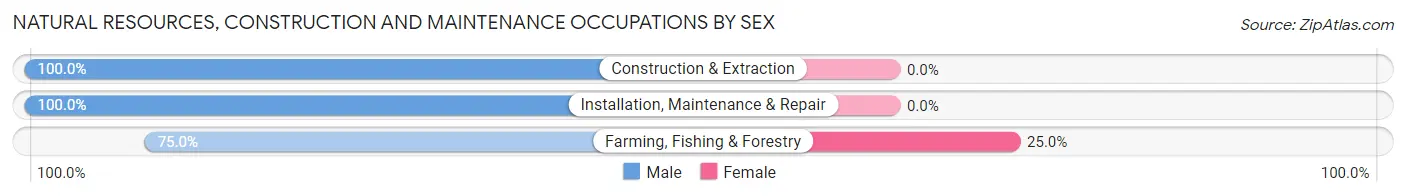
| Occupation | Male | Female |
| Farming, Fishing & Forestry | 60 (75.0%) | 20 (25.0%) |
| Construction & Extraction | 72 (100.0%) | 0 (0.0%) |
| Installation, Maintenance & Repair | 75 (100.0%) | 0 (0.0%) |
| Total (Category) | 207 (91.2%) | 20 (8.8%) |
| Total (Overall) | 627 (53.1%) | 553 (46.9%) |
Production, Transportation and Moving Occupations
The most common Production, Transportation and Moving occupations in Morton County are Material Moving (93 | 7.9%), Transportation (87 | 7.4%), and Production (35 | 3.0%).
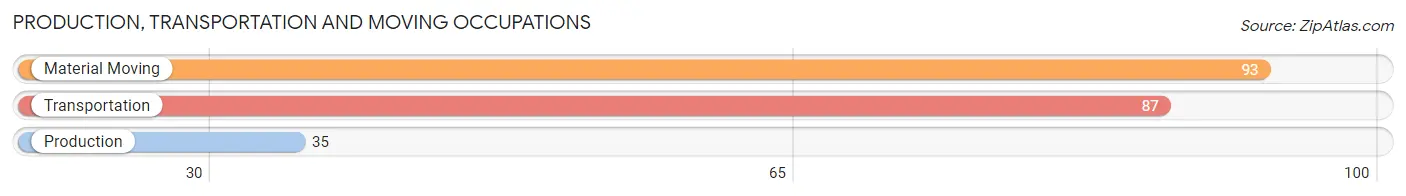
Production, Transportation and Moving Occupations by Sex
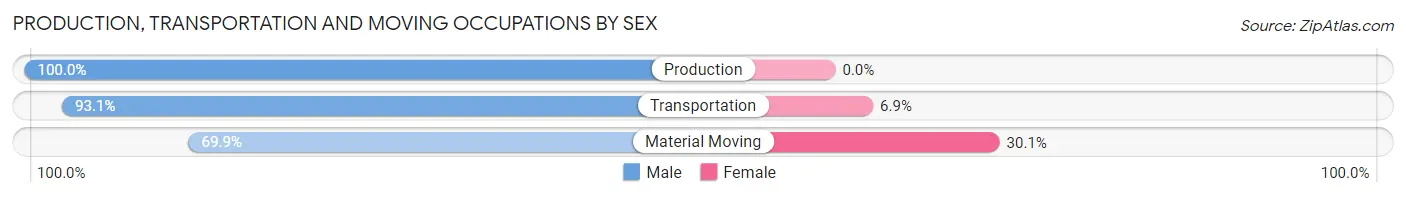
| Occupation | Male | Female |
| Production | 35 (100.0%) | 0 (0.0%) |
| Transportation | 81 (93.1%) | 6 (6.9%) |
| Material Moving | 65 (69.9%) | 28 (30.1%) |
| Total (Category) | 181 (84.2%) | 34 (15.8%) |
| Total (Overall) | 627 (53.1%) | 553 (46.9%) |
Employment Industries by Sex in Morton County
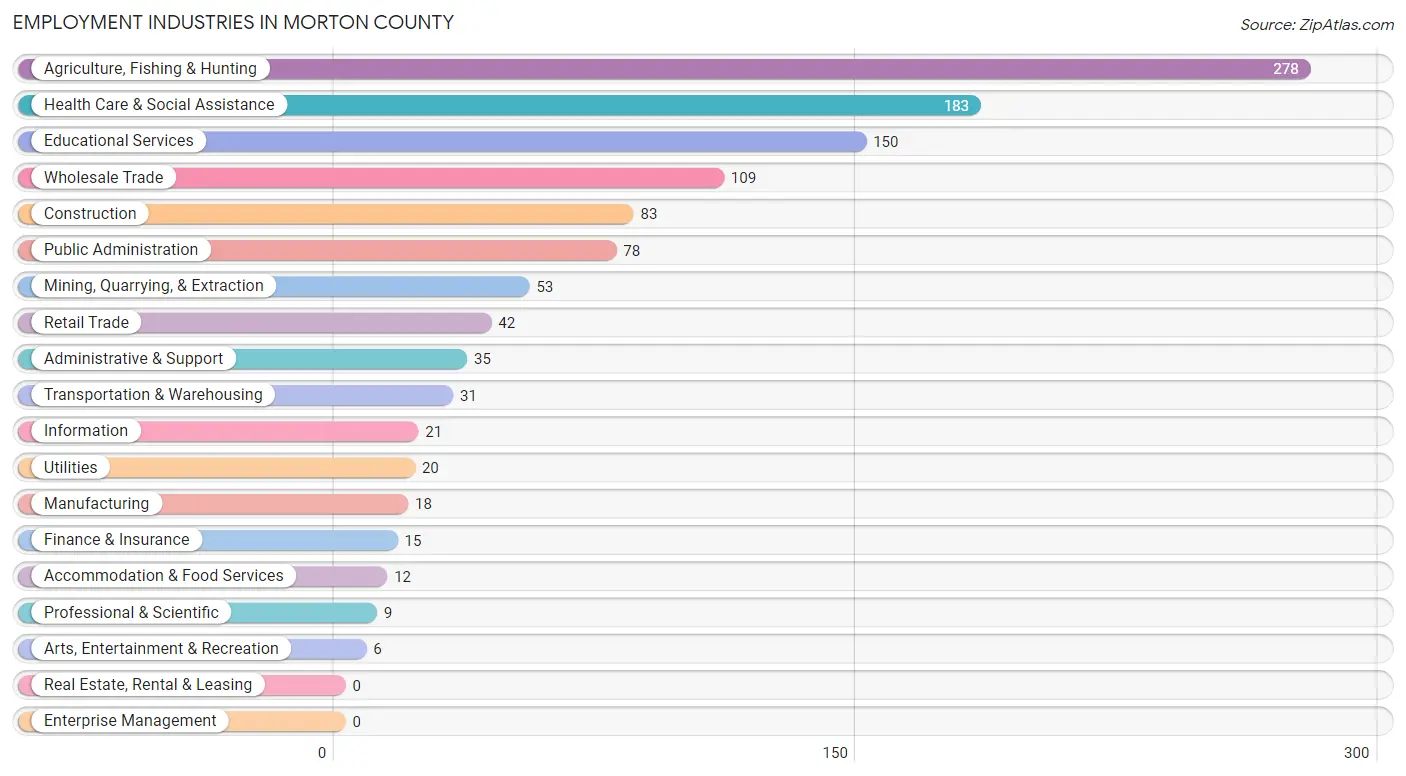
Employment Industries in Morton County
The major employment industries in Morton County include Agriculture, Fishing & Hunting (278 | 23.6%), Health Care & Social Assistance (183 | 15.5%), Educational Services (150 | 12.7%), Wholesale Trade (109 | 9.2%), and Construction (83 | 7.0%).
Employment Industries by Sex in Morton County
The Morton County industries that see more men than women are Mining, Quarrying, & Extraction (100.0%), Manufacturing (100.0%), and Utilities (100.0%), whereas the industries that tend to have a higher number of women are Arts, Entertainment & Recreation (100.0%), Accommodation & Food Services (100.0%), and Health Care & Social Assistance (96.7%).
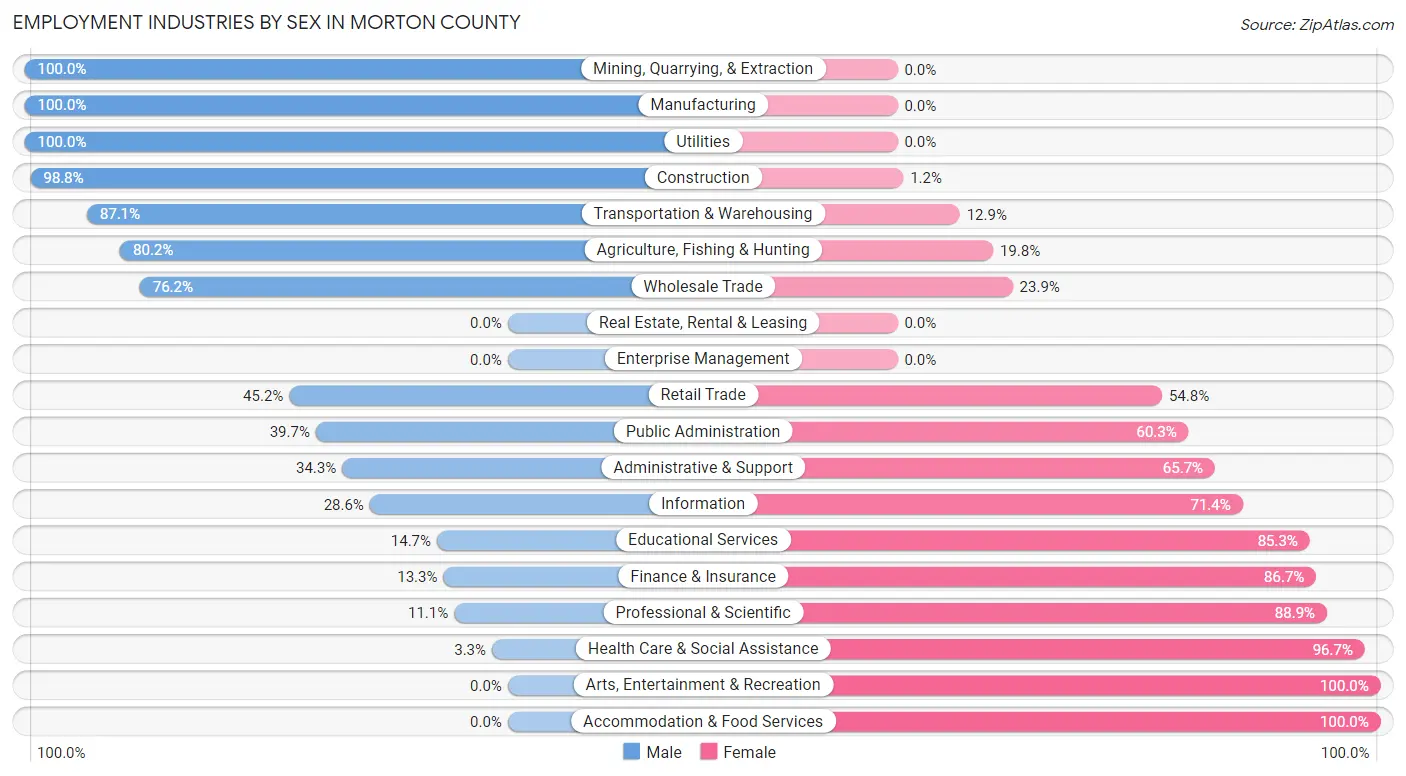
| Industry | Male | Female |
| Agriculture, Fishing & Hunting | 223 (80.2%) | 55 (19.8%) |
| Mining, Quarrying, & Extraction | 53 (100.0%) | 0 (0.0%) |
| Construction | 82 (98.8%) | 1 (1.2%) |
| Manufacturing | 18 (100.0%) | 0 (0.0%) |
| Wholesale Trade | 83 (76.1%) | 26 (23.8%) |
| Retail Trade | 19 (45.2%) | 23 (54.8%) |
| Transportation & Warehousing | 27 (87.1%) | 4 (12.9%) |
| Utilities | 20 (100.0%) | 0 (0.0%) |
| Information | 6 (28.6%) | 15 (71.4%) |
| Finance & Insurance | 2 (13.3%) | 13 (86.7%) |
| Real Estate, Rental & Leasing | 0 (0.0%) | 0 (0.0%) |
| Professional & Scientific | 1 (11.1%) | 8 (88.9%) |
| Enterprise Management | 0 (0.0%) | 0 (0.0%) |
| Administrative & Support | 12 (34.3%) | 23 (65.7%) |
| Educational Services | 22 (14.7%) | 128 (85.3%) |
| Health Care & Social Assistance | 6 (3.3%) | 177 (96.7%) |
| Arts, Entertainment & Recreation | 0 (0.0%) | 6 (100.0%) |
| Accommodation & Food Services | 0 (0.0%) | 12 (100.0%) |
| Public Administration | 31 (39.7%) | 47 (60.3%) |
| Total | 627 (53.1%) | 553 (46.9%) |
Education in Morton County
School Enrollment in Morton County
The most common levels of schooling among the 619 students in Morton County are elementary school (189 | 30.5%), middle school (161 | 26.0%), and high school (131 | 21.2%).
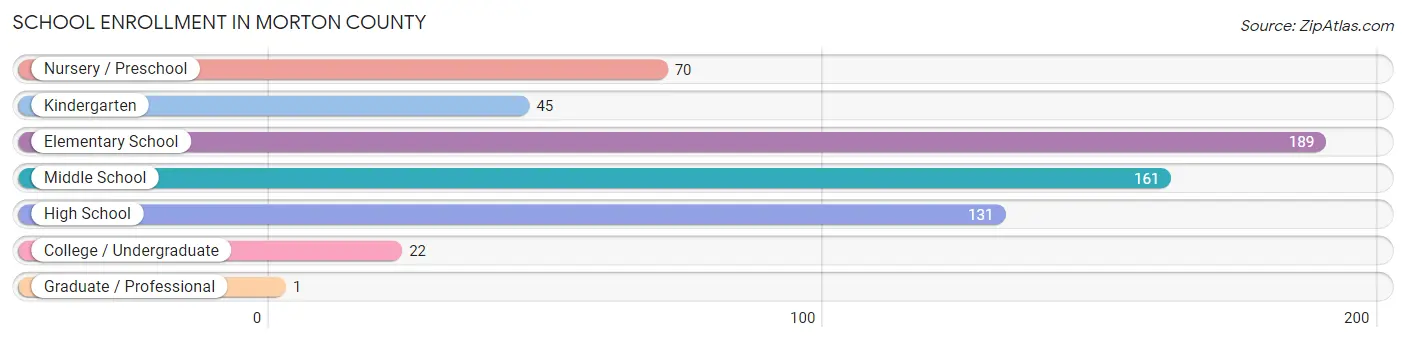
| School Level | # Students | % Students |
| Nursery / Preschool | 70 | 11.3% |
| Kindergarten | 45 | 7.3% |
| Elementary School | 189 | 30.5% |
| Middle School | 161 | 26.0% |
| High School | 131 | 21.2% |
| College / Undergraduate | 22 | 3.5% |
| Graduate / Professional | 1 | 0.2% |
| Total | 619 | 100.0% |
School Enrollment by Age by Funding Source in Morton County
Out of a total of 619 students who are enrolled in schools in Morton County, 6 (1.0%) attend a private institution, while the remaining 613 (99.0%) are enrolled in public schools. The age group of 35 years and over has the highest likelihood of being enrolled in private schools, with 4 (33.3% in the age bracket) enrolled. Conversely, the age group of 3 to 4 year olds has the lowest likelihood of being enrolled in a private school, with 15 (100.0% in the age bracket) attending a public institution.
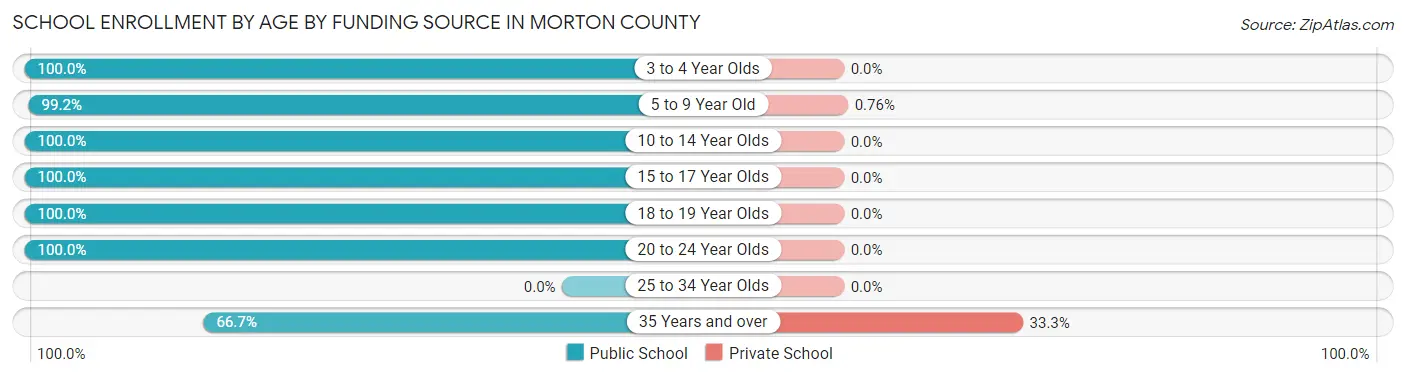
| Age Bracket | Public School | Private School |
| 3 to 4 Year Olds | 15 (100.0%) | 0 (0.0%) |
| 5 to 9 Year Old | 262 (99.2%) | 2 (0.8%) |
| 10 to 14 Year Olds | 189 (100.0%) | 0 (0.0%) |
| 15 to 17 Year Olds | 84 (100.0%) | 0 (0.0%) |
| 18 to 19 Year Olds | 48 (100.0%) | 0 (0.0%) |
| 20 to 24 Year Olds | 7 (100.0%) | 0 (0.0%) |
| 25 to 34 Year Olds | 0 (0.0%) | 0 (0.0%) |
| 35 Years and over | 8 (66.7%) | 4 (33.3%) |
| Total | 613 (99.0%) | 6 (1.0%) |
Educational Attainment by Field of Study in Morton County
Education (109 | 29.7%), bio, nature & agricultural (68 | 18.5%), science & technology (46 | 12.5%), business (46 | 12.5%), and arts & humanities (36 | 9.8%) are the most common fields of study among 367 individuals in Morton County who have obtained a bachelor's degree or higher.
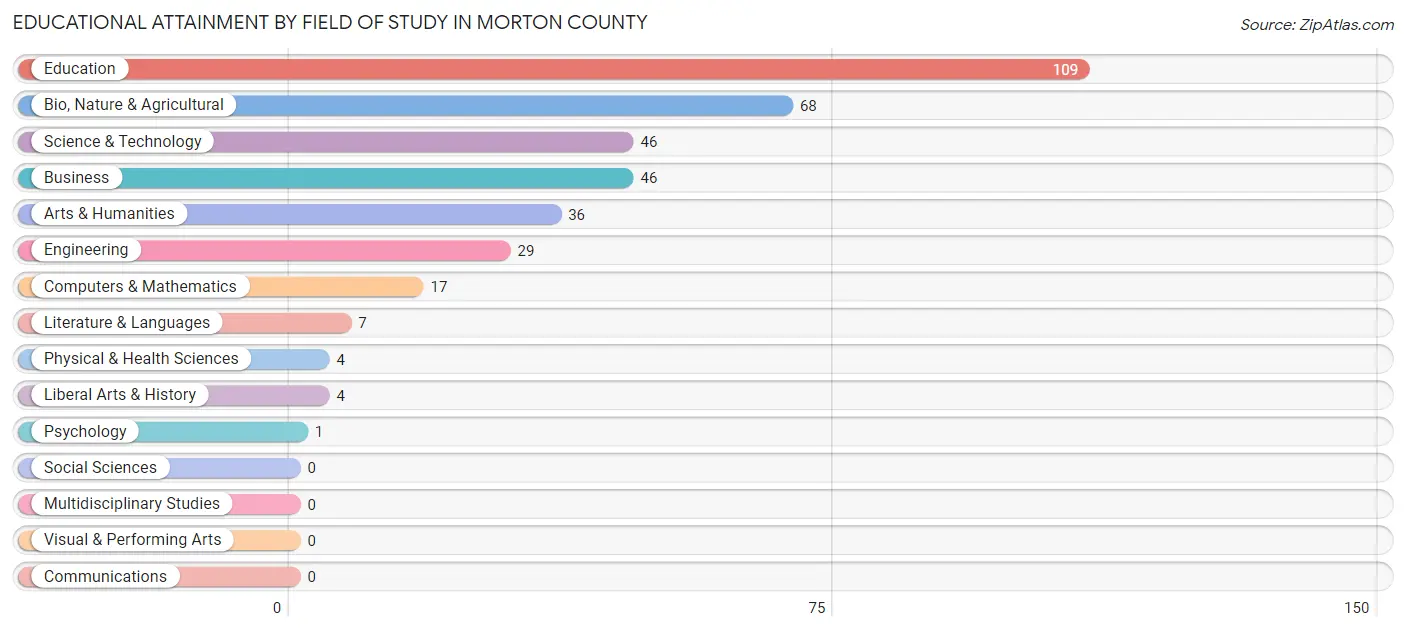
| Field of Study | # Graduates | % Graduates |
| Computers & Mathematics | 17 | 4.6% |
| Bio, Nature & Agricultural | 68 | 18.5% |
| Physical & Health Sciences | 4 | 1.1% |
| Psychology | 1 | 0.3% |
| Social Sciences | 0 | 0.0% |
| Engineering | 29 | 7.9% |
| Multidisciplinary Studies | 0 | 0.0% |
| Science & Technology | 46 | 12.5% |
| Business | 46 | 12.5% |
| Education | 109 | 29.7% |
| Literature & Languages | 7 | 1.9% |
| Liberal Arts & History | 4 | 1.1% |
| Visual & Performing Arts | 0 | 0.0% |
| Communications | 0 | 0.0% |
| Arts & Humanities | 36 | 9.8% |
| Total | 367 | 100.0% |
Transportation & Commute in Morton County
Vehicle Availability by Sex in Morton County
The most prevalent vehicle ownership categories in Morton County are males with 3 vehicles (304, accounting for 50.6%) and females with 3 vehicles (178, making up 56.1%).
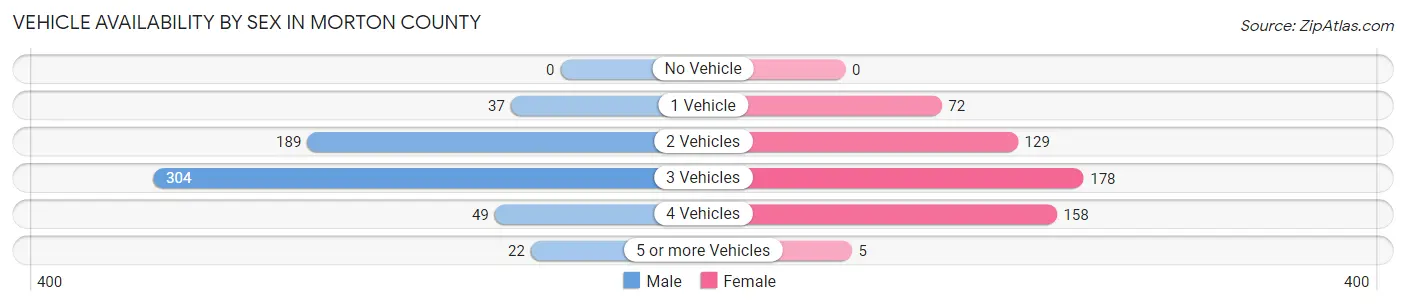
| Vehicles Available | Male | Female |
| No Vehicle | 0 (0.0%) | 0 (0.0%) |
| 1 Vehicle | 37 (6.2%) | 72 (13.3%) |
| 2 Vehicles | 189 (31.5%) | 129 (23.8%) |
| 3 Vehicles | 304 (50.6%) | 178 (32.8%) |
| 4 Vehicles | 49 (8.2%) | 158 (29.1%) |
| 5 or more Vehicles | 22 (3.7%) | 5 (0.9%) |
| Total | 601 (100.0%) | 542 (100.0%) |
Commute Time in Morton County
The most frequently occuring commute durations in Morton County are 5 to 9 minutes (320 commuters, 30.6%), 20 to 24 minutes (159 commuters, 15.2%), and 15 to 19 minutes (115 commuters, 11.0%).
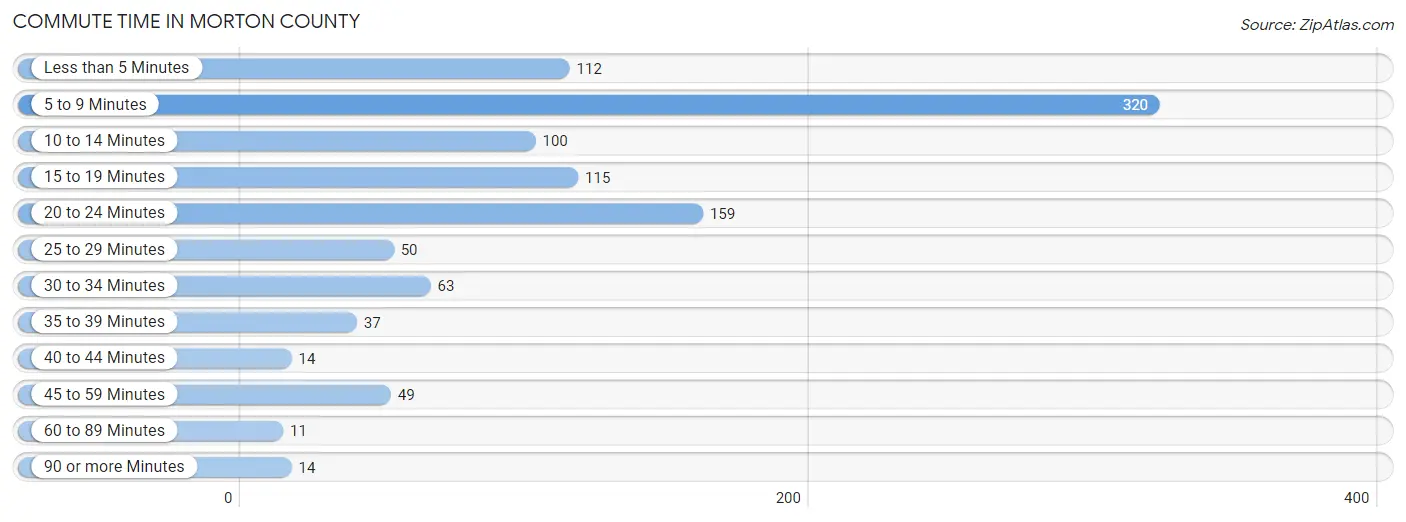
| Commute Time | # Commuters | % Commuters |
| Less than 5 Minutes | 112 | 10.7% |
| 5 to 9 Minutes | 320 | 30.6% |
| 10 to 14 Minutes | 100 | 9.6% |
| 15 to 19 Minutes | 115 | 11.0% |
| 20 to 24 Minutes | 159 | 15.2% |
| 25 to 29 Minutes | 50 | 4.8% |
| 30 to 34 Minutes | 63 | 6.0% |
| 35 to 39 Minutes | 37 | 3.5% |
| 40 to 44 Minutes | 14 | 1.3% |
| 45 to 59 Minutes | 49 | 4.7% |
| 60 to 89 Minutes | 11 | 1.1% |
| 90 or more Minutes | 14 | 1.3% |
Commute Time by Sex in Morton County
The most common commute times in Morton County are 5 to 9 minutes (91 commuters, 17.4%) for males and 5 to 9 minutes (229 commuters, 43.9%) for females.
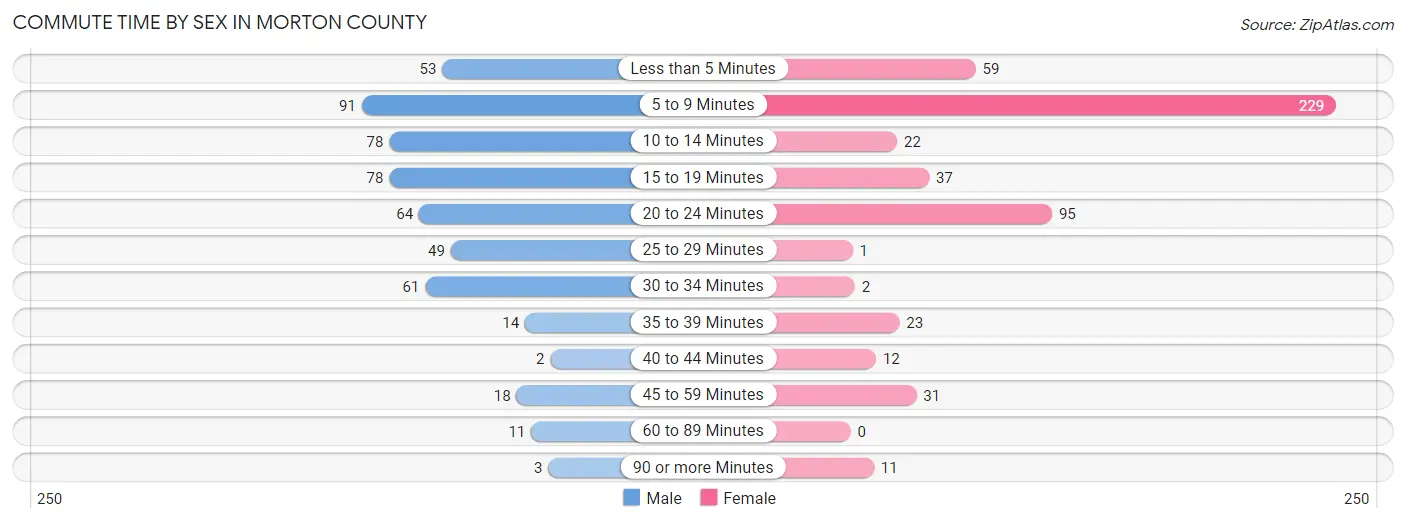
| Commute Time | Male | Female |
| Less than 5 Minutes | 53 (10.2%) | 59 (11.3%) |
| 5 to 9 Minutes | 91 (17.4%) | 229 (43.9%) |
| 10 to 14 Minutes | 78 (14.9%) | 22 (4.2%) |
| 15 to 19 Minutes | 78 (14.9%) | 37 (7.1%) |
| 20 to 24 Minutes | 64 (12.3%) | 95 (18.2%) |
| 25 to 29 Minutes | 49 (9.4%) | 1 (0.2%) |
| 30 to 34 Minutes | 61 (11.7%) | 2 (0.4%) |
| 35 to 39 Minutes | 14 (2.7%) | 23 (4.4%) |
| 40 to 44 Minutes | 2 (0.4%) | 12 (2.3%) |
| 45 to 59 Minutes | 18 (3.5%) | 31 (5.9%) |
| 60 to 89 Minutes | 11 (2.1%) | 0 (0.0%) |
| 90 or more Minutes | 3 (0.6%) | 11 (2.1%) |
Time of Departure to Work by Sex in Morton County
The most frequent times of departure to work in Morton County are 7:30 AM to 7:59 AM (152, 29.1%) for males and 5:30 AM to 5:59 AM (118, 22.6%) for females.
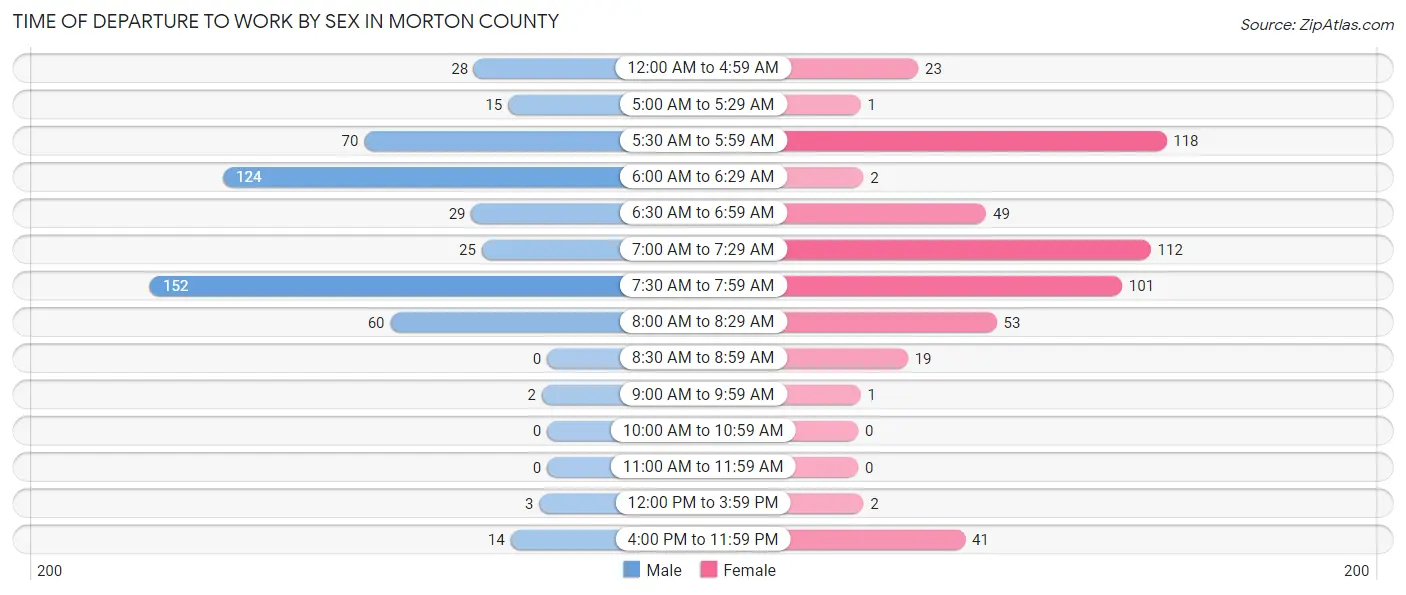
| Time of Departure | Male | Female |
| 12:00 AM to 4:59 AM | 28 (5.4%) | 23 (4.4%) |
| 5:00 AM to 5:29 AM | 15 (2.9%) | 1 (0.2%) |
| 5:30 AM to 5:59 AM | 70 (13.4%) | 118 (22.6%) |
| 6:00 AM to 6:29 AM | 124 (23.7%) | 2 (0.4%) |
| 6:30 AM to 6:59 AM | 29 (5.6%) | 49 (9.4%) |
| 7:00 AM to 7:29 AM | 25 (4.8%) | 112 (21.5%) |
| 7:30 AM to 7:59 AM | 152 (29.1%) | 101 (19.4%) |
| 8:00 AM to 8:29 AM | 60 (11.5%) | 53 (10.2%) |
| 8:30 AM to 8:59 AM | 0 (0.0%) | 19 (3.6%) |
| 9:00 AM to 9:59 AM | 2 (0.4%) | 1 (0.2%) |
| 10:00 AM to 10:59 AM | 0 (0.0%) | 0 (0.0%) |
| 11:00 AM to 11:59 AM | 0 (0.0%) | 0 (0.0%) |
| 12:00 PM to 3:59 PM | 3 (0.6%) | 2 (0.4%) |
| 4:00 PM to 11:59 PM | 14 (2.7%) | 41 (7.9%) |
| Total | 522 (100.0%) | 522 (100.0%) |
Housing Occupancy in Morton County
Occupancy by Ownership in Morton County
Of the total 939 dwellings in Morton County, owner-occupied units account for 687 (73.2%), while renter-occupied units make up 252 (26.8%).
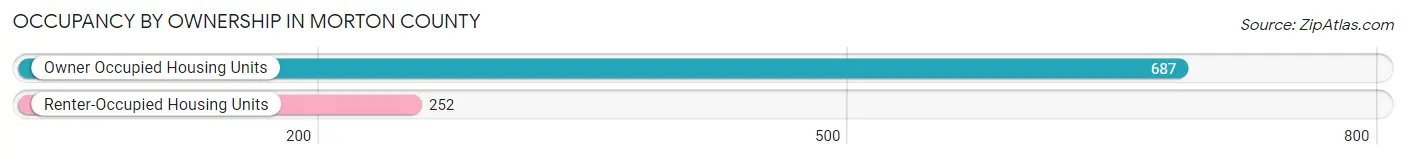
| Occupancy | # Housing Units | % Housing Units |
| Owner Occupied Housing Units | 687 | 73.2% |
| Renter-Occupied Housing Units | 252 | 26.8% |
| Total Occupied Housing Units | 939 | 100.0% |
Occupancy by Household Size in Morton County
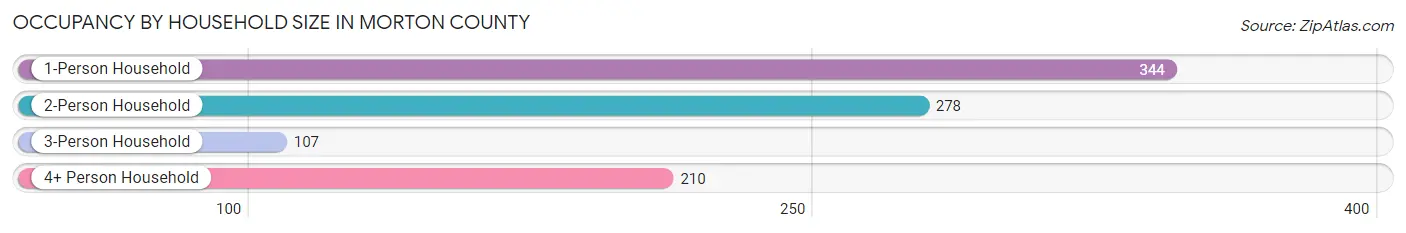
| Household Size | # Housing Units | % Housing Units |
| 1-Person Household | 344 | 36.6% |
| 2-Person Household | 278 | 29.6% |
| 3-Person Household | 107 | 11.4% |
| 4+ Person Household | 210 | 22.4% |
| Total Housing Units | 939 | 100.0% |
Occupancy by Ownership by Household Size in Morton County
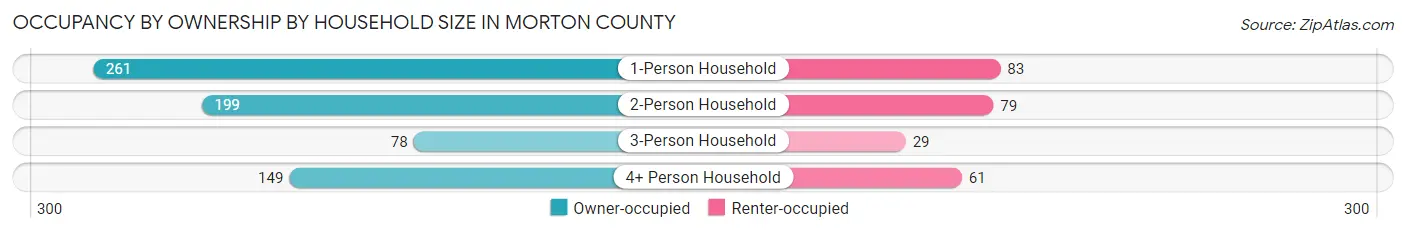
| Household Size | Owner-occupied | Renter-occupied |
| 1-Person Household | 261 (75.9%) | 83 (24.1%) |
| 2-Person Household | 199 (71.6%) | 79 (28.4%) |
| 3-Person Household | 78 (72.9%) | 29 (27.1%) |
| 4+ Person Household | 149 (71.0%) | 61 (29.0%) |
| Total Housing Units | 687 (73.2%) | 252 (26.8%) |
Occupancy by Educational Attainment in Morton County
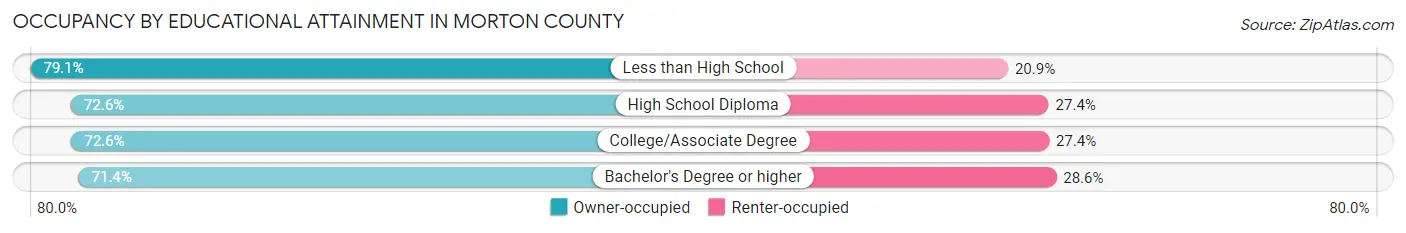
| Household Size | Owner-occupied | Renter-occupied |
| Less than High School | 87 (79.1%) | 23 (20.9%) |
| High School Diploma | 239 (72.6%) | 90 (27.4%) |
| College/Associate Degree | 241 (72.6%) | 91 (27.4%) |
| Bachelor's Degree or higher | 120 (71.4%) | 48 (28.6%) |
Occupancy by Age of Householder in Morton County
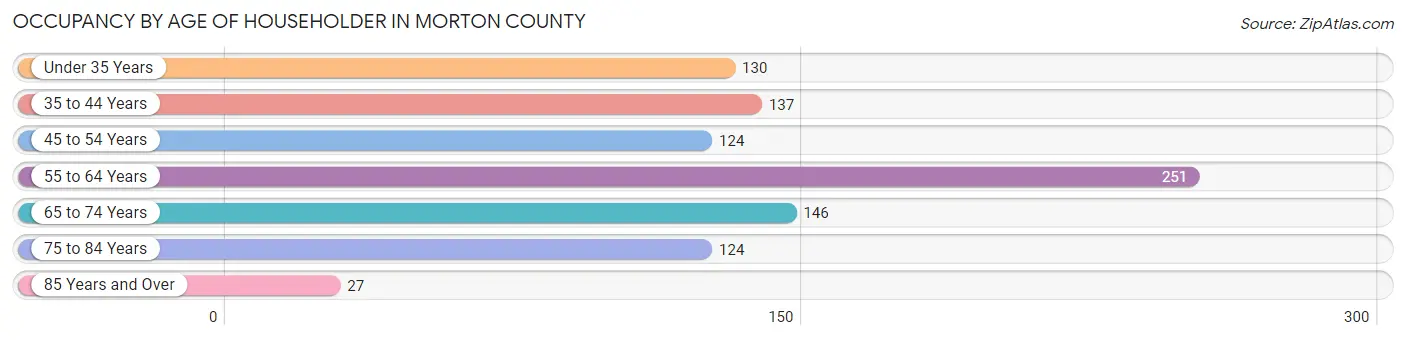
| Age Bracket | # Households | % Households |
| Under 35 Years | 130 | 13.8% |
| 35 to 44 Years | 137 | 14.6% |
| 45 to 54 Years | 124 | 13.2% |
| 55 to 64 Years | 251 | 26.7% |
| 65 to 74 Years | 146 | 15.5% |
| 75 to 84 Years | 124 | 13.2% |
| 85 Years and Over | 27 | 2.9% |
| Total | 939 | 100.0% |
Housing Finances in Morton County
Median Income by Occupancy in Morton County
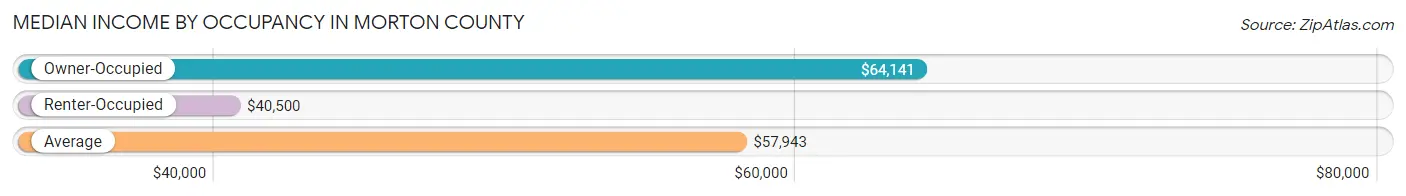
| Occupancy Type | # Households | Median Income |
| Owner-Occupied | 687 (73.2%) | $64,141 |
| Renter-Occupied | 252 (26.8%) | $40,500 |
| Average | 939 (100.0%) | $57,943 |
Occupancy by Householder Income Bracket in Morton County
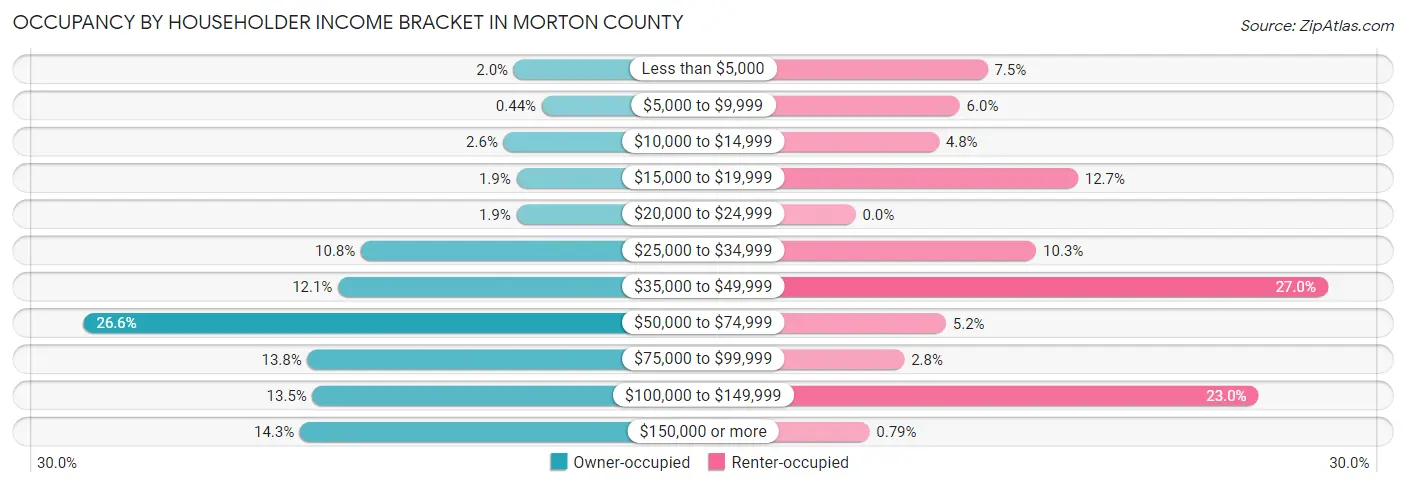
| Income Bracket | Owner-occupied | Renter-occupied |
| Less than $5,000 | 14 (2.0%) | 19 (7.5%) |
| $5,000 to $9,999 | 3 (0.4%) | 15 (5.9%) |
| $10,000 to $14,999 | 18 (2.6%) | 12 (4.8%) |
| $15,000 to $19,999 | 13 (1.9%) | 32 (12.7%) |
| $20,000 to $24,999 | 13 (1.9%) | 0 (0.0%) |
| $25,000 to $34,999 | 74 (10.8%) | 26 (10.3%) |
| $35,000 to $49,999 | 83 (12.1%) | 68 (27.0%) |
| $50,000 to $74,999 | 183 (26.6%) | 13 (5.2%) |
| $75,000 to $99,999 | 95 (13.8%) | 7 (2.8%) |
| $100,000 to $149,999 | 93 (13.5%) | 58 (23.0%) |
| $150,000 or more | 98 (14.3%) | 2 (0.8%) |
| Total | 687 (100.0%) | 252 (100.0%) |
Monthly Housing Cost Tiers in Morton County
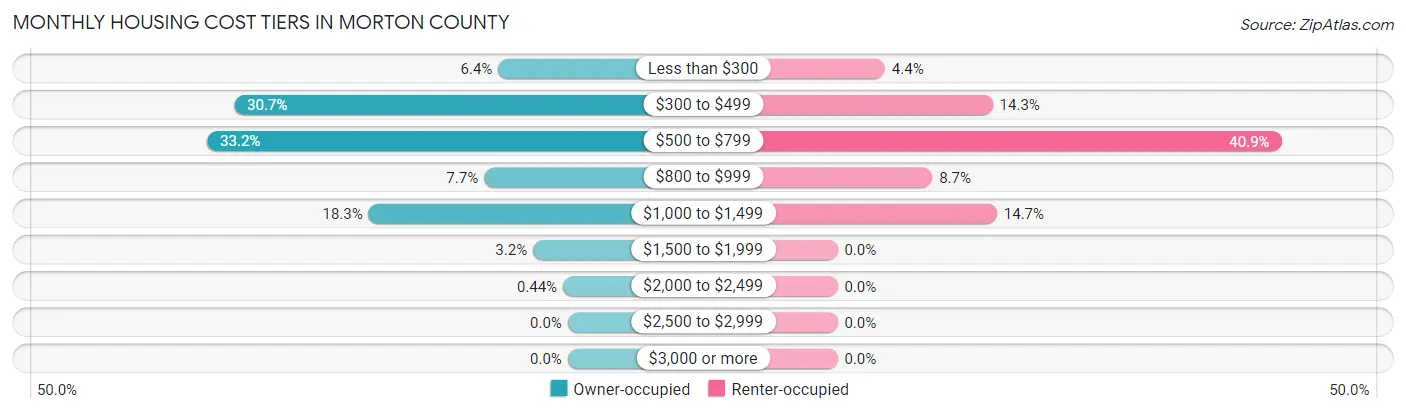
| Monthly Cost | Owner-occupied | Renter-occupied |
| Less than $300 | 44 (6.4%) | 11 (4.4%) |
| $300 to $499 | 211 (30.7%) | 36 (14.3%) |
| $500 to $799 | 228 (33.2%) | 103 (40.9%) |
| $800 to $999 | 53 (7.7%) | 22 (8.7%) |
| $1,000 to $1,499 | 126 (18.3%) | 37 (14.7%) |
| $1,500 to $1,999 | 22 (3.2%) | 0 (0.0%) |
| $2,000 to $2,499 | 3 (0.4%) | 0 (0.0%) |
| $2,500 to $2,999 | 0 (0.0%) | 0 (0.0%) |
| $3,000 or more | 0 (0.0%) | 0 (0.0%) |
| Total | 687 (100.0%) | 252 (100.0%) |
Physical Housing Characteristics in Morton County
Housing Structures in Morton County
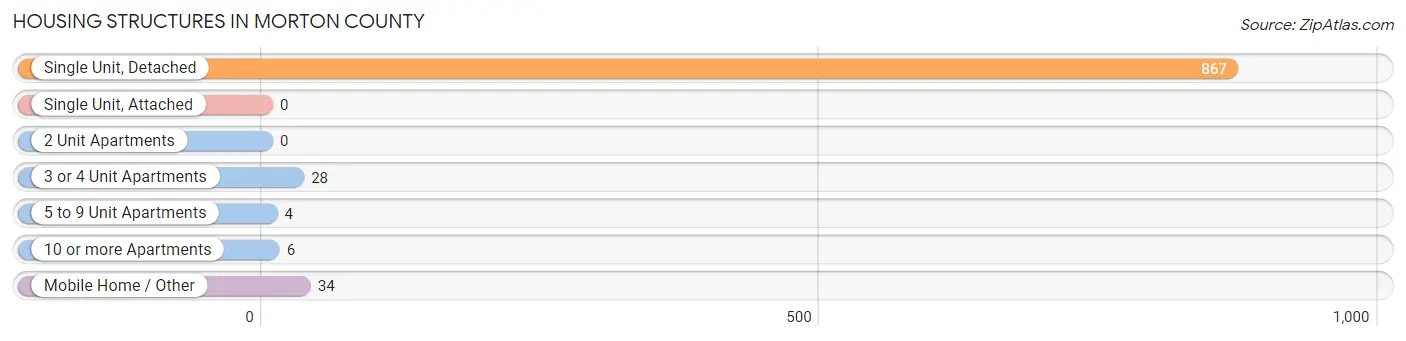
| Structure Type | # Housing Units | % Housing Units |
| Single Unit, Detached | 867 | 92.3% |
| Single Unit, Attached | 0 | 0.0% |
| 2 Unit Apartments | 0 | 0.0% |
| 3 or 4 Unit Apartments | 28 | 3.0% |
| 5 to 9 Unit Apartments | 4 | 0.4% |
| 10 or more Apartments | 6 | 0.6% |
| Mobile Home / Other | 34 | 3.6% |
| Total | 939 | 100.0% |
Housing Structures by Occupancy in Morton County
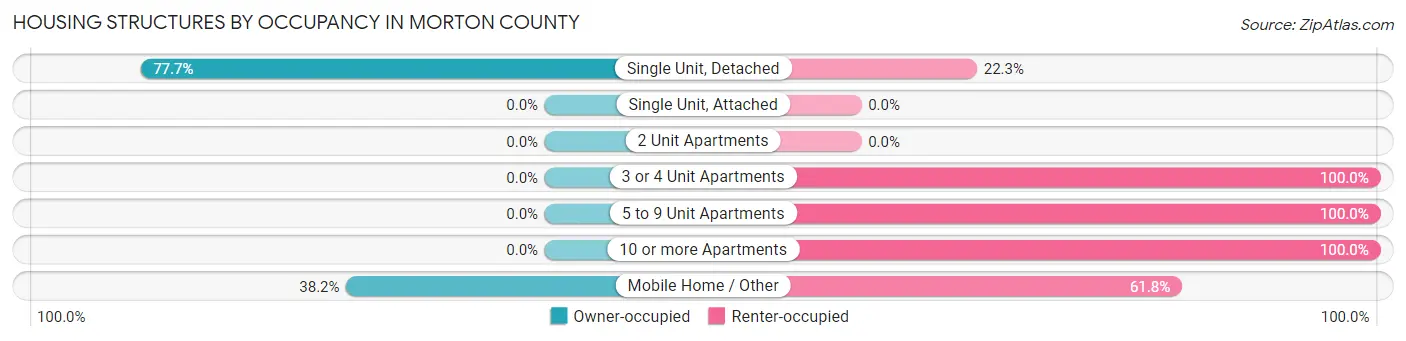
| Structure Type | Owner-occupied | Renter-occupied |
| Single Unit, Detached | 674 (77.7%) | 193 (22.3%) |
| Single Unit, Attached | 0 (0.0%) | 0 (0.0%) |
| 2 Unit Apartments | 0 (0.0%) | 0 (0.0%) |
| 3 or 4 Unit Apartments | 0 (0.0%) | 28 (100.0%) |
| 5 to 9 Unit Apartments | 0 (0.0%) | 4 (100.0%) |
| 10 or more Apartments | 0 (0.0%) | 6 (100.0%) |
| Mobile Home / Other | 13 (38.2%) | 21 (61.8%) |
| Total | 687 (73.2%) | 252 (26.8%) |
Housing Structures by Number of Rooms in Morton County
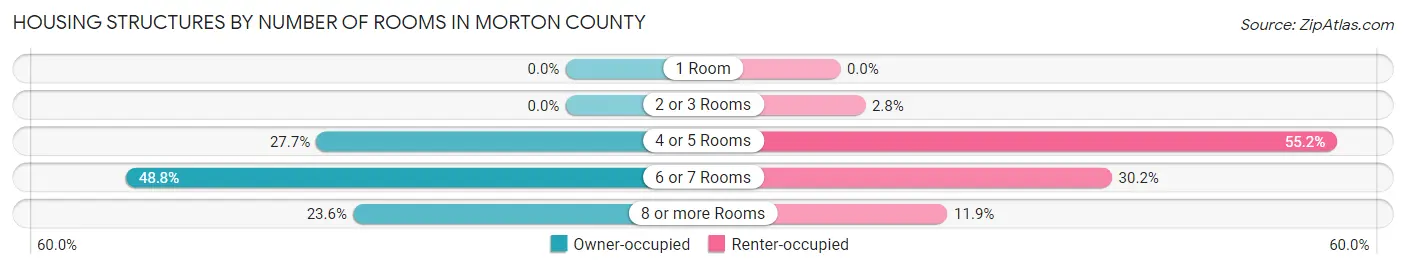
| Number of Rooms | Owner-occupied | Renter-occupied |
| 1 Room | 0 (0.0%) | 0 (0.0%) |
| 2 or 3 Rooms | 0 (0.0%) | 7 (2.8%) |
| 4 or 5 Rooms | 190 (27.7%) | 139 (55.2%) |
| 6 or 7 Rooms | 335 (48.8%) | 76 (30.2%) |
| 8 or more Rooms | 162 (23.6%) | 30 (11.9%) |
| Total | 687 (100.0%) | 252 (100.0%) |
Housing Structure by Heating Type in Morton County
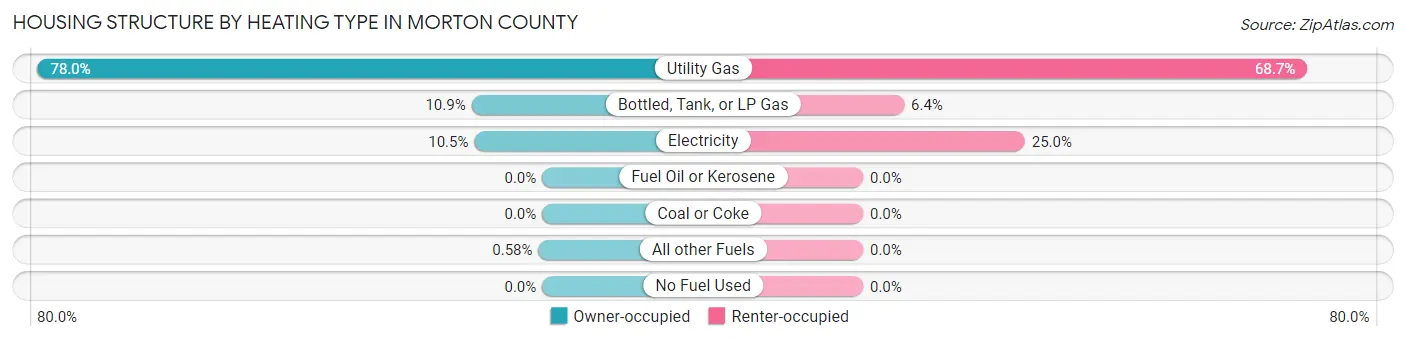
| Heating Type | Owner-occupied | Renter-occupied |
| Utility Gas | 536 (78.0%) | 173 (68.6%) |
| Bottled, Tank, or LP Gas | 75 (10.9%) | 16 (6.4%) |
| Electricity | 72 (10.5%) | 63 (25.0%) |
| Fuel Oil or Kerosene | 0 (0.0%) | 0 (0.0%) |
| Coal or Coke | 0 (0.0%) | 0 (0.0%) |
| All other Fuels | 4 (0.6%) | 0 (0.0%) |
| No Fuel Used | 0 (0.0%) | 0 (0.0%) |
| Total | 687 (100.0%) | 252 (100.0%) |
Household Vehicle Usage in Morton County
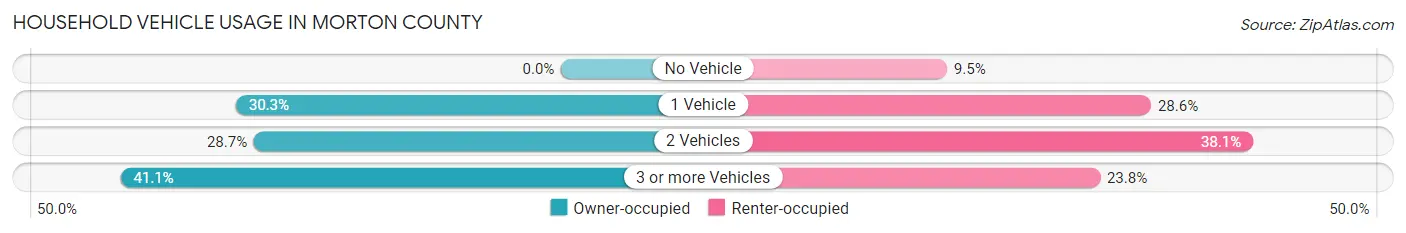
| Vehicles per Household | Owner-occupied | Renter-occupied |
| No Vehicle | 0 (0.0%) | 24 (9.5%) |
| 1 Vehicle | 208 (30.3%) | 72 (28.6%) |
| 2 Vehicles | 197 (28.7%) | 96 (38.1%) |
| 3 or more Vehicles | 282 (41.0%) | 60 (23.8%) |
| Total | 687 (100.0%) | 252 (100.0%) |
Real Estate & Mortgages in Morton County
Real Estate and Mortgage Overview in Morton County
| Characteristic | Without Mortgage | With Mortgage |
| Housing Units | 489 | 198 |
| Median Property Value | $98,500 | $91,600 |
| Median Household Income | $56,573 | $32 |
| Monthly Housing Costs | $493 | $0 |
| Real Estate Taxes | $1,726 | $0 |
Property Value by Mortgage Status in Morton County
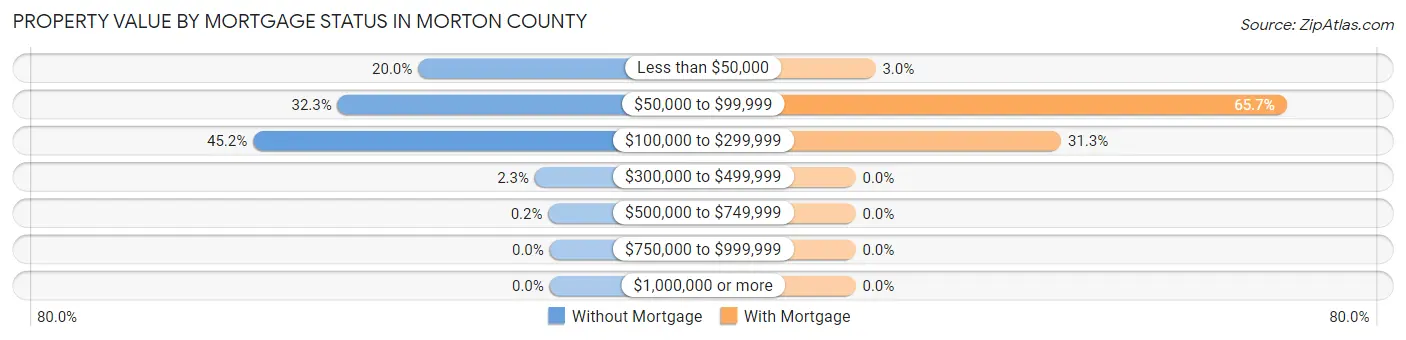
| Property Value | Without Mortgage | With Mortgage |
| Less than $50,000 | 98 (20.0%) | 6 (3.0%) |
| $50,000 to $99,999 | 158 (32.3%) | 130 (65.7%) |
| $100,000 to $299,999 | 221 (45.2%) | 62 (31.3%) |
| $300,000 to $499,999 | 11 (2.2%) | 0 (0.0%) |
| $500,000 to $749,999 | 1 (0.2%) | 0 (0.0%) |
| $750,000 to $999,999 | 0 (0.0%) | 0 (0.0%) |
| $1,000,000 or more | 0 (0.0%) | 0 (0.0%) |
| Total | 489 (100.0%) | 198 (100.0%) |
Household Income by Mortgage Status in Morton County
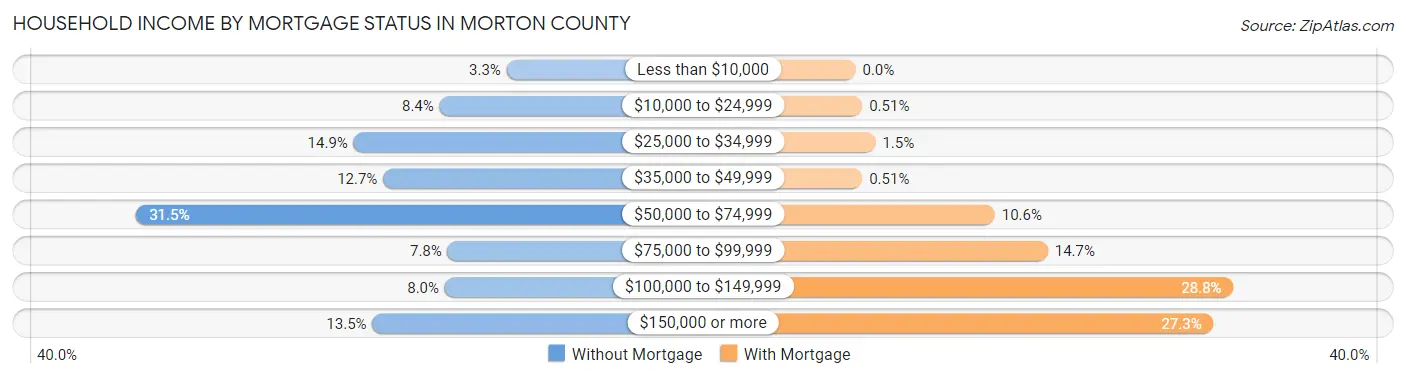
| Household Income | Without Mortgage | With Mortgage |
| Less than $10,000 | 16 (3.3%) | 0 (0.0%) |
| $10,000 to $24,999 | 41 (8.4%) | 1 (0.5%) |
| $25,000 to $34,999 | 73 (14.9%) | 3 (1.5%) |
| $35,000 to $49,999 | 62 (12.7%) | 1 (0.5%) |
| $50,000 to $74,999 | 154 (31.5%) | 21 (10.6%) |
| $75,000 to $99,999 | 38 (7.8%) | 29 (14.6%) |
| $100,000 to $149,999 | 39 (8.0%) | 57 (28.8%) |
| $150,000 or more | 66 (13.5%) | 54 (27.3%) |
| Total | 489 (100.0%) | 198 (100.0%) |
Property Value to Household Income Ratio in Morton County
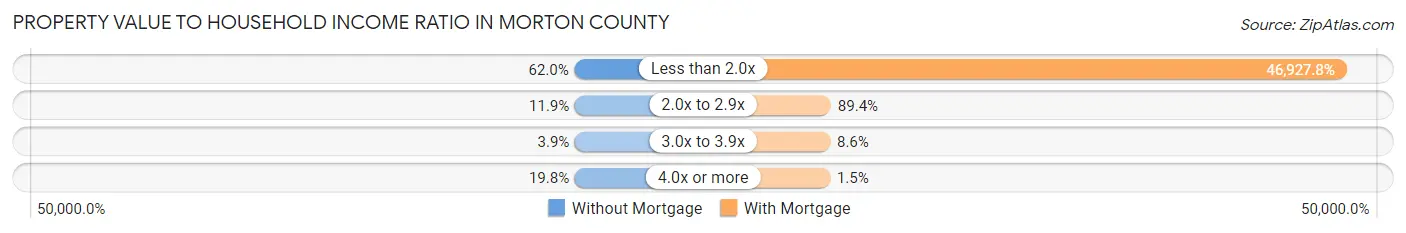
| Value-to-Income Ratio | Without Mortgage | With Mortgage |
| Less than 2.0x | 303 (62.0%) | 92,917 (46,927.8%) |
| 2.0x to 2.9x | 58 (11.9%) | 177 (89.4%) |
| 3.0x to 3.9x | 19 (3.9%) | 17 (8.6%) |
| 4.0x or more | 97 (19.8%) | 3 (1.5%) |
| Total | 489 (100.0%) | 198 (100.0%) |
Real Estate Taxes by Mortgage Status in Morton County
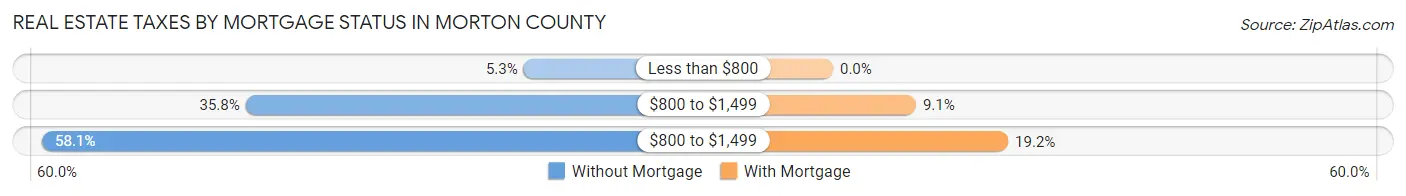
| Property Taxes | Without Mortgage | With Mortgage |
| Less than $800 | 26 (5.3%) | 0 (0.0%) |
| $800 to $1,499 | 175 (35.8%) | 18 (9.1%) |
| $800 to $1,499 | 284 (58.1%) | 38 (19.2%) |
| Total | 489 (100.0%) | 198 (100.0%) |
Health & Disability in Morton County
Health Insurance Coverage by Age in Morton County
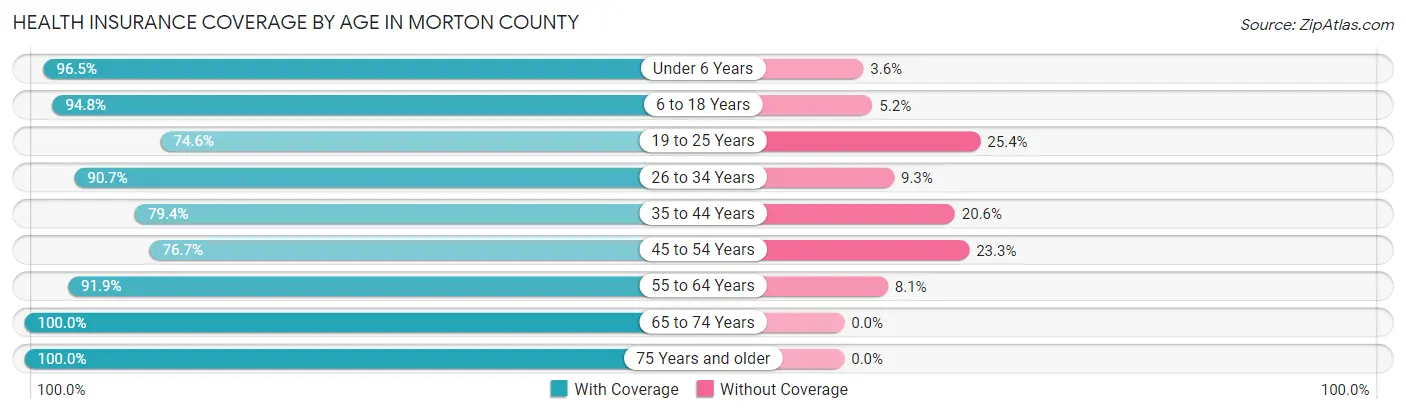
| Age Bracket | With Coverage | Without Coverage |
| Under 6 Years | 190 (96.5%) | 7 (3.5%) |
| 6 to 18 Years | 506 (94.8%) | 28 (5.2%) |
| 19 to 25 Years | 97 (74.6%) | 33 (25.4%) |
| 26 to 34 Years | 313 (90.7%) | 32 (9.3%) |
| 35 to 44 Years | 204 (79.4%) | 53 (20.6%) |
| 45 to 54 Years | 237 (76.7%) | 72 (23.3%) |
| 55 to 64 Years | 328 (91.9%) | 29 (8.1%) |
| 65 to 74 Years | 286 (100.0%) | 0 (0.0%) |
| 75 Years and older | 200 (100.0%) | 0 (0.0%) |
| Total | 2,361 (90.3%) | 254 (9.7%) |
Health Insurance Coverage by Citizenship Status in Morton County
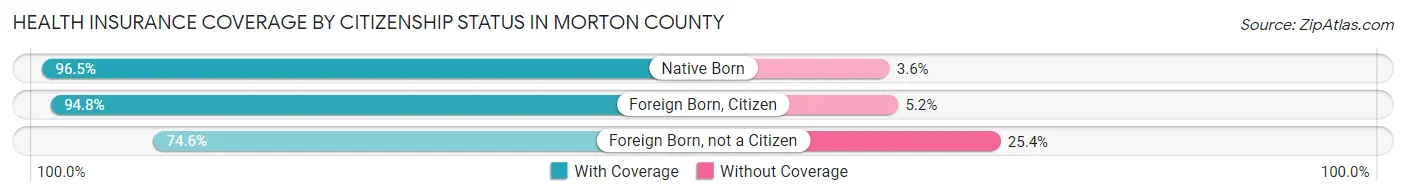
| Citizenship Status | With Coverage | Without Coverage |
| Native Born | 190 (96.5%) | 7 (3.5%) |
| Foreign Born, Citizen | 506 (94.8%) | 28 (5.2%) |
| Foreign Born, not a Citizen | 97 (74.6%) | 33 (25.4%) |
Health Insurance Coverage by Household Income in Morton County
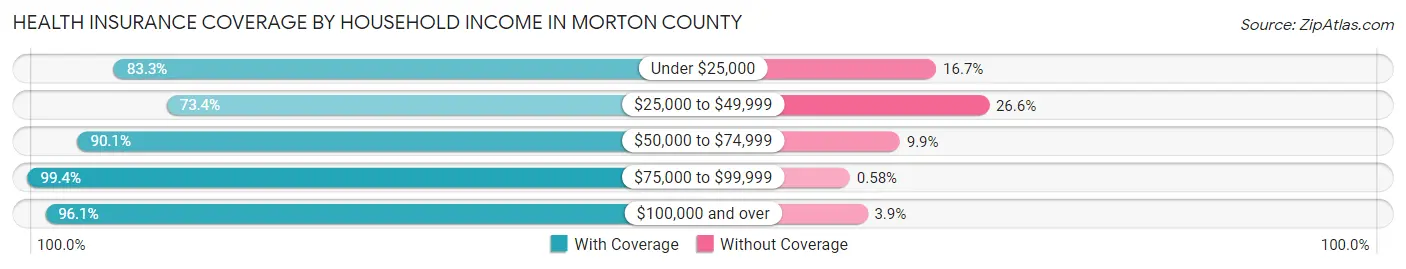
| Household Income | With Coverage | Without Coverage |
| Under $25,000 | 184 (83.3%) | 37 (16.7%) |
| $25,000 to $49,999 | 369 (73.4%) | 134 (26.6%) |
| $50,000 to $74,999 | 399 (90.1%) | 44 (9.9%) |
| $75,000 to $99,999 | 514 (99.4%) | 3 (0.6%) |
| $100,000 and over | 895 (96.1%) | 36 (3.9%) |
Public vs Private Health Insurance Coverage by Age in Morton County
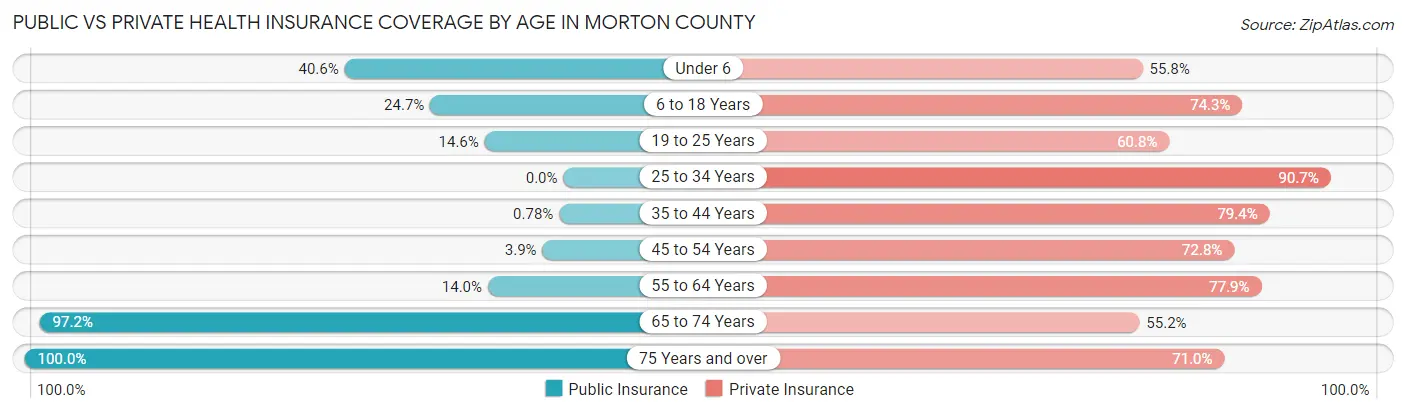
| Age Bracket | Public Insurance | Private Insurance |
| Under 6 | 80 (40.6%) | 110 (55.8%) |
| 6 to 18 Years | 132 (24.7%) | 397 (74.3%) |
| 19 to 25 Years | 19 (14.6%) | 79 (60.8%) |
| 25 to 34 Years | 0 (0.0%) | 313 (90.7%) |
| 35 to 44 Years | 2 (0.8%) | 204 (79.4%) |
| 45 to 54 Years | 12 (3.9%) | 225 (72.8%) |
| 55 to 64 Years | 50 (14.0%) | 278 (77.9%) |
| 65 to 74 Years | 278 (97.2%) | 158 (55.2%) |
| 75 Years and over | 200 (100.0%) | 142 (71.0%) |
| Total | 773 (29.6%) | 1,906 (72.9%) |
Disability Status by Sex by Age in Morton County
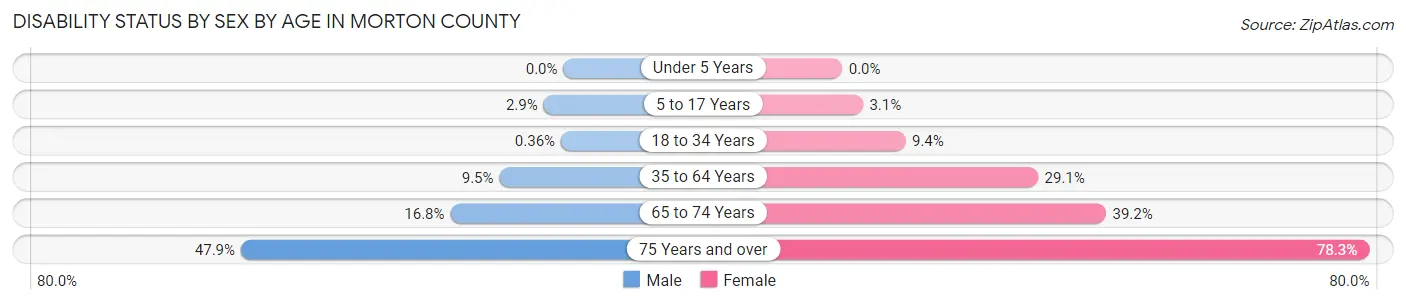
| Age Bracket | Male | Female |
| Under 5 Years | 0 (0.0%) | 0 (0.0%) |
| 5 to 17 Years | 7 (2.9%) | 10 (3.1%) |
| 18 to 34 Years | 1 (0.4%) | 23 (9.4%) |
| 35 to 64 Years | 40 (9.5%) | 146 (29.1%) |
| 65 to 74 Years | 24 (16.8%) | 56 (39.2%) |
| 75 Years and over | 34 (47.9%) | 101 (78.3%) |
Disability Class by Sex by Age in Morton County
Disability Class: Hearing Difficulty
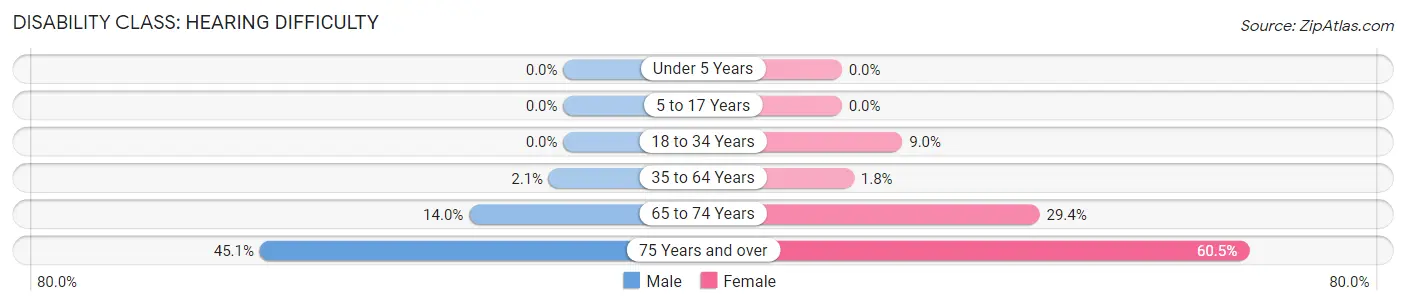
| Age Bracket | Male | Female |
| Under 5 Years | 0 (0.0%) | 0 (0.0%) |
| 5 to 17 Years | 0 (0.0%) | 0 (0.0%) |
| 18 to 34 Years | 0 (0.0%) | 22 (9.0%) |
| 35 to 64 Years | 9 (2.1%) | 9 (1.8%) |
| 65 to 74 Years | 20 (14.0%) | 42 (29.4%) |
| 75 Years and over | 32 (45.1%) | 78 (60.5%) |
Disability Class: Vision Difficulty
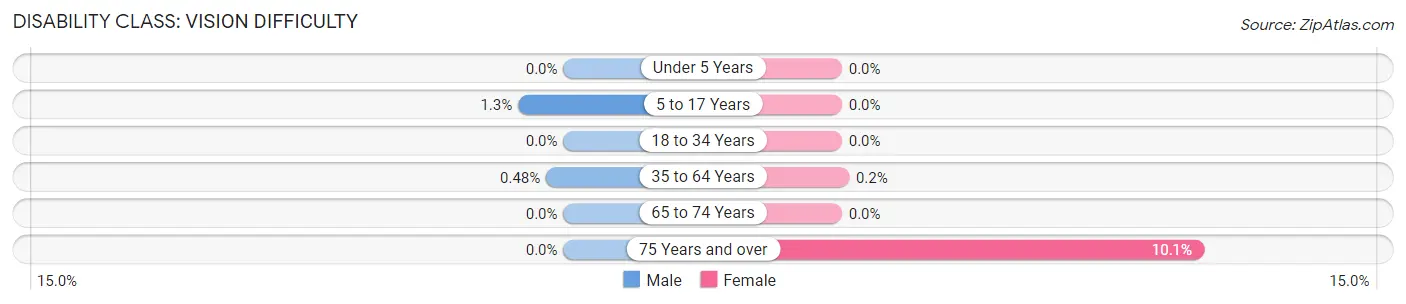
| Age Bracket | Male | Female |
| Under 5 Years | 0 (0.0%) | 0 (0.0%) |
| 5 to 17 Years | 3 (1.3%) | 0 (0.0%) |
| 18 to 34 Years | 0 (0.0%) | 0 (0.0%) |
| 35 to 64 Years | 2 (0.5%) | 1 (0.2%) |
| 65 to 74 Years | 0 (0.0%) | 0 (0.0%) |
| 75 Years and over | 0 (0.0%) | 13 (10.1%) |
Disability Class: Cognitive Difficulty
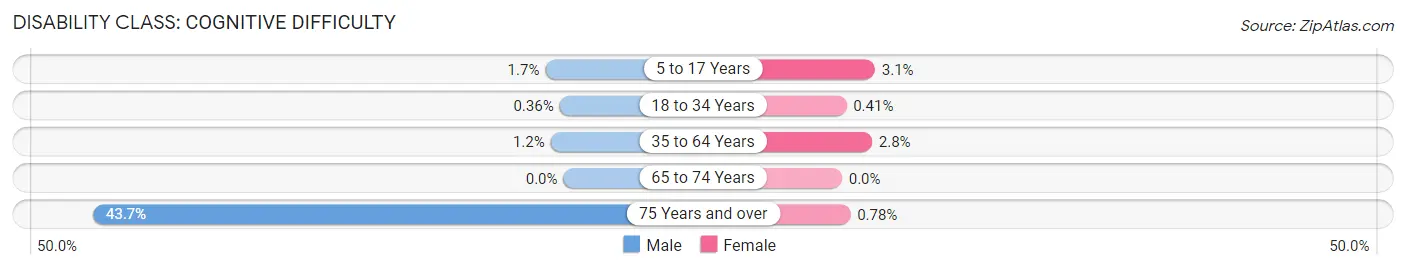
| Age Bracket | Male | Female |
| 5 to 17 Years | 4 (1.7%) | 10 (3.1%) |
| 18 to 34 Years | 1 (0.4%) | 1 (0.4%) |
| 35 to 64 Years | 5 (1.2%) | 14 (2.8%) |
| 65 to 74 Years | 0 (0.0%) | 0 (0.0%) |
| 75 Years and over | 31 (43.7%) | 1 (0.8%) |
Disability Class: Ambulatory Difficulty
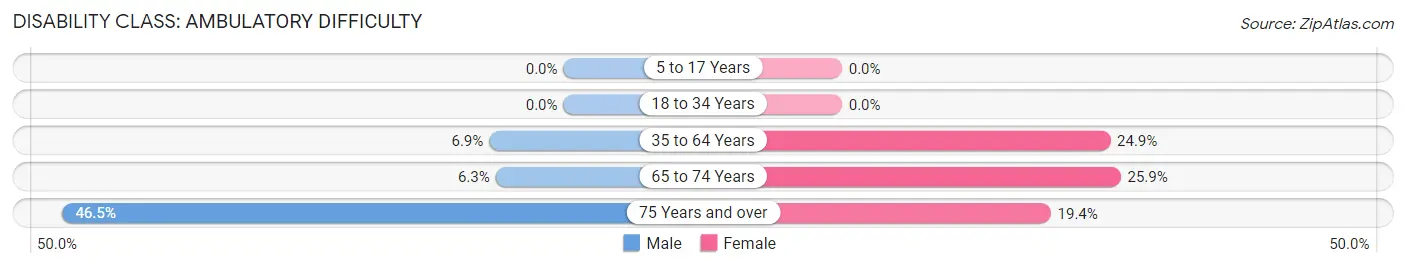
| Age Bracket | Male | Female |
| 5 to 17 Years | 0 (0.0%) | 0 (0.0%) |
| 18 to 34 Years | 0 (0.0%) | 0 (0.0%) |
| 35 to 64 Years | 29 (6.9%) | 125 (24.9%) |
| 65 to 74 Years | 9 (6.3%) | 37 (25.9%) |
| 75 Years and over | 33 (46.5%) | 25 (19.4%) |
Disability Class: Self-Care Difficulty
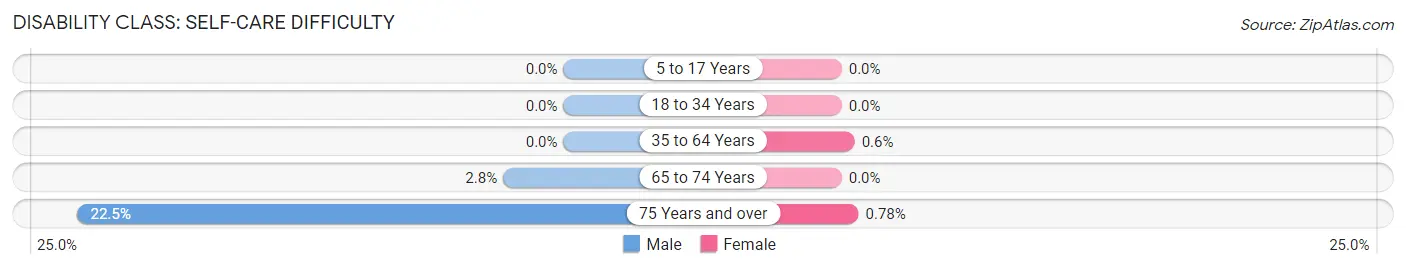
| Age Bracket | Male | Female |
| 5 to 17 Years | 0 (0.0%) | 0 (0.0%) |
| 18 to 34 Years | 0 (0.0%) | 0 (0.0%) |
| 35 to 64 Years | 0 (0.0%) | 3 (0.6%) |
| 65 to 74 Years | 4 (2.8%) | 0 (0.0%) |
| 75 Years and over | 16 (22.5%) | 1 (0.8%) |
Technology Access in Morton County
Computing Device Access in Morton County
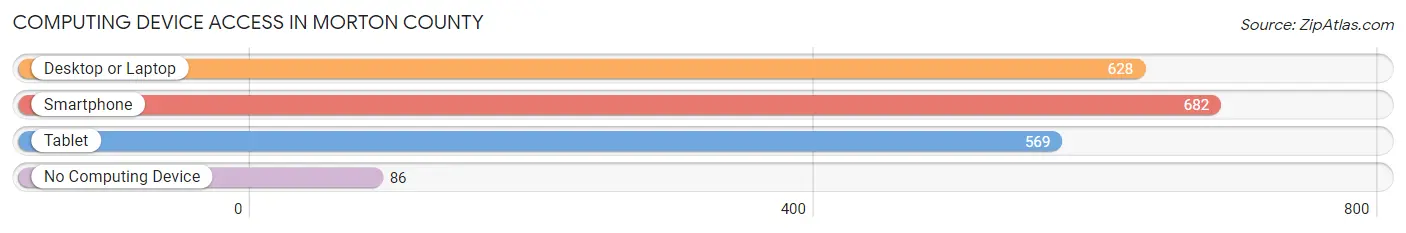
| Device Type | # Households | % Households |
| Desktop or Laptop | 628 | 66.9% |
| Smartphone | 682 | 72.6% |
| Tablet | 569 | 60.6% |
| No Computing Device | 86 | 9.2% |
| Total | 939 | 100.0% |
Internet Access in Morton County
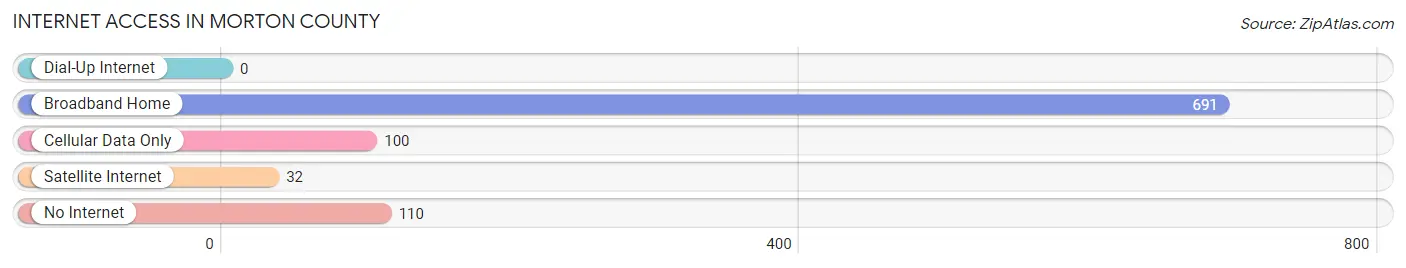
| Internet Type | # Households | % Households |
| Dial-Up Internet | 0 | 0.0% |
| Broadband Home | 691 | 73.6% |
| Cellular Data Only | 100 | 10.6% |
| Satellite Internet | 32 | 3.4% |
| No Internet | 110 | 11.7% |
| Total | 939 | 100.0% |
Morton County Summary
Morton County is located in the western part of the state of Kansas, and is bordered by Stevens County to the north, Grant County to the east, Seward County to the south, and Haskell County to the west. The county seat is Elkhart, and the largest city is Richfield. The county was named after Oliver P. Morton, a U.S. Senator from Indiana.
Geography
Morton County covers an area of 890 square miles, and is located in the High Plains region of the Great Plains. The county is mostly flat, with some rolling hills in the east. The Cimarron River flows through the county, and there are several small lakes and reservoirs. The county is mostly covered in grassland, with some areas of cropland.
Demographics
As of the 2010 census, the population of Morton County was 3,233, with a population density of 3.6 people per square mile. The racial makeup of the county was 95.2% White, 0.3% African American, 0.7% Native American, 0.2% Asian, 0.1% Pacific Islander, 2.2% from other races, and 1.3% from two or more races. Hispanic or Latino of any race were 4.2% of the population.
The median income for a household in the county was $37,917, and the median income for a family was $45,000. The per capita income for the county was $17,845. About 11.2% of families and 14.2% of the population were below the poverty line, including 17.2% of those under age 18 and 8.2% of those age 65 or over.
Economy
Morton County’s economy is largely based on agriculture. The county is home to several large farms, and the main crops grown are wheat, corn, sorghum, and soybeans. Cattle and sheep are also raised in the county.
The county also has a few small businesses, including a few restaurants, a grocery store, and a few gas stations. There is also a small manufacturing sector, with a few small factories producing furniture, clothing, and other goods.
History
Morton County was established in 1887, and was named after Oliver P. Morton, a U.S. Senator from Indiana. The county was originally part of Stevens County, but was split off in 1887.
The first settlers in the county were mostly farmers, and the county quickly grew as more settlers moved in. The county was largely agricultural, and the main crops grown were wheat, corn, sorghum, and soybeans.
In the early 1900s, the county began to develop a small manufacturing sector, with a few small factories producing furniture, clothing, and other goods. The county also had a few small businesses, including a few restaurants, a grocery store, and a few gas stations.
In the 1950s, the county began to experience a population decline, as many people moved away to larger cities. This trend has continued, and the population of the county has declined steadily since then.
Today, Morton County is still largely agricultural, and the main crops grown are wheat, corn, sorghum, and soybeans. The county also has a few small businesses, including a few restaurants, a grocery store, and a few gas stations. The county is also home to a few small manufacturing companies, producing furniture, clothing, and other goods.
Common Questions
What is Per Capita Income in Morton County?
Per Capita income in Morton County is $27,423.
What is the Median Family Income in Morton County?
Median Family Income in Morton County is $80,563.
What is the Median Household income in Morton County?
Median Household Income in Morton County is $57,943.
What is Income or Wage Gap in Morton County?
Income or Wage Gap in Morton County is 39.2%.
Women in Morton County earn 60.8 cents for every dollar earned by a man.
What is Inequality or Gini Index in Morton County?
Inequality or Gini Index in Morton County is 0.39.
What is the Total Population of Morton County?
Total Population of Morton County is 2,688.
What is the Total Male Population of Morton County?
Total Male Population of Morton County is 1,268.
What is the Total Female Population of Morton County?
Total Female Population of Morton County is 1,420.
What is the Ratio of Males per 100 Females in Morton County?
There are 89.30 Males per 100 Females in Morton County.
What is the Ratio of Females per 100 Males in Morton County?
There are 111.99 Females per 100 Males in Morton County.
What is the Median Population Age in Morton County?
Median Population Age in Morton County is 39.5 Years.
What is the Average Family Size in Morton County
Average Family Size in Morton County is 3.9 People.
What is the Average Household Size in Morton County
Average Household Size in Morton County is 2.8 People.
How Large is the Labor Force in Morton County?
There are 1,220 People in the Labor Forcein in Morton County.
What is the Percentage of People in the Labor Force in Morton County?
59.2% of People are in the Labor Force in Morton County.
What is the Unemployment Rate in Morton County?
Unemployment Rate in Morton County is 3.3%.