Hodgeman County, KS Map & Demographics
Hodgeman County Map
Hodgeman County Overview
$33,911
PER CAPITA INCOME
$83,162
AVG FAMILY INCOME
$63,125
AVG HOUSEHOLD INCOME
40.6%
WAGE / INCOME GAP [ % ]
59.4¢/ $1
WAGE / INCOME GAP [ $ ]
0.37
INEQUALITY / GINI INDEX
1,770
TOTAL POPULATION
849
MALE POPULATION
921
FEMALE POPULATION
92.18
MALES / 100 FEMALES
108.48
FEMALES / 100 MALES
46.0
MEDIAN AGE
3.2
AVG FAMILY SIZE
2.5
AVG HOUSEHOLD SIZE
875
LABOR FORCE [ PEOPLE ]
61.5%
PERCENT IN LABOR FORCE
2.1%
UNEMPLOYMENT RATE
Hodgeman County Area Codes
Income in Hodgeman County
Income Overview in Hodgeman County
Per Capita Income in Hodgeman County is $33,911, while median incomes of families and households are $83,162 and $63,125 respectively.
| Characteristic | Number | Measure |
| Per Capita Income | 1,770 | $33,911 |
| Median Family Income | 435 | $83,162 |
| Mean Family Income | 435 | $93,514 |
| Median Household Income | 710 | $63,125 |
| Mean Household Income | 710 | $79,682 |
| Income Deficit | 435 | $0 |
| Wage / Income Gap (%) | 1,770 | 40.60% |
| Wage / Income Gap ($) | 1,770 | 59.40¢ per $1 |
| Gini / Inequality Index | 1,770 | 0.37 |
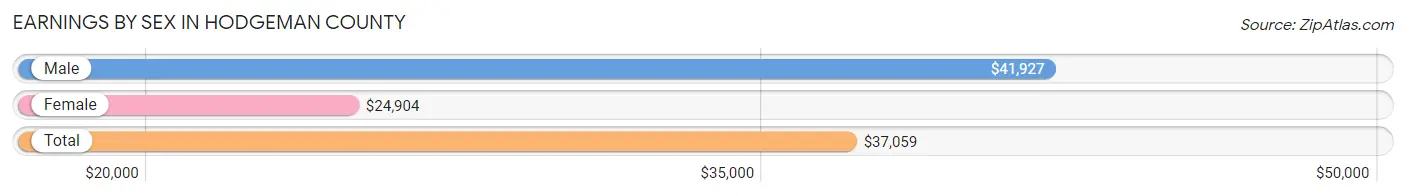
Earnings by Sex in Hodgeman County
Average Earnings in Hodgeman County are $37,059, $41,927 for men and $24,904 for women, a difference of 40.6%.
| Sex | Number | Average Earnings |
| Male | 539 (56.0%) | $41,927 |
| Female | 423 (44.0%) | $24,904 |
| Total | 962 (100.0%) | $37,059 |
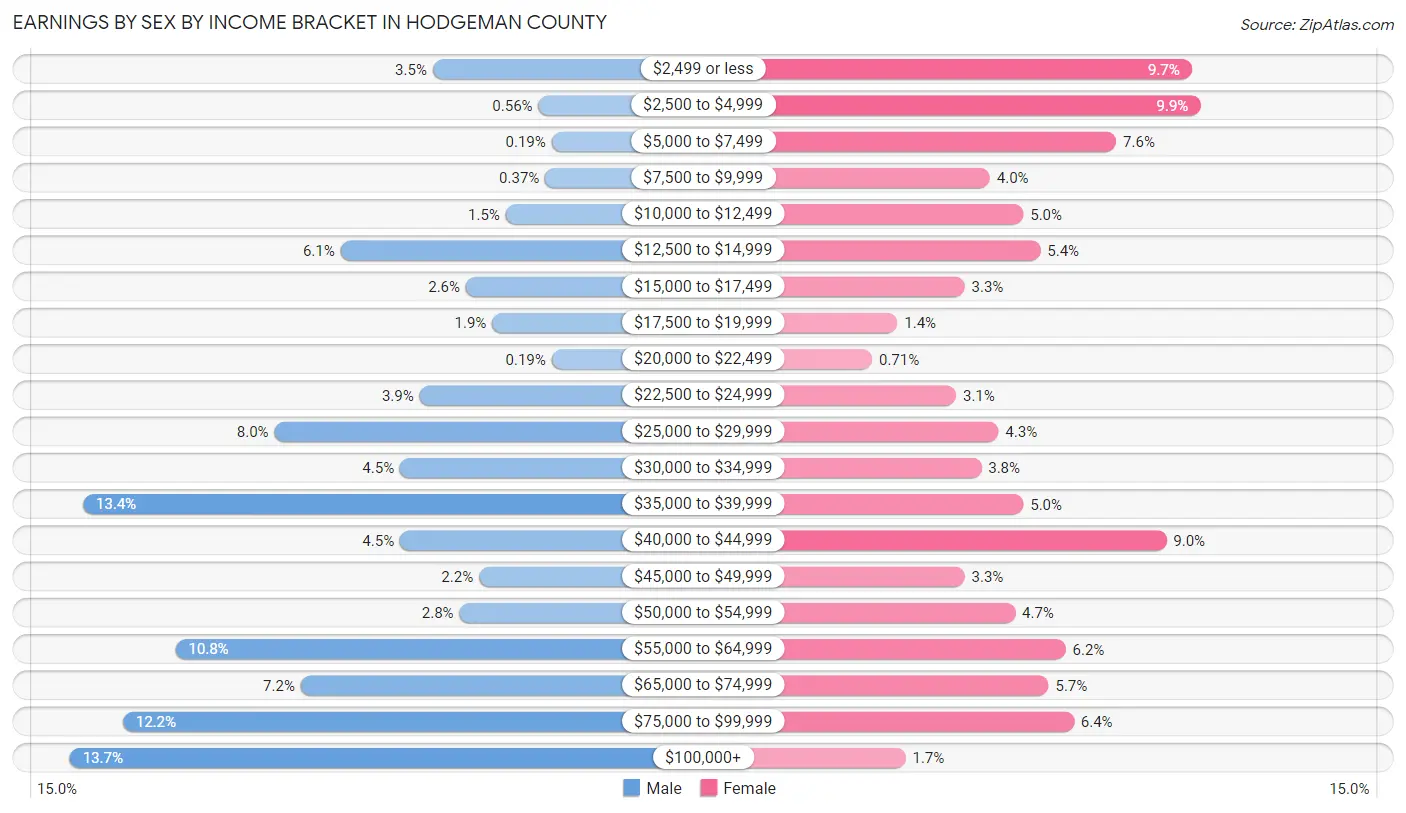
Earnings by Sex by Income Bracket in Hodgeman County
The most common earnings brackets in Hodgeman County are $100,000+ for men (74 | 13.7%) and $2,500 to $4,999 for women (42 | 9.9%).
| Income | Male | Female |
| $2,499 or less | 19 (3.5%) | 41 (9.7%) |
| $2,500 to $4,999 | 3 (0.6%) | 42 (9.9%) |
| $5,000 to $7,499 | 1 (0.2%) | 32 (7.6%) |
| $7,500 to $9,999 | 2 (0.4%) | 17 (4.0%) |
| $10,000 to $12,499 | 8 (1.5%) | 21 (5.0%) |
| $12,500 to $14,999 | 33 (6.1%) | 23 (5.4%) |
| $15,000 to $17,499 | 14 (2.6%) | 14 (3.3%) |
| $17,500 to $19,999 | 10 (1.9%) | 6 (1.4%) |
| $20,000 to $22,499 | 1 (0.2%) | 3 (0.7%) |
| $22,500 to $24,999 | 21 (3.9%) | 13 (3.1%) |
| $25,000 to $29,999 | 43 (8.0%) | 18 (4.3%) |
| $30,000 to $34,999 | 24 (4.4%) | 16 (3.8%) |
| $35,000 to $39,999 | 72 (13.4%) | 21 (5.0%) |
| $40,000 to $44,999 | 24 (4.4%) | 38 (9.0%) |
| $45,000 to $49,999 | 12 (2.2%) | 14 (3.3%) |
| $50,000 to $54,999 | 15 (2.8%) | 20 (4.7%) |
| $55,000 to $64,999 | 58 (10.8%) | 26 (6.1%) |
| $65,000 to $74,999 | 39 (7.2%) | 24 (5.7%) |
| $75,000 to $99,999 | 66 (12.2%) | 27 (6.4%) |
| $100,000+ | 74 (13.7%) | 7 (1.7%) |
| Total | 539 (100.0%) | 423 (100.0%) |
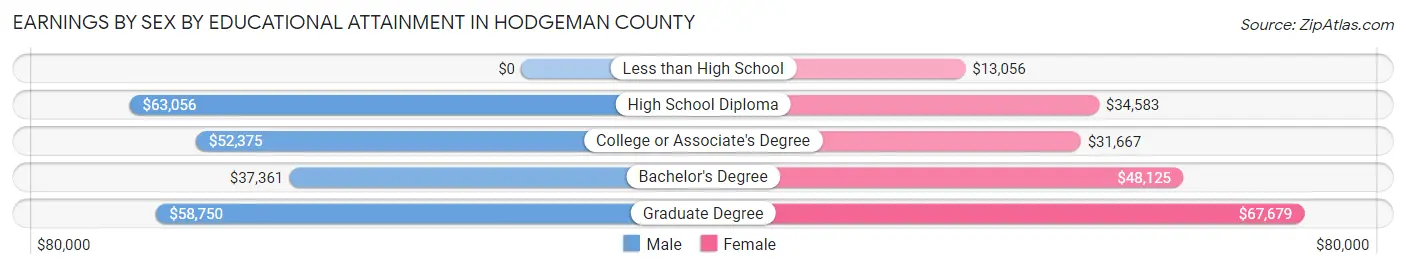
Earnings by Sex by Educational Attainment in Hodgeman County
Average earnings in Hodgeman County are $55,125 for men and $36,250 for women, a difference of 34.2%. Men with an educational attainment of high school diploma enjoy the highest average annual earnings of $63,056, while those with bachelor's degree education earn the least with $37,361. Women with an educational attainment of graduate degree earn the most with the average annual earnings of $67,679, while those with less than high school education have the smallest earnings of $13,056.
| Educational Attainment | Male Income | Female Income |
| Less than High School | - | - |
| High School Diploma | $63,056 | $34,583 |
| College or Associate's Degree | $52,375 | $31,667 |
| Bachelor's Degree | $37,361 | $48,125 |
| Graduate Degree | $58,750 | $67,679 |
| Total | $55,125 | $36,250 |
Family Income in Hodgeman County
Family Income Brackets in Hodgeman County
According to the Hodgeman County family income data, there are 105 families falling into the $100,000 to $149,999 income range, which is the most common income bracket and makes up 24.1% of all families. Conversely, the $10,000 to $14,999 income bracket is the least frequent group with only 5 families (1.1%) belonging to this category.
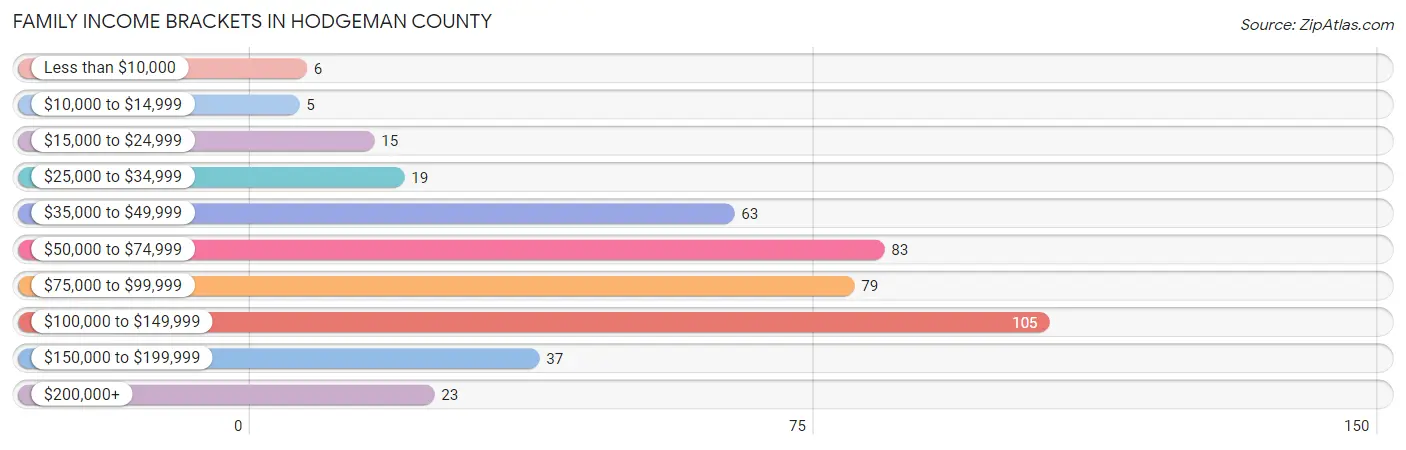
| Income Bracket | # Families | % Families |
| Less than $10,000 | 6 | 1.4% |
| $10,000 to $14,999 | 5 | 1.1% |
| $15,000 to $24,999 | 15 | 3.4% |
| $25,000 to $34,999 | 19 | 4.4% |
| $35,000 to $49,999 | 63 | 14.5% |
| $50,000 to $74,999 | 83 | 19.1% |
| $75,000 to $99,999 | 79 | 18.2% |
| $100,000 to $149,999 | 105 | 24.1% |
| $150,000 to $199,999 | 37 | 8.5% |
| $200,000+ | 23 | 5.3% |
Family Income by Famaliy Size in Hodgeman County
6-person families (22 | 5.1%) account for the highest median family income in Hodgeman County with $126,250 per family, while 3-person families (67 | 15.4%) have the highest median income of $40,250 per family member.
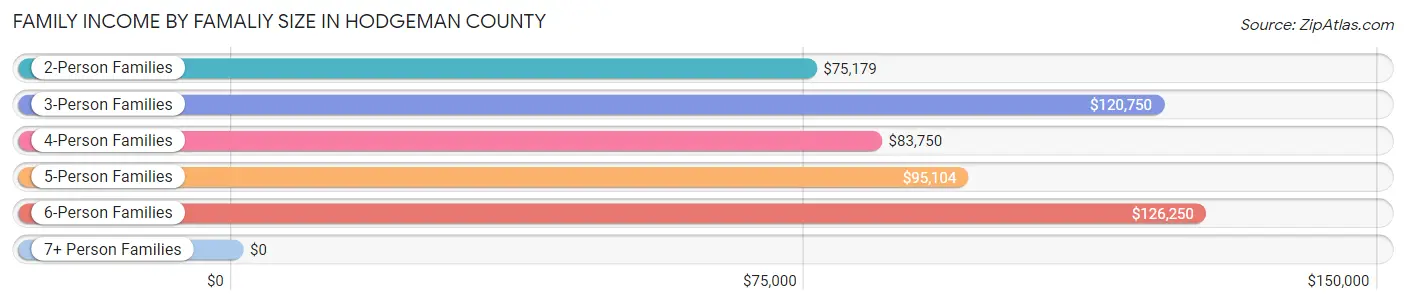
| Income Bracket | # Families | Median Income |
| 2-Person Families | 253 (58.2%) | $75,179 |
| 3-Person Families | 67 (15.4%) | $120,750 |
| 4-Person Families | 46 (10.6%) | $83,750 |
| 5-Person Families | 43 (9.9%) | $95,104 |
| 6-Person Families | 22 (5.1%) | $126,250 |
| 7+ Person Families | 4 (0.9%) | $0 |
| Total | 435 (100.0%) | $83,162 |
Family Income by Number of Earners in Hodgeman County
The median family income in Hodgeman County is $83,162, with families comprising 2 earners (200) having the highest median family income of $110,833, while families with no earners (51) have the lowest median family income of $50,625, accounting for 46.0% and 11.7% of families, respectively.
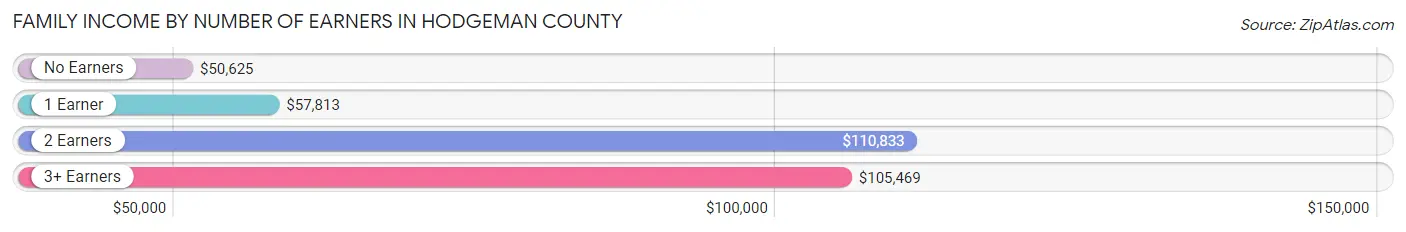
| Number of Earners | # Families | Median Income |
| No Earners | 51 (11.7%) | $50,625 |
| 1 Earner | 121 (27.8%) | $57,813 |
| 2 Earners | 200 (46.0%) | $110,833 |
| 3+ Earners | 63 (14.5%) | $105,469 |
| Total | 435 (100.0%) | $83,162 |
Household Income in Hodgeman County
Household Income Brackets in Hodgeman County
With 195 households falling in the category, the $50,000 to $74,999 income range is the most frequent in Hodgeman County, accounting for 27.5% of all households. In contrast, only 13 households (1.8%) fall into the $10,000 to $14,999 income bracket, making it the least populous group.
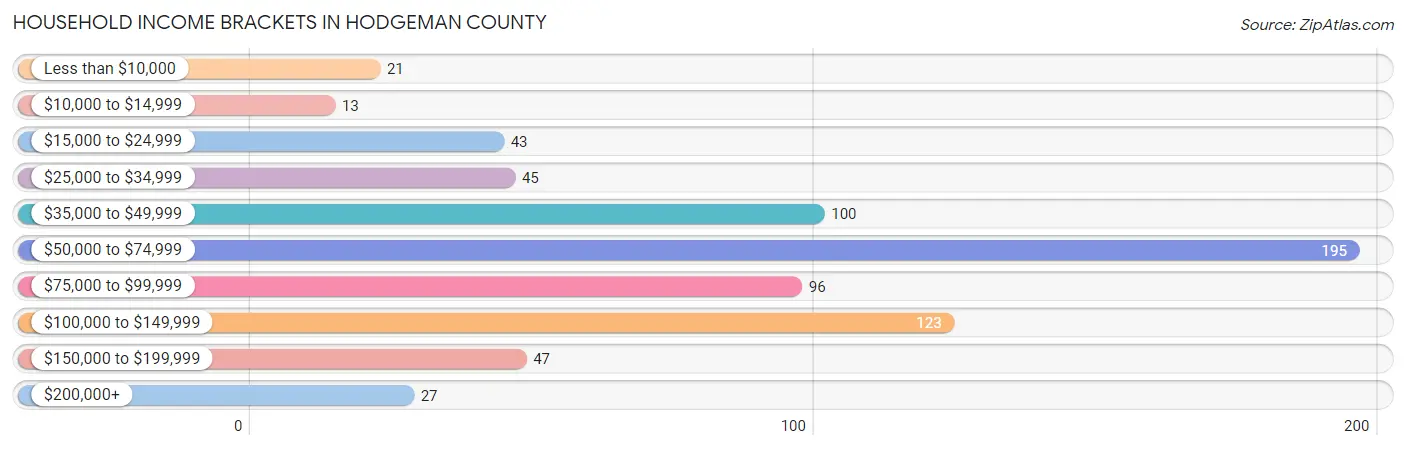
| Income Bracket | # Households | % Households |
| Less than $10,000 | 21 | 3.0% |
| $10,000 to $14,999 | 13 | 1.8% |
| $15,000 to $24,999 | 43 | 6.1% |
| $25,000 to $34,999 | 45 | 6.3% |
| $35,000 to $49,999 | 100 | 14.1% |
| $50,000 to $74,999 | 195 | 27.5% |
| $75,000 to $99,999 | 96 | 13.5% |
| $100,000 to $149,999 | 123 | 17.3% |
| $150,000 to $199,999 | 47 | 6.6% |
| $200,000+ | 27 | 3.8% |
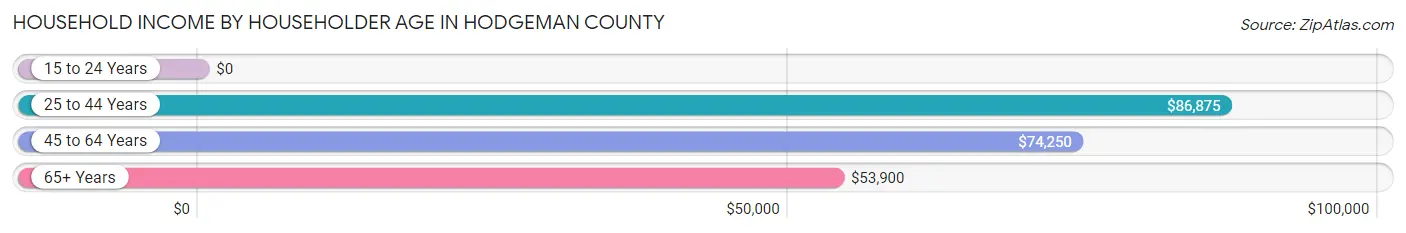
Household Income by Householder Age in Hodgeman County
The median household income in Hodgeman County is $63,125, with the highest median household income of $86,875 found in the 25 to 44 years age bracket for the primary householder. A total of 155 households (21.8%) fall into this category. Meanwhile, the 15 to 24 years age bracket for the primary householder has the lowest median household income of $0, with 10 households (1.4%) in this group.
| Income Bracket | # Households | Median Income |
| 15 to 24 Years | 10 (1.4%) | $0 |
| 25 to 44 Years | 155 (21.8%) | $86,875 |
| 45 to 64 Years | 267 (37.6%) | $74,250 |
| 65+ Years | 278 (39.2%) | $53,900 |
| Total | 710 (100.0%) | $63,125 |
Poverty in Hodgeman County
Income Below Poverty by Sex and Age in Hodgeman County
With 5.8% poverty level for males and 11.6% for females among the residents of Hodgeman County, 5 year old males and 18 to 24 year old females are the most vulnerable to poverty, with 4 males (44.4%) and 18 females (24.3%) in their respective age groups living below the poverty level.
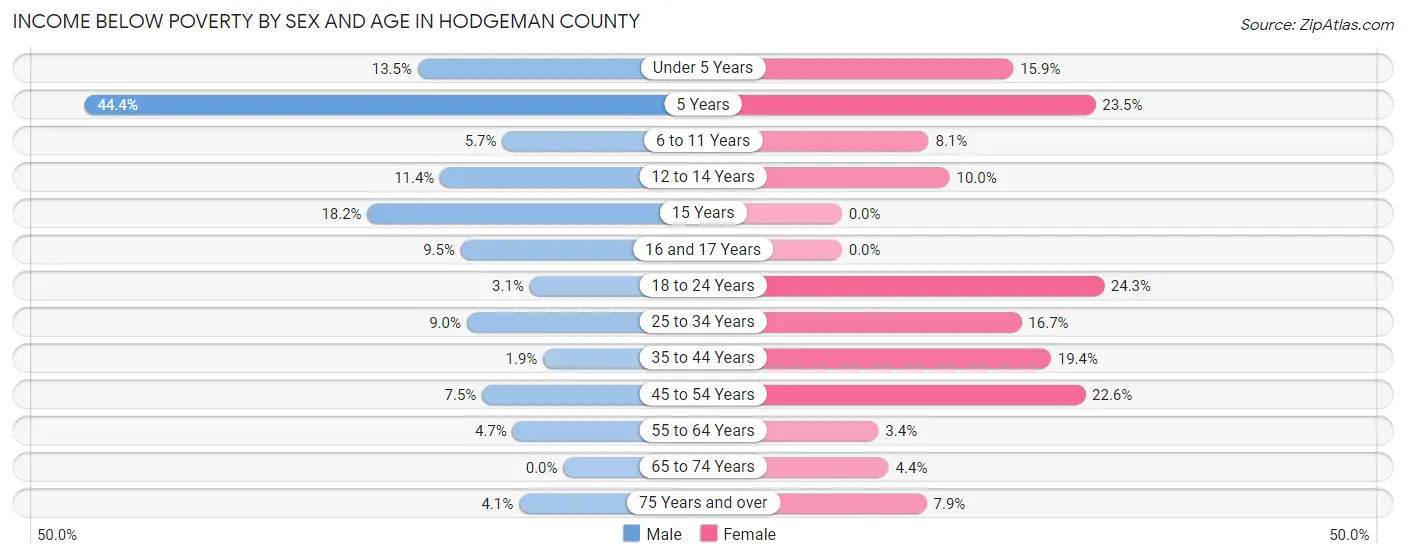
| Age Bracket | Male | Female |
| Under 5 Years | 5 (13.5%) | 7 (15.9%) |
| 5 Years | 4 (44.4%) | 4 (23.5%) |
| 6 to 11 Years | 3 (5.7%) | 7 (8.1%) |
| 12 to 14 Years | 4 (11.4%) | 3 (10.0%) |
| 15 Years | 2 (18.2%) | 0 (0.0%) |
| 16 and 17 Years | 2 (9.5%) | 0 (0.0%) |
| 18 to 24 Years | 2 (3.1%) | 18 (24.3%) |
| 25 to 34 Years | 6 (9.0%) | 12 (16.7%) |
| 35 to 44 Years | 2 (1.9%) | 13 (19.4%) |
| 45 to 54 Years | 7 (7.5%) | 21 (22.6%) |
| 55 to 64 Years | 8 (4.7%) | 5 (3.4%) |
| 65 to 74 Years | 0 (0.0%) | 4 (4.3%) |
| 75 Years and over | 3 (4.1%) | 10 (7.9%) |
| Total | 48 (5.8%) | 104 (11.6%) |
Income Above Poverty by Sex and Age in Hodgeman County
According to the poverty statistics in Hodgeman County, males aged 65 to 74 years and females aged 15 years are the age groups that are most secure financially, with 100.0% of males and 100.0% of females in these age groups living above the poverty line.
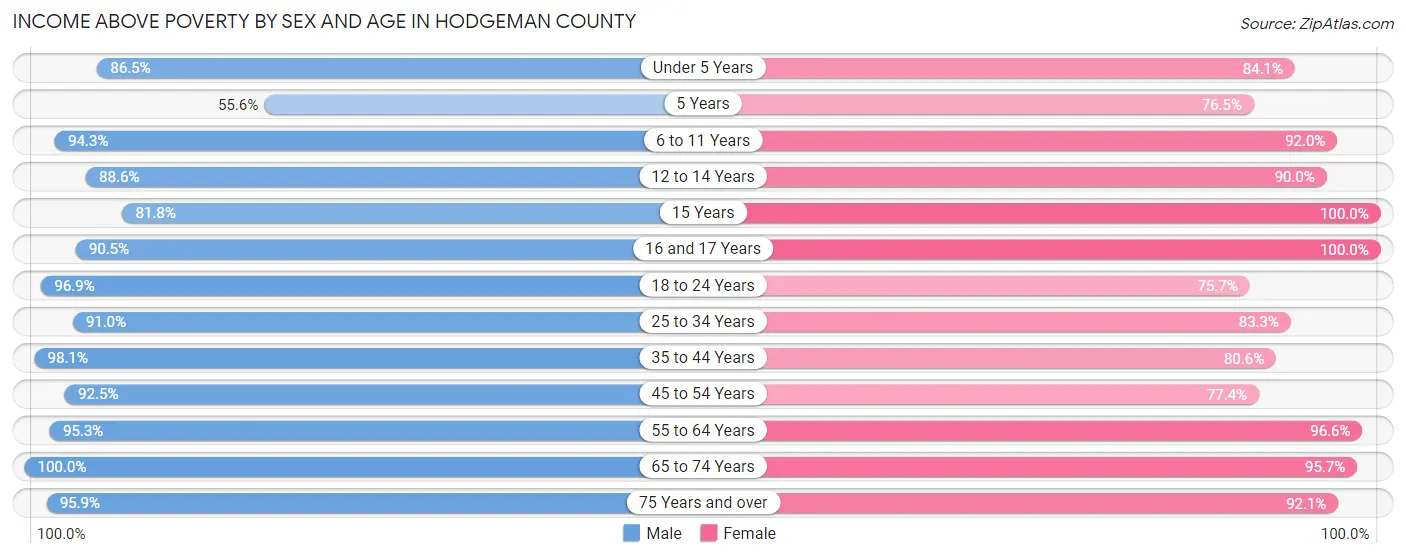
| Age Bracket | Male | Female |
| Under 5 Years | 32 (86.5%) | 37 (84.1%) |
| 5 Years | 5 (55.6%) | 13 (76.5%) |
| 6 to 11 Years | 50 (94.3%) | 80 (91.9%) |
| 12 to 14 Years | 31 (88.6%) | 27 (90.0%) |
| 15 Years | 9 (81.8%) | 8 (100.0%) |
| 16 and 17 Years | 19 (90.5%) | 41 (100.0%) |
| 18 to 24 Years | 62 (96.9%) | 56 (75.7%) |
| 25 to 34 Years | 61 (91.0%) | 60 (83.3%) |
| 35 to 44 Years | 105 (98.1%) | 54 (80.6%) |
| 45 to 54 Years | 86 (92.5%) | 72 (77.4%) |
| 55 to 64 Years | 162 (95.3%) | 142 (96.6%) |
| 65 to 74 Years | 91 (100.0%) | 88 (95.7%) |
| 75 Years and over | 70 (95.9%) | 117 (92.1%) |
| Total | 783 (94.2%) | 795 (88.4%) |
Income Below Poverty Among Married-Couple Families in Hodgeman County
The poverty statistics for married-couple families in Hodgeman County show that 1.1% or 4 of the total 380 families live below the poverty line. Families with 1 or 2 children have the highest poverty rate of 5.3%, comprising of 4 families. On the other hand, families with no children have the lowest poverty rate of 0.0%, which includes 0 families.
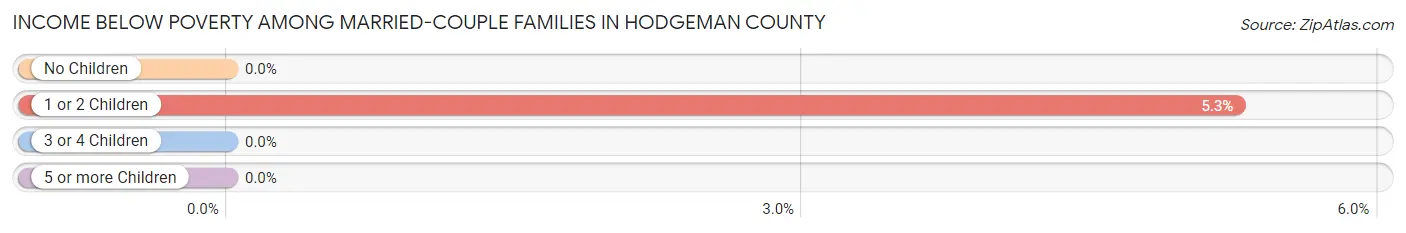
| Children | Above Poverty | Below Poverty |
| No Children | 246 (100.0%) | 0 (0.0%) |
| 1 or 2 Children | 72 (94.7%) | 4 (5.3%) |
| 3 or 4 Children | 58 (100.0%) | 0 (0.0%) |
| 5 or more Children | 0 (0.0%) | 0 (0.0%) |
| Total | 376 (99.0%) | 4 (1.1%) |
Income Below Poverty Among Single-Parent Households in Hodgeman County
According to the poverty data in Hodgeman County, 14.3% or 2 single-father households and 39.0% or 16 single-mother households are living below the poverty line. Among single-father households, those with no children have the highest poverty rate, with 2 households (15.4%) experiencing poverty. Likewise, among single-mother households, those with 3 or 4 children have the highest poverty rate, with 7 households (70.0%) falling below the poverty line.
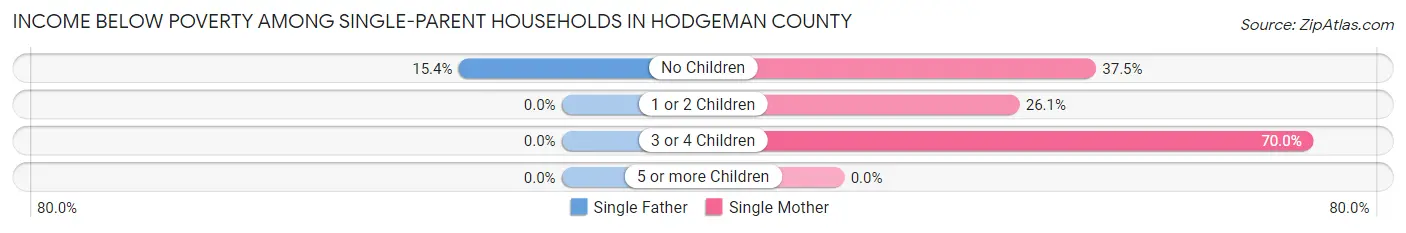
| Children | Single Father | Single Mother |
| No Children | 2 (15.4%) | 3 (37.5%) |
| 1 or 2 Children | 0 (0.0%) | 6 (26.1%) |
| 3 or 4 Children | 0 (0.0%) | 7 (70.0%) |
| 5 or more Children | 0 (0.0%) | 0 (0.0%) |
| Total | 2 (14.3%) | 16 (39.0%) |
Income Below Poverty Among Married-Couple vs Single-Parent Households in Hodgeman County
The poverty data for Hodgeman County shows that 4 of the married-couple family households (1.1%) and 18 of the single-parent households (32.7%) are living below the poverty level. Within the married-couple family households, those with 1 or 2 children have the highest poverty rate, with 4 households (5.3%) falling below the poverty line. Among the single-parent households, those with 3 or 4 children have the highest poverty rate, with 7 household (63.6%) living below poverty.
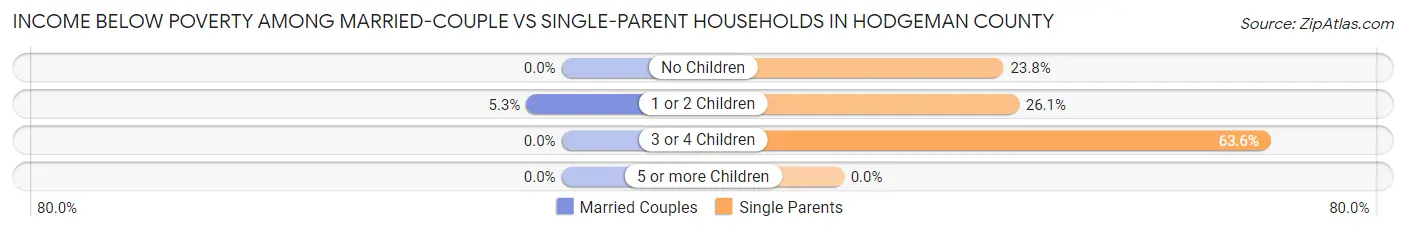
| Children | Married-Couple Families | Single-Parent Households |
| No Children | 0 (0.0%) | 5 (23.8%) |
| 1 or 2 Children | 4 (5.3%) | 6 (26.1%) |
| 3 or 4 Children | 0 (0.0%) | 7 (63.6%) |
| 5 or more Children | 0 (0.0%) | 0 (0.0%) |
| Total | 4 (1.1%) | 18 (32.7%) |
Race in Hodgeman County
The most populous races in Hodgeman County are White / Caucasian (1,715 | 96.9%), Hispanic or Latino (118 | 6.7%), and Two or more Races (45 | 2.5%).
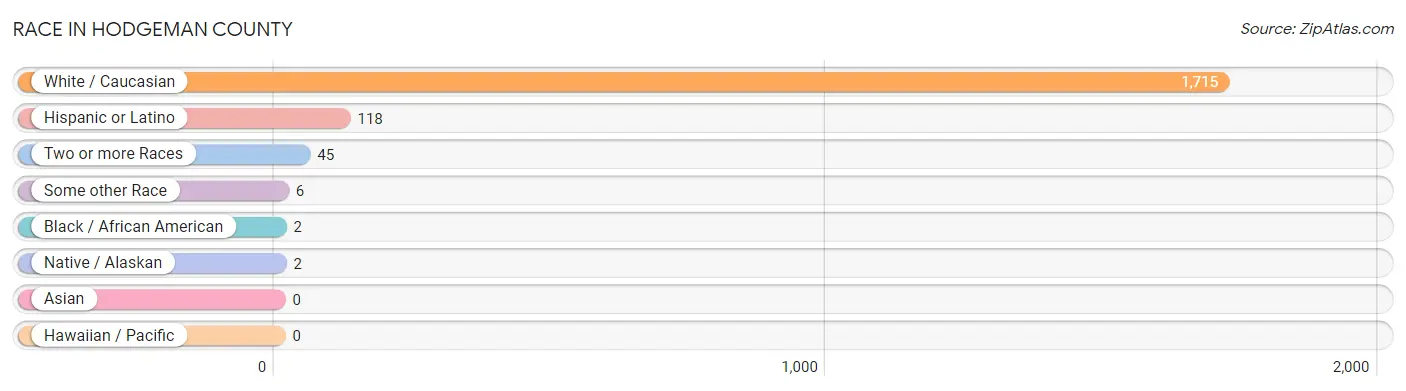
| Race | # Population | % Population |
| Asian | 0 | 0.0% |
| Black / African American | 2 | 0.1% |
| Hawaiian / Pacific | 0 | 0.0% |
| Hispanic or Latino | 118 | 6.7% |
| Native / Alaskan | 2 | 0.1% |
| White / Caucasian | 1,715 | 96.9% |
| Two or more Races | 45 | 2.5% |
| Some other Race | 6 | 0.3% |
| Total | 1,770 | 100.0% |
Ancestry in Hodgeman County
The most populous ancestries reported in Hodgeman County are German (612 | 34.6%), Irish (222 | 12.5%), English (125 | 7.1%), Mexican (115 | 6.5%), and American (103 | 5.8%), together accounting for 66.5% of all Hodgeman County residents.
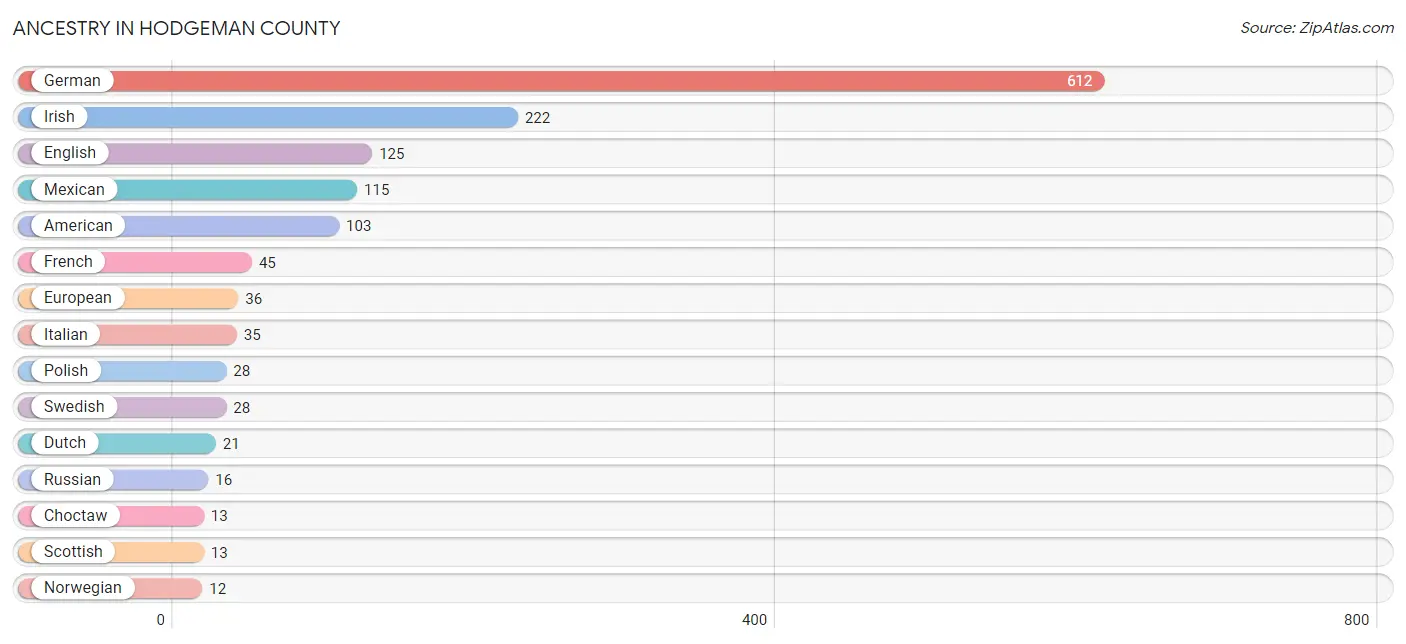
| Ancestry | # Population | % Population |
| American | 103 | 5.8% |
| Austrian | 5 | 0.3% |
| Belgian | 3 | 0.2% |
| Blackfeet | 2 | 0.1% |
| British | 3 | 0.2% |
| Central American | 1 | 0.1% |
| Central American Indian | 1 | 0.1% |
| Cherokee | 6 | 0.3% |
| Choctaw | 13 | 0.7% |
| Colombian | 2 | 0.1% |
| Czech | 4 | 0.2% |
| Czechoslovakian | 5 | 0.3% |
| Danish | 3 | 0.2% |
| Dutch | 21 | 1.2% |
| English | 125 | 7.1% |
| European | 36 | 2.0% |
| French | 45 | 2.5% |
| German | 612 | 34.6% |
| Guatemalan | 1 | 0.1% |
| Irish | 222 | 12.5% |
| Italian | 35 | 2.0% |
| Mexican | 115 | 6.5% |
| Norwegian | 12 | 0.7% |
| Pennsylvania German | 9 | 0.5% |
| Polish | 28 | 1.6% |
| Russian | 16 | 0.9% |
| Samoan | 4 | 0.2% |
| Scandinavian | 3 | 0.2% |
| Scotch-Irish | 4 | 0.2% |
| Scottish | 13 | 0.7% |
| South American | 2 | 0.1% |
| Swedish | 28 | 1.6% |
| Swiss | 5 | 0.3% |
| Welsh | 2 | 0.1% | View All 34 Rows |
Immigrants in Hodgeman County
The most numerous immigrant groups reported in Hodgeman County came from Latin America (54 | 3.0%), Central America (52 | 2.9%), Mexico (51 | 2.9%), Eastern Europe (6 | 0.3%), and Europe (6 | 0.3%), together accounting for 9.6% of all Hodgeman County residents.
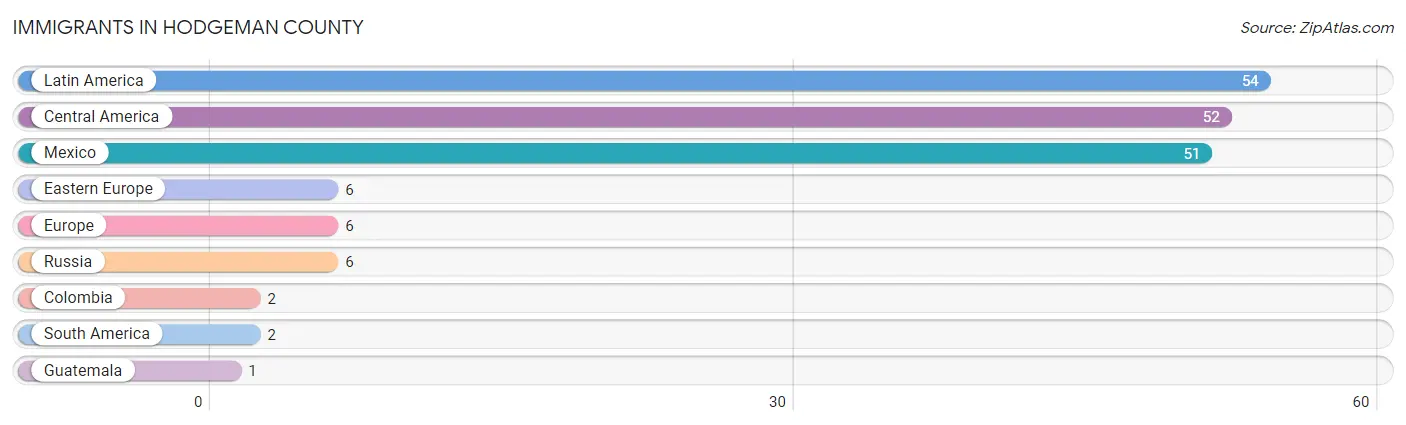
| Immigration Origin | # Population | % Population |
| Central America | 52 | 2.9% |
| Colombia | 2 | 0.1% |
| Eastern Europe | 6 | 0.3% |
| Europe | 6 | 0.3% |
| Guatemala | 1 | 0.1% |
| Latin America | 54 | 3.0% |
| Mexico | 51 | 2.9% |
| Russia | 6 | 0.3% |
| South America | 2 | 0.1% | View All 9 Rows |
Sex and Age in Hodgeman County
Sex and Age in Hodgeman County
The most populous age groups in Hodgeman County are 55 to 59 Years (98 | 11.5%) for men and 55 to 59 Years (89 | 9.7%) for women.
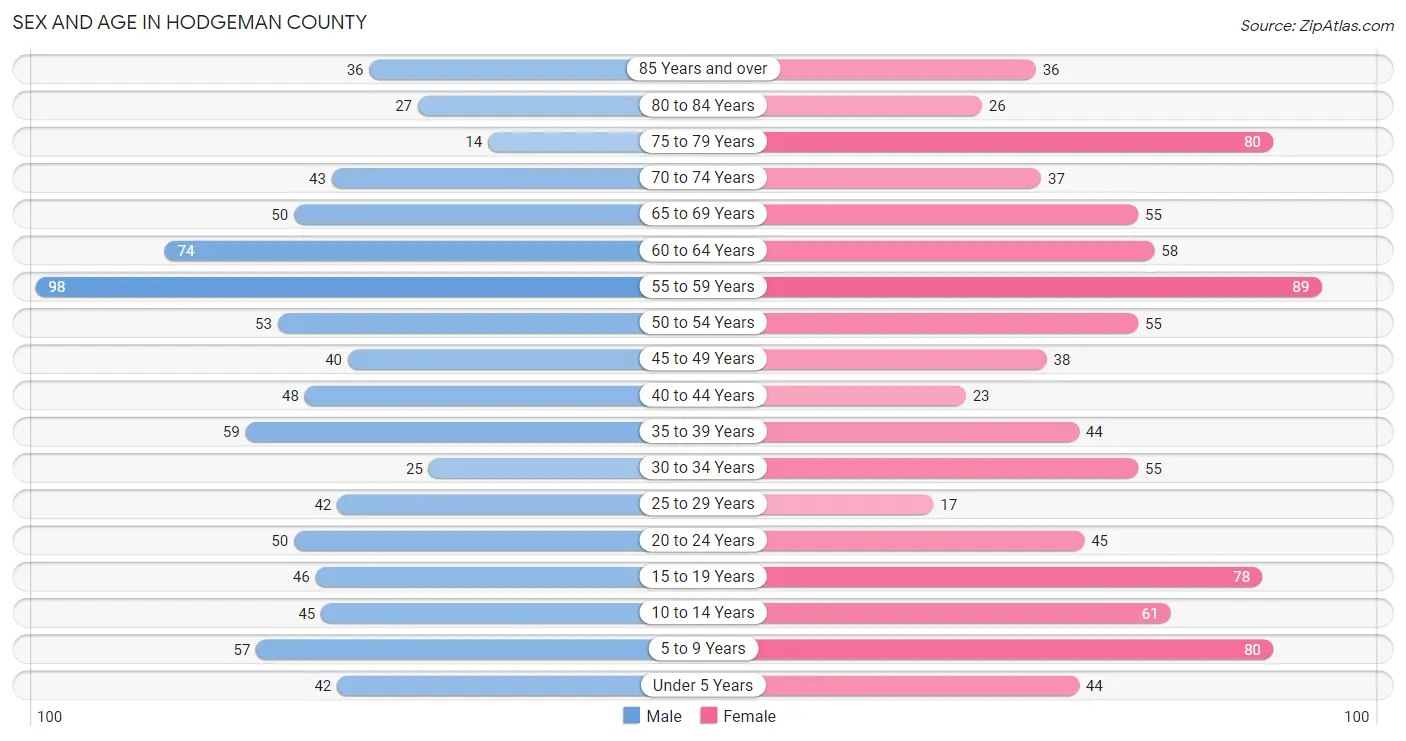
| Age Bracket | Male | Female |
| Under 5 Years | 42 (5.0%) | 44 (4.8%) |
| 5 to 9 Years | 57 (6.7%) | 80 (8.7%) |
| 10 to 14 Years | 45 (5.3%) | 61 (6.6%) |
| 15 to 19 Years | 46 (5.4%) | 78 (8.5%) |
| 20 to 24 Years | 50 (5.9%) | 45 (4.9%) |
| 25 to 29 Years | 42 (5.0%) | 17 (1.8%) |
| 30 to 34 Years | 25 (2.9%) | 55 (6.0%) |
| 35 to 39 Years | 59 (7.0%) | 44 (4.8%) |
| 40 to 44 Years | 48 (5.7%) | 23 (2.5%) |
| 45 to 49 Years | 40 (4.7%) | 38 (4.1%) |
| 50 to 54 Years | 53 (6.2%) | 55 (6.0%) |
| 55 to 59 Years | 98 (11.5%) | 89 (9.7%) |
| 60 to 64 Years | 74 (8.7%) | 58 (6.3%) |
| 65 to 69 Years | 50 (5.9%) | 55 (6.0%) |
| 70 to 74 Years | 43 (5.1%) | 37 (4.0%) |
| 75 to 79 Years | 14 (1.7%) | 80 (8.7%) |
| 80 to 84 Years | 27 (3.2%) | 26 (2.8%) |
| 85 Years and over | 36 (4.2%) | 36 (3.9%) |
| Total | 849 (100.0%) | 921 (100.0%) |
Families and Households in Hodgeman County
Median Family Size in Hodgeman County
The median family size in Hodgeman County is 3.21 persons per family, with single female/mother families (41 | 9.4%) accounting for the largest median family size of 4.07 persons per family. On the other hand, married-couple families (380 | 87.4%) represent the smallest median family size with 3.12 persons per family.
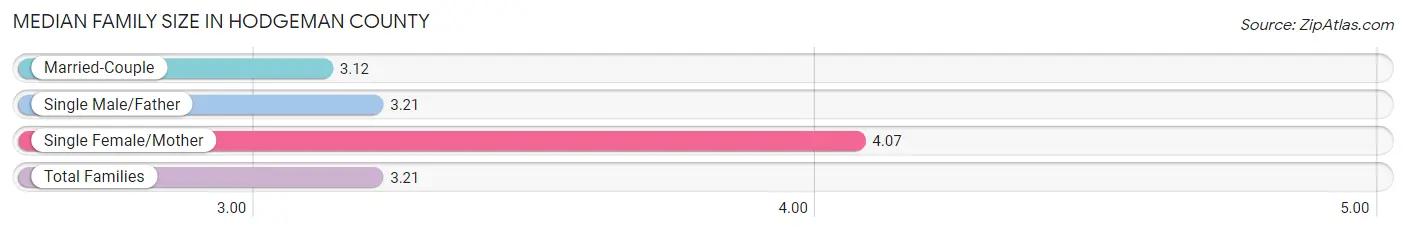
| Family Type | # Families | Family Size |
| Married-Couple | 380 (87.4%) | 3.12 |
| Single Male/Father | 14 (3.2%) | 3.21 |
| Single Female/Mother | 41 (9.4%) | 4.07 |
| Total Families | 435 (100.0%) | 3.21 |
Median Household Size in Hodgeman County
The median household size in Hodgeman County is 2.46 persons per household, with single female/mother households (41 | 5.8%) accounting for the largest median household size of 4.54 persons per household. non-family households (275 | 38.7%) represent the smallest median household size with 1.19 persons per household.
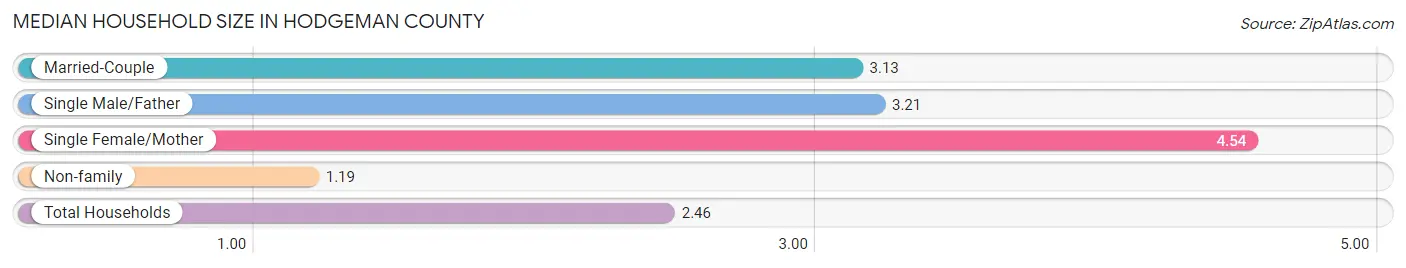
| Household Type | # Households | Household Size |
| Married-Couple | 380 (53.5%) | 3.13 |
| Single Male/Father | 14 (2.0%) | 3.21 |
| Single Female/Mother | 41 (5.8%) | 4.54 |
| Non-family | 275 (38.7%) | 1.19 |
| Total Households | 710 (100.0%) | 2.46 |
Household Size by Marriage Status in Hodgeman County
Out of a total of 710 households in Hodgeman County, 435 (61.3%) are family households, while 275 (38.7%) are nonfamily households. The most numerous type of family households are 2-person households, comprising 250, and the most common type of nonfamily households are 1-person households, comprising 252.
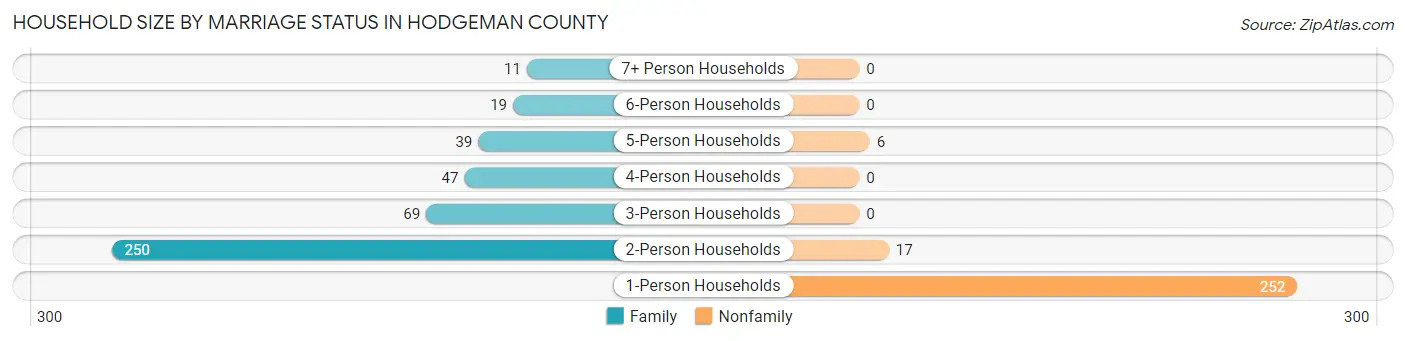
| Household Size | Family Households | Nonfamily Households |
| 1-Person Households | - | 252 (35.5%) |
| 2-Person Households | 250 (35.2%) | 17 (2.4%) |
| 3-Person Households | 69 (9.7%) | 0 (0.0%) |
| 4-Person Households | 47 (6.6%) | 0 (0.0%) |
| 5-Person Households | 39 (5.5%) | 6 (0.9%) |
| 6-Person Households | 19 (2.7%) | 0 (0.0%) |
| 7+ Person Households | 11 (1.5%) | 0 (0.0%) |
| Total | 435 (61.3%) | 275 (38.7%) |
Female Fertility in Hodgeman County
Fertility by Age in Hodgeman County
Average fertility rate in Hodgeman County is 32.0 births per 1,000 women. Women in the age bracket of 20 to 34 years have the highest fertility rate with 85.0 births per 1,000 women. Women in the age bracket of 20 to 34 years acount for 100.0% of all women with births.
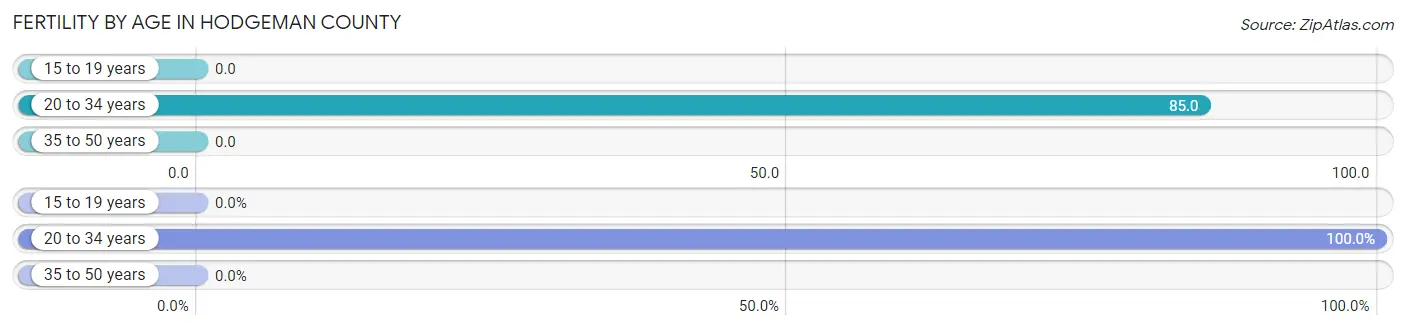
| Age Bracket | Women with Births | Births / 1,000 Women |
| 15 to 19 years | 0 (0.0%) | 0.0 |
| 20 to 34 years | 10 (100.0%) | 85.0 |
| 35 to 50 years | 0 (0.0%) | 0.0 |
| Total | 10 (100.0%) | 32.0 |
Fertility by Age by Marriage Status in Hodgeman County
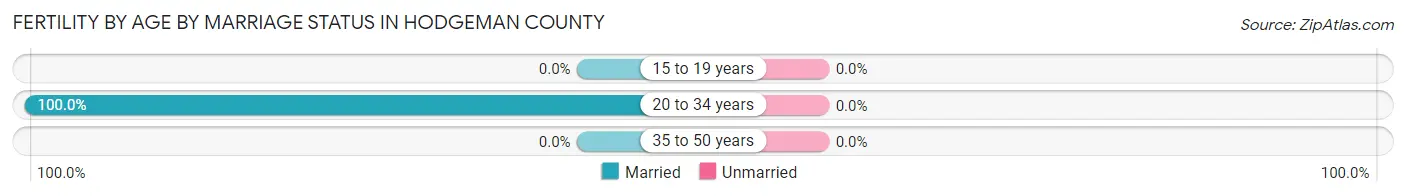
| Age Bracket | Married | Unmarried |
| 15 to 19 years | 0 (0.0%) | 0 (0.0%) |
| 20 to 34 years | 10 (100.0%) | 0 (0.0%) |
| 35 to 50 years | 0 (0.0%) | 0 (0.0%) |
| Total | 10 (100.0%) | 0 (0.0%) |
Fertility by Education in Hodgeman County
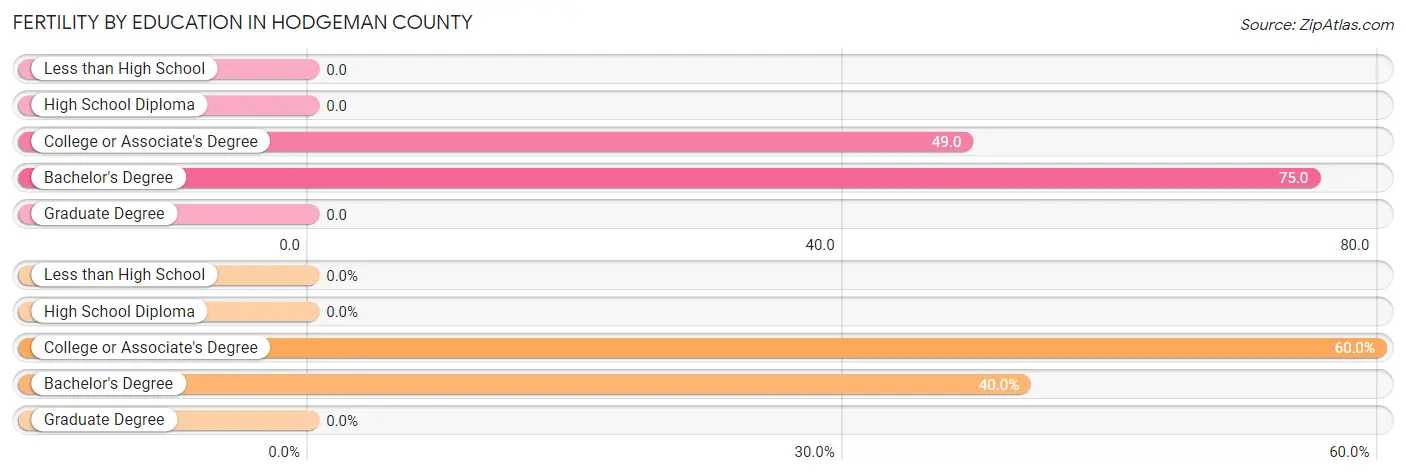
| Educational Attainment | Women with Births | Births / 1,000 Women |
| Less than High School | 0 (0.0%) | 0.0 |
| High School Diploma | 0 (0.0%) | 0.0 |
| College or Associate's Degree | 6 (60.0%) | 49.0 |
| Bachelor's Degree | 4 (40.0%) | 75.0 |
| Graduate Degree | 0 (0.0%) | 0.0 |
| Total | 10 (100.0%) | 32.0 |
Fertility by Education by Marriage Status in Hodgeman County
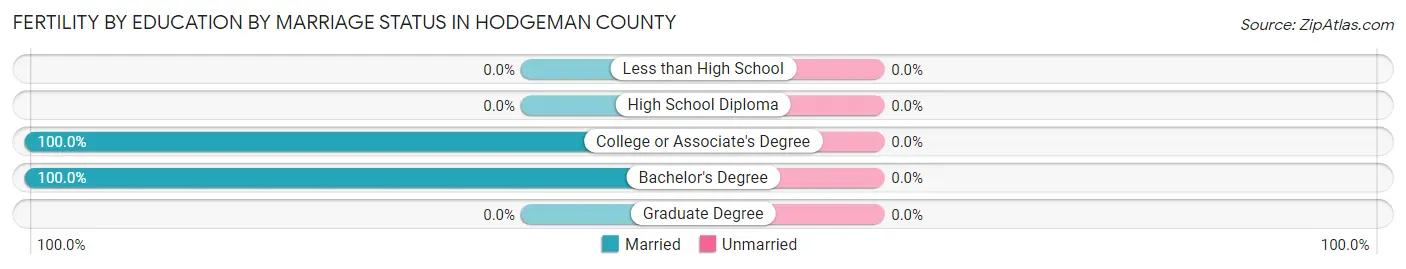
| Educational Attainment | Married | Unmarried |
| Less than High School | 0 (0.0%) | 0 (0.0%) |
| High School Diploma | 0 (0.0%) | 0 (0.0%) |
| College or Associate's Degree | 6 (100.0%) | 0 (0.0%) |
| Bachelor's Degree | 4 (100.0%) | 0 (0.0%) |
| Graduate Degree | 0 (0.0%) | 0 (0.0%) |
| Total | 10 (100.0%) | 0 (0.0%) |
Employment Characteristics in Hodgeman County
Employment by Class of Employer in Hodgeman County
Among the 842 employed individuals in Hodgeman County, private company employees (427 | 50.7%), self-employed (not incorporated) (140 | 16.6%), and local government employees (127 | 15.1%) make up the most common classes of employment.
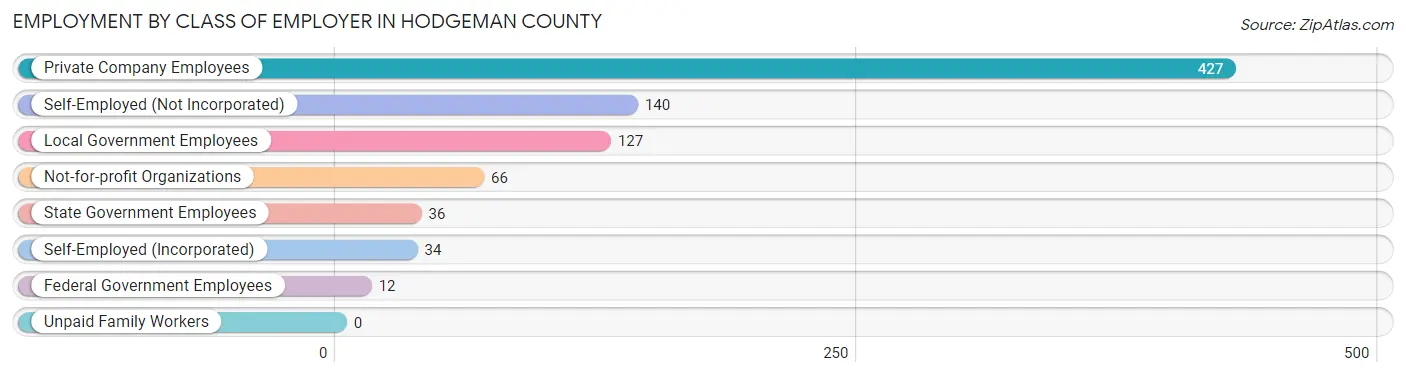
| Employer Class | # Employees | % Employees |
| Private Company Employees | 427 | 50.7% |
| Self-Employed (Incorporated) | 34 | 4.0% |
| Self-Employed (Not Incorporated) | 140 | 16.6% |
| Not-for-profit Organizations | 66 | 7.8% |
| Local Government Employees | 127 | 15.1% |
| State Government Employees | 36 | 4.3% |
| Federal Government Employees | 12 | 1.4% |
| Unpaid Family Workers | 0 | 0.0% |
| Total | 842 | 100.0% |
Employment Status by Age in Hodgeman County
According to the labor force statistics for Hodgeman County, out of the total population over 16 years of age (1,422), 61.5% or 875 individuals are in the labor force, with 2.1% or 18 of them unemployed. The age group with the highest labor force participation rate is 20 to 24 years, with 93.7% or 89 individuals in the labor force. Within the labor force, the 16 to 19 years age range has the highest percentage of unemployed individuals, with 35.4% or 17 of them being unemployed.
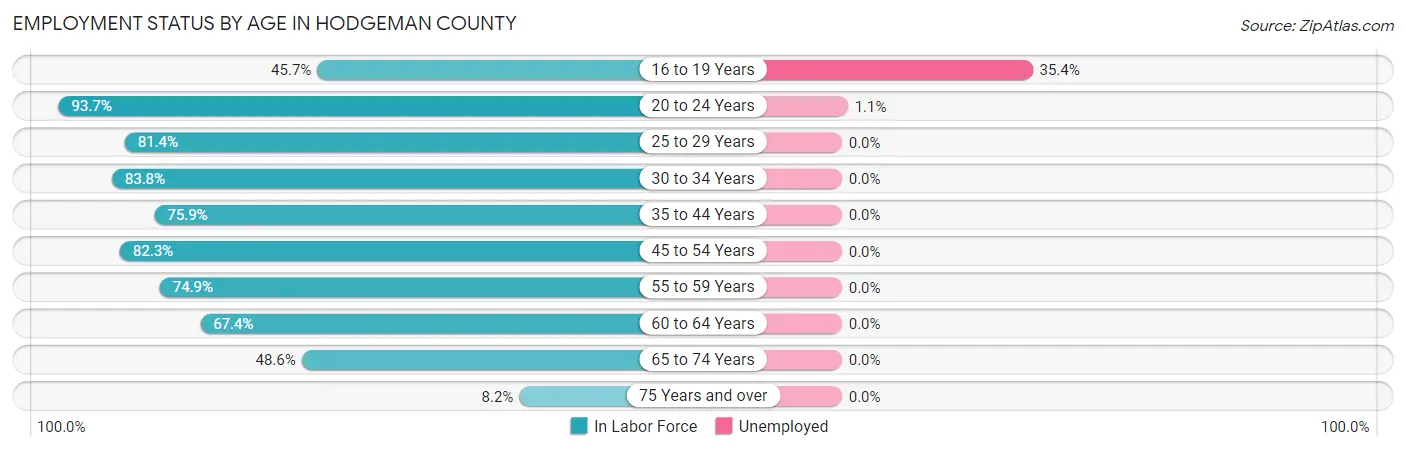
| Age Bracket | In Labor Force | Unemployed |
| 16 to 19 Years | 48 (45.7%) | 17 (35.4%) |
| 20 to 24 Years | 89 (93.7%) | 1 (1.1%) |
| 25 to 29 Years | 48 (81.4%) | 0 (0.0%) |
| 30 to 34 Years | 67 (83.8%) | 0 (0.0%) |
| 35 to 44 Years | 132 (75.9%) | 0 (0.0%) |
| 45 to 54 Years | 153 (82.3%) | 0 (0.0%) |
| 55 to 59 Years | 140 (74.9%) | 0 (0.0%) |
| 60 to 64 Years | 89 (67.4%) | 0 (0.0%) |
| 65 to 74 Years | 90 (48.6%) | 0 (0.0%) |
| 75 Years and over | 18 (8.2%) | 0 (0.0%) |
| Total | 875 (61.5%) | 18 (2.1%) |
Employment Status by Educational Attainment in Hodgeman County
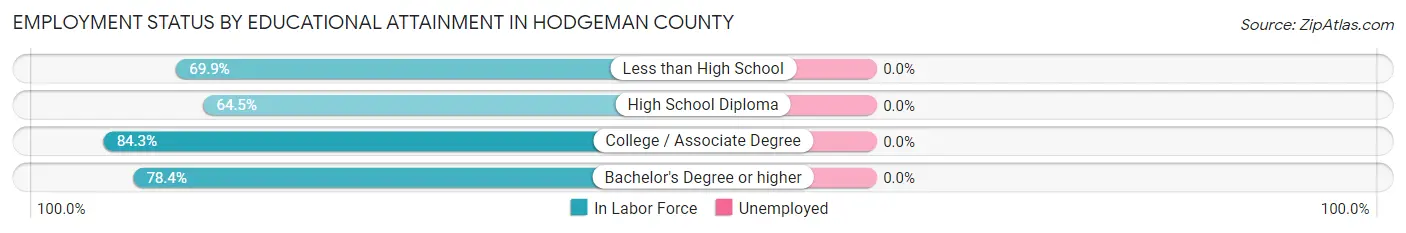
| Educational Attainment | In Labor Force | Unemployed |
| Less than High School | 58 (69.9%) | 0 (0.0%) |
| High School Diploma | 107 (64.5%) | 0 (0.0%) |
| College / Associate Degree | 257 (84.3%) | 0 (0.0%) |
| Bachelor's Degree or higher | 207 (78.4%) | 0 (0.0%) |
| Total | 629 (76.9%) | 0 (0.0%) |
Employment Occupations by Sex in Hodgeman County
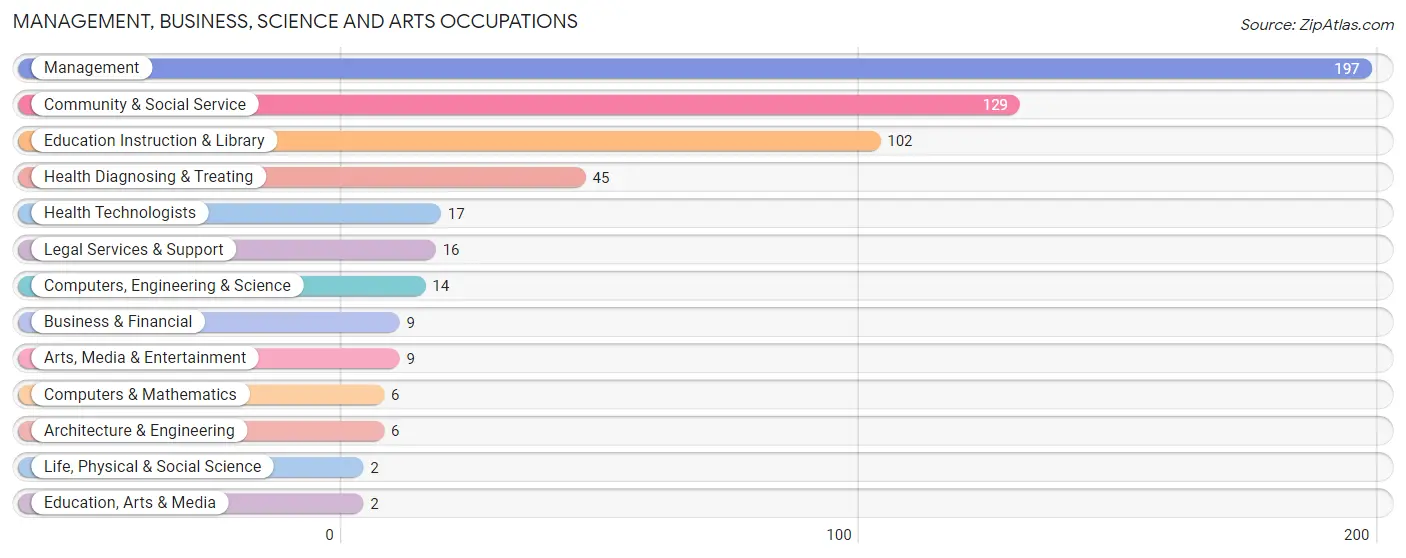
Management, Business, Science and Arts Occupations
The most common Management, Business, Science and Arts occupations in Hodgeman County are Management (197 | 23.0%), Community & Social Service (129 | 15.1%), Education Instruction & Library (102 | 11.9%), Health Diagnosing & Treating (45 | 5.3%), and Health Technologists (17 | 2.0%).
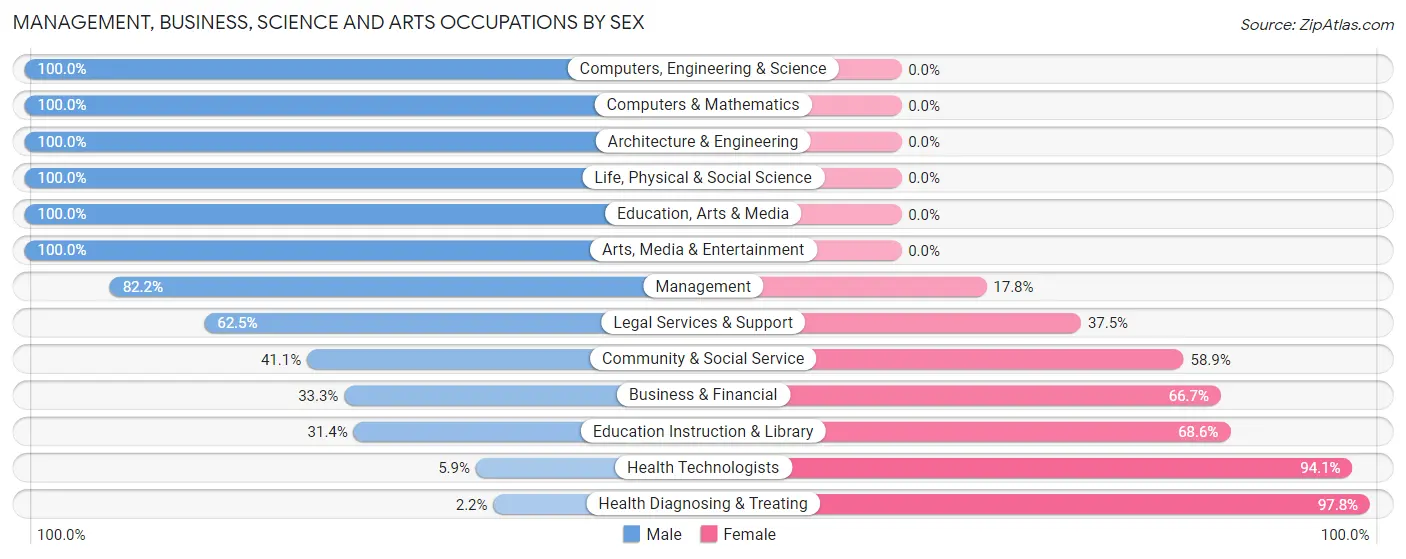
Management, Business, Science and Arts Occupations by Sex
Within the Management, Business, Science and Arts occupations in Hodgeman County, the most male-oriented occupations are Computers, Engineering & Science (100.0%), Computers & Mathematics (100.0%), and Architecture & Engineering (100.0%), while the most female-oriented occupations are Health Diagnosing & Treating (97.8%), Health Technologists (94.1%), and Education Instruction & Library (68.6%).
| Occupation | Male | Female |
| Management | 162 (82.2%) | 35 (17.8%) |
| Business & Financial | 3 (33.3%) | 6 (66.7%) |
| Computers, Engineering & Science | 14 (100.0%) | 0 (0.0%) |
| Computers & Mathematics | 6 (100.0%) | 0 (0.0%) |
| Architecture & Engineering | 6 (100.0%) | 0 (0.0%) |
| Life, Physical & Social Science | 2 (100.0%) | 0 (0.0%) |
| Community & Social Service | 53 (41.1%) | 76 (58.9%) |
| Education, Arts & Media | 2 (100.0%) | 0 (0.0%) |
| Legal Services & Support | 10 (62.5%) | 6 (37.5%) |
| Education Instruction & Library | 32 (31.4%) | 70 (68.6%) |
| Arts, Media & Entertainment | 9 (100.0%) | 0 (0.0%) |
| Health Diagnosing & Treating | 1 (2.2%) | 44 (97.8%) |
| Health Technologists | 1 (5.9%) | 16 (94.1%) |
| Total (Category) | 233 (59.1%) | 161 (40.9%) |
| Total (Overall) | 515 (60.2%) | 341 (39.8%) |
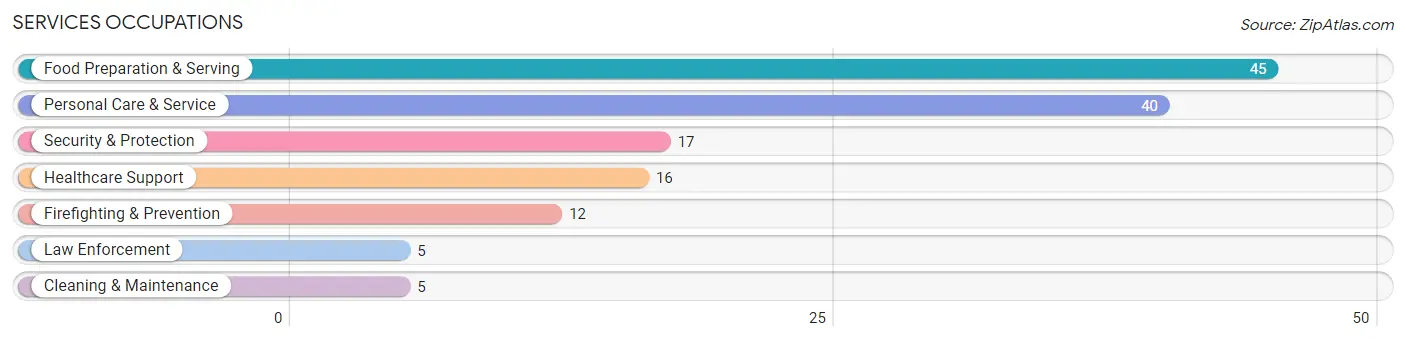
Services Occupations
The most common Services occupations in Hodgeman County are Food Preparation & Serving (45 | 5.3%), Personal Care & Service (40 | 4.7%), Security & Protection (17 | 2.0%), Healthcare Support (16 | 1.9%), and Firefighting & Prevention (12 | 1.4%).
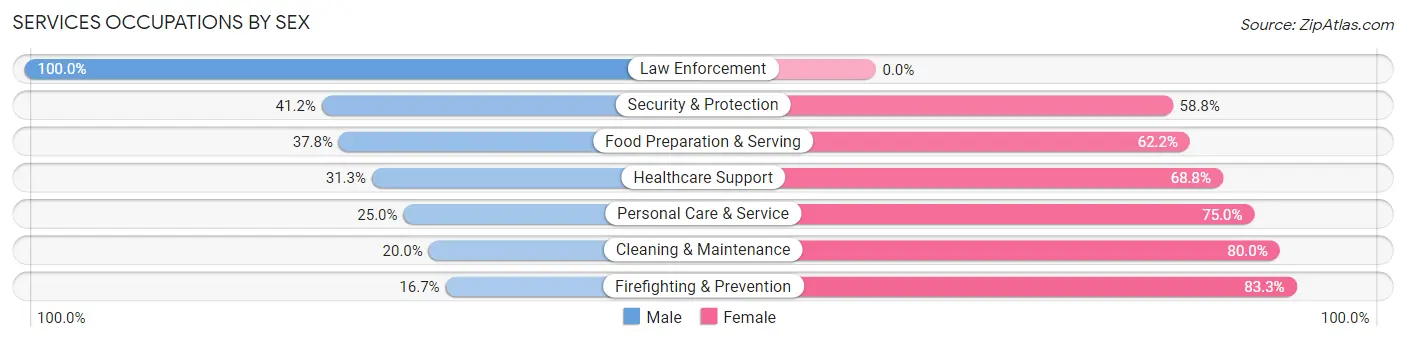
Services Occupations by Sex
Within the Services occupations in Hodgeman County, the most male-oriented occupations are Law Enforcement (100.0%), Security & Protection (41.2%), and Food Preparation & Serving (37.8%), while the most female-oriented occupations are Firefighting & Prevention (83.3%), Cleaning & Maintenance (80.0%), and Personal Care & Service (75.0%).
| Occupation | Male | Female |
| Healthcare Support | 5 (31.2%) | 11 (68.8%) |
| Security & Protection | 7 (41.2%) | 10 (58.8%) |
| Firefighting & Prevention | 2 (16.7%) | 10 (83.3%) |
| Law Enforcement | 5 (100.0%) | 0 (0.0%) |
| Food Preparation & Serving | 17 (37.8%) | 28 (62.2%) |
| Cleaning & Maintenance | 1 (20.0%) | 4 (80.0%) |
| Personal Care & Service | 10 (25.0%) | 30 (75.0%) |
| Total (Category) | 40 (32.5%) | 83 (67.5%) |
| Total (Overall) | 515 (60.2%) | 341 (39.8%) |
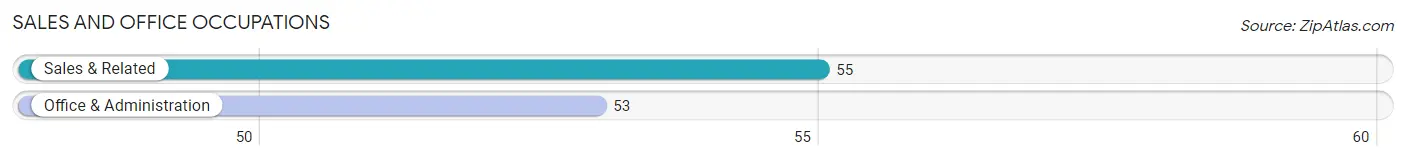
Sales and Office Occupations
The most common Sales and Office occupations in Hodgeman County are Sales & Related (55 | 6.4%), and Office & Administration (53 | 6.2%).
Sales and Office Occupations by Sex
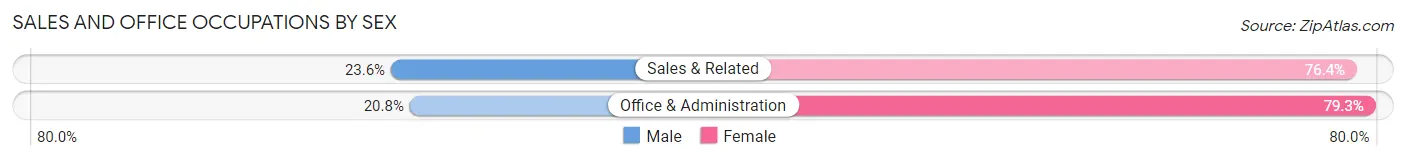
| Occupation | Male | Female |
| Sales & Related | 13 (23.6%) | 42 (76.4%) |
| Office & Administration | 11 (20.7%) | 42 (79.2%) |
| Total (Category) | 24 (22.2%) | 84 (77.8%) |
| Total (Overall) | 515 (60.2%) | 341 (39.8%) |
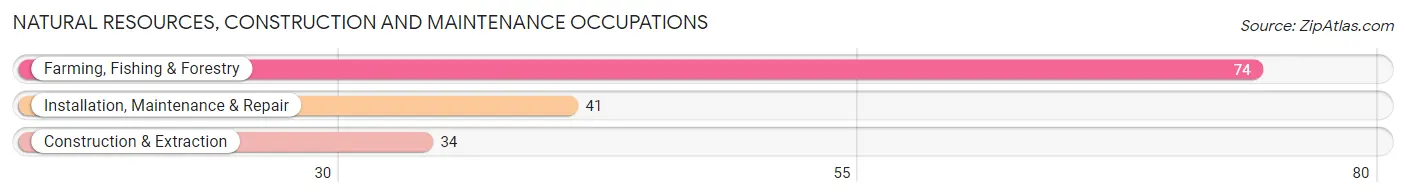
Natural Resources, Construction and Maintenance Occupations
The most common Natural Resources, Construction and Maintenance occupations in Hodgeman County are Farming, Fishing & Forestry (74 | 8.6%), Installation, Maintenance & Repair (41 | 4.8%), and Construction & Extraction (34 | 4.0%).
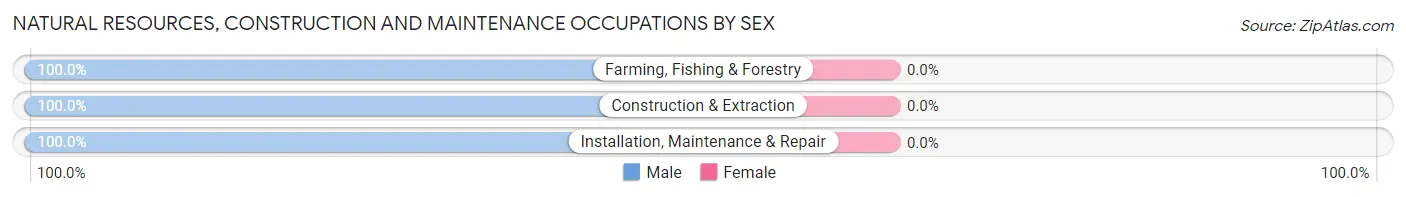
Natural Resources, Construction and Maintenance Occupations by Sex
| Occupation | Male | Female |
| Farming, Fishing & Forestry | 74 (100.0%) | 0 (0.0%) |
| Construction & Extraction | 34 (100.0%) | 0 (0.0%) |
| Installation, Maintenance & Repair | 41 (100.0%) | 0 (0.0%) |
| Total (Category) | 149 (100.0%) | 0 (0.0%) |
| Total (Overall) | 515 (60.2%) | 341 (39.8%) |
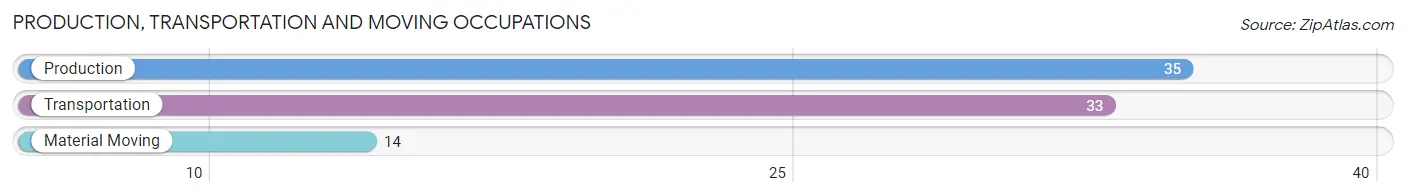
Production, Transportation and Moving Occupations
The most common Production, Transportation and Moving occupations in Hodgeman County are Production (35 | 4.1%), Transportation (33 | 3.9%), and Material Moving (14 | 1.6%).
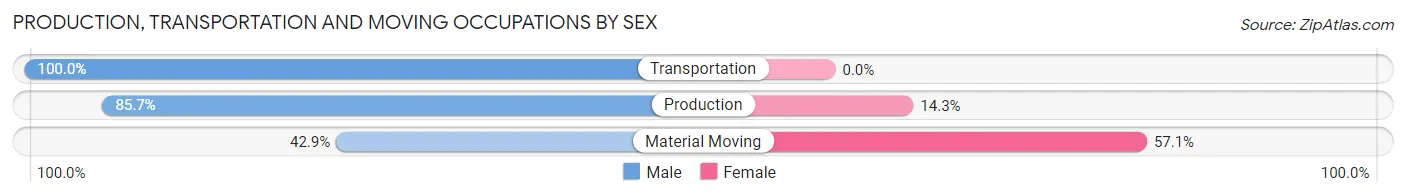
Production, Transportation and Moving Occupations by Sex
| Occupation | Male | Female |
| Production | 30 (85.7%) | 5 (14.3%) |
| Transportation | 33 (100.0%) | 0 (0.0%) |
| Material Moving | 6 (42.9%) | 8 (57.1%) |
| Total (Category) | 69 (84.2%) | 13 (15.9%) |
| Total (Overall) | 515 (60.2%) | 341 (39.8%) |
Employment Industries by Sex in Hodgeman County
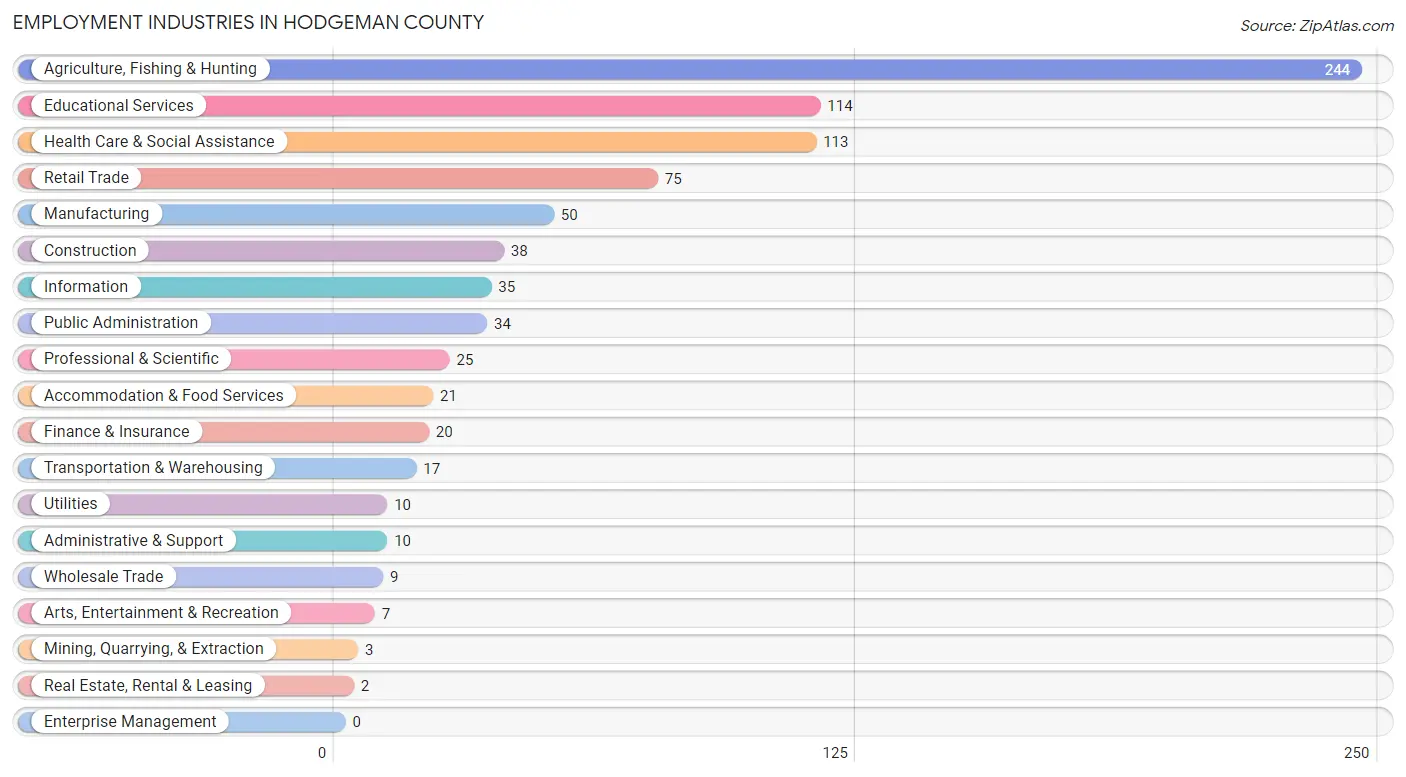
Employment Industries in Hodgeman County
The major employment industries in Hodgeman County include Agriculture, Fishing & Hunting (244 | 28.5%), Educational Services (114 | 13.3%), Health Care & Social Assistance (113 | 13.2%), Retail Trade (75 | 8.8%), and Manufacturing (50 | 5.8%).
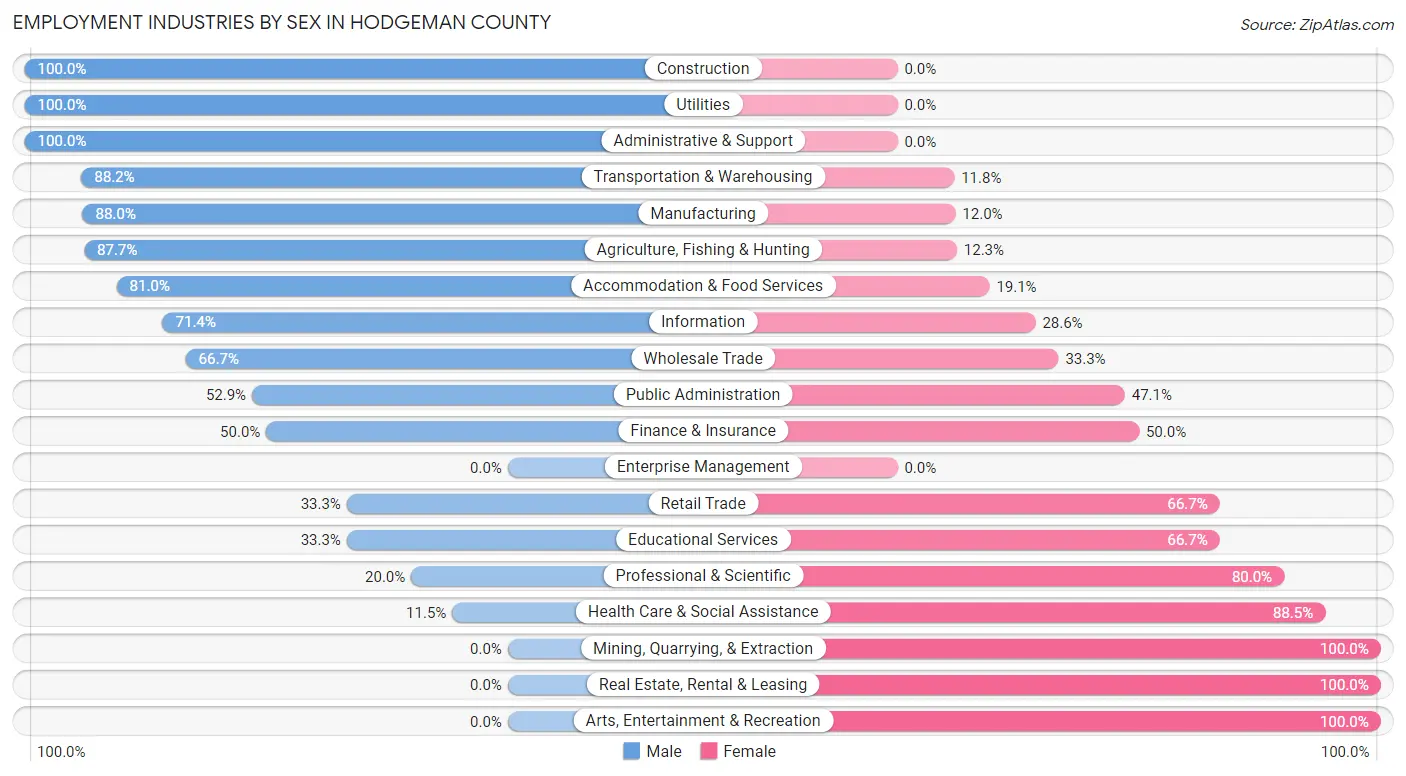
Employment Industries by Sex in Hodgeman County
The Hodgeman County industries that see more men than women are Construction (100.0%), Utilities (100.0%), and Administrative & Support (100.0%), whereas the industries that tend to have a higher number of women are Mining, Quarrying, & Extraction (100.0%), Real Estate, Rental & Leasing (100.0%), and Arts, Entertainment & Recreation (100.0%).
| Industry | Male | Female |
| Agriculture, Fishing & Hunting | 214 (87.7%) | 30 (12.3%) |
| Mining, Quarrying, & Extraction | 0 (0.0%) | 3 (100.0%) |
| Construction | 38 (100.0%) | 0 (0.0%) |
| Manufacturing | 44 (88.0%) | 6 (12.0%) |
| Wholesale Trade | 6 (66.7%) | 3 (33.3%) |
| Retail Trade | 25 (33.3%) | 50 (66.7%) |
| Transportation & Warehousing | 15 (88.2%) | 2 (11.8%) |
| Utilities | 10 (100.0%) | 0 (0.0%) |
| Information | 25 (71.4%) | 10 (28.6%) |
| Finance & Insurance | 10 (50.0%) | 10 (50.0%) |
| Real Estate, Rental & Leasing | 0 (0.0%) | 2 (100.0%) |
| Professional & Scientific | 5 (20.0%) | 20 (80.0%) |
| Enterprise Management | 0 (0.0%) | 0 (0.0%) |
| Administrative & Support | 10 (100.0%) | 0 (0.0%) |
| Educational Services | 38 (33.3%) | 76 (66.7%) |
| Health Care & Social Assistance | 13 (11.5%) | 100 (88.5%) |
| Arts, Entertainment & Recreation | 0 (0.0%) | 7 (100.0%) |
| Accommodation & Food Services | 17 (80.9%) | 4 (19.1%) |
| Public Administration | 18 (52.9%) | 16 (47.1%) |
| Total | 515 (60.2%) | 341 (39.8%) |
Education in Hodgeman County
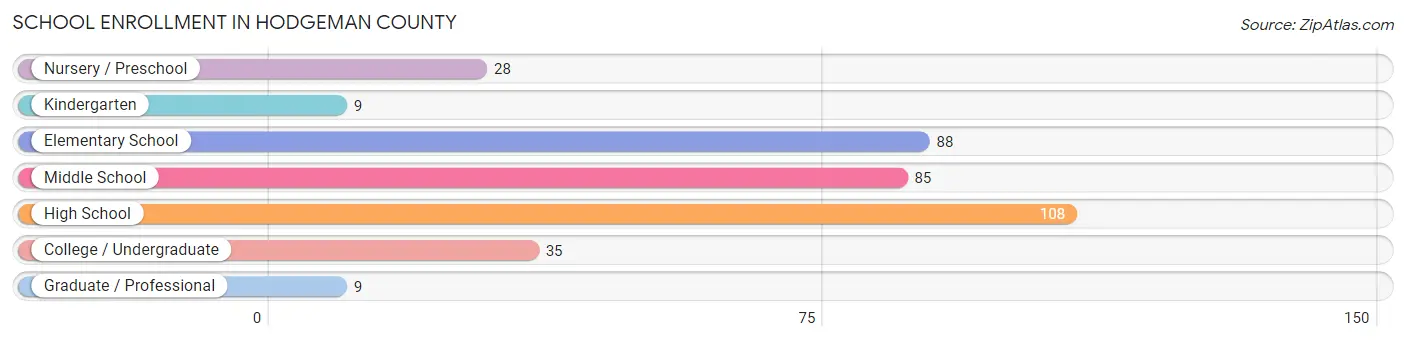
School Enrollment in Hodgeman County
The most common levels of schooling among the 362 students in Hodgeman County are high school (108 | 29.8%), elementary school (88 | 24.3%), and middle school (85 | 23.5%).
| School Level | # Students | % Students |
| Nursery / Preschool | 28 | 7.7% |
| Kindergarten | 9 | 2.5% |
| Elementary School | 88 | 24.3% |
| Middle School | 85 | 23.5% |
| High School | 108 | 29.8% |
| College / Undergraduate | 35 | 9.7% |
| Graduate / Professional | 9 | 2.5% |
| Total | 362 | 100.0% |
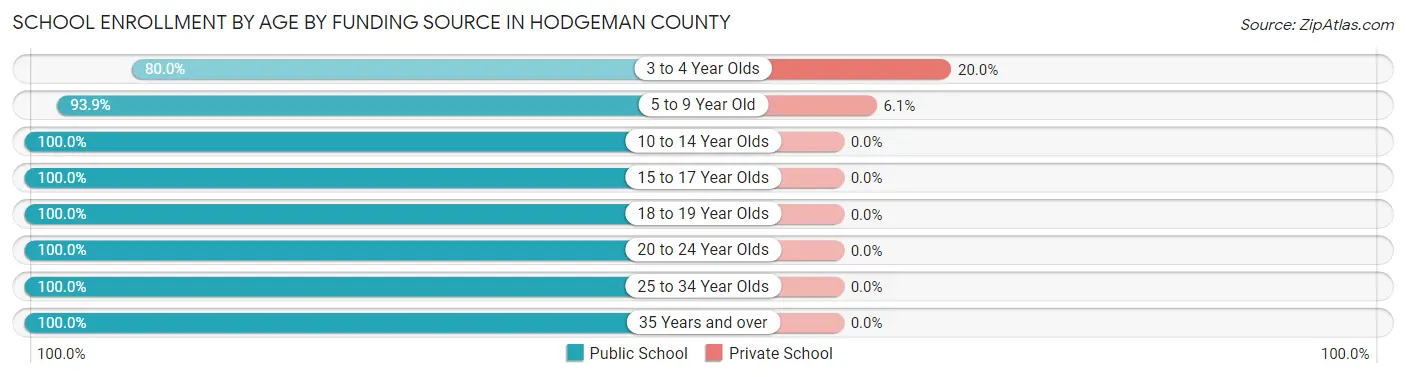
School Enrollment by Age by Funding Source in Hodgeman County
Out of a total of 362 students who are enrolled in schools in Hodgeman County, 9 (2.5%) attend a private institution, while the remaining 353 (97.5%) are enrolled in public schools. The age group of 3 to 4 year olds has the highest likelihood of being enrolled in private schools, with 3 (20.0% in the age bracket) enrolled. Conversely, the age group of 10 to 14 year olds has the lowest likelihood of being enrolled in a private school, with 106 (100.0% in the age bracket) attending a public institution.
| Age Bracket | Public School | Private School |
| 3 to 4 Year Olds | 12 (80.0%) | 3 (20.0%) |
| 5 to 9 Year Old | 92 (93.9%) | 6 (6.1%) |
| 10 to 14 Year Olds | 106 (100.0%) | 0 (0.0%) |
| 15 to 17 Year Olds | 81 (100.0%) | 0 (0.0%) |
| 18 to 19 Year Olds | 24 (100.0%) | 0 (0.0%) |
| 20 to 24 Year Olds | 17 (100.0%) | 0 (0.0%) |
| 25 to 34 Year Olds | 2 (100.0%) | 0 (0.0%) |
| 35 Years and over | 19 (100.0%) | 0 (0.0%) |
| Total | 353 (97.5%) | 9 (2.5%) |
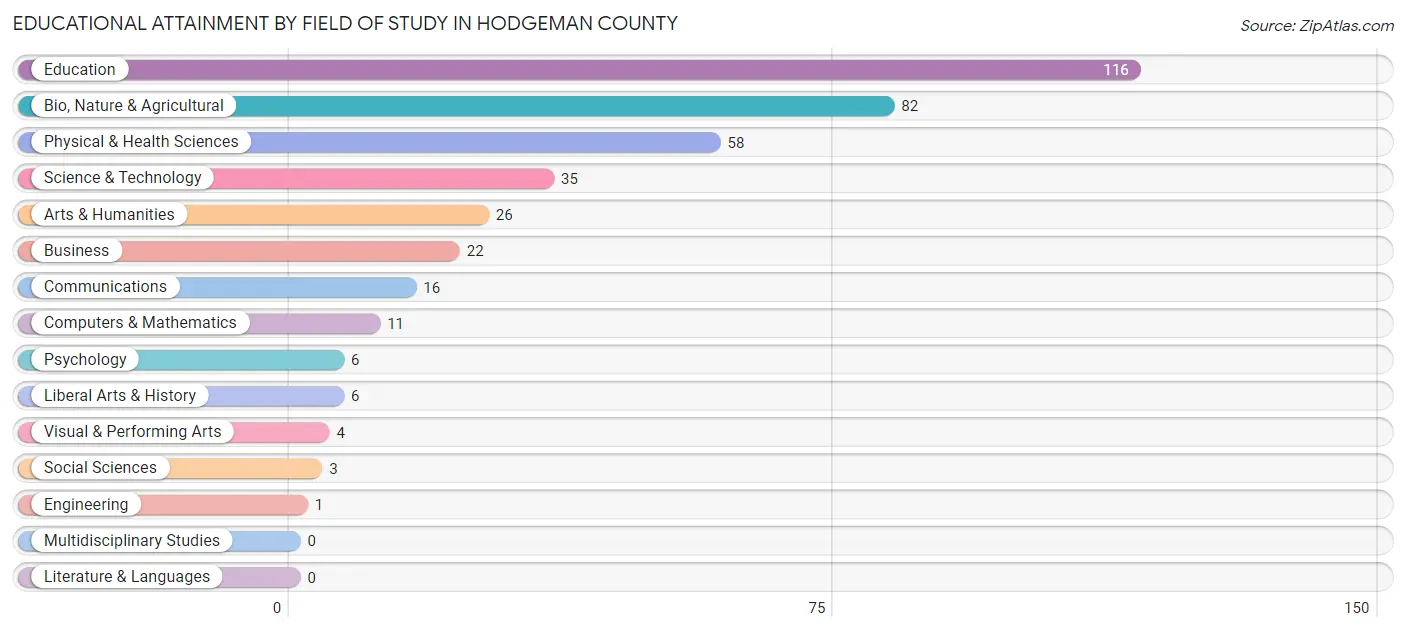
Educational Attainment by Field of Study in Hodgeman County
Education (116 | 30.0%), bio, nature & agricultural (82 | 21.2%), physical & health sciences (58 | 15.0%), science & technology (35 | 9.1%), and arts & humanities (26 | 6.7%) are the most common fields of study among 386 individuals in Hodgeman County who have obtained a bachelor's degree or higher.
| Field of Study | # Graduates | % Graduates |
| Computers & Mathematics | 11 | 2.9% |
| Bio, Nature & Agricultural | 82 | 21.2% |
| Physical & Health Sciences | 58 | 15.0% |
| Psychology | 6 | 1.5% |
| Social Sciences | 3 | 0.8% |
| Engineering | 1 | 0.3% |
| Multidisciplinary Studies | 0 | 0.0% |
| Science & Technology | 35 | 9.1% |
| Business | 22 | 5.7% |
| Education | 116 | 30.0% |
| Literature & Languages | 0 | 0.0% |
| Liberal Arts & History | 6 | 1.5% |
| Visual & Performing Arts | 4 | 1.0% |
| Communications | 16 | 4.2% |
| Arts & Humanities | 26 | 6.7% |
| Total | 386 | 100.0% |
Transportation & Commute in Hodgeman County
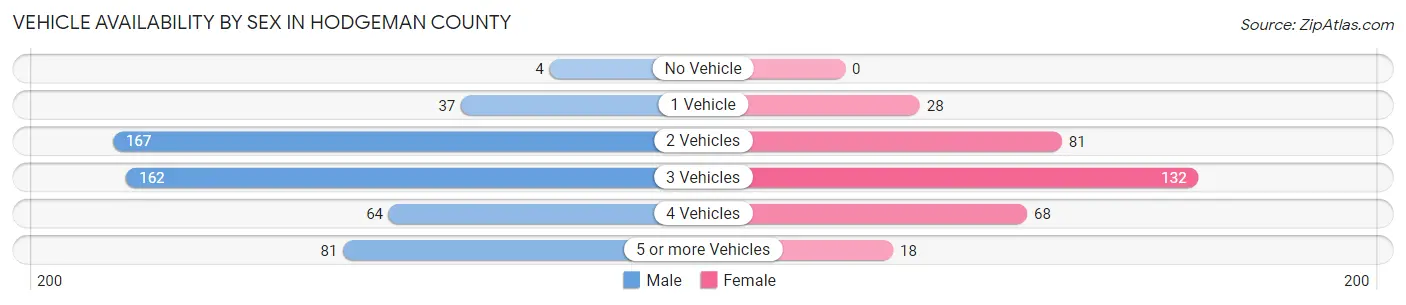
Vehicle Availability by Sex in Hodgeman County
The most prevalent vehicle ownership categories in Hodgeman County are males with 2 vehicles (167, accounting for 32.4%) and females with 2 vehicles (81, making up 51.1%).
| Vehicles Available | Male | Female |
| No Vehicle | 4 (0.8%) | 0 (0.0%) |
| 1 Vehicle | 37 (7.2%) | 28 (8.6%) |
| 2 Vehicles | 167 (32.4%) | 81 (24.8%) |
| 3 Vehicles | 162 (31.5%) | 132 (40.4%) |
| 4 Vehicles | 64 (12.4%) | 68 (20.8%) |
| 5 or more Vehicles | 81 (15.7%) | 18 (5.5%) |
| Total | 515 (100.0%) | 327 (100.0%) |
Commute Time in Hodgeman County
The most frequently occuring commute durations in Hodgeman County are less than 5 minutes (222 commuters, 27.8%), 5 to 9 minutes (144 commuters, 18.0%), and 30 to 34 minutes (135 commuters, 16.9%).
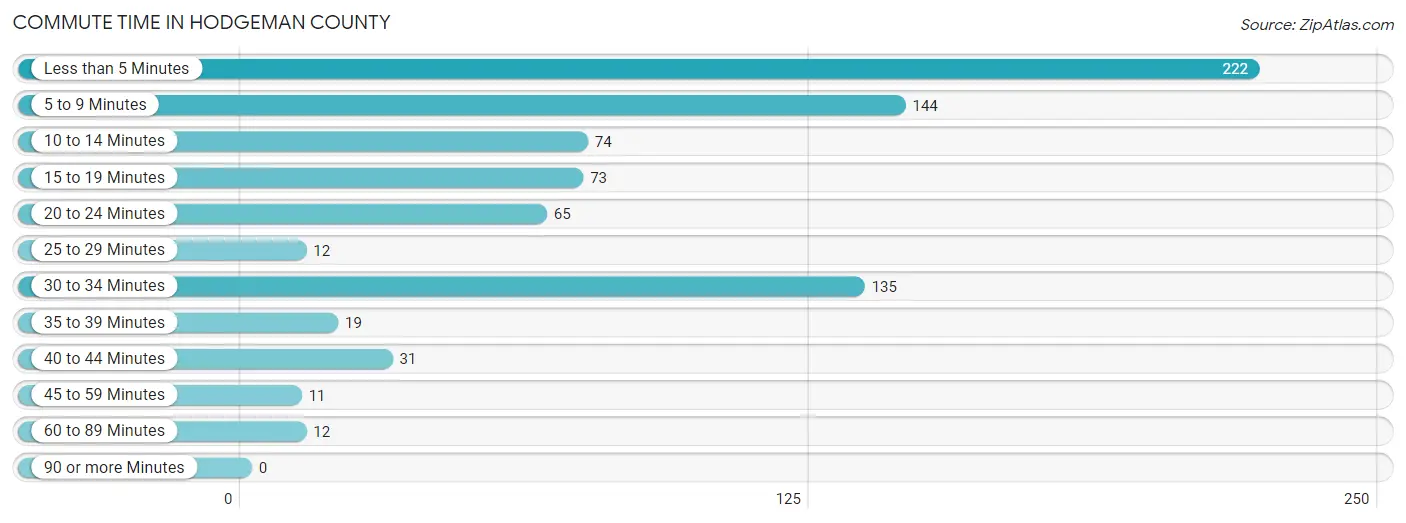
| Commute Time | # Commuters | % Commuters |
| Less than 5 Minutes | 222 | 27.8% |
| 5 to 9 Minutes | 144 | 18.0% |
| 10 to 14 Minutes | 74 | 9.3% |
| 15 to 19 Minutes | 73 | 9.1% |
| 20 to 24 Minutes | 65 | 8.2% |
| 25 to 29 Minutes | 12 | 1.5% |
| 30 to 34 Minutes | 135 | 16.9% |
| 35 to 39 Minutes | 19 | 2.4% |
| 40 to 44 Minutes | 31 | 3.9% |
| 45 to 59 Minutes | 11 | 1.4% |
| 60 to 89 Minutes | 12 | 1.5% |
| 90 or more Minutes | 0 | 0.0% |
Commute Time by Sex in Hodgeman County
The most common commute times in Hodgeman County are less than 5 minutes (130 commuters, 26.5%) for males and less than 5 minutes (92 commuters, 29.9%) for females.
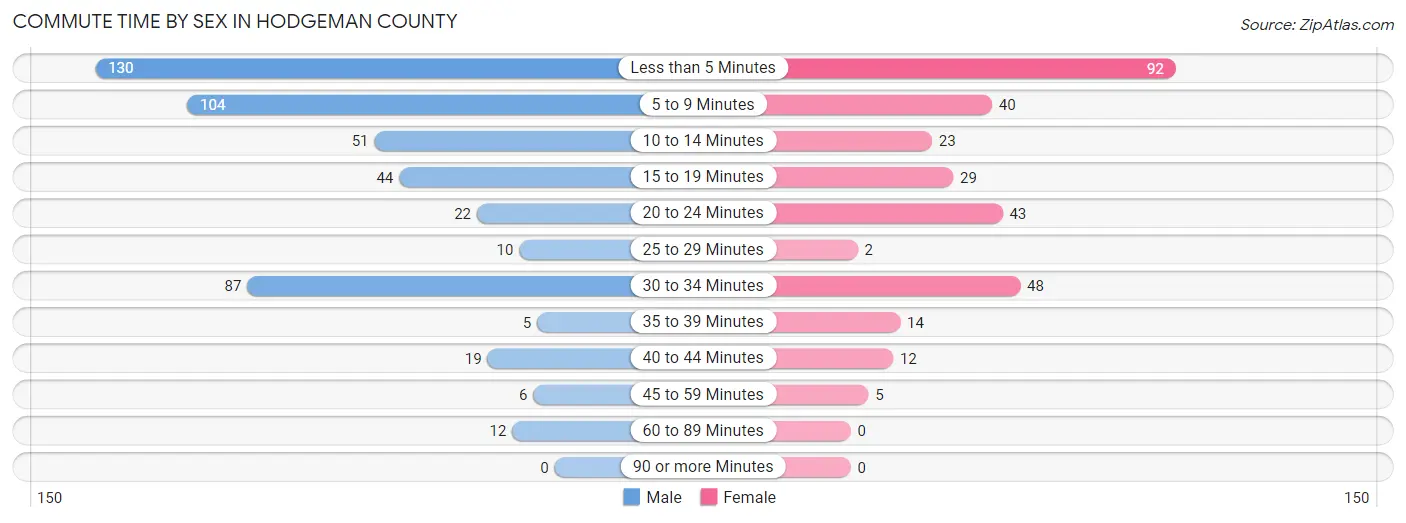
| Commute Time | Male | Female |
| Less than 5 Minutes | 130 (26.5%) | 92 (29.9%) |
| 5 to 9 Minutes | 104 (21.2%) | 40 (13.0%) |
| 10 to 14 Minutes | 51 (10.4%) | 23 (7.5%) |
| 15 to 19 Minutes | 44 (9.0%) | 29 (9.4%) |
| 20 to 24 Minutes | 22 (4.5%) | 43 (14.0%) |
| 25 to 29 Minutes | 10 (2.0%) | 2 (0.6%) |
| 30 to 34 Minutes | 87 (17.8%) | 48 (15.6%) |
| 35 to 39 Minutes | 5 (1.0%) | 14 (4.5%) |
| 40 to 44 Minutes | 19 (3.9%) | 12 (3.9%) |
| 45 to 59 Minutes | 6 (1.2%) | 5 (1.6%) |
| 60 to 89 Minutes | 12 (2.5%) | 0 (0.0%) |
| 90 or more Minutes | 0 (0.0%) | 0 (0.0%) |
Time of Departure to Work by Sex in Hodgeman County
The most frequent times of departure to work in Hodgeman County are 7:00 AM to 7:29 AM (116, 23.7%) for males and 7:30 AM to 7:59 AM (65, 21.1%) for females.
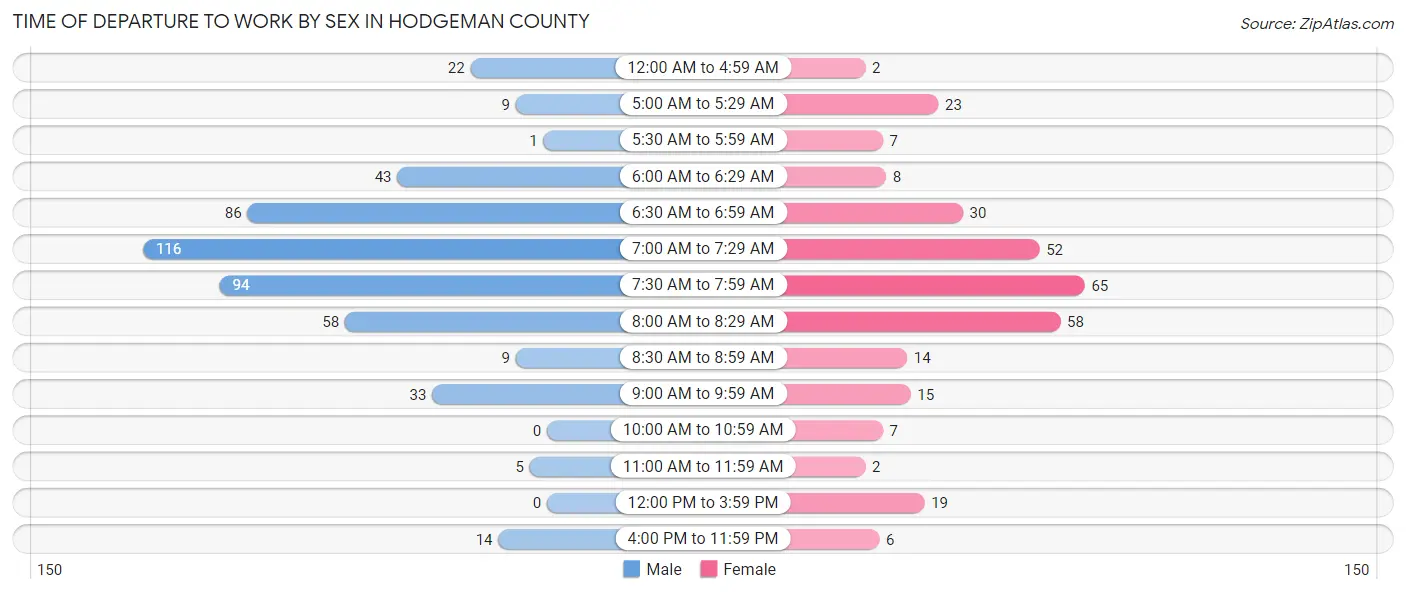
| Time of Departure | Male | Female |
| 12:00 AM to 4:59 AM | 22 (4.5%) | 2 (0.6%) |
| 5:00 AM to 5:29 AM | 9 (1.8%) | 23 (7.5%) |
| 5:30 AM to 5:59 AM | 1 (0.2%) | 7 (2.3%) |
| 6:00 AM to 6:29 AM | 43 (8.8%) | 8 (2.6%) |
| 6:30 AM to 6:59 AM | 86 (17.5%) | 30 (9.7%) |
| 7:00 AM to 7:29 AM | 116 (23.7%) | 52 (16.9%) |
| 7:30 AM to 7:59 AM | 94 (19.2%) | 65 (21.1%) |
| 8:00 AM to 8:29 AM | 58 (11.8%) | 58 (18.8%) |
| 8:30 AM to 8:59 AM | 9 (1.8%) | 14 (4.5%) |
| 9:00 AM to 9:59 AM | 33 (6.7%) | 15 (4.9%) |
| 10:00 AM to 10:59 AM | 0 (0.0%) | 7 (2.3%) |
| 11:00 AM to 11:59 AM | 5 (1.0%) | 2 (0.6%) |
| 12:00 PM to 3:59 PM | 0 (0.0%) | 19 (6.2%) |
| 4:00 PM to 11:59 PM | 14 (2.9%) | 6 (1.9%) |
| Total | 490 (100.0%) | 308 (100.0%) |
Housing Occupancy in Hodgeman County
Occupancy by Ownership in Hodgeman County
Of the total 710 dwellings in Hodgeman County, owner-occupied units account for 577 (81.3%), while renter-occupied units make up 133 (18.7%).
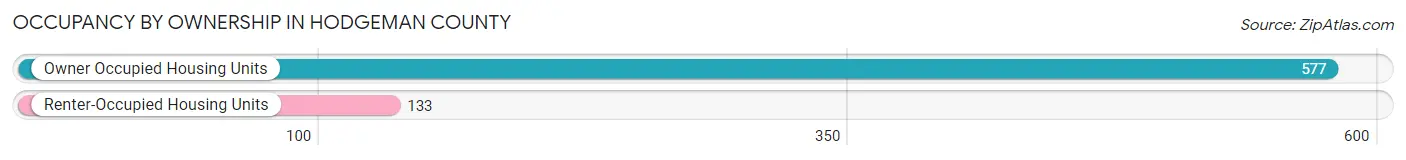
| Occupancy | # Housing Units | % Housing Units |
| Owner Occupied Housing Units | 577 | 81.3% |
| Renter-Occupied Housing Units | 133 | 18.7% |
| Total Occupied Housing Units | 710 | 100.0% |
Occupancy by Household Size in Hodgeman County
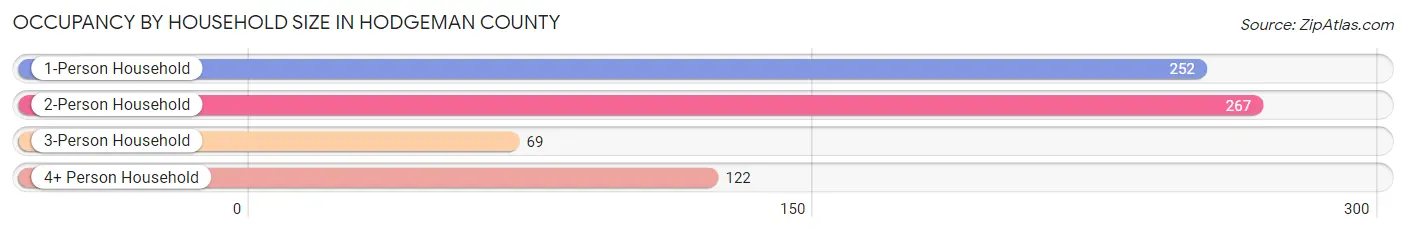
| Household Size | # Housing Units | % Housing Units |
| 1-Person Household | 252 | 35.5% |
| 2-Person Household | 267 | 37.6% |
| 3-Person Household | 69 | 9.7% |
| 4+ Person Household | 122 | 17.2% |
| Total Housing Units | 710 | 100.0% |
Occupancy by Ownership by Household Size in Hodgeman County
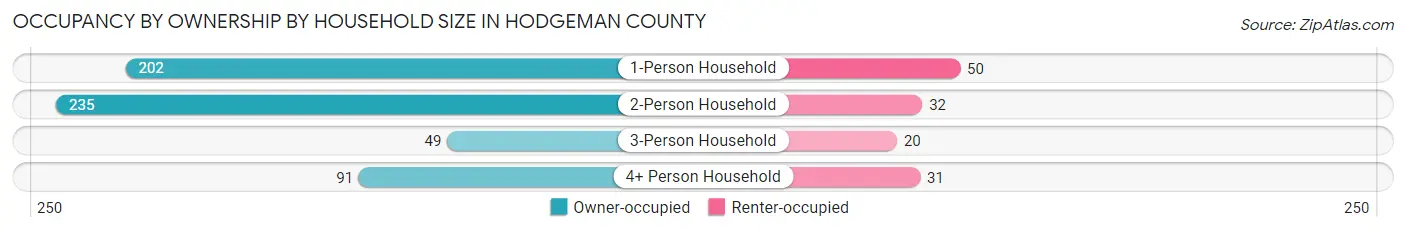
| Household Size | Owner-occupied | Renter-occupied |
| 1-Person Household | 202 (80.2%) | 50 (19.8%) |
| 2-Person Household | 235 (88.0%) | 32 (12.0%) |
| 3-Person Household | 49 (71.0%) | 20 (29.0%) |
| 4+ Person Household | 91 (74.6%) | 31 (25.4%) |
| Total Housing Units | 577 (81.3%) | 133 (18.7%) |
Occupancy by Educational Attainment in Hodgeman County
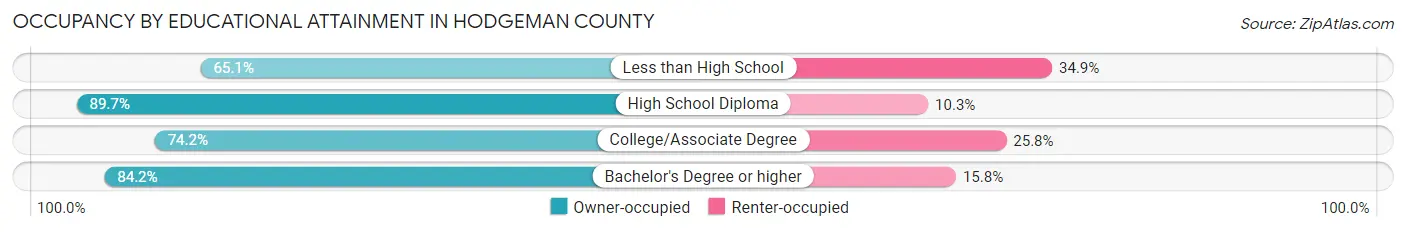
| Household Size | Owner-occupied | Renter-occupied |
| Less than High School | 28 (65.1%) | 15 (34.9%) |
| High School Diploma | 200 (89.7%) | 23 (10.3%) |
| College/Associate Degree | 184 (74.2%) | 64 (25.8%) |
| Bachelor's Degree or higher | 165 (84.2%) | 31 (15.8%) |
Occupancy by Age of Householder in Hodgeman County
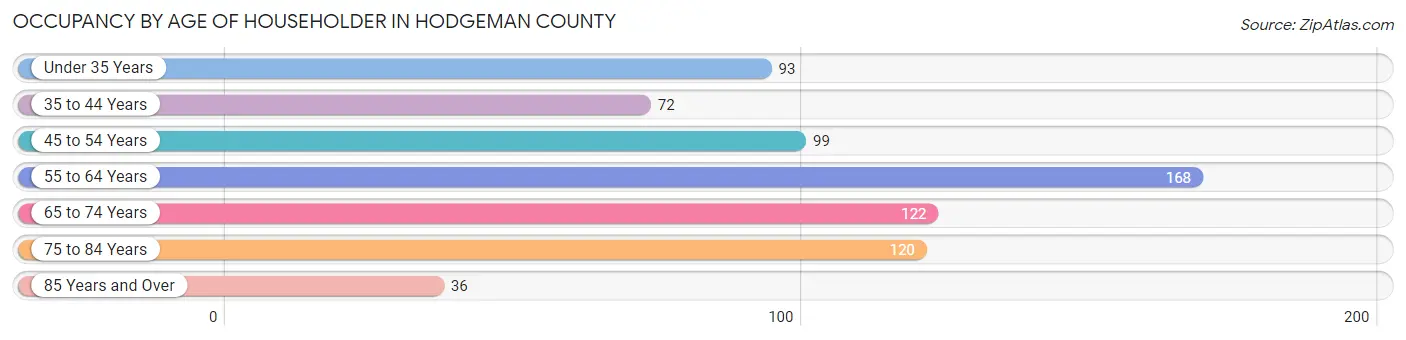
| Age Bracket | # Households | % Households |
| Under 35 Years | 93 | 13.1% |
| 35 to 44 Years | 72 | 10.1% |
| 45 to 54 Years | 99 | 13.9% |
| 55 to 64 Years | 168 | 23.7% |
| 65 to 74 Years | 122 | 17.2% |
| 75 to 84 Years | 120 | 16.9% |
| 85 Years and Over | 36 | 5.1% |
| Total | 710 | 100.0% |
Housing Finances in Hodgeman County
Median Income by Occupancy in Hodgeman County
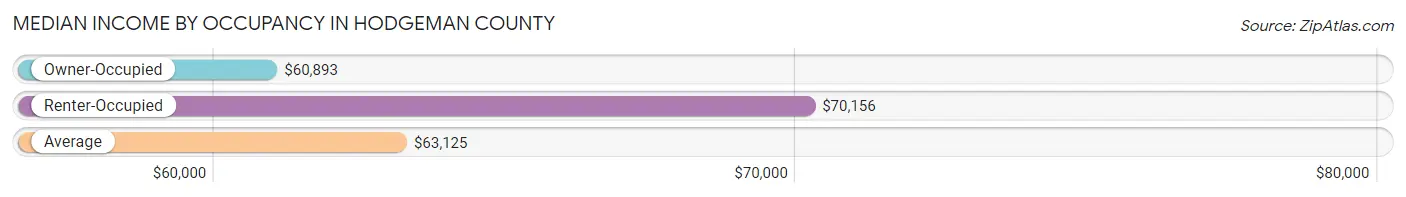
| Occupancy Type | # Households | Median Income |
| Owner-Occupied | 577 (81.3%) | $60,893 |
| Renter-Occupied | 133 (18.7%) | $70,156 |
| Average | 710 (100.0%) | $63,125 |
Occupancy by Householder Income Bracket in Hodgeman County
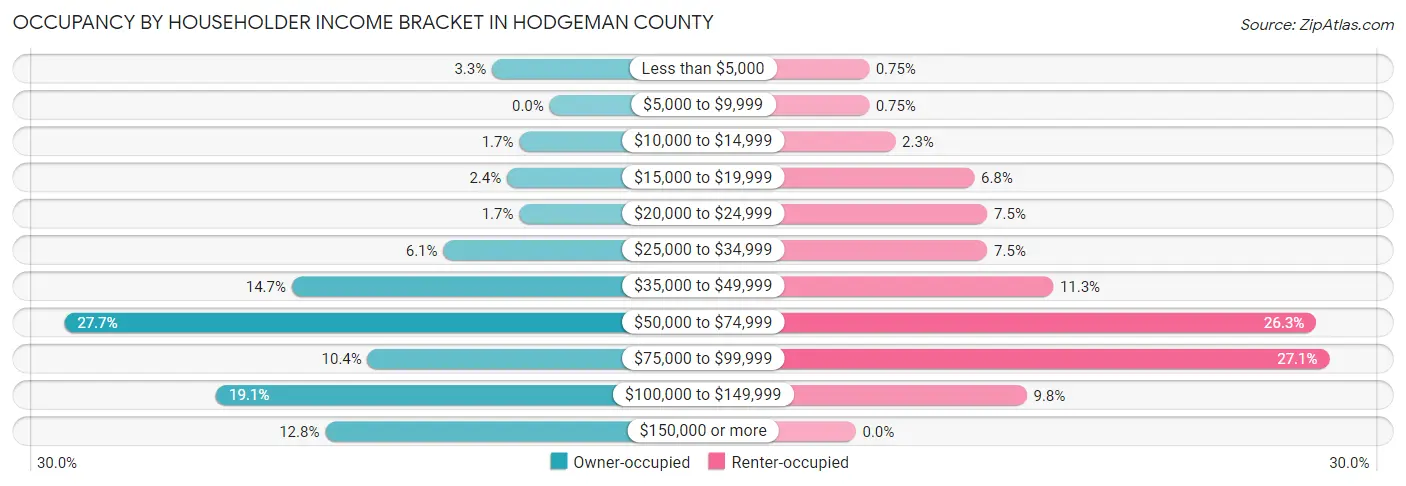
| Income Bracket | Owner-occupied | Renter-occupied |
| Less than $5,000 | 19 (3.3%) | 1 (0.7%) |
| $5,000 to $9,999 | 0 (0.0%) | 1 (0.7%) |
| $10,000 to $14,999 | 10 (1.7%) | 3 (2.3%) |
| $15,000 to $19,999 | 14 (2.4%) | 9 (6.8%) |
| $20,000 to $24,999 | 10 (1.7%) | 10 (7.5%) |
| $25,000 to $34,999 | 35 (6.1%) | 10 (7.5%) |
| $35,000 to $49,999 | 85 (14.7%) | 15 (11.3%) |
| $50,000 to $74,999 | 160 (27.7%) | 35 (26.3%) |
| $75,000 to $99,999 | 60 (10.4%) | 36 (27.1%) |
| $100,000 to $149,999 | 110 (19.1%) | 13 (9.8%) |
| $150,000 or more | 74 (12.8%) | 0 (0.0%) |
| Total | 577 (100.0%) | 133 (100.0%) |
Monthly Housing Cost Tiers in Hodgeman County
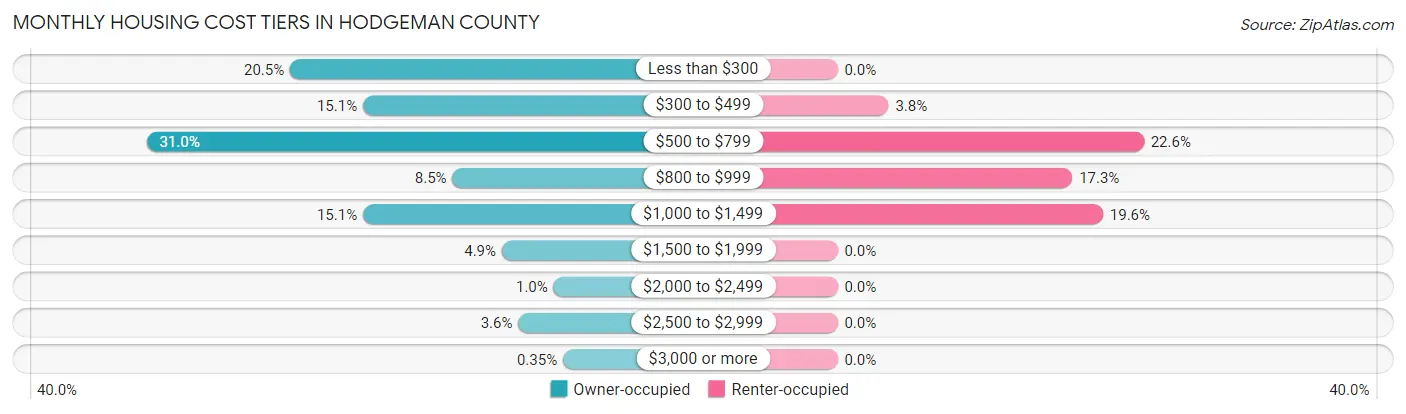
| Monthly Cost | Owner-occupied | Renter-occupied |
| Less than $300 | 118 (20.4%) | 0 (0.0%) |
| $300 to $499 | 87 (15.1%) | 5 (3.8%) |
| $500 to $799 | 179 (31.0%) | 30 (22.6%) |
| $800 to $999 | 49 (8.5%) | 23 (17.3%) |
| $1,000 to $1,499 | 87 (15.1%) | 26 (19.6%) |
| $1,500 to $1,999 | 28 (4.9%) | 0 (0.0%) |
| $2,000 to $2,499 | 6 (1.0%) | 0 (0.0%) |
| $2,500 to $2,999 | 21 (3.6%) | 0 (0.0%) |
| $3,000 or more | 2 (0.4%) | 0 (0.0%) |
| Total | 577 (100.0%) | 133 (100.0%) |
Physical Housing Characteristics in Hodgeman County
Housing Structures in Hodgeman County
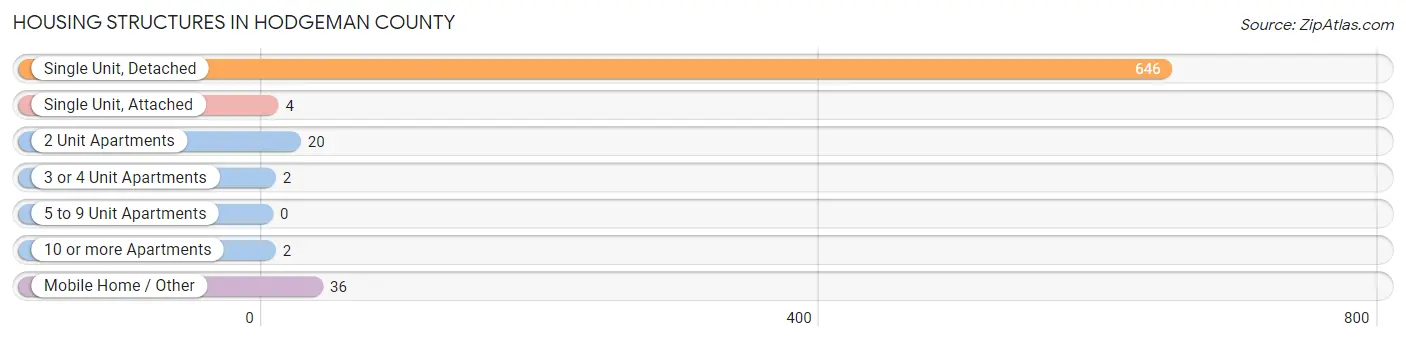
| Structure Type | # Housing Units | % Housing Units |
| Single Unit, Detached | 646 | 91.0% |
| Single Unit, Attached | 4 | 0.6% |
| 2 Unit Apartments | 20 | 2.8% |
| 3 or 4 Unit Apartments | 2 | 0.3% |
| 5 to 9 Unit Apartments | 0 | 0.0% |
| 10 or more Apartments | 2 | 0.3% |
| Mobile Home / Other | 36 | 5.1% |
| Total | 710 | 100.0% |
Housing Structures by Occupancy in Hodgeman County
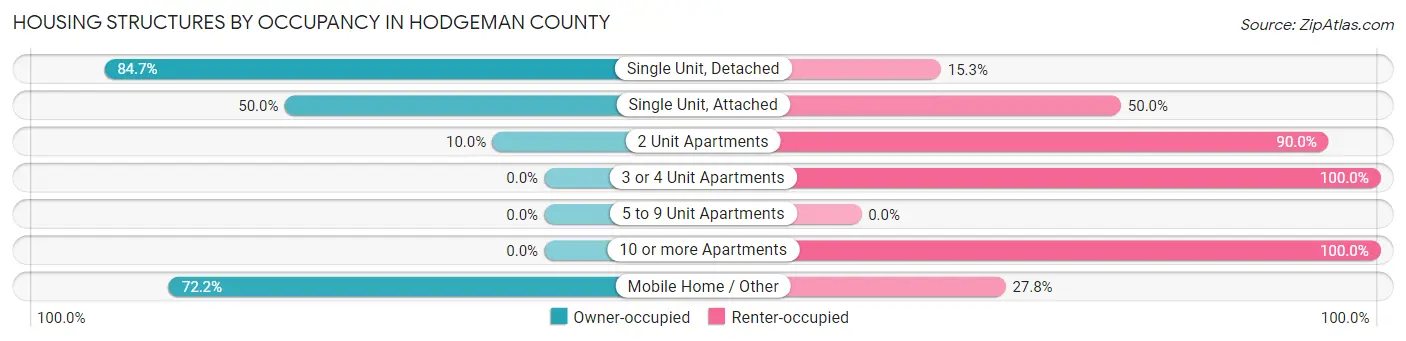
| Structure Type | Owner-occupied | Renter-occupied |
| Single Unit, Detached | 547 (84.7%) | 99 (15.3%) |
| Single Unit, Attached | 2 (50.0%) | 2 (50.0%) |
| 2 Unit Apartments | 2 (10.0%) | 18 (90.0%) |
| 3 or 4 Unit Apartments | 0 (0.0%) | 2 (100.0%) |
| 5 to 9 Unit Apartments | 0 (0.0%) | 0 (0.0%) |
| 10 or more Apartments | 0 (0.0%) | 2 (100.0%) |
| Mobile Home / Other | 26 (72.2%) | 10 (27.8%) |
| Total | 577 (81.3%) | 133 (18.7%) |
Housing Structures by Number of Rooms in Hodgeman County
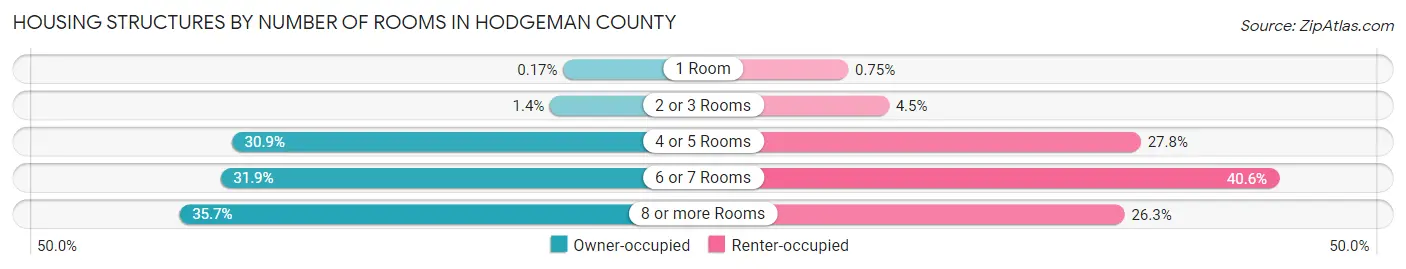
| Number of Rooms | Owner-occupied | Renter-occupied |
| 1 Room | 1 (0.2%) | 1 (0.7%) |
| 2 or 3 Rooms | 8 (1.4%) | 6 (4.5%) |
| 4 or 5 Rooms | 178 (30.8%) | 37 (27.8%) |
| 6 or 7 Rooms | 184 (31.9%) | 54 (40.6%) |
| 8 or more Rooms | 206 (35.7%) | 35 (26.3%) |
| Total | 577 (100.0%) | 133 (100.0%) |
Housing Structure by Heating Type in Hodgeman County
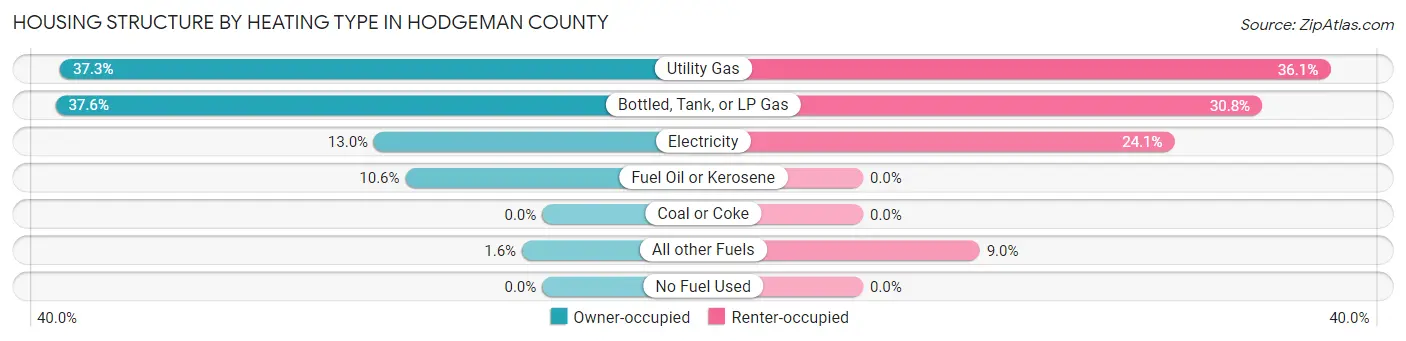
| Heating Type | Owner-occupied | Renter-occupied |
| Utility Gas | 215 (37.3%) | 48 (36.1%) |
| Bottled, Tank, or LP Gas | 217 (37.6%) | 41 (30.8%) |
| Electricity | 75 (13.0%) | 32 (24.1%) |
| Fuel Oil or Kerosene | 61 (10.6%) | 0 (0.0%) |
| Coal or Coke | 0 (0.0%) | 0 (0.0%) |
| All other Fuels | 9 (1.6%) | 12 (9.0%) |
| No Fuel Used | 0 (0.0%) | 0 (0.0%) |
| Total | 577 (100.0%) | 133 (100.0%) |
Household Vehicle Usage in Hodgeman County
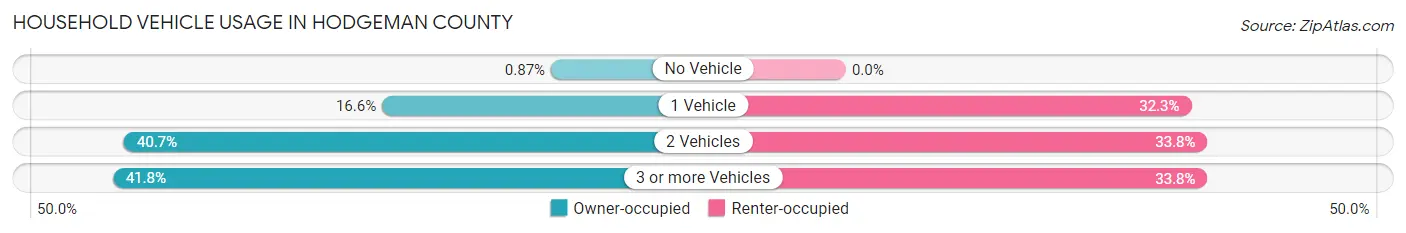
| Vehicles per Household | Owner-occupied | Renter-occupied |
| No Vehicle | 5 (0.9%) | 0 (0.0%) |
| 1 Vehicle | 96 (16.6%) | 43 (32.3%) |
| 2 Vehicles | 235 (40.7%) | 45 (33.8%) |
| 3 or more Vehicles | 241 (41.8%) | 45 (33.8%) |
| Total | 577 (100.0%) | 133 (100.0%) |
Real Estate & Mortgages in Hodgeman County
Real Estate and Mortgage Overview in Hodgeman County
| Characteristic | Without Mortgage | With Mortgage |
| Housing Units | 429 | 148 |
| Median Property Value | $80,200 | $160,400 |
| Median Household Income | $54,627 | $27 |
| Monthly Housing Costs | $532 | $0 |
| Real Estate Taxes | $1,364 | $0 |
Property Value by Mortgage Status in Hodgeman County
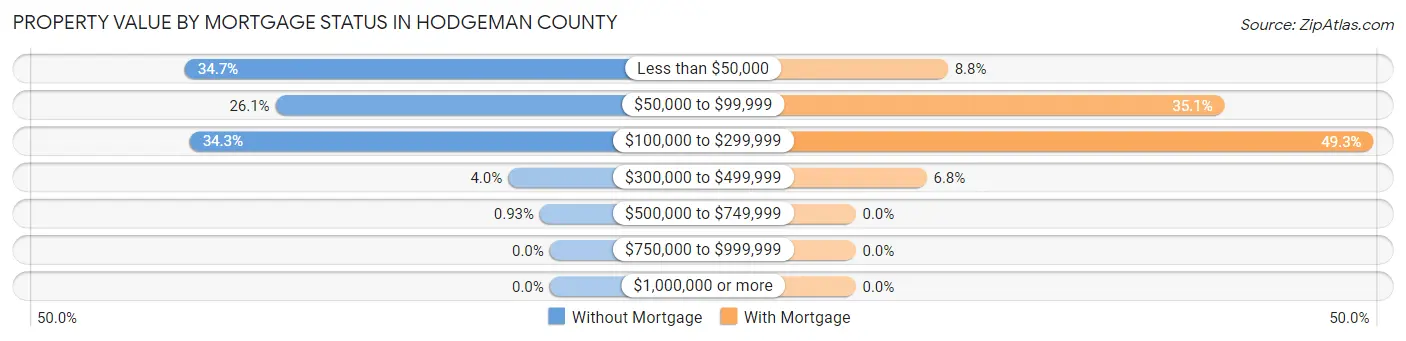
| Property Value | Without Mortgage | With Mortgage |
| Less than $50,000 | 149 (34.7%) | 13 (8.8%) |
| $50,000 to $99,999 | 112 (26.1%) | 52 (35.1%) |
| $100,000 to $299,999 | 147 (34.3%) | 73 (49.3%) |
| $300,000 to $499,999 | 17 (4.0%) | 10 (6.8%) |
| $500,000 to $749,999 | 4 (0.9%) | 0 (0.0%) |
| $750,000 to $999,999 | 0 (0.0%) | 0 (0.0%) |
| $1,000,000 or more | 0 (0.0%) | 0 (0.0%) |
| Total | 429 (100.0%) | 148 (100.0%) |
Household Income by Mortgage Status in Hodgeman County
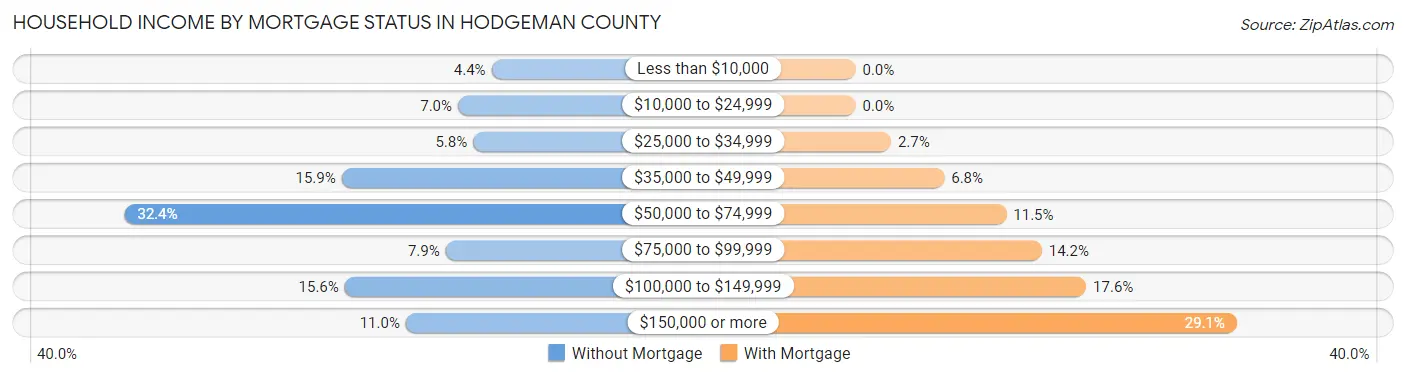
| Household Income | Without Mortgage | With Mortgage |
| Less than $10,000 | 19 (4.4%) | 0 (0.0%) |
| $10,000 to $24,999 | 30 (7.0%) | 0 (0.0%) |
| $25,000 to $34,999 | 25 (5.8%) | 4 (2.7%) |
| $35,000 to $49,999 | 68 (15.9%) | 10 (6.8%) |
| $50,000 to $74,999 | 139 (32.4%) | 17 (11.5%) |
| $75,000 to $99,999 | 34 (7.9%) | 21 (14.2%) |
| $100,000 to $149,999 | 67 (15.6%) | 26 (17.6%) |
| $150,000 or more | 47 (11.0%) | 43 (29.0%) |
| Total | 429 (100.0%) | 148 (100.0%) |
Property Value to Household Income Ratio in Hodgeman County
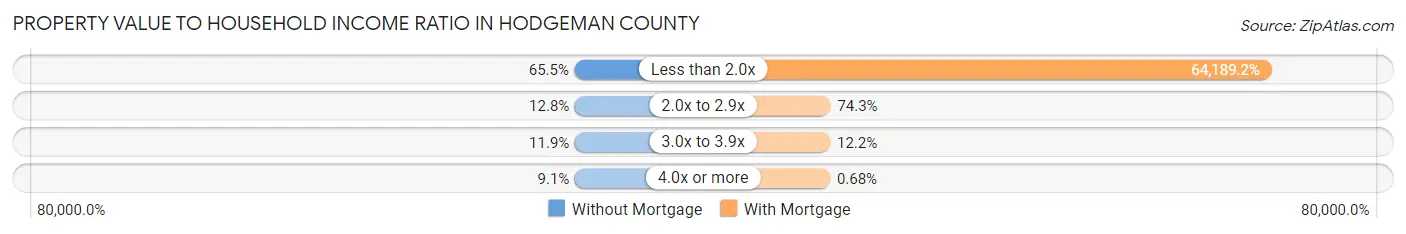
| Value-to-Income Ratio | Without Mortgage | With Mortgage |
| Less than 2.0x | 281 (65.5%) | 95,000 (64,189.2%) |
| 2.0x to 2.9x | 55 (12.8%) | 110 (74.3%) |
| 3.0x to 3.9x | 51 (11.9%) | 18 (12.2%) |
| 4.0x or more | 39 (9.1%) | 1 (0.7%) |
| Total | 429 (100.0%) | 148 (100.0%) |
Real Estate Taxes by Mortgage Status in Hodgeman County
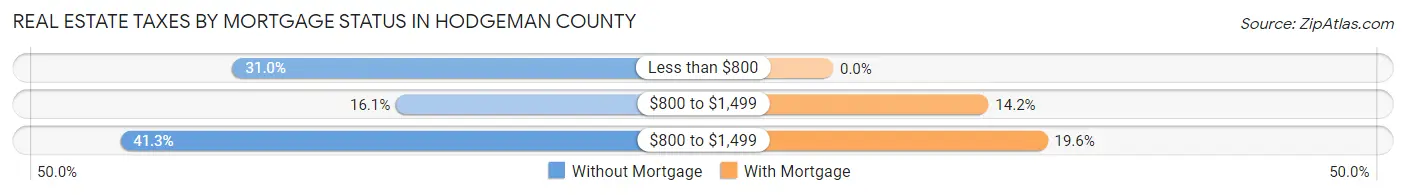
| Property Taxes | Without Mortgage | With Mortgage |
| Less than $800 | 133 (31.0%) | 0 (0.0%) |
| $800 to $1,499 | 69 (16.1%) | 21 (14.2%) |
| $800 to $1,499 | 177 (41.3%) | 29 (19.6%) |
| Total | 429 (100.0%) | 148 (100.0%) |
Health & Disability in Hodgeman County
Health Insurance Coverage by Age in Hodgeman County
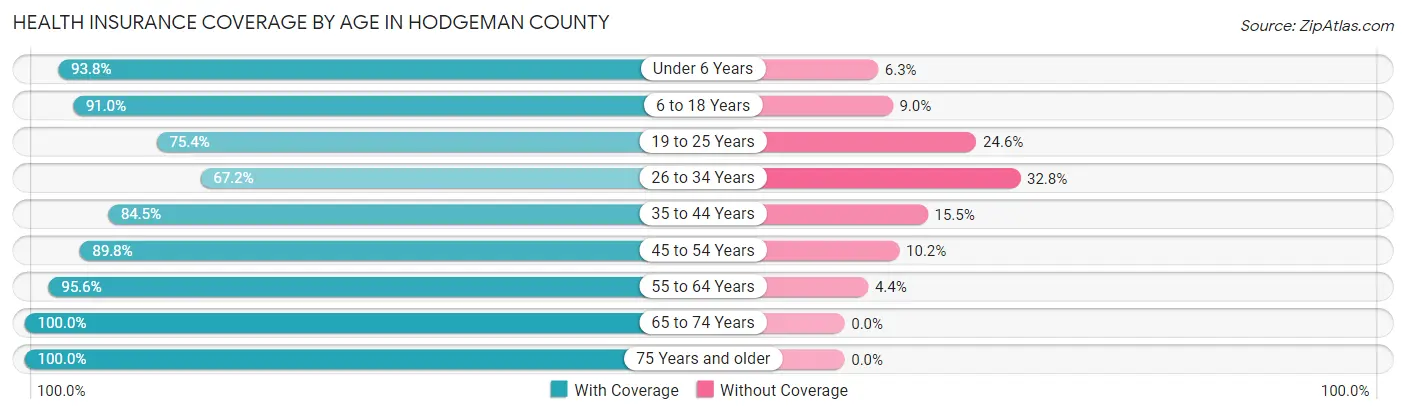
| Age Bracket | With Coverage | Without Coverage |
| Under 6 Years | 105 (93.8%) | 7 (6.2%) |
| 6 to 18 Years | 304 (91.0%) | 30 (9.0%) |
| 19 to 25 Years | 92 (75.4%) | 30 (24.6%) |
| 26 to 34 Years | 80 (67.2%) | 39 (32.8%) |
| 35 to 44 Years | 147 (84.5%) | 27 (15.5%) |
| 45 to 54 Years | 167 (89.8%) | 19 (10.2%) |
| 55 to 64 Years | 303 (95.6%) | 14 (4.4%) |
| 65 to 74 Years | 183 (100.0%) | 0 (0.0%) |
| 75 Years and older | 200 (100.0%) | 0 (0.0%) |
| Total | 1,581 (90.5%) | 166 (9.5%) |
Health Insurance Coverage by Citizenship Status in Hodgeman County
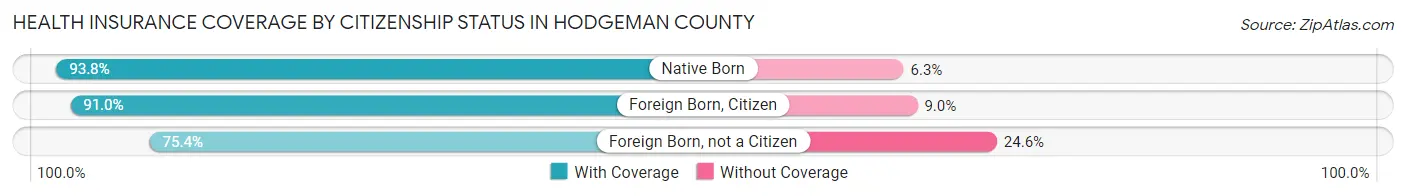
| Citizenship Status | With Coverage | Without Coverage |
| Native Born | 105 (93.8%) | 7 (6.2%) |
| Foreign Born, Citizen | 304 (91.0%) | 30 (9.0%) |
| Foreign Born, not a Citizen | 92 (75.4%) | 30 (24.6%) |
Health Insurance Coverage by Household Income in Hodgeman County
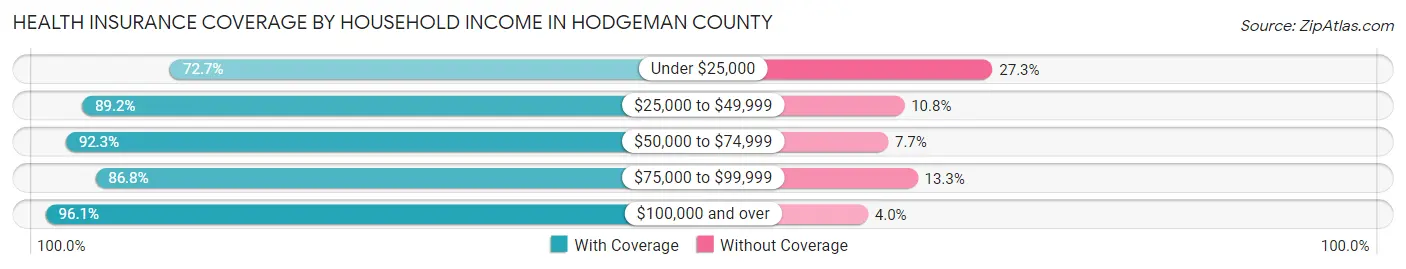
| Household Income | With Coverage | Without Coverage |
| Under $25,000 | 104 (72.7%) | 39 (27.3%) |
| $25,000 to $49,999 | 224 (89.2%) | 27 (10.8%) |
| $50,000 to $74,999 | 382 (92.3%) | 32 (7.7%) |
| $75,000 to $99,999 | 288 (86.8%) | 44 (13.3%) |
| $100,000 and over | 583 (96.1%) | 24 (4.0%) |
Public vs Private Health Insurance Coverage by Age in Hodgeman County
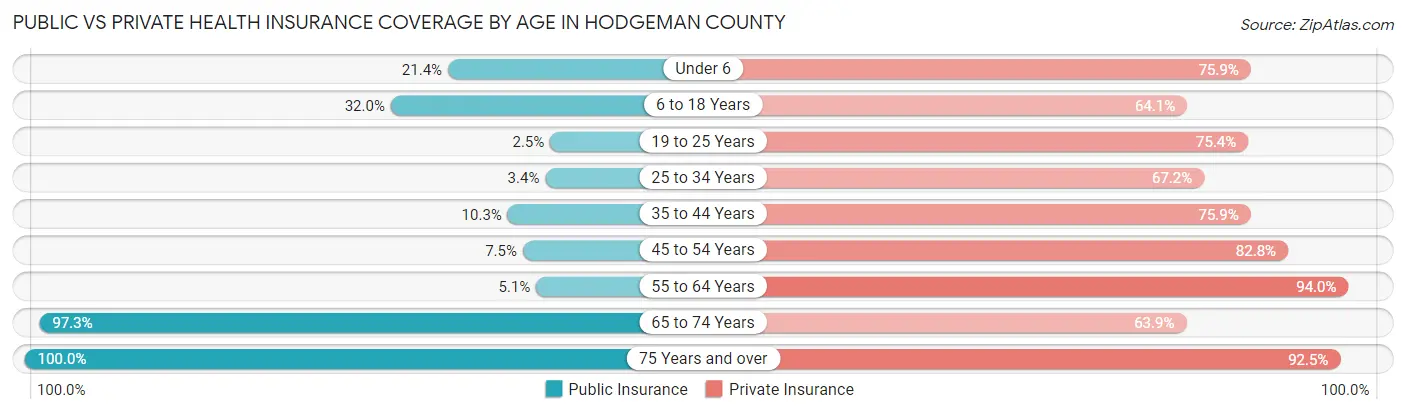
| Age Bracket | Public Insurance | Private Insurance |
| Under 6 | 24 (21.4%) | 85 (75.9%) |
| 6 to 18 Years | 107 (32.0%) | 214 (64.1%) |
| 19 to 25 Years | 3 (2.5%) | 92 (75.4%) |
| 25 to 34 Years | 4 (3.4%) | 80 (67.2%) |
| 35 to 44 Years | 18 (10.3%) | 132 (75.9%) |
| 45 to 54 Years | 14 (7.5%) | 154 (82.8%) |
| 55 to 64 Years | 16 (5.1%) | 298 (94.0%) |
| 65 to 74 Years | 178 (97.3%) | 117 (63.9%) |
| 75 Years and over | 200 (100.0%) | 185 (92.5%) |
| Total | 564 (32.3%) | 1,357 (77.7%) |
Disability Status by Sex by Age in Hodgeman County
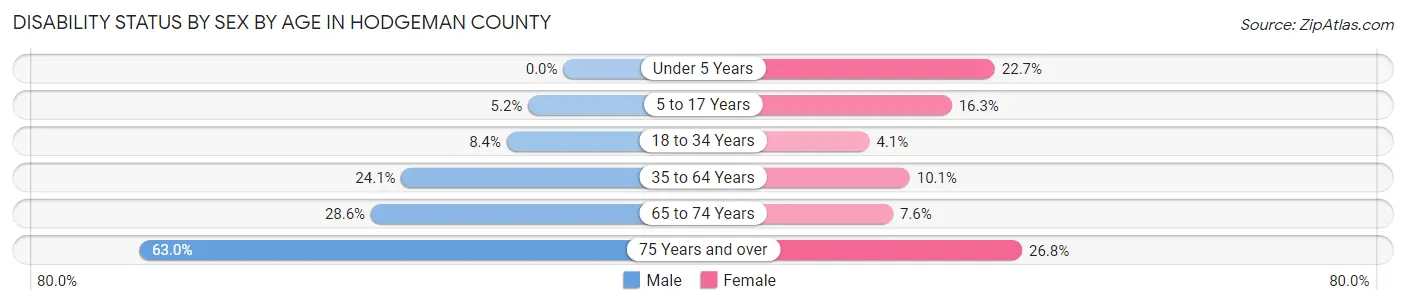
| Age Bracket | Male | Female |
| Under 5 Years | 0 (0.0%) | 10 (22.7%) |
| 5 to 17 Years | 7 (5.2%) | 31 (16.3%) |
| 18 to 34 Years | 11 (8.4%) | 6 (4.1%) |
| 35 to 64 Years | 89 (24.0%) | 31 (10.1%) |
| 65 to 74 Years | 26 (28.6%) | 7 (7.6%) |
| 75 Years and over | 46 (63.0%) | 34 (26.8%) |
Disability Class by Sex by Age in Hodgeman County
Disability Class: Hearing Difficulty
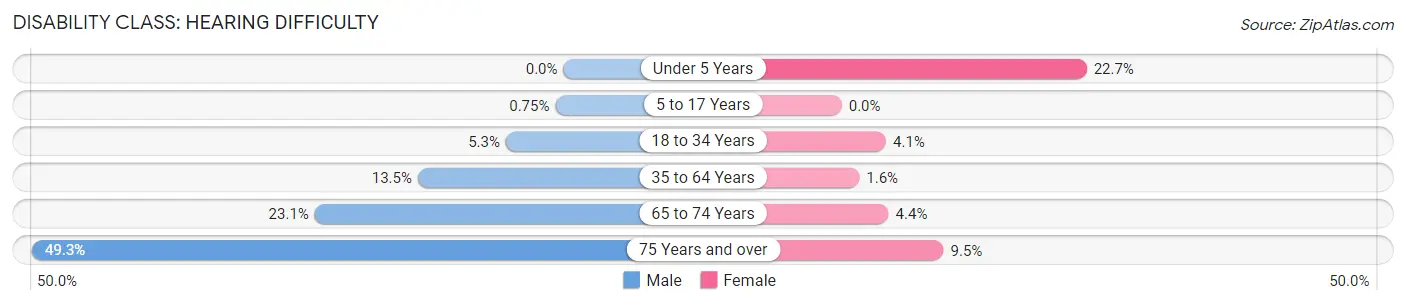
| Age Bracket | Male | Female |
| Under 5 Years | 0 (0.0%) | 10 (22.7%) |
| 5 to 17 Years | 1 (0.7%) | 0 (0.0%) |
| 18 to 34 Years | 7 (5.3%) | 6 (4.1%) |
| 35 to 64 Years | 50 (13.5%) | 5 (1.6%) |
| 65 to 74 Years | 21 (23.1%) | 4 (4.3%) |
| 75 Years and over | 36 (49.3%) | 12 (9.5%) |
Disability Class: Vision Difficulty
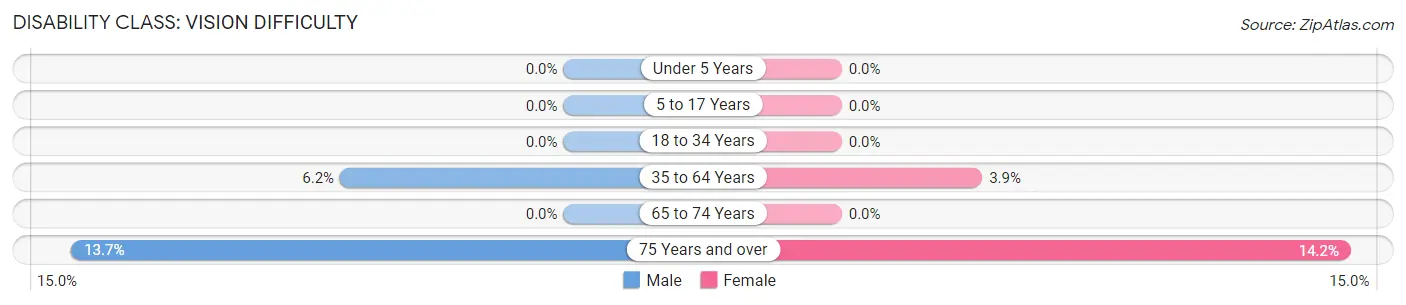
| Age Bracket | Male | Female |
| Under 5 Years | 0 (0.0%) | 0 (0.0%) |
| 5 to 17 Years | 0 (0.0%) | 0 (0.0%) |
| 18 to 34 Years | 0 (0.0%) | 0 (0.0%) |
| 35 to 64 Years | 23 (6.2%) | 12 (3.9%) |
| 65 to 74 Years | 0 (0.0%) | 0 (0.0%) |
| 75 Years and over | 10 (13.7%) | 18 (14.2%) |
Disability Class: Cognitive Difficulty
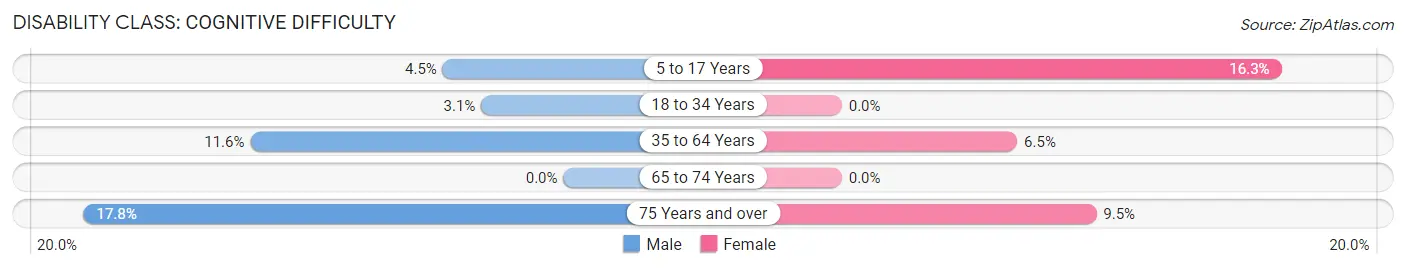
| Age Bracket | Male | Female |
| 5 to 17 Years | 6 (4.5%) | 31 (16.3%) |
| 18 to 34 Years | 4 (3.0%) | 0 (0.0%) |
| 35 to 64 Years | 43 (11.6%) | 20 (6.5%) |
| 65 to 74 Years | 0 (0.0%) | 0 (0.0%) |
| 75 Years and over | 13 (17.8%) | 12 (9.5%) |
Disability Class: Ambulatory Difficulty
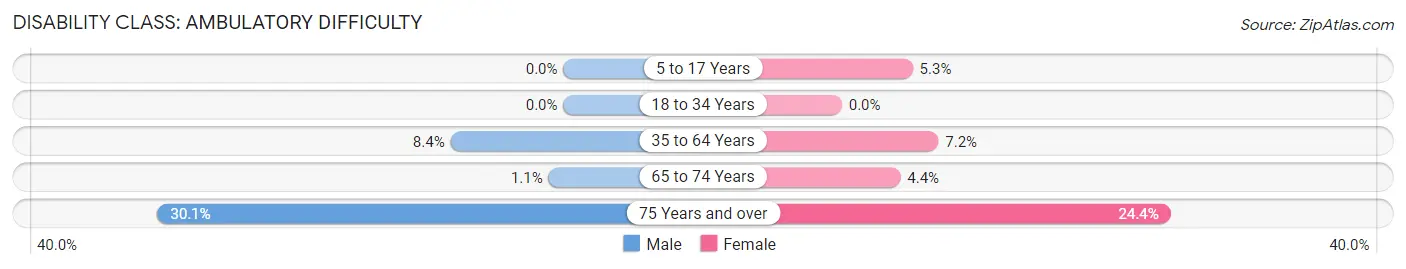
| Age Bracket | Male | Female |
| 5 to 17 Years | 0 (0.0%) | 10 (5.3%) |
| 18 to 34 Years | 0 (0.0%) | 0 (0.0%) |
| 35 to 64 Years | 31 (8.4%) | 22 (7.2%) |
| 65 to 74 Years | 1 (1.1%) | 4 (4.3%) |
| 75 Years and over | 22 (30.1%) | 31 (24.4%) |
Disability Class: Self-Care Difficulty
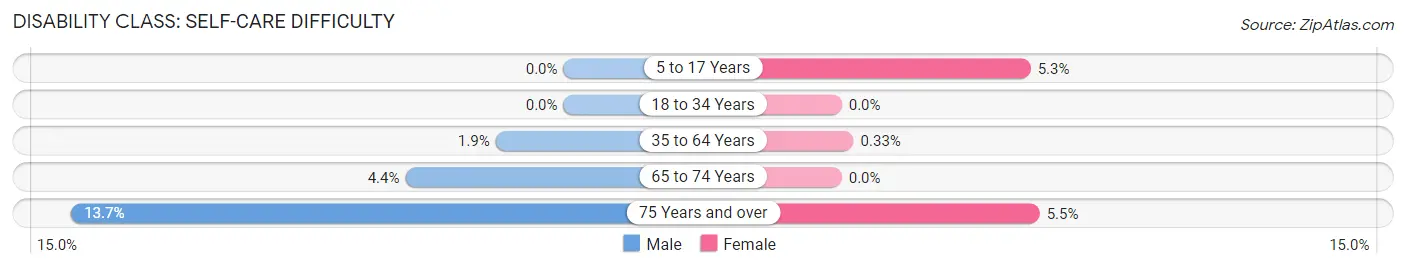
| Age Bracket | Male | Female |
| 5 to 17 Years | 0 (0.0%) | 10 (5.3%) |
| 18 to 34 Years | 0 (0.0%) | 0 (0.0%) |
| 35 to 64 Years | 7 (1.9%) | 1 (0.3%) |
| 65 to 74 Years | 4 (4.4%) | 0 (0.0%) |
| 75 Years and over | 10 (13.7%) | 7 (5.5%) |
Technology Access in Hodgeman County
Computing Device Access in Hodgeman County
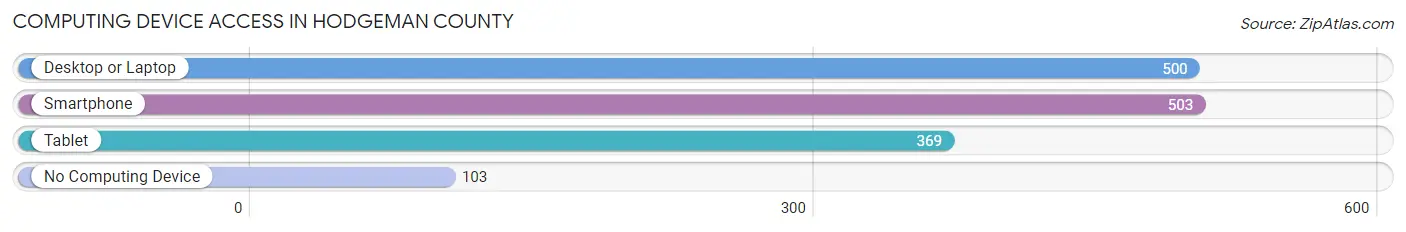
| Device Type | # Households | % Households |
| Desktop or Laptop | 500 | 70.4% |
| Smartphone | 503 | 70.9% |
| Tablet | 369 | 52.0% |
| No Computing Device | 103 | 14.5% |
| Total | 710 | 100.0% |
Internet Access in Hodgeman County
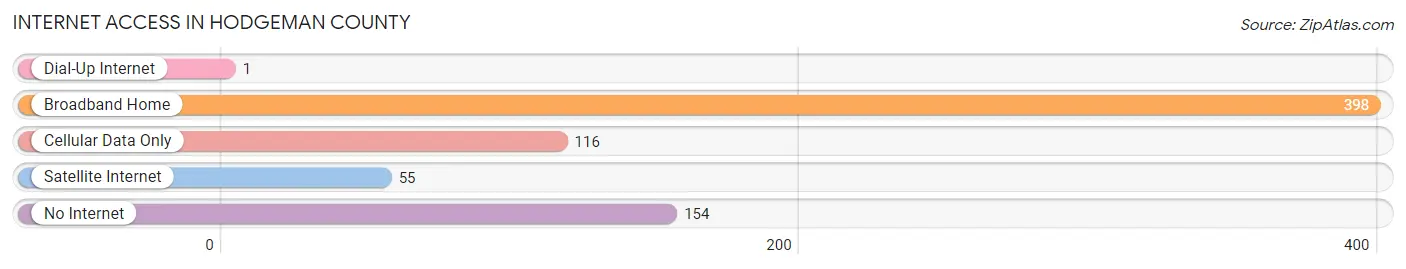
| Internet Type | # Households | % Households |
| Dial-Up Internet | 1 | 0.1% |
| Broadband Home | 398 | 56.1% |
| Cellular Data Only | 116 | 16.3% |
| Satellite Internet | 55 | 7.7% |
| No Internet | 154 | 21.7% |
| Total | 710 | 100.0% |
Hodgeman County Summary
Hodgeman County is located in the southwestern corner of the state of Kansas. It is bordered by Ford County to the north, Edwards County to the east, Pawnee County to the south, and Stanton County to the west. The county seat is Jetmore, and the largest city is Hanston. The county was named after John Hodgeman, a prominent early settler.
Geography
Hodgeman County covers an area of 876 square miles, making it the second-smallest county in Kansas. The county is mostly flat, with some rolling hills in the eastern part. The Arkansas River flows through the county, and there are several small creeks and streams. The county is mostly covered in grassland, with some areas of cropland.
Demographics
As of the 2010 census, Hodgeman County had a population of 2,845. The racial makeup of the county was 95.2% White, 0.3% African American, 0.7% Native American, 0.2% Asian, 0.1% Pacific Islander, 2.2% from other races, and 1.3% from two or more races. Hispanic or Latino of any race were 4.2% of the population.
The median income for a household in the county was $37,917, and the median income for a family was $45,000. The per capita income for the county was $17,845. About 11.2% of families and 14.2% of the population were below the poverty line, including 17.2% of those under age 18 and 11.2% of those age 65 or over.
Economy
Agriculture is the main economic activity in Hodgeman County. The county is home to several large farms, and the main crops grown are wheat, corn, and sorghum. Cattle and sheep are also raised in the county.
The county also has a few small businesses, including a few restaurants, a grocery store, and a few gas stations. There is also a small airport in Jetmore.
History
Hodgeman County was established in 1873. The county was named after John Hodgeman, a prominent early settler. The county seat was originally located in Hanston, but it was moved to Jetmore in 1876.
The county was largely agricultural from its founding until the early 20th century. In the 1920s, oil was discovered in the county, and the oil industry became a major part of the local economy. The oil industry declined in the 1950s, and the county returned to its agricultural roots.
Today, Hodgeman County is a rural, agricultural county. The county is home to several large farms, and the main crops grown are wheat, corn, and sorghum. Cattle and sheep are also raised in the county. The county also has a few small businesses, including a few restaurants, a grocery store, and a few gas stations.
Common Questions
What is Per Capita Income in Hodgeman County?
Per Capita income in Hodgeman County is $33,911.
What is the Median Family Income in Hodgeman County?
Median Family Income in Hodgeman County is $83,162.
What is the Median Household income in Hodgeman County?
Median Household Income in Hodgeman County is $63,125.
What is Income or Wage Gap in Hodgeman County?
Income or Wage Gap in Hodgeman County is 40.6%.
Women in Hodgeman County earn 59.4 cents for every dollar earned by a man.
What is Inequality or Gini Index in Hodgeman County?
Inequality or Gini Index in Hodgeman County is 0.37.
What is the Total Population of Hodgeman County?
Total Population of Hodgeman County is 1,770.
What is the Total Male Population of Hodgeman County?
Total Male Population of Hodgeman County is 849.
What is the Total Female Population of Hodgeman County?
Total Female Population of Hodgeman County is 921.
What is the Ratio of Males per 100 Females in Hodgeman County?
There are 92.18 Males per 100 Females in Hodgeman County.
What is the Ratio of Females per 100 Males in Hodgeman County?
There are 108.48 Females per 100 Males in Hodgeman County.
What is the Median Population Age in Hodgeman County?
Median Population Age in Hodgeman County is 46.0 Years.
What is the Average Family Size in Hodgeman County
Average Family Size in Hodgeman County is 3.2 People.
What is the Average Household Size in Hodgeman County
Average Household Size in Hodgeman County is 2.5 People.
How Large is the Labor Force in Hodgeman County?
There are 875 People in the Labor Forcein in Hodgeman County.
What is the Percentage of People in the Labor Force in Hodgeman County?
61.5% of People are in the Labor Force in Hodgeman County.
What is the Unemployment Rate in Hodgeman County?
Unemployment Rate in Hodgeman County is 2.1%.