Haskell County, KS Map & Demographics
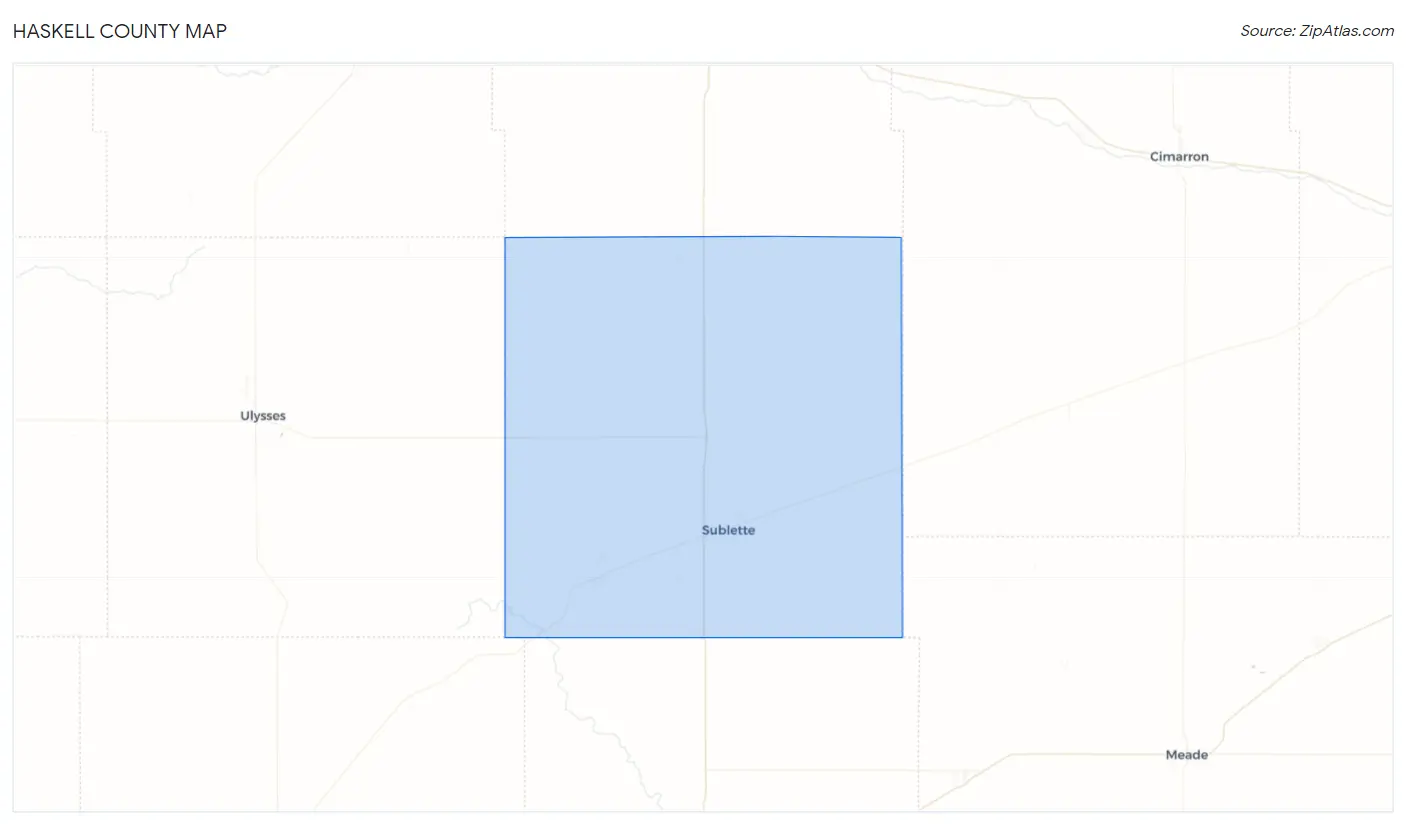
Haskell County Map
Haskell County Overview
$32,908
PER CAPITA INCOME
$91,696
AVG FAMILY INCOME
$66,458
AVG HOUSEHOLD INCOME
32.6%
WAGE / INCOME GAP [ % ]
67.4¢/ $1
WAGE / INCOME GAP [ $ ]
0.40
INEQUALITY / GINI INDEX
3,735
TOTAL POPULATION
1,824
MALE POPULATION
1,911
FEMALE POPULATION
95.45
MALES / 100 FEMALES
104.77
FEMALES / 100 MALES
38.0
MEDIAN AGE
3.4
AVG FAMILY SIZE
2.7
AVG HOUSEHOLD SIZE
1,878
LABOR FORCE [ PEOPLE ]
66.2%
PERCENT IN LABOR FORCE
3.5%
UNEMPLOYMENT RATE
Haskell County Area Codes
Income in Haskell County
Income Overview in Haskell County
Per Capita Income in Haskell County is $32,908, while median incomes of families and households are $91,696 and $66,458 respectively.
| Characteristic | Number | Measure |
| Per Capita Income | 3,735 | $32,908 |
| Median Family Income | 935 | $91,696 |
| Mean Family Income | 935 | $108,305 |
| Median Household Income | 1,354 | $66,458 |
| Mean Household Income | 1,354 | $89,104 |
| Income Deficit | 935 | $0 |
| Wage / Income Gap (%) | 3,735 | 32.58% |
| Wage / Income Gap ($) | 3,735 | 67.42¢ per $1 |
| Gini / Inequality Index | 3,735 | 0.40 |
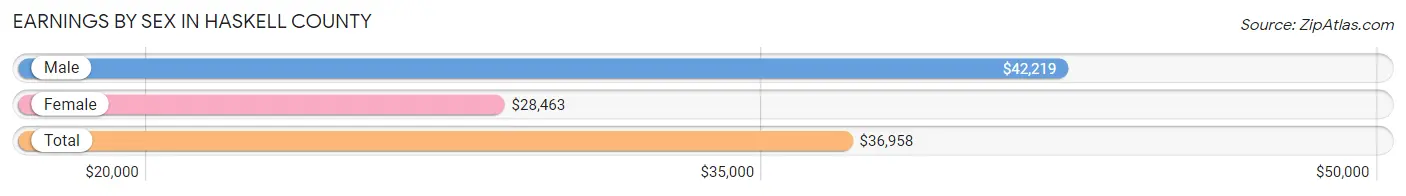
Earnings by Sex in Haskell County
Average Earnings in Haskell County are $36,958, $42,219 for men and $28,463 for women, a difference of 32.6%.
| Sex | Number | Average Earnings |
| Male | 1,177 (58.7%) | $42,219 |
| Female | 827 (41.3%) | $28,463 |
| Total | 2,004 (100.0%) | $36,958 |
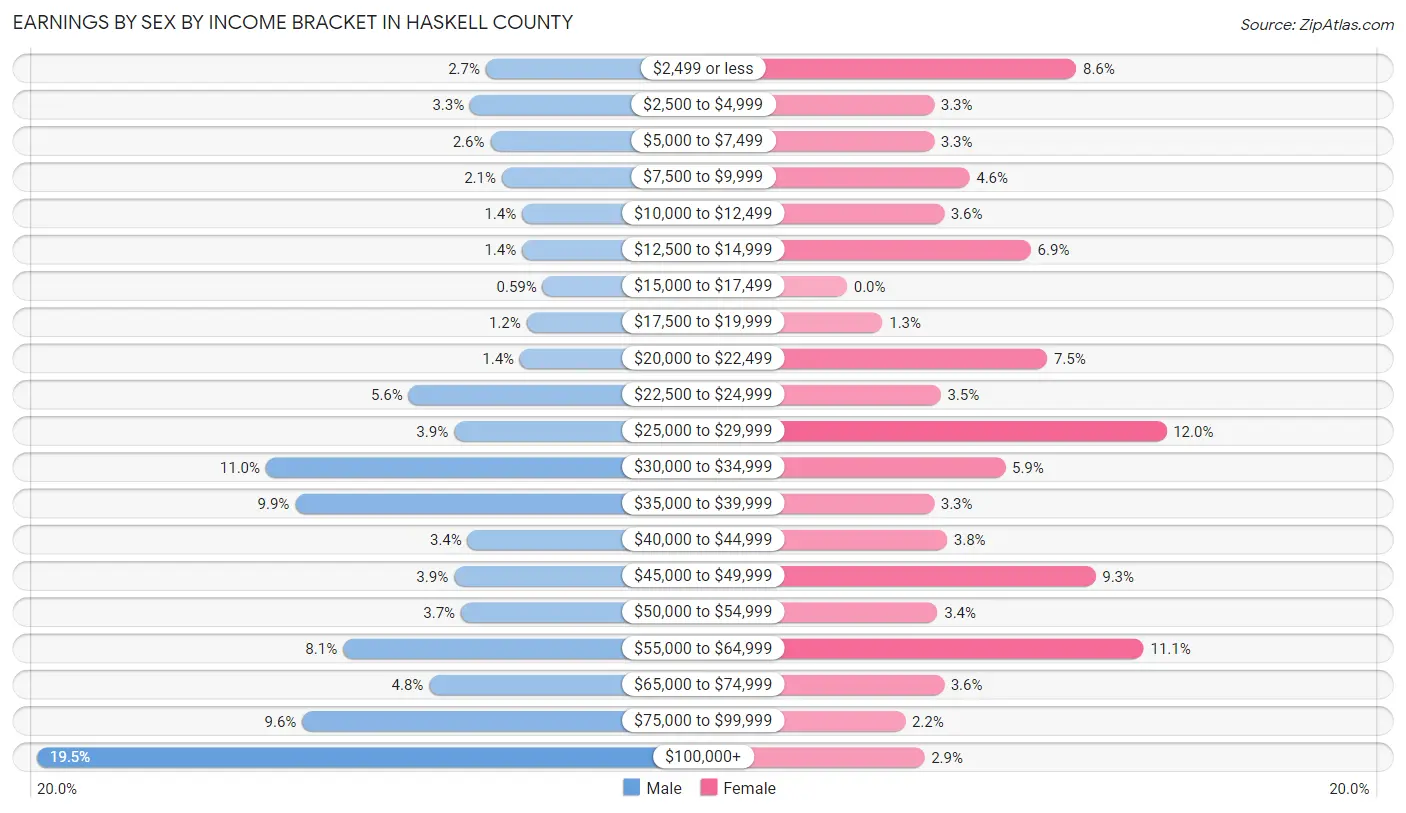
Earnings by Sex by Income Bracket in Haskell County
The most common earnings brackets in Haskell County are $100,000+ for men (230 | 19.5%) and $25,000 to $29,999 for women (99 | 12.0%).
| Income | Male | Female |
| $2,499 or less | 32 (2.7%) | 71 (8.6%) |
| $2,500 to $4,999 | 39 (3.3%) | 27 (3.3%) |
| $5,000 to $7,499 | 30 (2.5%) | 27 (3.3%) |
| $7,500 to $9,999 | 25 (2.1%) | 38 (4.6%) |
| $10,000 to $12,499 | 16 (1.4%) | 30 (3.6%) |
| $12,500 to $14,999 | 16 (1.4%) | 57 (6.9%) |
| $15,000 to $17,499 | 7 (0.6%) | 0 (0.0%) |
| $17,500 to $19,999 | 14 (1.2%) | 11 (1.3%) |
| $20,000 to $22,499 | 17 (1.4%) | 62 (7.5%) |
| $22,500 to $24,999 | 66 (5.6%) | 29 (3.5%) |
| $25,000 to $29,999 | 46 (3.9%) | 99 (12.0%) |
| $30,000 to $34,999 | 129 (11.0%) | 49 (5.9%) |
| $35,000 to $39,999 | 116 (9.9%) | 27 (3.3%) |
| $40,000 to $44,999 | 40 (3.4%) | 31 (3.7%) |
| $45,000 to $49,999 | 46 (3.9%) | 77 (9.3%) |
| $50,000 to $54,999 | 43 (3.6%) | 28 (3.4%) |
| $55,000 to $64,999 | 95 (8.1%) | 92 (11.1%) |
| $65,000 to $74,999 | 57 (4.8%) | 30 (3.6%) |
| $75,000 to $99,999 | 113 (9.6%) | 18 (2.2%) |
| $100,000+ | 230 (19.5%) | 24 (2.9%) |
| Total | 1,177 (100.0%) | 827 (100.0%) |
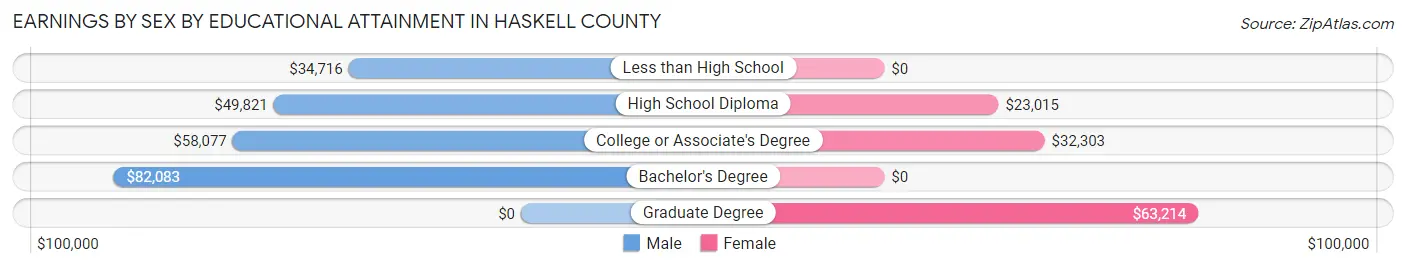
Earnings by Sex by Educational Attainment in Haskell County
Average earnings in Haskell County are $53,264 for men and $29,940 for women, a difference of 43.8%. Men with an educational attainment of bachelor's degree enjoy the highest average annual earnings of $82,083, while those with less than high school education earn the least with $34,716. Women with an educational attainment of graduate degree earn the most with the average annual earnings of $63,214, while those with high school diploma education have the smallest earnings of $23,015.
| Educational Attainment | Male Income | Female Income |
| Less than High School | $34,716 | $0 |
| High School Diploma | $49,821 | $23,015 |
| College or Associate's Degree | $58,077 | $32,303 |
| Bachelor's Degree | $82,083 | $0 |
| Graduate Degree | - | - |
| Total | $53,264 | $29,940 |
Family Income in Haskell County
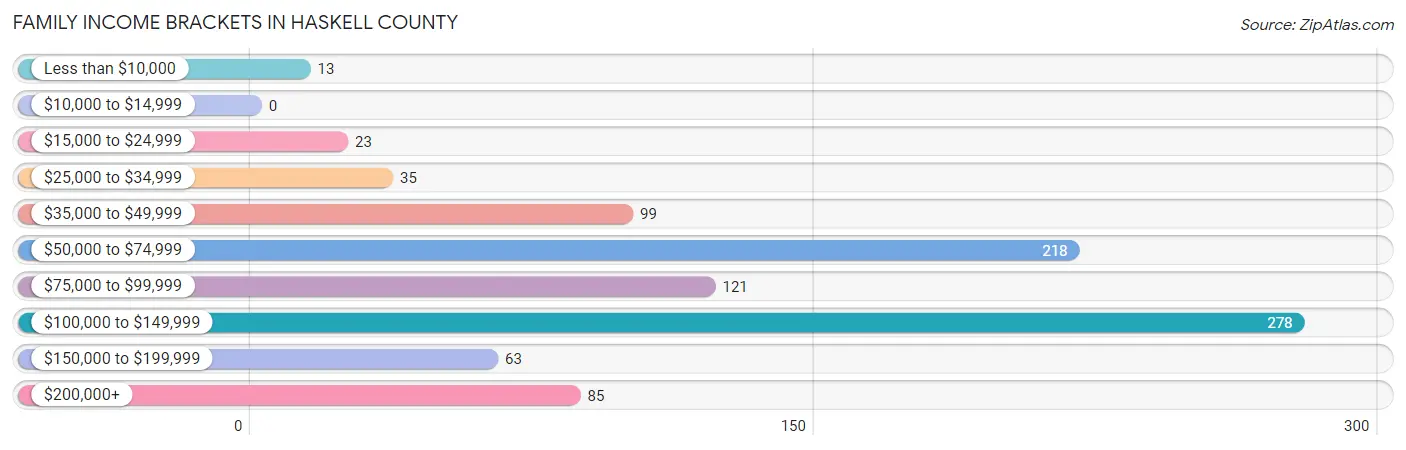
Family Income Brackets in Haskell County
According to the Haskell County family income data, there are 278 families falling into the $100,000 to $149,999 income range, which is the most common income bracket and makes up 29.7% of all families.
| Income Bracket | # Families | % Families |
| Less than $10,000 | 13 | 1.4% |
| $10,000 to $14,999 | 0 | 0.0% |
| $15,000 to $24,999 | 23 | 2.5% |
| $25,000 to $34,999 | 35 | 3.7% |
| $35,000 to $49,999 | 99 | 10.6% |
| $50,000 to $74,999 | 218 | 23.3% |
| $75,000 to $99,999 | 121 | 12.9% |
| $100,000 to $149,999 | 278 | 29.7% |
| $150,000 to $199,999 | 63 | 6.7% |
| $200,000+ | 85 | 9.1% |
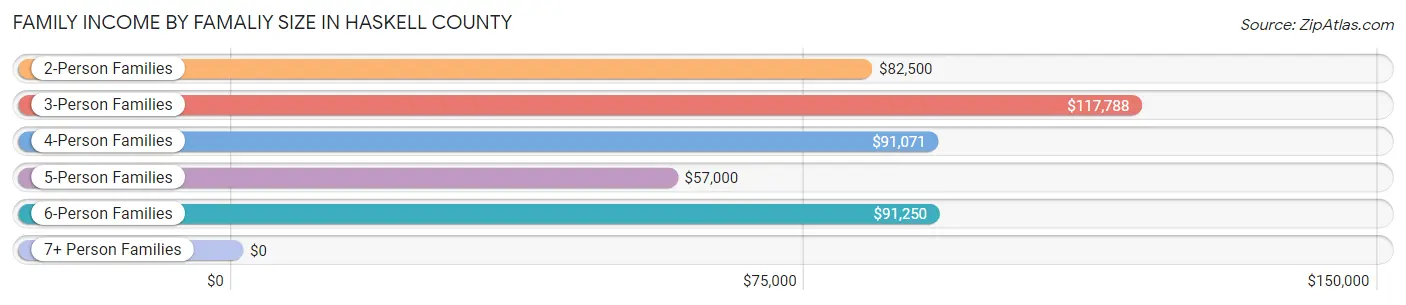
Family Income by Famaliy Size in Haskell County
3-person families (193 | 20.6%) account for the highest median family income in Haskell County with $117,788 per family, while 2-person families (388 | 41.5%) have the highest median income of $41,250 per family member.
| Income Bracket | # Families | Median Income |
| 2-Person Families | 388 (41.5%) | $82,500 |
| 3-Person Families | 193 (20.6%) | $117,788 |
| 4-Person Families | 254 (27.2%) | $91,071 |
| 5-Person Families | 58 (6.2%) | $57,000 |
| 6-Person Families | 32 (3.4%) | $91,250 |
| 7+ Person Families | 10 (1.1%) | $0 |
| Total | 935 (100.0%) | $91,696 |
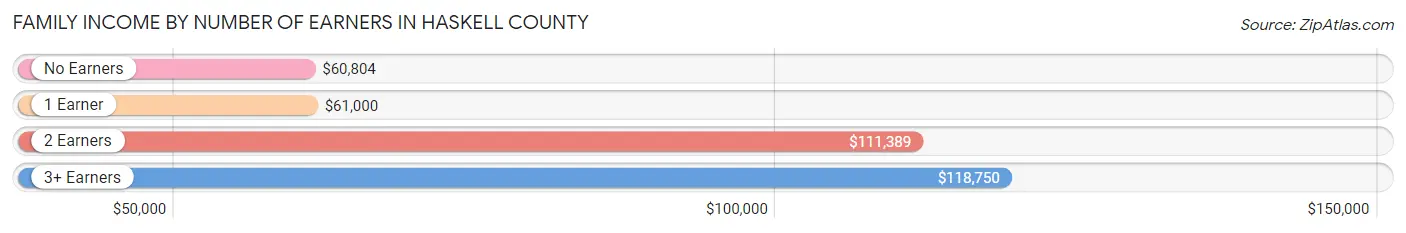
Family Income by Number of Earners in Haskell County
The median family income in Haskell County is $91,696, with families comprising 3+ earners (136) having the highest median family income of $118,750, while families with no earners (89) have the lowest median family income of $60,804, accounting for 14.5% and 9.5% of families, respectively.
| Number of Earners | # Families | Median Income |
| No Earners | 89 (9.5%) | $60,804 |
| 1 Earner | 334 (35.7%) | $61,000 |
| 2 Earners | 376 (40.2%) | $111,389 |
| 3+ Earners | 136 (14.5%) | $118,750 |
| Total | 935 (100.0%) | $91,696 |
Household Income in Haskell County
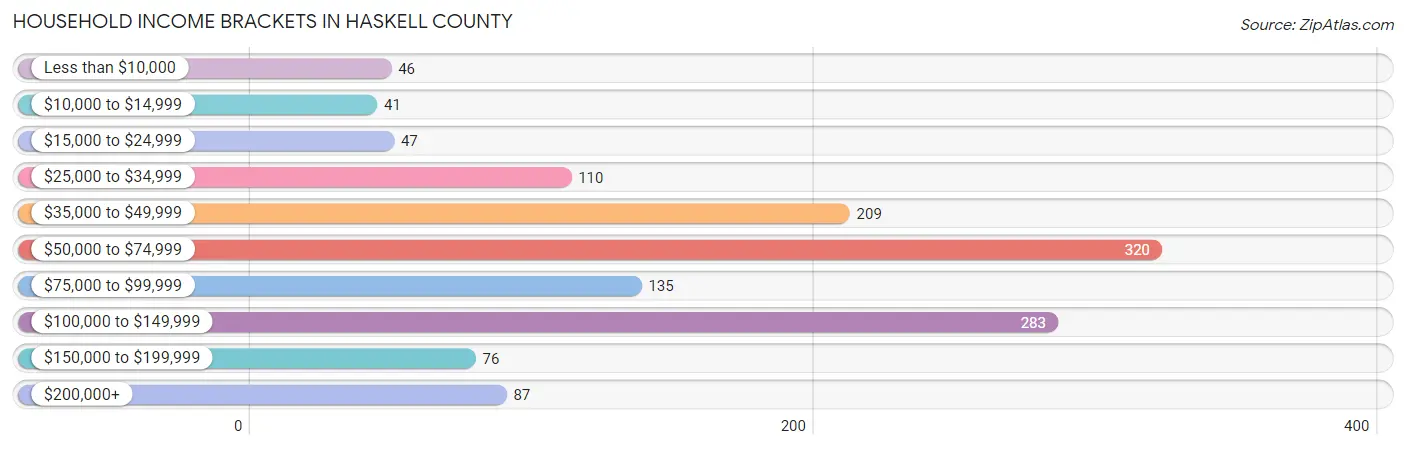
Household Income Brackets in Haskell County
With 320 households falling in the category, the $50,000 to $74,999 income range is the most frequent in Haskell County, accounting for 23.6% of all households. In contrast, only 41 households (3.0%) fall into the $10,000 to $14,999 income bracket, making it the least populous group.
| Income Bracket | # Households | % Households |
| Less than $10,000 | 46 | 3.4% |
| $10,000 to $14,999 | 41 | 3.0% |
| $15,000 to $24,999 | 47 | 3.5% |
| $25,000 to $34,999 | 110 | 8.1% |
| $35,000 to $49,999 | 209 | 15.4% |
| $50,000 to $74,999 | 320 | 23.6% |
| $75,000 to $99,999 | 135 | 10.0% |
| $100,000 to $149,999 | 283 | 20.9% |
| $150,000 to $199,999 | 76 | 5.6% |
| $200,000+ | 87 | 6.4% |
Household Income by Householder Age in Haskell County
The median household income in Haskell County is $66,458, with the highest median household income of $87,045 found in the 45 to 64 years age bracket for the primary householder. A total of 510 households (37.7%) fall into this category. Meanwhile, the 65+ years age bracket for the primary householder has the lowest median household income of $58,000, with 362 households (26.7%) in this group.
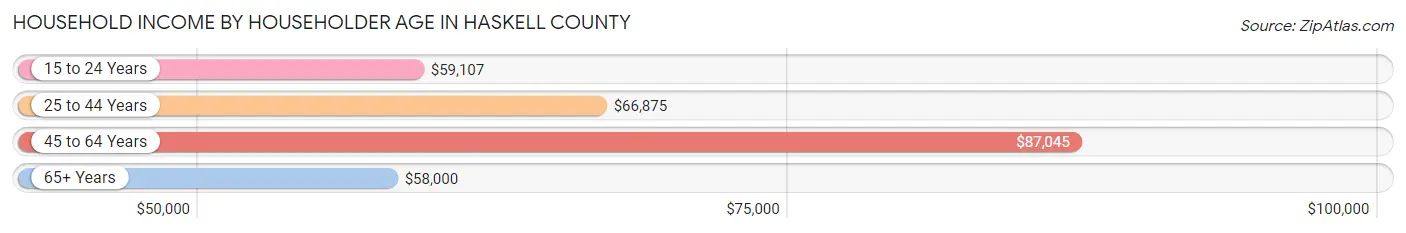
| Income Bracket | # Households | Median Income |
| 15 to 24 Years | 79 (5.8%) | $59,107 |
| 25 to 44 Years | 403 (29.8%) | $66,875 |
| 45 to 64 Years | 510 (37.7%) | $87,045 |
| 65+ Years | 362 (26.7%) | $58,000 |
| Total | 1,354 (100.0%) | $66,458 |
Poverty in Haskell County
Income Below Poverty by Sex and Age in Haskell County
With 8.8% poverty level for males and 9.2% for females among the residents of Haskell County, under 5 year old males and 18 to 24 year old females are the most vulnerable to poverty, with 29 males (32.2%) and 42 females (27.1%) in their respective age groups living below the poverty level.
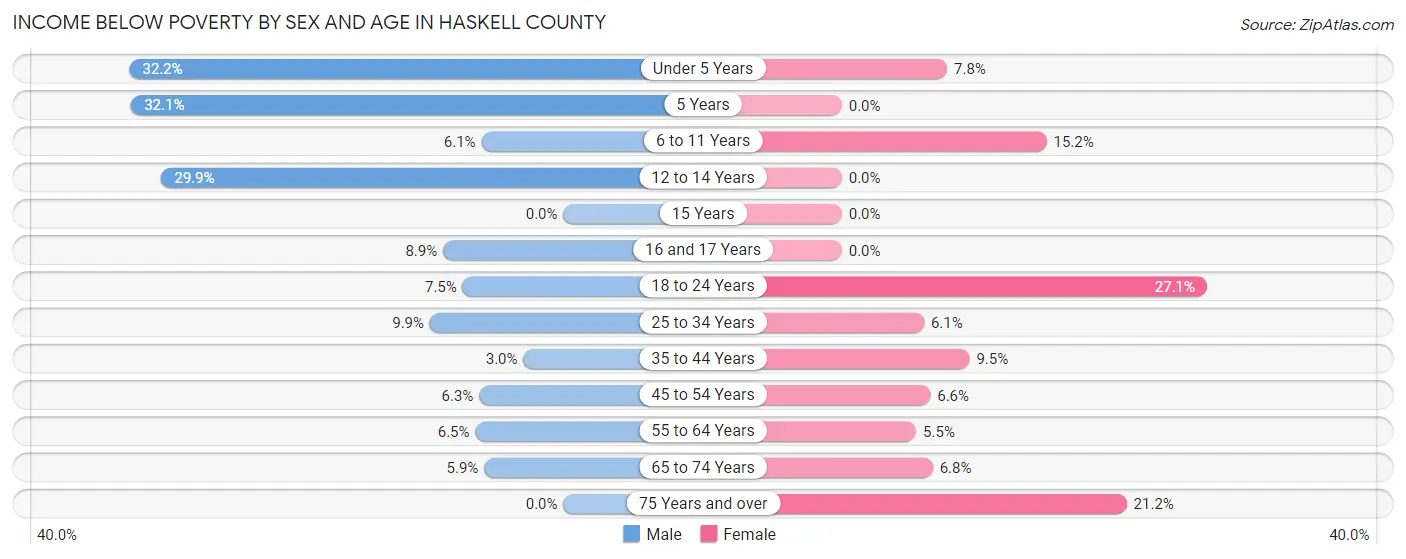
| Age Bracket | Male | Female |
| Under 5 Years | 29 (32.2%) | 14 (7.8%) |
| 5 Years | 17 (32.1%) | 0 (0.0%) |
| 6 to 11 Years | 9 (6.1%) | 19 (15.2%) |
| 12 to 14 Years | 20 (29.8%) | 0 (0.0%) |
| 15 Years | 0 (0.0%) | 0 (0.0%) |
| 16 and 17 Years | 5 (8.9%) | 0 (0.0%) |
| 18 to 24 Years | 11 (7.5%) | 42 (27.1%) |
| 25 to 34 Years | 22 (9.9%) | 13 (6.1%) |
| 35 to 44 Years | 8 (3.0%) | 22 (9.5%) |
| 45 to 54 Years | 13 (6.2%) | 13 (6.6%) |
| 55 to 64 Years | 13 (6.5%) | 17 (5.5%) |
| 65 to 74 Years | 12 (5.9%) | 11 (6.8%) |
| 75 Years and over | 0 (0.0%) | 22 (21.1%) |
| Total | 159 (8.8%) | 173 (9.2%) |
Income Above Poverty by Sex and Age in Haskell County
According to the poverty statistics in Haskell County, males aged 15 years and females aged 5 years are the age groups that are most secure financially, with 100.0% of males and 100.0% of females in these age groups living above the poverty line.
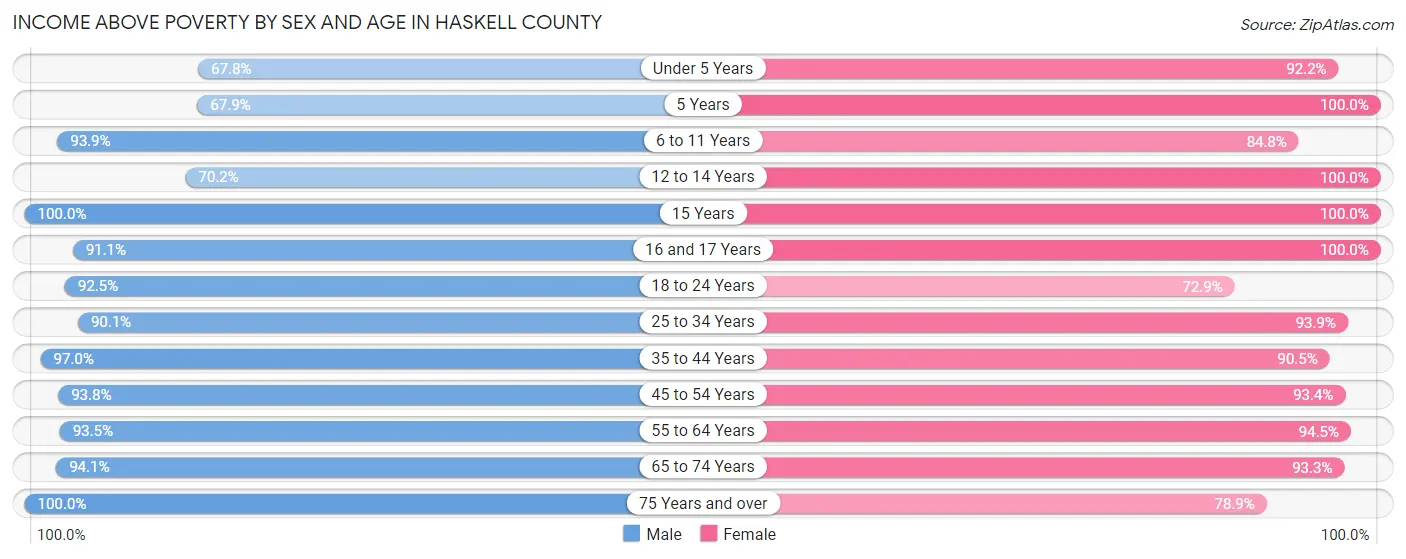
| Age Bracket | Male | Female |
| Under 5 Years | 61 (67.8%) | 165 (92.2%) |
| 5 Years | 36 (67.9%) | 7 (100.0%) |
| 6 to 11 Years | 139 (93.9%) | 106 (84.8%) |
| 12 to 14 Years | 47 (70.2%) | 103 (100.0%) |
| 15 Years | 72 (100.0%) | 54 (100.0%) |
| 16 and 17 Years | 51 (91.1%) | 46 (100.0%) |
| 18 to 24 Years | 136 (92.5%) | 113 (72.9%) |
| 25 to 34 Years | 200 (90.1%) | 200 (93.9%) |
| 35 to 44 Years | 261 (97.0%) | 210 (90.5%) |
| 45 to 54 Years | 195 (93.8%) | 185 (93.4%) |
| 55 to 64 Years | 186 (93.5%) | 291 (94.5%) |
| 65 to 74 Years | 192 (94.1%) | 152 (93.2%) |
| 75 Years and over | 61 (100.0%) | 82 (78.8%) |
| Total | 1,637 (91.1%) | 1,714 (90.8%) |
Income Below Poverty Among Married-Couple Families in Haskell County
The poverty statistics for married-couple families in Haskell County show that 2.9% or 24 of the total 842 families live below the poverty line. Families with 3 or 4 children have the highest poverty rate of 8.3%, comprising of 7 families. On the other hand, families with no children have the lowest poverty rate of 0.0%, which includes 0 families.
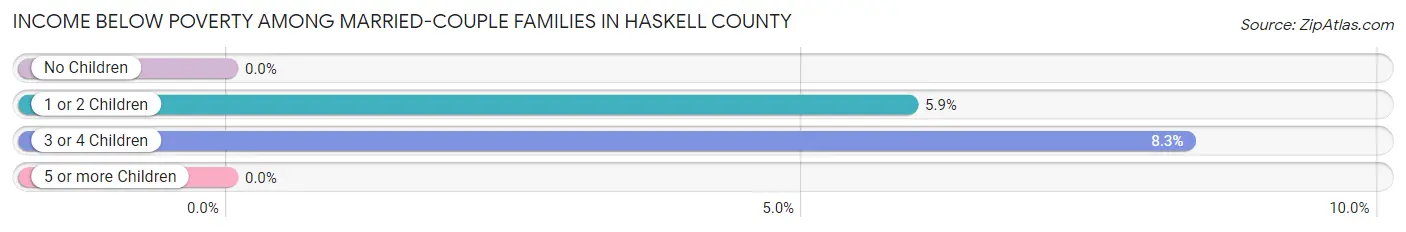
| Children | Above Poverty | Below Poverty |
| No Children | 465 (100.0%) | 0 (0.0%) |
| 1 or 2 Children | 270 (94.1%) | 17 (5.9%) |
| 3 or 4 Children | 77 (91.7%) | 7 (8.3%) |
| 5 or more Children | 6 (100.0%) | 0 (0.0%) |
| Total | 818 (97.2%) | 24 (2.9%) |
Income Below Poverty Among Single-Parent Households in Haskell County
According to the poverty data in Haskell County, 35.5% or 11 single-father households and 14.5% or 9 single-mother households are living below the poverty line. Among single-father households, those with 3 or 4 children have the highest poverty rate, with 11 households (100.0%) experiencing poverty. Likewise, among single-mother households, those with no children have the highest poverty rate, with 7 households (20.0%) falling below the poverty line.
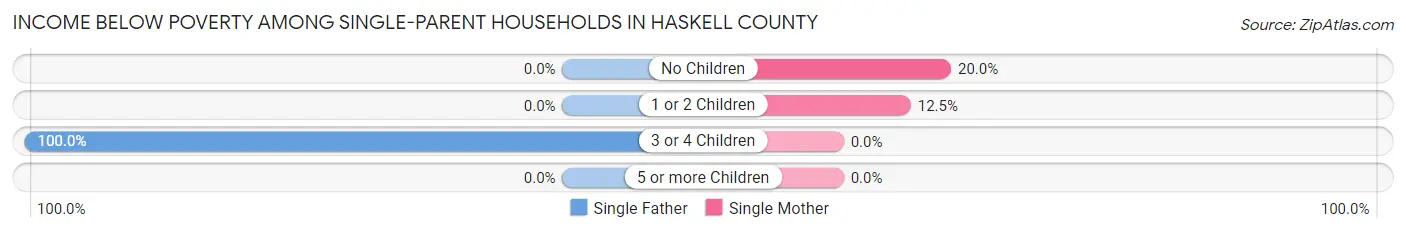
| Children | Single Father | Single Mother |
| No Children | 0 (0.0%) | 7 (20.0%) |
| 1 or 2 Children | 0 (0.0%) | 2 (12.5%) |
| 3 or 4 Children | 11 (100.0%) | 0 (0.0%) |
| 5 or more Children | 0 (0.0%) | 0 (0.0%) |
| Total | 11 (35.5%) | 9 (14.5%) |
Income Below Poverty Among Married-Couple vs Single-Parent Households in Haskell County
The poverty data for Haskell County shows that 24 of the married-couple family households (2.9%) and 20 of the single-parent households (21.5%) are living below the poverty level. Within the married-couple family households, those with 3 or 4 children have the highest poverty rate, with 7 households (8.3%) falling below the poverty line. Among the single-parent households, those with 3 or 4 children have the highest poverty rate, with 11 household (50.0%) living below poverty.
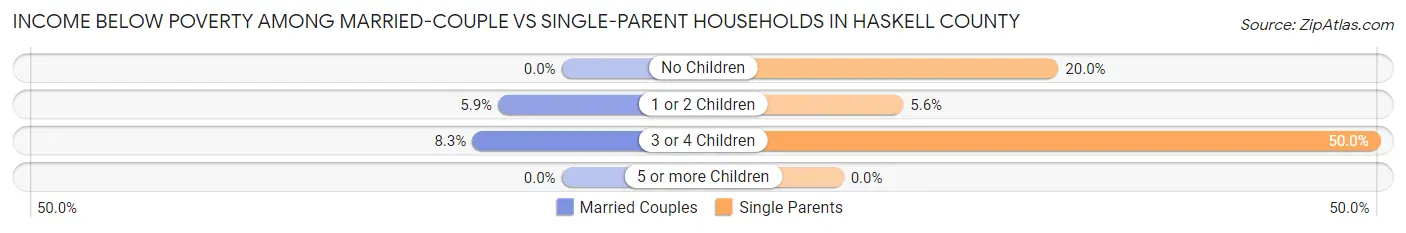
| Children | Married-Couple Families | Single-Parent Households |
| No Children | 0 (0.0%) | 7 (20.0%) |
| 1 or 2 Children | 17 (5.9%) | 2 (5.6%) |
| 3 or 4 Children | 7 (8.3%) | 11 (50.0%) |
| 5 or more Children | 0 (0.0%) | 0 (0.0%) |
| Total | 24 (2.9%) | 20 (21.5%) |
Race in Haskell County
The most populous races in Haskell County are White / Caucasian (2,831 | 75.8%), Hispanic or Latino (1,187 | 31.8%), and Some other Race (610 | 16.3%).
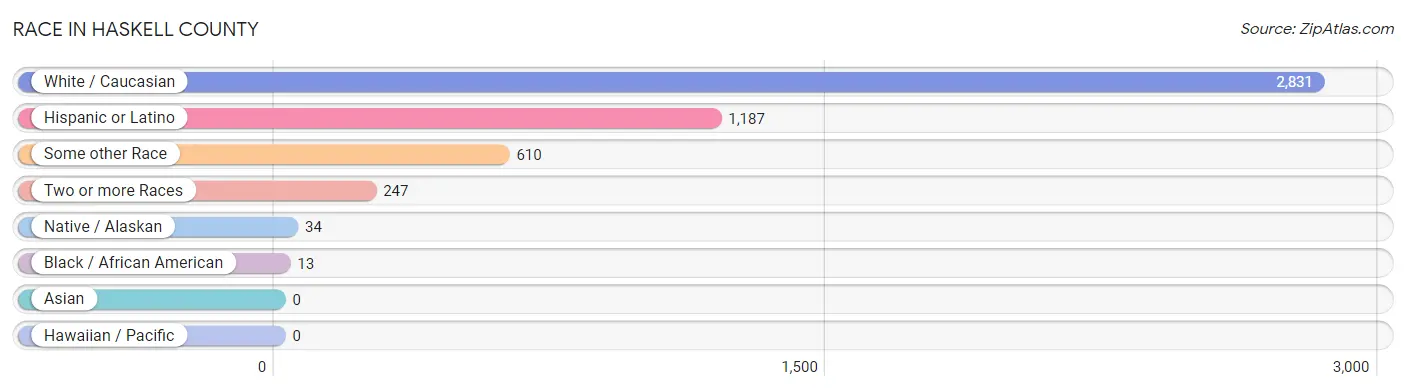
| Race | # Population | % Population |
| Asian | 0 | 0.0% |
| Black / African American | 13 | 0.4% |
| Hawaiian / Pacific | 0 | 0.0% |
| Hispanic or Latino | 1,187 | 31.8% |
| Native / Alaskan | 34 | 0.9% |
| White / Caucasian | 2,831 | 75.8% |
| Two or more Races | 247 | 6.6% |
| Some other Race | 610 | 16.3% |
| Total | 3,735 | 100.0% |
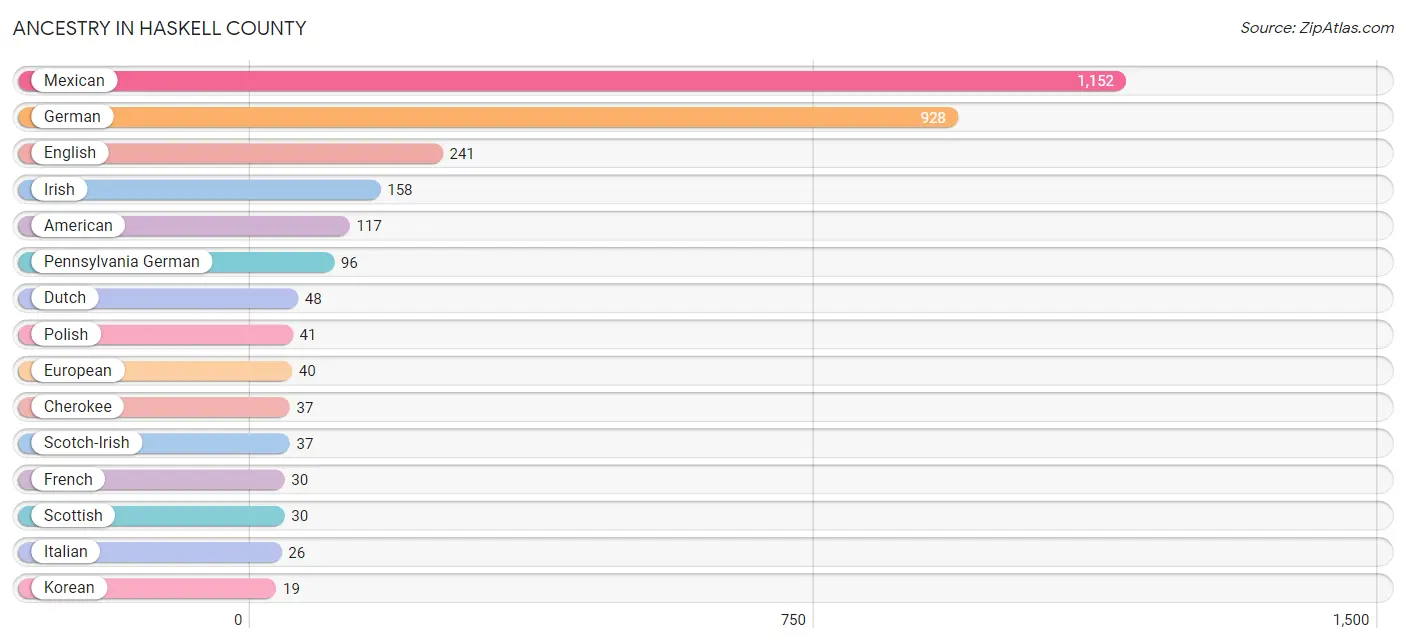
Ancestry in Haskell County
The most populous ancestries reported in Haskell County are Mexican (1,152 | 30.8%), German (928 | 24.8%), English (241 | 6.5%), Irish (158 | 4.2%), and American (117 | 3.1%), together accounting for 69.5% of all Haskell County residents.
| Ancestry | # Population | % Population |
| American | 117 | 3.1% |
| Arab | 9 | 0.2% |
| Austrian | 11 | 0.3% |
| British | 15 | 0.4% |
| Central American | 6 | 0.2% |
| Cherokee | 37 | 1.0% |
| Cheyenne | 7 | 0.2% |
| Choctaw | 11 | 0.3% |
| Creek | 3 | 0.1% |
| Czech | 7 | 0.2% |
| Danish | 10 | 0.3% |
| Dutch | 48 | 1.3% |
| English | 241 | 6.5% |
| European | 40 | 1.1% |
| French | 30 | 0.8% |
| French Canadian | 14 | 0.4% |
| German | 928 | 24.8% |
| Greek | 7 | 0.2% |
| Honduran | 6 | 0.2% |
| Irish | 158 | 4.2% |
| Italian | 26 | 0.7% |
| Korean | 19 | 0.5% |
| Lebanese | 9 | 0.2% |
| Mexican | 1,152 | 30.8% |
| Navajo | 8 | 0.2% |
| Norwegian | 8 | 0.2% |
| Paraguayan | 7 | 0.2% |
| Pennsylvania German | 96 | 2.6% |
| Polish | 41 | 1.1% |
| Portuguese | 3 | 0.1% |
| Russian | 1 | 0.0% |
| Scotch-Irish | 37 | 1.0% |
| Scottish | 30 | 0.8% |
| Sioux | 8 | 0.2% |
| South American | 7 | 0.2% |
| Swedish | 18 | 0.5% |
| Swiss | 2 | 0.1% |
| Welsh | 7 | 0.2% | View All 38 Rows |
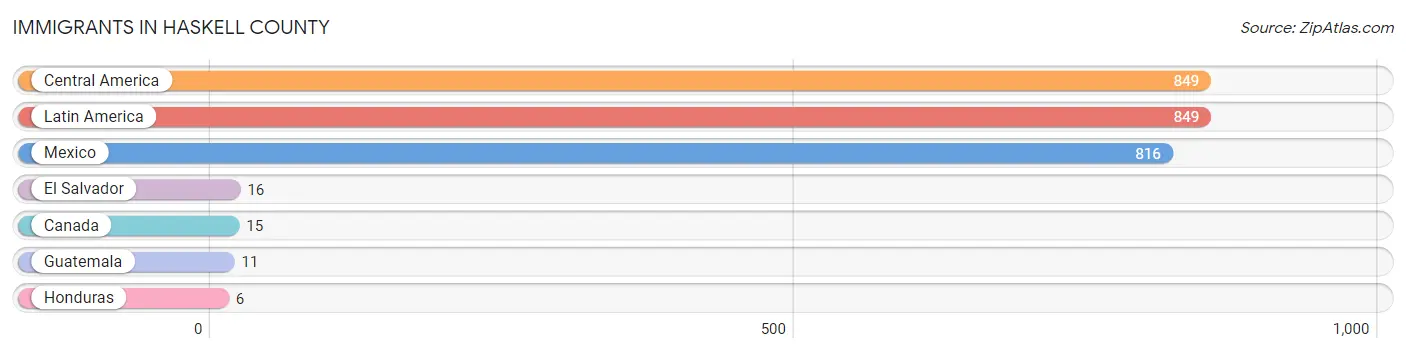
Immigrants in Haskell County
The most numerous immigrant groups reported in Haskell County came from Central America (849 | 22.7%), Latin America (849 | 22.7%), Mexico (816 | 21.8%), El Salvador (16 | 0.4%), and Canada (15 | 0.4%), together accounting for 68.1% of all Haskell County residents.
| Immigration Origin | # Population | % Population |
| Canada | 15 | 0.4% |
| Central America | 849 | 22.7% |
| El Salvador | 16 | 0.4% |
| Guatemala | 11 | 0.3% |
| Honduras | 6 | 0.2% |
| Latin America | 849 | 22.7% |
| Mexico | 816 | 21.8% | View All 7 Rows |
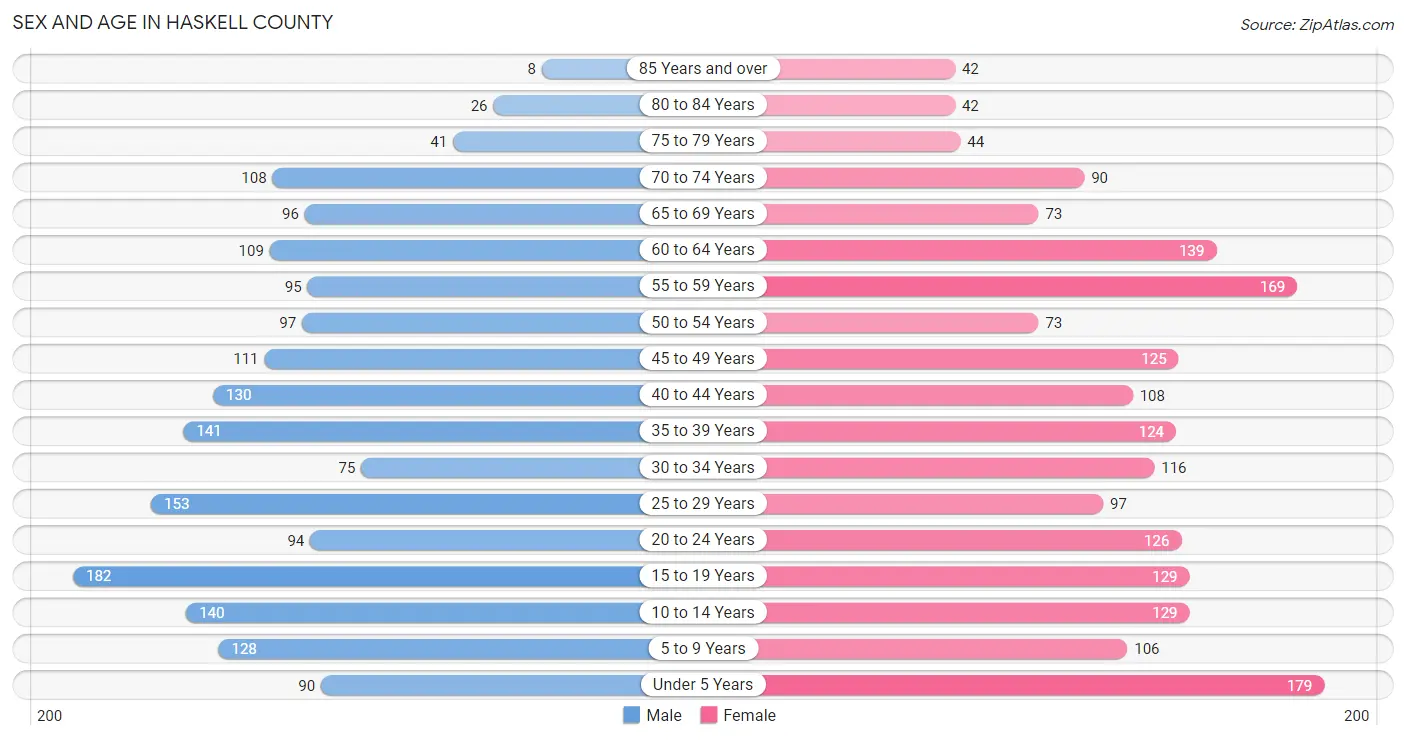
Sex and Age in Haskell County
Sex and Age in Haskell County
The most populous age groups in Haskell County are 15 to 19 Years (182 | 10.0%) for men and Under 5 Years (179 | 9.4%) for women.
| Age Bracket | Male | Female |
| Under 5 Years | 90 (4.9%) | 179 (9.4%) |
| 5 to 9 Years | 128 (7.0%) | 106 (5.6%) |
| 10 to 14 Years | 140 (7.7%) | 129 (6.8%) |
| 15 to 19 Years | 182 (10.0%) | 129 (6.8%) |
| 20 to 24 Years | 94 (5.1%) | 126 (6.6%) |
| 25 to 29 Years | 153 (8.4%) | 97 (5.1%) |
| 30 to 34 Years | 75 (4.1%) | 116 (6.1%) |
| 35 to 39 Years | 141 (7.7%) | 124 (6.5%) |
| 40 to 44 Years | 130 (7.1%) | 108 (5.7%) |
| 45 to 49 Years | 111 (6.1%) | 125 (6.5%) |
| 50 to 54 Years | 97 (5.3%) | 73 (3.8%) |
| 55 to 59 Years | 95 (5.2%) | 169 (8.8%) |
| 60 to 64 Years | 109 (6.0%) | 139 (7.3%) |
| 65 to 69 Years | 96 (5.3%) | 73 (3.8%) |
| 70 to 74 Years | 108 (5.9%) | 90 (4.7%) |
| 75 to 79 Years | 41 (2.2%) | 44 (2.3%) |
| 80 to 84 Years | 26 (1.4%) | 42 (2.2%) |
| 85 Years and over | 8 (0.4%) | 42 (2.2%) |
| Total | 1,824 (100.0%) | 1,911 (100.0%) |
Families and Households in Haskell County
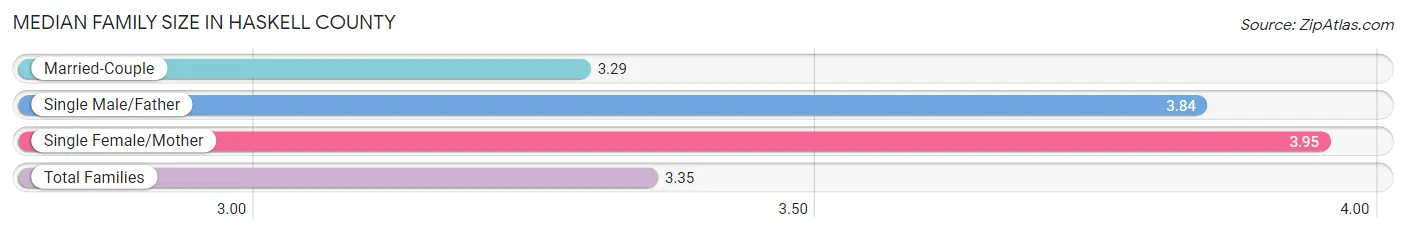
Median Family Size in Haskell County
The median family size in Haskell County is 3.35 persons per family, with single female/mother families (62 | 6.6%) accounting for the largest median family size of 3.95 persons per family. On the other hand, married-couple families (842 | 90.0%) represent the smallest median family size with 3.29 persons per family.
| Family Type | # Families | Family Size |
| Married-Couple | 842 (90.0%) | 3.29 |
| Single Male/Father | 31 (3.3%) | 3.84 |
| Single Female/Mother | 62 (6.6%) | 3.95 |
| Total Families | 935 (100.0%) | 3.35 |
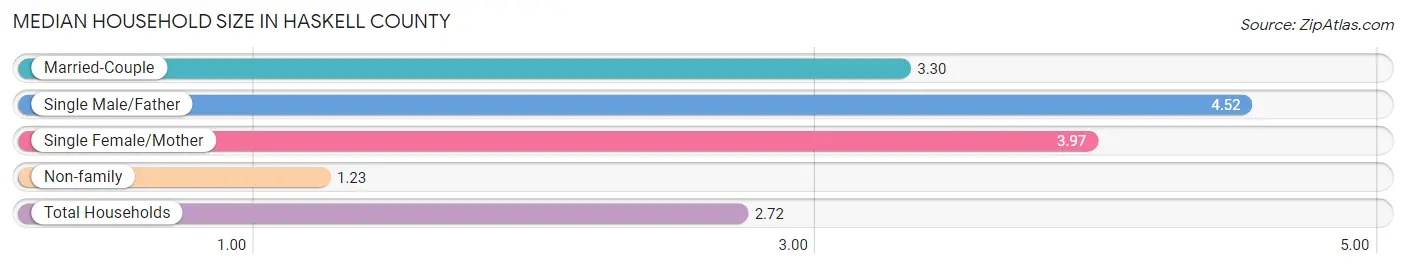
Median Household Size in Haskell County
The median household size in Haskell County is 2.72 persons per household, with single male/father households (31 | 2.3%) accounting for the largest median household size of 4.52 persons per household. non-family households (419 | 30.9%) represent the smallest median household size with 1.23 persons per household.
| Household Type | # Households | Household Size |
| Married-Couple | 842 (62.2%) | 3.30 |
| Single Male/Father | 31 (2.3%) | 4.52 |
| Single Female/Mother | 62 (4.6%) | 3.97 |
| Non-family | 419 (30.9%) | 1.23 |
| Total Households | 1,354 (100.0%) | 2.72 |
Household Size by Marriage Status in Haskell County
Out of a total of 1,354 households in Haskell County, 935 (69.1%) are family households, while 419 (30.9%) are nonfamily households. The most numerous type of family households are 2-person households, comprising 377, and the most common type of nonfamily households are 1-person households, comprising 335.
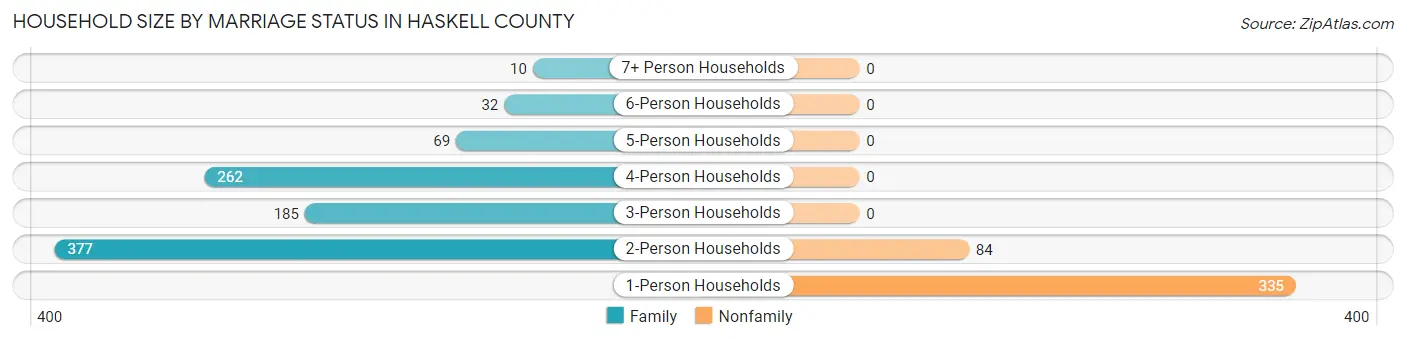
| Household Size | Family Households | Nonfamily Households |
| 1-Person Households | - | 335 (24.7%) |
| 2-Person Households | 377 (27.8%) | 84 (6.2%) |
| 3-Person Households | 185 (13.7%) | 0 (0.0%) |
| 4-Person Households | 262 (19.4%) | 0 (0.0%) |
| 5-Person Households | 69 (5.1%) | 0 (0.0%) |
| 6-Person Households | 32 (2.4%) | 0 (0.0%) |
| 7+ Person Households | 10 (0.7%) | 0 (0.0%) |
| Total | 935 (69.1%) | 419 (30.9%) |
Female Fertility in Haskell County
Fertility by Age in Haskell County
Average fertility rate in Haskell County is 120.0 births per 1,000 women. Women in the age bracket of 20 to 34 years have the highest fertility rate with 221.0 births per 1,000 women. Women in the age bracket of 20 to 34 years acount for 73.5% of all women with births.
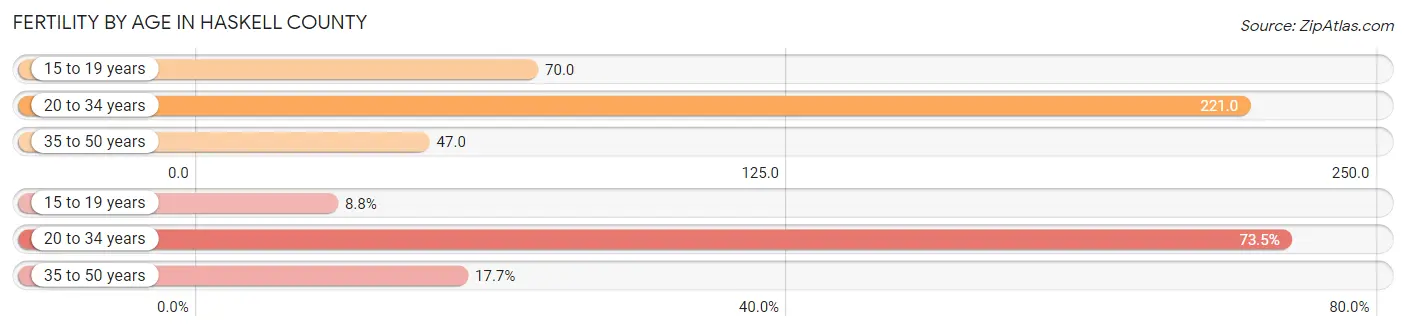
| Age Bracket | Women with Births | Births / 1,000 Women |
| 15 to 19 years | 9 (8.8%) | 70.0 |
| 20 to 34 years | 75 (73.5%) | 221.0 |
| 35 to 50 years | 18 (17.6%) | 47.0 |
| Total | 102 (100.0%) | 120.0 |
Fertility by Age by Marriage Status in Haskell County
91.2% of women with births (102) in Haskell County are married. The highest percentage of unmarried women with births falls into 15 to 19 years age bracket with 100.0% of them unmarried at the time of birth, while the lowest percentage of unmarried women with births belong to 20 to 34 years age bracket with 0.0% of them unmarried.
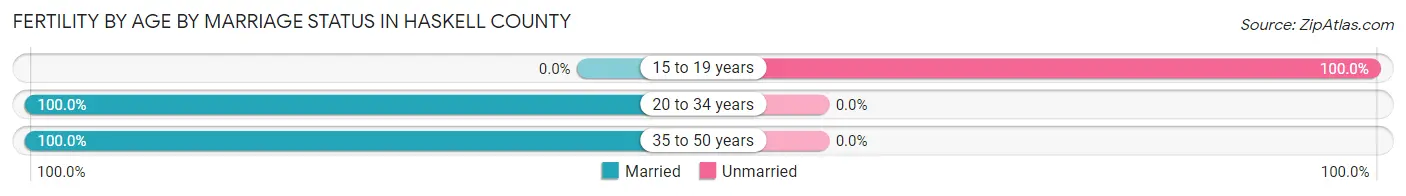
| Age Bracket | Married | Unmarried |
| 15 to 19 years | 0 (0.0%) | 9 (100.0%) |
| 20 to 34 years | 75 (100.0%) | 0 (0.0%) |
| 35 to 50 years | 18 (100.0%) | 0 (0.0%) |
| Total | 93 (91.2%) | 9 (8.8%) |
Fertility by Education in Haskell County
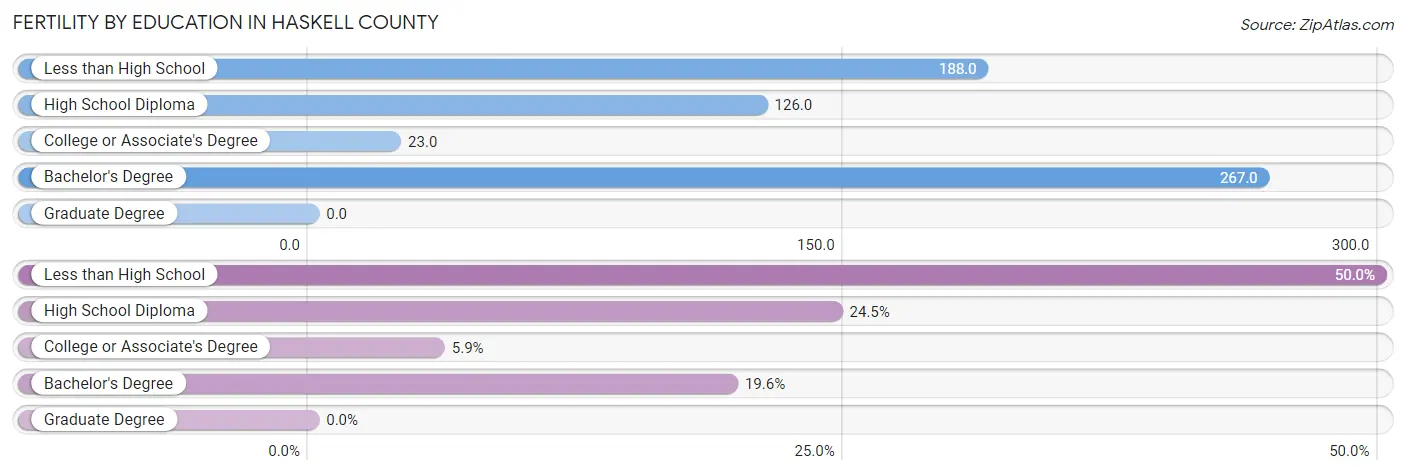
| Educational Attainment | Women with Births | Births / 1,000 Women |
| Less than High School | 51 (50.0%) | 188.0 |
| High School Diploma | 25 (24.5%) | 126.0 |
| College or Associate's Degree | 6 (5.9%) | 23.0 |
| Bachelor's Degree | 20 (19.6%) | 267.0 |
| Graduate Degree | 0 (0.0%) | 0.0 |
| Total | 102 (100.0%) | 120.0 |
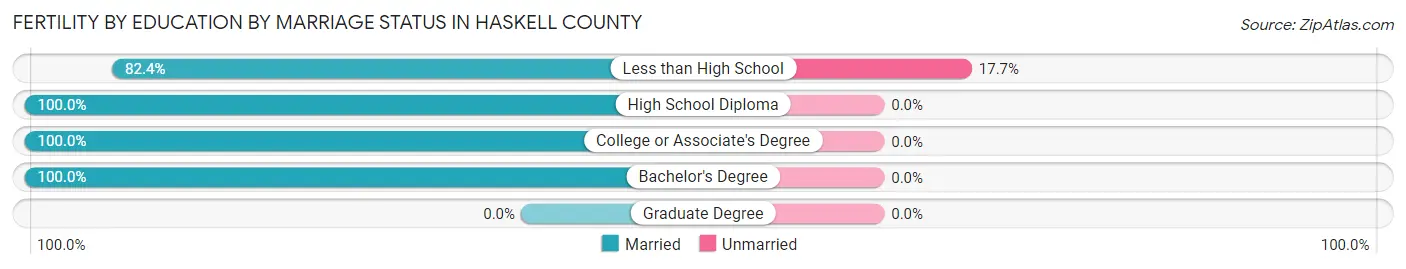
Fertility by Education by Marriage Status in Haskell County
8.8% of women with births in Haskell County are unmarried. Women with the educational attainment of high school diploma are most likely to be married with 100.0% of them married at childbirth, while women with the educational attainment of less than high school are least likely to be married with 17.6% of them unmarried at childbirth.
| Educational Attainment | Married | Unmarried |
| Less than High School | 42 (82.4%) | 9 (17.6%) |
| High School Diploma | 25 (100.0%) | 0 (0.0%) |
| College or Associate's Degree | 6 (100.0%) | 0 (0.0%) |
| Bachelor's Degree | 20 (100.0%) | 0 (0.0%) |
| Graduate Degree | 0 (0.0%) | 0 (0.0%) |
| Total | 93 (91.2%) | 9 (8.8%) |
Employment Characteristics in Haskell County
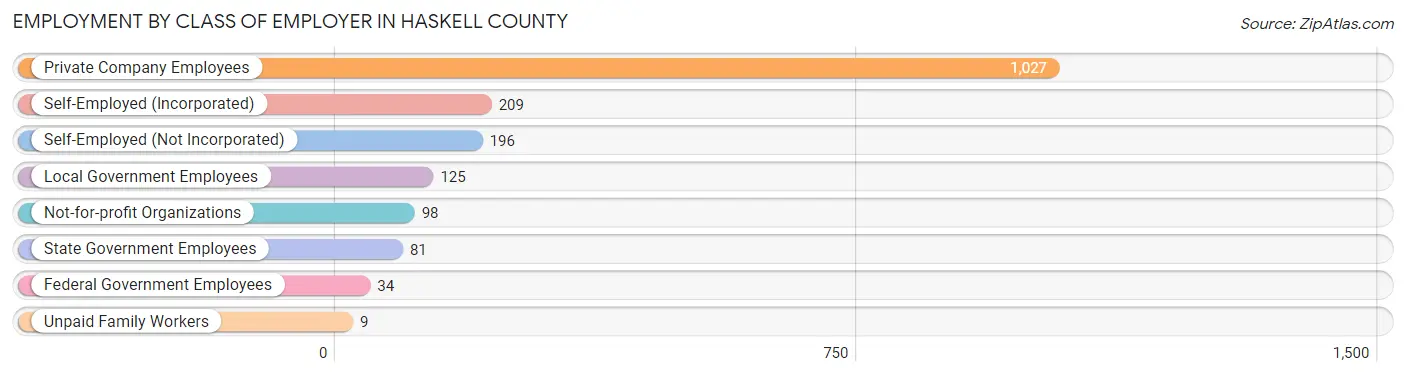
Employment by Class of Employer in Haskell County
Among the 1,779 employed individuals in Haskell County, private company employees (1,027 | 57.7%), self-employed (incorporated) (209 | 11.7%), and self-employed (not incorporated) (196 | 11.0%) make up the most common classes of employment.
| Employer Class | # Employees | % Employees |
| Private Company Employees | 1,027 | 57.7% |
| Self-Employed (Incorporated) | 209 | 11.7% |
| Self-Employed (Not Incorporated) | 196 | 11.0% |
| Not-for-profit Organizations | 98 | 5.5% |
| Local Government Employees | 125 | 7.0% |
| State Government Employees | 81 | 4.5% |
| Federal Government Employees | 34 | 1.9% |
| Unpaid Family Workers | 9 | 0.5% |
| Total | 1,779 | 100.0% |
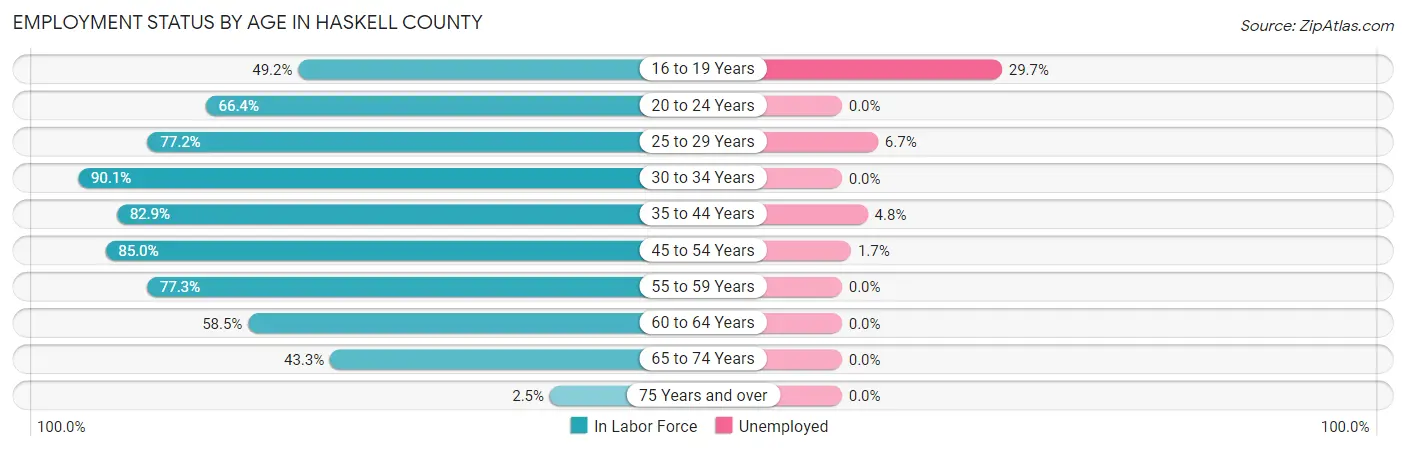
Employment Status by Age in Haskell County
According to the labor force statistics for Haskell County, out of the total population over 16 years of age (2,837), 66.2% or 1,878 individuals are in the labor force, with 3.5% or 66 of them unemployed. The age group with the highest labor force participation rate is 30 to 34 years, with 90.1% or 172 individuals in the labor force. Within the labor force, the 16 to 19 years age range has the highest percentage of unemployed individuals, with 29.7% or 27 of them being unemployed.
| Age Bracket | In Labor Force | Unemployed |
| 16 to 19 Years | 91 (49.2%) | 27 (29.7%) |
| 20 to 24 Years | 146 (66.4%) | 0 (0.0%) |
| 25 to 29 Years | 193 (77.2%) | 13 (6.7%) |
| 30 to 34 Years | 172 (90.1%) | 0 (0.0%) |
| 35 to 44 Years | 417 (82.9%) | 20 (4.8%) |
| 45 to 54 Years | 345 (85.0%) | 6 (1.7%) |
| 55 to 59 Years | 204 (77.3%) | 0 (0.0%) |
| 60 to 64 Years | 145 (58.5%) | 0 (0.0%) |
| 65 to 74 Years | 159 (43.3%) | 0 (0.0%) |
| 75 Years and over | 5 (2.5%) | 0 (0.0%) |
| Total | 1,878 (66.2%) | 66 (3.5%) |
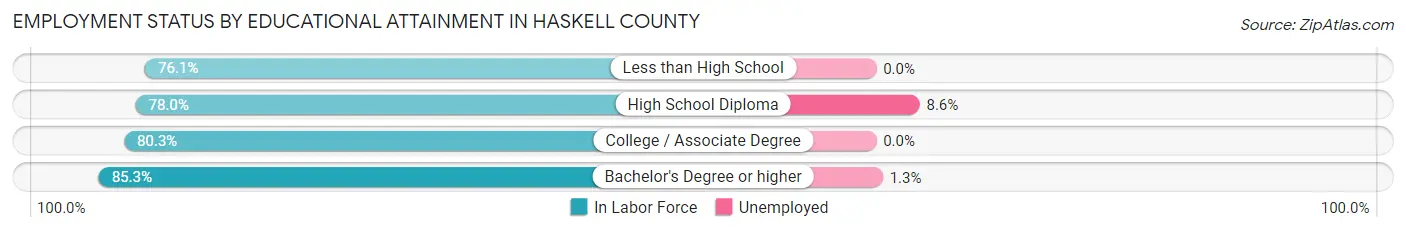
Employment Status by Educational Attainment in Haskell County
According to labor force statistics for Haskell County, 79.3% of individuals (1,477) out of the total population between 25 and 64 years of age (1,862) are in the labor force, with 2.6% or 38 of them being unemployed. The group with the highest labor force participation rate are those with the educational attainment of bachelor's degree or higher, with 85.3% or 233 individuals in the labor force. Within the labor force, individuals with high school diploma education have the highest percentage of unemployment, with 8.6% or 36 of them being unemployed.
| Educational Attainment | In Labor Force | Unemployed |
| Less than High School | 376 (76.1%) | 0 (0.0%) |
| High School Diploma | 419 (78.0%) | 46 (8.6%) |
| College / Associate Degree | 448 (80.3%) | 0 (0.0%) |
| Bachelor's Degree or higher | 233 (85.3%) | 4 (1.3%) |
| Total | 1,477 (79.3%) | 48 (2.6%) |
Employment Occupations by Sex in Haskell County
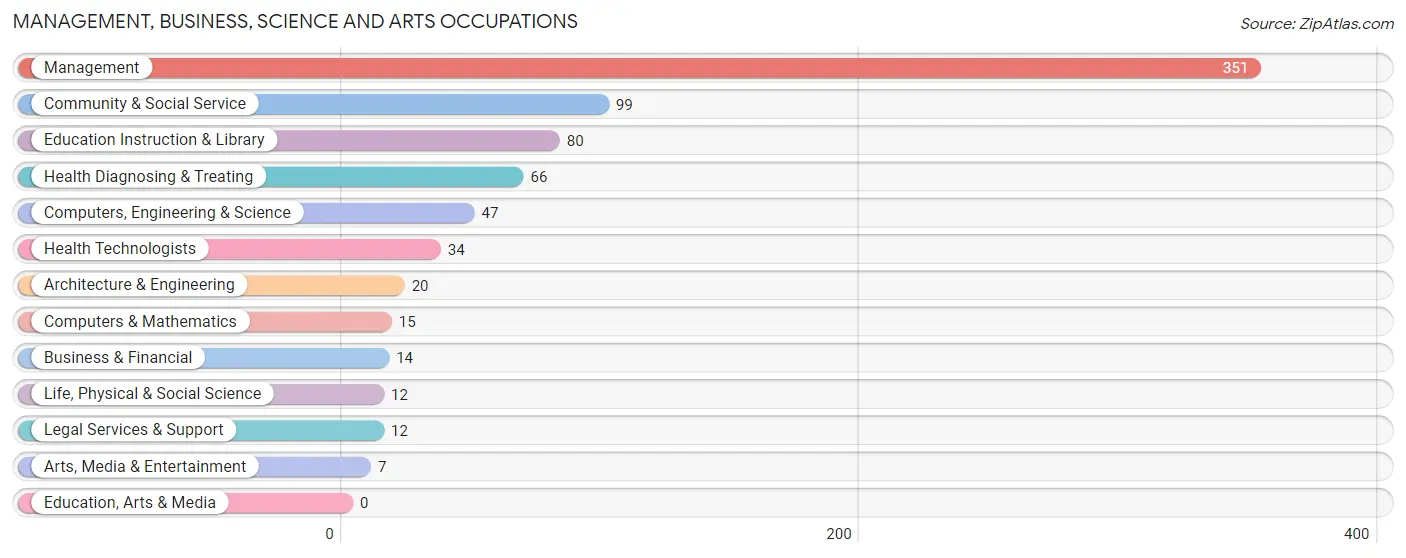
Management, Business, Science and Arts Occupations
The most common Management, Business, Science and Arts occupations in Haskell County are Management (351 | 19.4%), Community & Social Service (99 | 5.5%), Education Instruction & Library (80 | 4.4%), Health Diagnosing & Treating (66 | 3.6%), and Computers, Engineering & Science (47 | 2.6%).
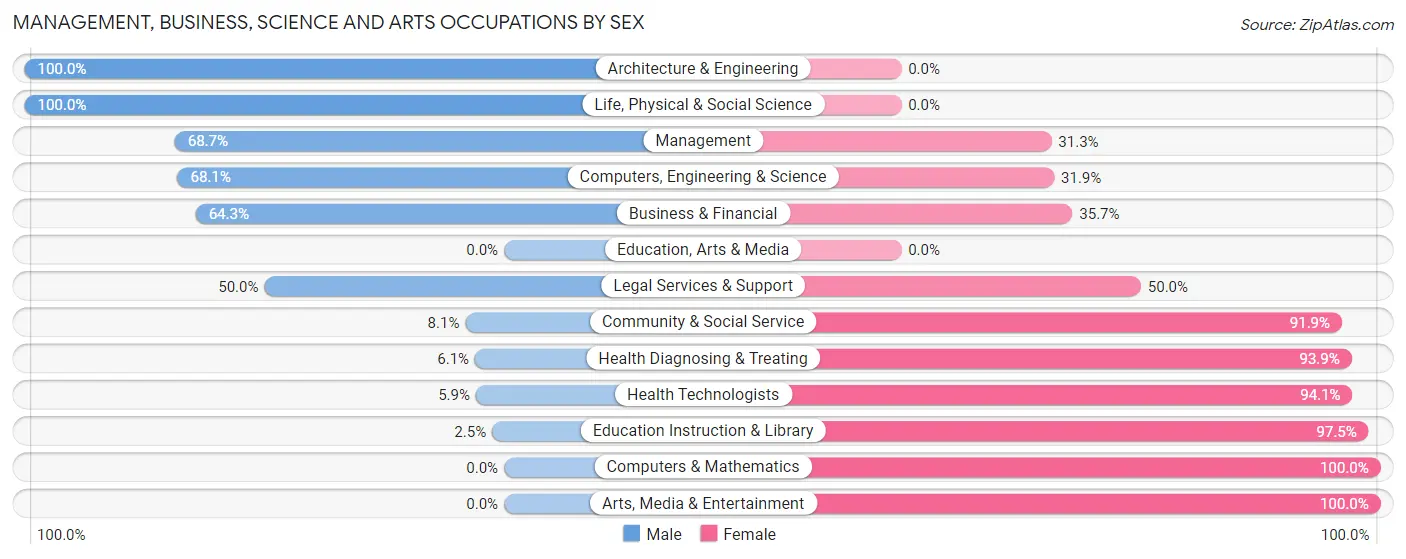
Management, Business, Science and Arts Occupations by Sex
Within the Management, Business, Science and Arts occupations in Haskell County, the most male-oriented occupations are Architecture & Engineering (100.0%), Life, Physical & Social Science (100.0%), and Management (68.7%), while the most female-oriented occupations are Computers & Mathematics (100.0%), Arts, Media & Entertainment (100.0%), and Education Instruction & Library (97.5%).
| Occupation | Male | Female |
| Management | 241 (68.7%) | 110 (31.3%) |
| Business & Financial | 9 (64.3%) | 5 (35.7%) |
| Computers, Engineering & Science | 32 (68.1%) | 15 (31.9%) |
| Computers & Mathematics | 0 (0.0%) | 15 (100.0%) |
| Architecture & Engineering | 20 (100.0%) | 0 (0.0%) |
| Life, Physical & Social Science | 12 (100.0%) | 0 (0.0%) |
| Community & Social Service | 8 (8.1%) | 91 (91.9%) |
| Education, Arts & Media | 0 (0.0%) | 0 (0.0%) |
| Legal Services & Support | 6 (50.0%) | 6 (50.0%) |
| Education Instruction & Library | 2 (2.5%) | 78 (97.5%) |
| Arts, Media & Entertainment | 0 (0.0%) | 7 (100.0%) |
| Health Diagnosing & Treating | 4 (6.1%) | 62 (93.9%) |
| Health Technologists | 2 (5.9%) | 32 (94.1%) |
| Total (Category) | 294 (50.9%) | 283 (49.0%) |
| Total (Overall) | 1,066 (58.9%) | 745 (41.1%) |
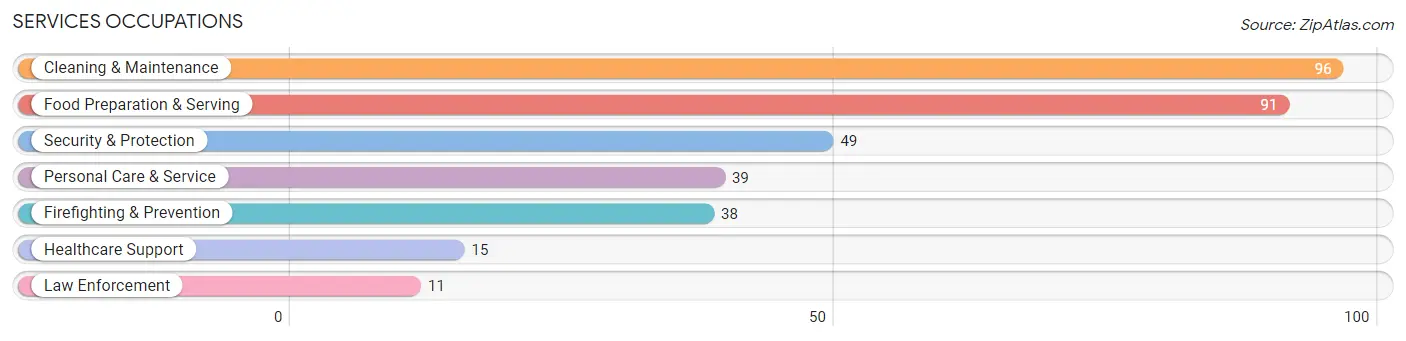
Services Occupations
The most common Services occupations in Haskell County are Cleaning & Maintenance (96 | 5.3%), Food Preparation & Serving (91 | 5.0%), Security & Protection (49 | 2.7%), Personal Care & Service (39 | 2.1%), and Firefighting & Prevention (38 | 2.1%).
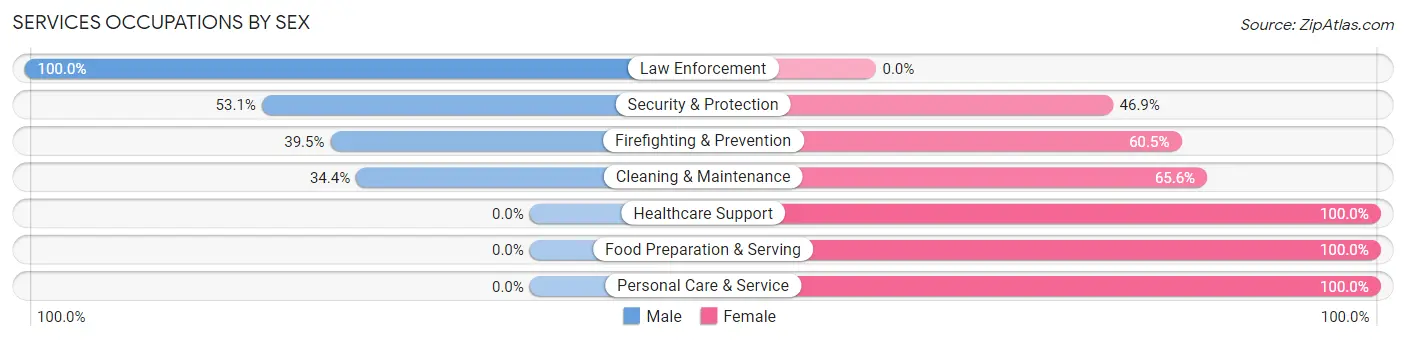
Services Occupations by Sex
Within the Services occupations in Haskell County, the most male-oriented occupations are Law Enforcement (100.0%), Security & Protection (53.1%), and Firefighting & Prevention (39.5%), while the most female-oriented occupations are Healthcare Support (100.0%), Food Preparation & Serving (100.0%), and Personal Care & Service (100.0%).
| Occupation | Male | Female |
| Healthcare Support | 0 (0.0%) | 15 (100.0%) |
| Security & Protection | 26 (53.1%) | 23 (46.9%) |
| Firefighting & Prevention | 15 (39.5%) | 23 (60.5%) |
| Law Enforcement | 11 (100.0%) | 0 (0.0%) |
| Food Preparation & Serving | 0 (0.0%) | 91 (100.0%) |
| Cleaning & Maintenance | 33 (34.4%) | 63 (65.6%) |
| Personal Care & Service | 0 (0.0%) | 39 (100.0%) |
| Total (Category) | 59 (20.3%) | 231 (79.7%) |
| Total (Overall) | 1,066 (58.9%) | 745 (41.1%) |
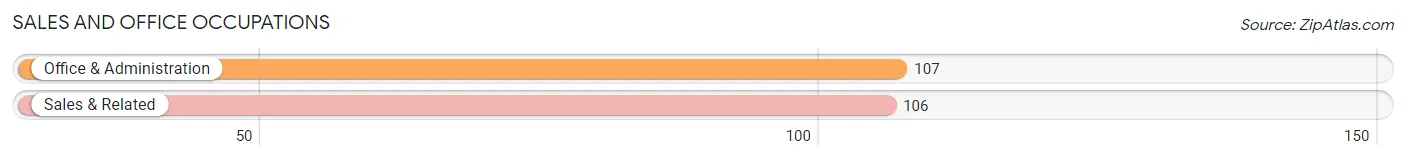
Sales and Office Occupations
The most common Sales and Office occupations in Haskell County are Office & Administration (107 | 5.9%), and Sales & Related (106 | 5.9%).
Sales and Office Occupations by Sex
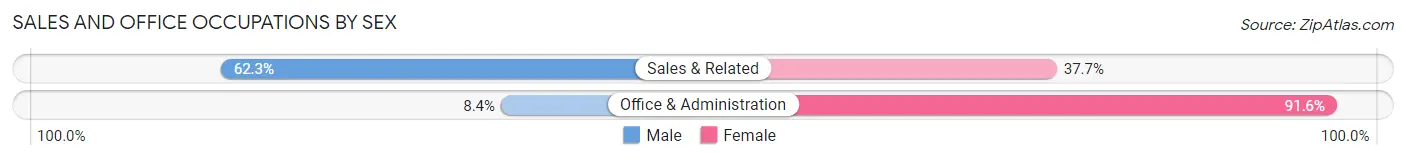
| Occupation | Male | Female |
| Sales & Related | 66 (62.3%) | 40 (37.7%) |
| Office & Administration | 9 (8.4%) | 98 (91.6%) |
| Total (Category) | 75 (35.2%) | 138 (64.8%) |
| Total (Overall) | 1,066 (58.9%) | 745 (41.1%) |
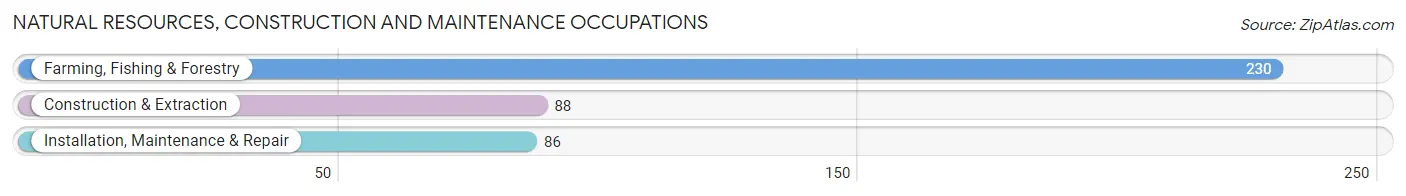
Natural Resources, Construction and Maintenance Occupations
The most common Natural Resources, Construction and Maintenance occupations in Haskell County are Farming, Fishing & Forestry (230 | 12.7%), Construction & Extraction (88 | 4.9%), and Installation, Maintenance & Repair (86 | 4.8%).
Natural Resources, Construction and Maintenance Occupations by Sex
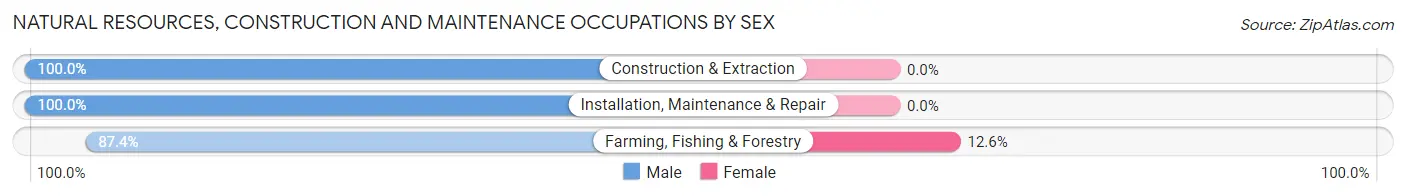
| Occupation | Male | Female |
| Farming, Fishing & Forestry | 201 (87.4%) | 29 (12.6%) |
| Construction & Extraction | 88 (100.0%) | 0 (0.0%) |
| Installation, Maintenance & Repair | 86 (100.0%) | 0 (0.0%) |
| Total (Category) | 375 (92.8%) | 29 (7.2%) |
| Total (Overall) | 1,066 (58.9%) | 745 (41.1%) |
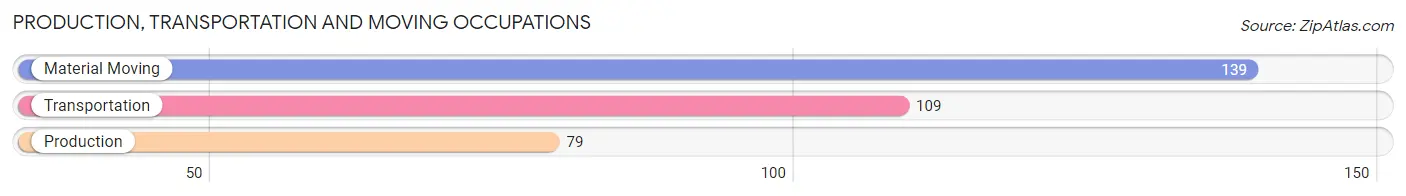
Production, Transportation and Moving Occupations
The most common Production, Transportation and Moving occupations in Haskell County are Material Moving (139 | 7.7%), Transportation (109 | 6.0%), and Production (79 | 4.4%).
Production, Transportation and Moving Occupations by Sex
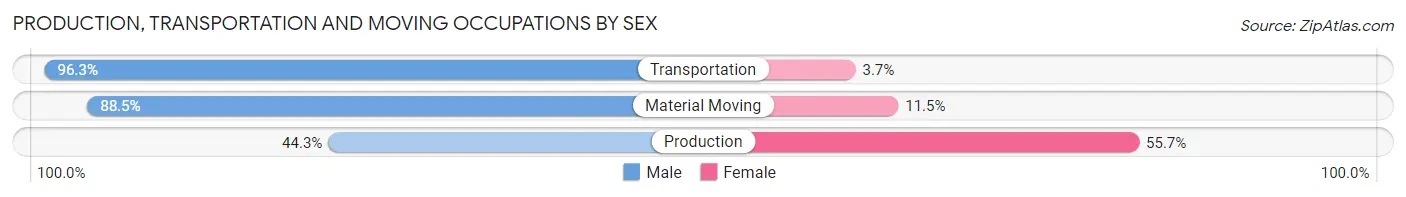
| Occupation | Male | Female |
| Production | 35 (44.3%) | 44 (55.7%) |
| Transportation | 105 (96.3%) | 4 (3.7%) |
| Material Moving | 123 (88.5%) | 16 (11.5%) |
| Total (Category) | 263 (80.4%) | 64 (19.6%) |
| Total (Overall) | 1,066 (58.9%) | 745 (41.1%) |
Employment Industries by Sex in Haskell County
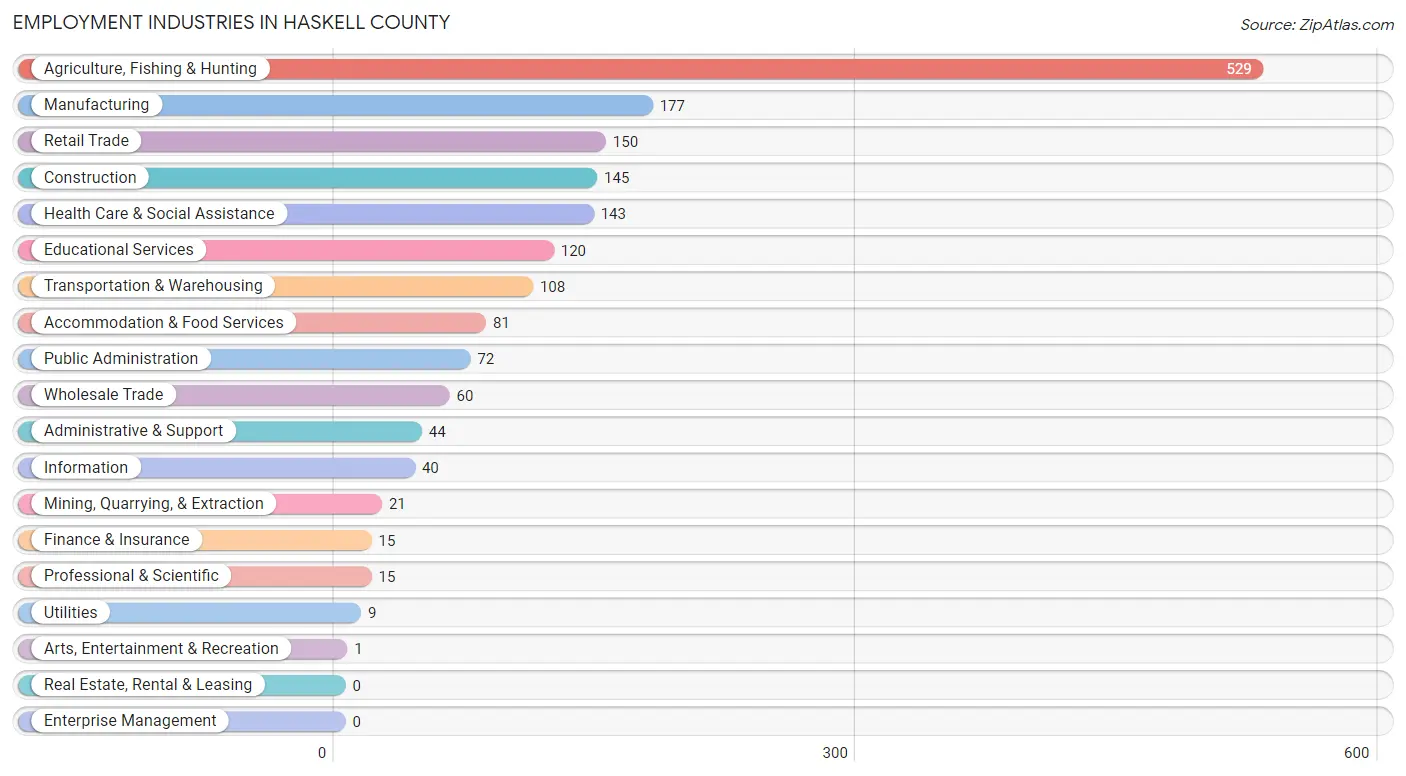
Employment Industries in Haskell County
The major employment industries in Haskell County include Agriculture, Fishing & Hunting (529 | 29.2%), Manufacturing (177 | 9.8%), Retail Trade (150 | 8.3%), Construction (145 | 8.0%), and Health Care & Social Assistance (143 | 7.9%).
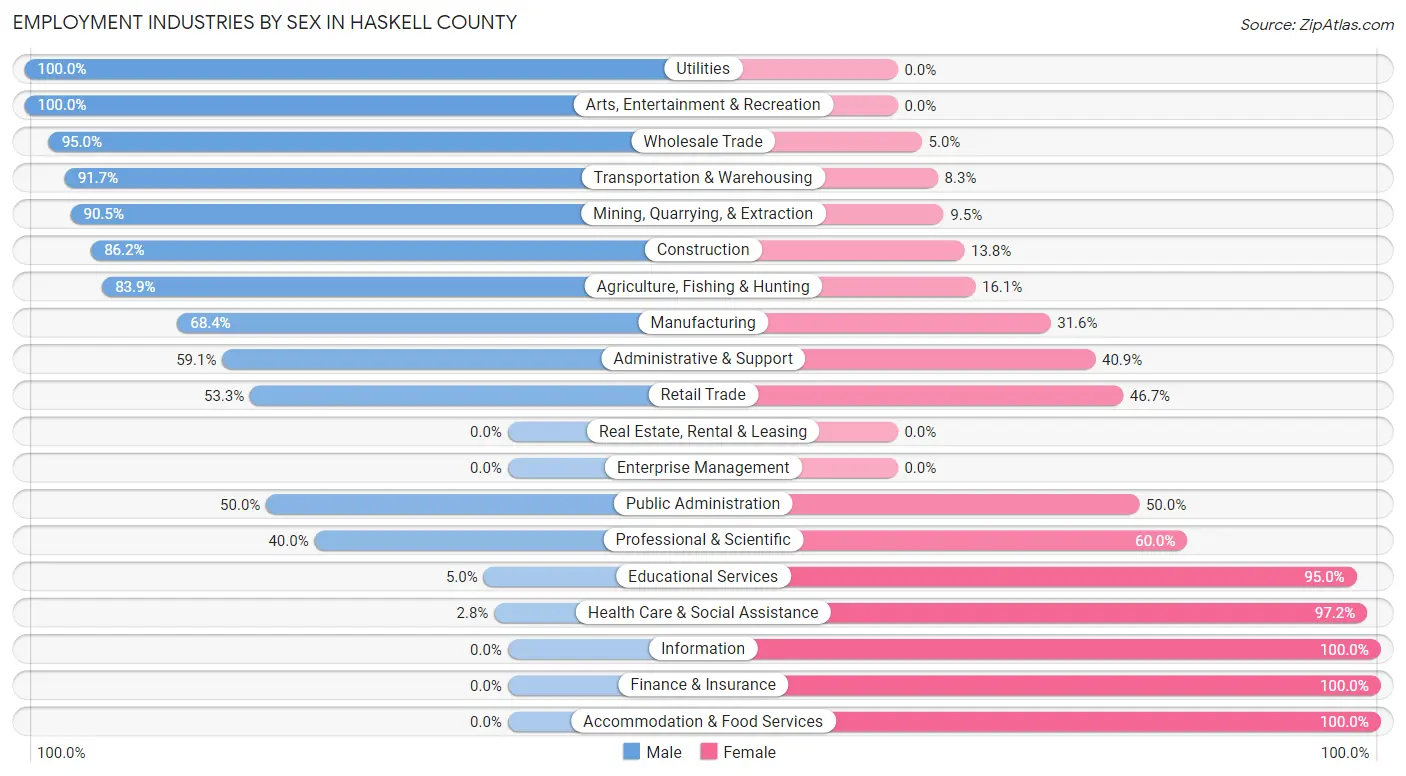
Employment Industries by Sex in Haskell County
The Haskell County industries that see more men than women are Utilities (100.0%), Arts, Entertainment & Recreation (100.0%), and Wholesale Trade (95.0%), whereas the industries that tend to have a higher number of women are Information (100.0%), Finance & Insurance (100.0%), and Accommodation & Food Services (100.0%).
| Industry | Male | Female |
| Agriculture, Fishing & Hunting | 444 (83.9%) | 85 (16.1%) |
| Mining, Quarrying, & Extraction | 19 (90.5%) | 2 (9.5%) |
| Construction | 125 (86.2%) | 20 (13.8%) |
| Manufacturing | 121 (68.4%) | 56 (31.6%) |
| Wholesale Trade | 57 (95.0%) | 3 (5.0%) |
| Retail Trade | 80 (53.3%) | 70 (46.7%) |
| Transportation & Warehousing | 99 (91.7%) | 9 (8.3%) |
| Utilities | 9 (100.0%) | 0 (0.0%) |
| Information | 0 (0.0%) | 40 (100.0%) |
| Finance & Insurance | 0 (0.0%) | 15 (100.0%) |
| Real Estate, Rental & Leasing | 0 (0.0%) | 0 (0.0%) |
| Professional & Scientific | 6 (40.0%) | 9 (60.0%) |
| Enterprise Management | 0 (0.0%) | 0 (0.0%) |
| Administrative & Support | 26 (59.1%) | 18 (40.9%) |
| Educational Services | 6 (5.0%) | 114 (95.0%) |
| Health Care & Social Assistance | 4 (2.8%) | 139 (97.2%) |
| Arts, Entertainment & Recreation | 1 (100.0%) | 0 (0.0%) |
| Accommodation & Food Services | 0 (0.0%) | 81 (100.0%) |
| Public Administration | 36 (50.0%) | 36 (50.0%) |
| Total | 1,066 (58.9%) | 745 (41.1%) |
Education in Haskell County
School Enrollment in Haskell County
The most common levels of schooling among the 793 students in Haskell County are high school (229 | 28.9%), middle school (214 | 27.0%), and elementary school (155 | 19.6%).
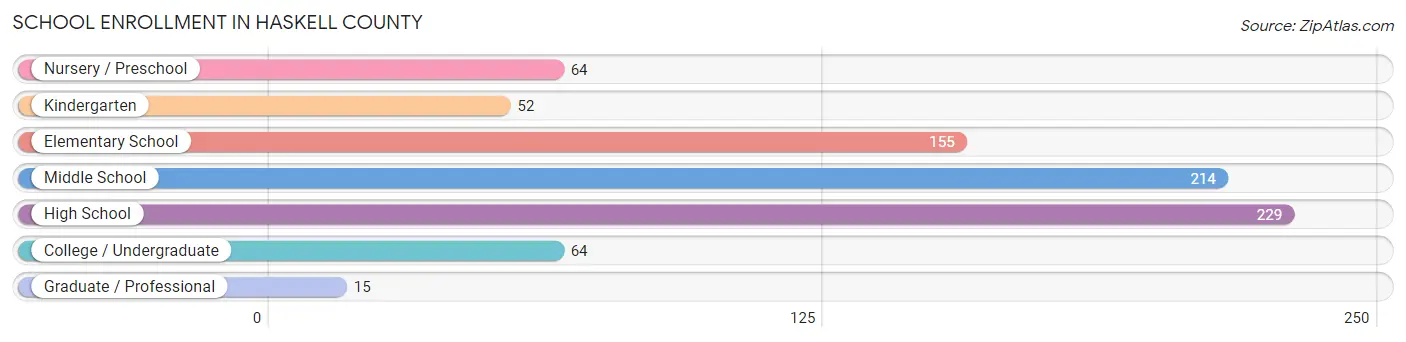
| School Level | # Students | % Students |
| Nursery / Preschool | 64 | 8.1% |
| Kindergarten | 52 | 6.6% |
| Elementary School | 155 | 19.6% |
| Middle School | 214 | 27.0% |
| High School | 229 | 28.9% |
| College / Undergraduate | 64 | 8.1% |
| Graduate / Professional | 15 | 1.9% |
| Total | 793 | 100.0% |
School Enrollment by Age by Funding Source in Haskell County
Out of a total of 793 students who are enrolled in schools in Haskell County, 115 (14.5%) attend a private institution, while the remaining 678 (85.5%) are enrolled in public schools. The age group of 35 years and over has the highest likelihood of being enrolled in private schools, with 9 (32.1% in the age bracket) enrolled. Conversely, the age group of 3 to 4 year olds has the lowest likelihood of being enrolled in a private school, with 25 (100.0% in the age bracket) attending a public institution.
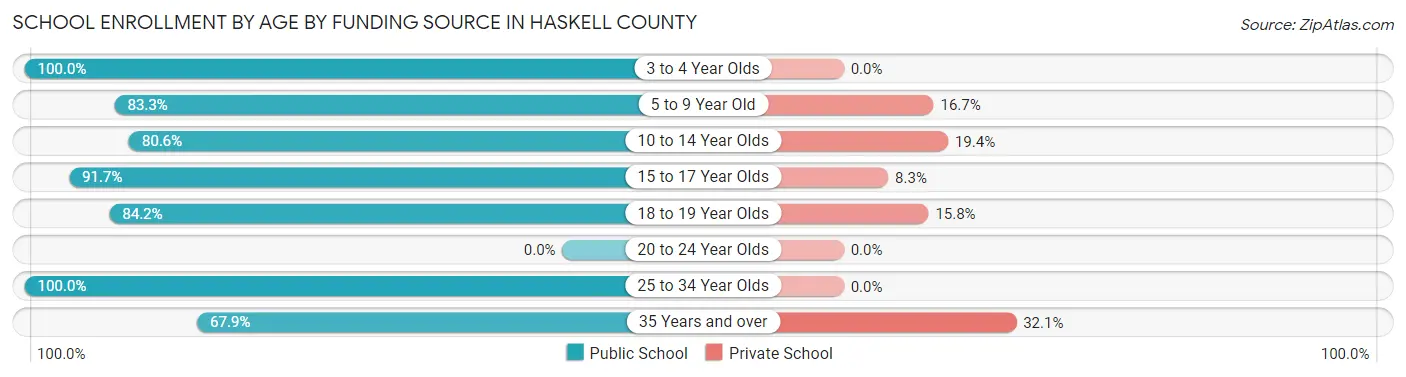
| Age Bracket | Public School | Private School |
| 3 to 4 Year Olds | 25 (100.0%) | 0 (0.0%) |
| 5 to 9 Year Old | 184 (83.3%) | 37 (16.7%) |
| 10 to 14 Year Olds | 199 (80.6%) | 48 (19.4%) |
| 15 to 17 Year Olds | 199 (91.7%) | 18 (8.3%) |
| 18 to 19 Year Olds | 16 (84.2%) | 3 (15.8%) |
| 20 to 24 Year Olds | 0 (0.0%) | 0 (0.0%) |
| 25 to 34 Year Olds | 36 (100.0%) | 0 (0.0%) |
| 35 Years and over | 19 (67.9%) | 9 (32.1%) |
| Total | 678 (85.5%) | 115 (14.5%) |
Educational Attainment by Field of Study in Haskell County
Education (124 | 31.6%), business (56 | 14.2%), bio, nature & agricultural (43 | 10.9%), arts & humanities (38 | 9.7%), and science & technology (29 | 7.4%) are the most common fields of study among 393 individuals in Haskell County who have obtained a bachelor's degree or higher.
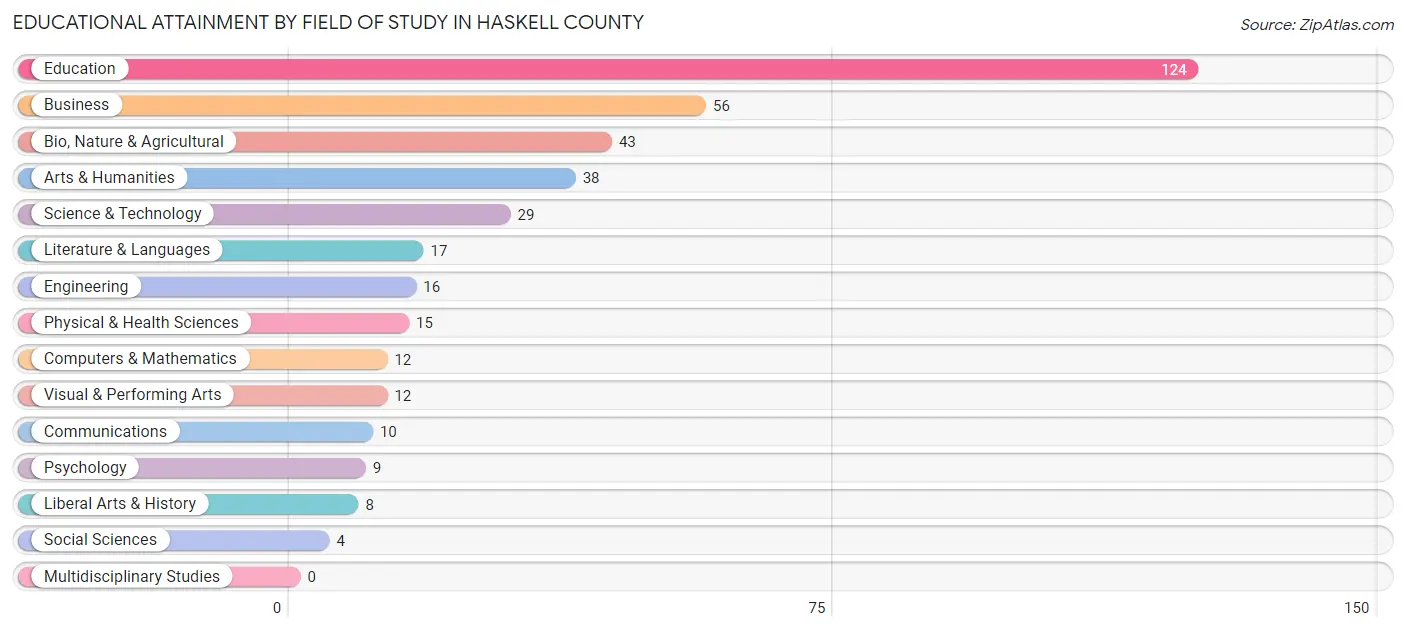
| Field of Study | # Graduates | % Graduates |
| Computers & Mathematics | 12 | 3.0% |
| Bio, Nature & Agricultural | 43 | 10.9% |
| Physical & Health Sciences | 15 | 3.8% |
| Psychology | 9 | 2.3% |
| Social Sciences | 4 | 1.0% |
| Engineering | 16 | 4.1% |
| Multidisciplinary Studies | 0 | 0.0% |
| Science & Technology | 29 | 7.4% |
| Business | 56 | 14.2% |
| Education | 124 | 31.6% |
| Literature & Languages | 17 | 4.3% |
| Liberal Arts & History | 8 | 2.0% |
| Visual & Performing Arts | 12 | 3.0% |
| Communications | 10 | 2.5% |
| Arts & Humanities | 38 | 9.7% |
| Total | 393 | 100.0% |
Transportation & Commute in Haskell County
Vehicle Availability by Sex in Haskell County
The most prevalent vehicle ownership categories in Haskell County are males with 2 vehicles (367, accounting for 34.5%) and females with 2 vehicles (256, making up 51.3%).
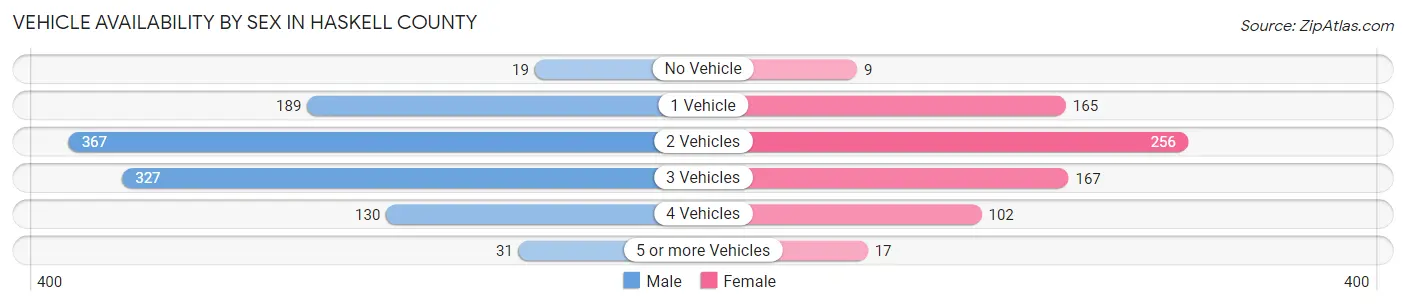
| Vehicles Available | Male | Female |
| No Vehicle | 19 (1.8%) | 9 (1.3%) |
| 1 Vehicle | 189 (17.8%) | 165 (23.0%) |
| 2 Vehicles | 367 (34.5%) | 256 (35.7%) |
| 3 Vehicles | 327 (30.8%) | 167 (23.3%) |
| 4 Vehicles | 130 (12.2%) | 102 (14.2%) |
| 5 or more Vehicles | 31 (2.9%) | 17 (2.4%) |
| Total | 1,063 (100.0%) | 716 (100.0%) |
Commute Time in Haskell County
The most frequently occuring commute durations in Haskell County are 5 to 9 minutes (455 commuters, 26.9%), less than 5 minutes (394 commuters, 23.3%), and 15 to 19 minutes (198 commuters, 11.7%).
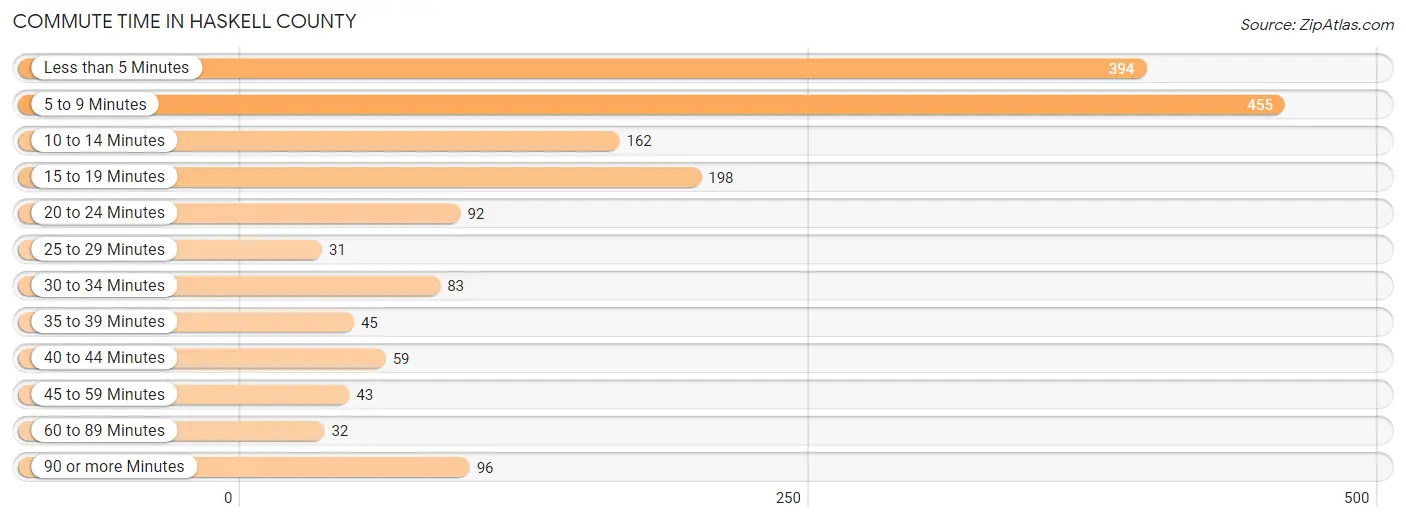
| Commute Time | # Commuters | % Commuters |
| Less than 5 Minutes | 394 | 23.3% |
| 5 to 9 Minutes | 455 | 26.9% |
| 10 to 14 Minutes | 162 | 9.6% |
| 15 to 19 Minutes | 198 | 11.7% |
| 20 to 24 Minutes | 92 | 5.4% |
| 25 to 29 Minutes | 31 | 1.8% |
| 30 to 34 Minutes | 83 | 4.9% |
| 35 to 39 Minutes | 45 | 2.7% |
| 40 to 44 Minutes | 59 | 3.5% |
| 45 to 59 Minutes | 43 | 2.5% |
| 60 to 89 Minutes | 32 | 1.9% |
| 90 or more Minutes | 96 | 5.7% |
Commute Time by Sex in Haskell County
The most common commute times in Haskell County are 5 to 9 minutes (243 commuters, 23.6%) for males and 5 to 9 minutes (212 commuters, 32.0%) for females.
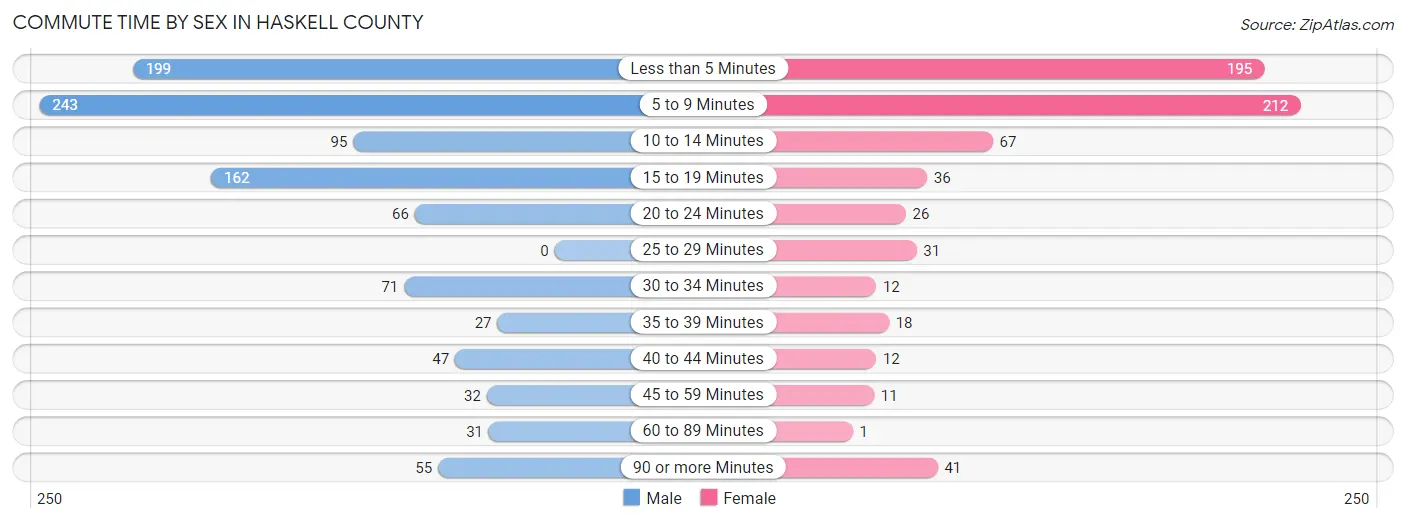
| Commute Time | Male | Female |
| Less than 5 Minutes | 199 (19.4%) | 195 (29.5%) |
| 5 to 9 Minutes | 243 (23.6%) | 212 (32.0%) |
| 10 to 14 Minutes | 95 (9.2%) | 67 (10.1%) |
| 15 to 19 Minutes | 162 (15.8%) | 36 (5.4%) |
| 20 to 24 Minutes | 66 (6.4%) | 26 (3.9%) |
| 25 to 29 Minutes | 0 (0.0%) | 31 (4.7%) |
| 30 to 34 Minutes | 71 (6.9%) | 12 (1.8%) |
| 35 to 39 Minutes | 27 (2.6%) | 18 (2.7%) |
| 40 to 44 Minutes | 47 (4.6%) | 12 (1.8%) |
| 45 to 59 Minutes | 32 (3.1%) | 11 (1.7%) |
| 60 to 89 Minutes | 31 (3.0%) | 1 (0.2%) |
| 90 or more Minutes | 55 (5.3%) | 41 (6.2%) |
Time of Departure to Work by Sex in Haskell County
The most frequent times of departure to work in Haskell County are 7:00 AM to 7:29 AM (240, 23.4%) for males and 7:00 AM to 7:29 AM (145, 21.9%) for females.
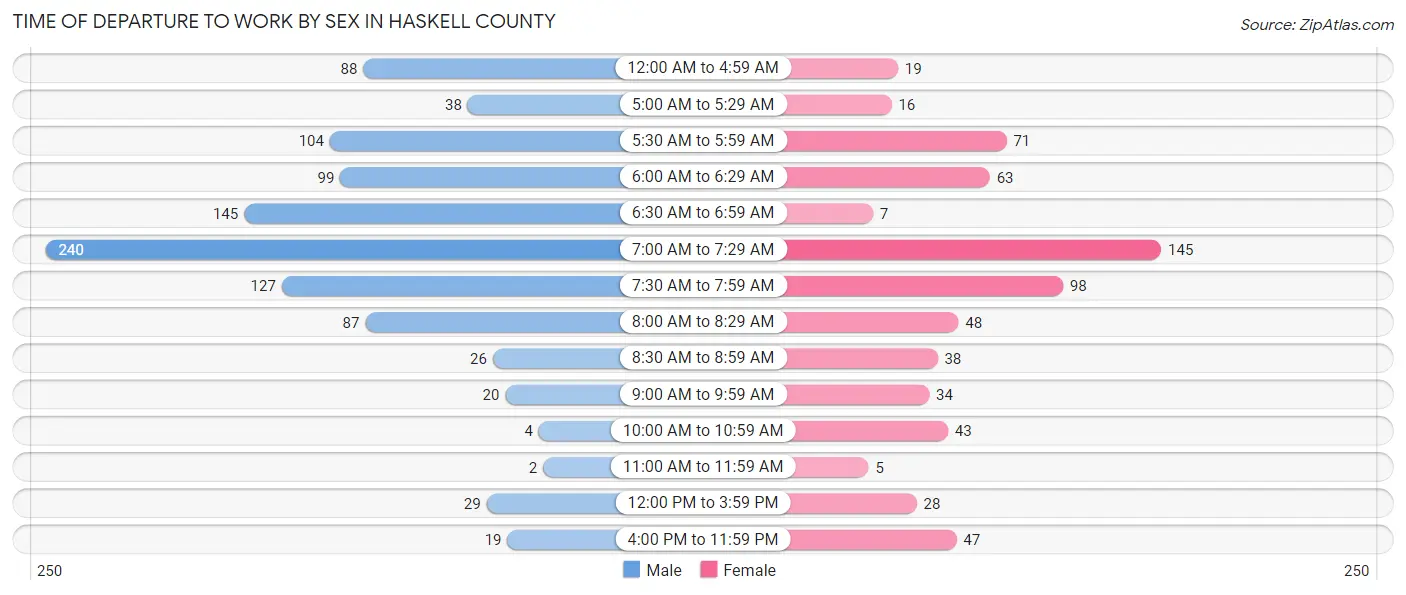
| Time of Departure | Male | Female |
| 12:00 AM to 4:59 AM | 88 (8.6%) | 19 (2.9%) |
| 5:00 AM to 5:29 AM | 38 (3.7%) | 16 (2.4%) |
| 5:30 AM to 5:59 AM | 104 (10.1%) | 71 (10.7%) |
| 6:00 AM to 6:29 AM | 99 (9.6%) | 63 (9.5%) |
| 6:30 AM to 6:59 AM | 145 (14.1%) | 7 (1.1%) |
| 7:00 AM to 7:29 AM | 240 (23.4%) | 145 (21.9%) |
| 7:30 AM to 7:59 AM | 127 (12.3%) | 98 (14.8%) |
| 8:00 AM to 8:29 AM | 87 (8.5%) | 48 (7.2%) |
| 8:30 AM to 8:59 AM | 26 (2.5%) | 38 (5.7%) |
| 9:00 AM to 9:59 AM | 20 (1.9%) | 34 (5.1%) |
| 10:00 AM to 10:59 AM | 4 (0.4%) | 43 (6.5%) |
| 11:00 AM to 11:59 AM | 2 (0.2%) | 5 (0.8%) |
| 12:00 PM to 3:59 PM | 29 (2.8%) | 28 (4.2%) |
| 4:00 PM to 11:59 PM | 19 (1.8%) | 47 (7.1%) |
| Total | 1,028 (100.0%) | 662 (100.0%) |
Housing Occupancy in Haskell County
Occupancy by Ownership in Haskell County
Of the total 1,354 dwellings in Haskell County, owner-occupied units account for 1,031 (76.1%), while renter-occupied units make up 323 (23.9%).
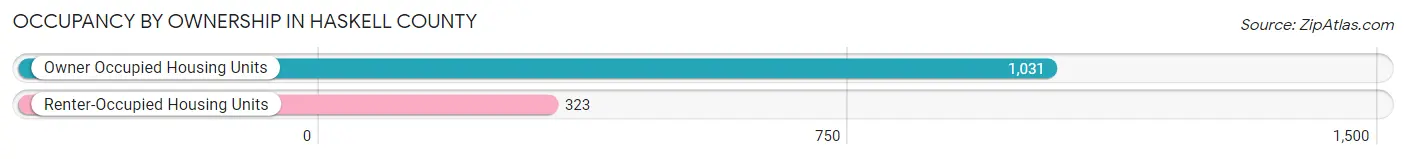
| Occupancy | # Housing Units | % Housing Units |
| Owner Occupied Housing Units | 1,031 | 76.1% |
| Renter-Occupied Housing Units | 323 | 23.9% |
| Total Occupied Housing Units | 1,354 | 100.0% |
Occupancy by Household Size in Haskell County
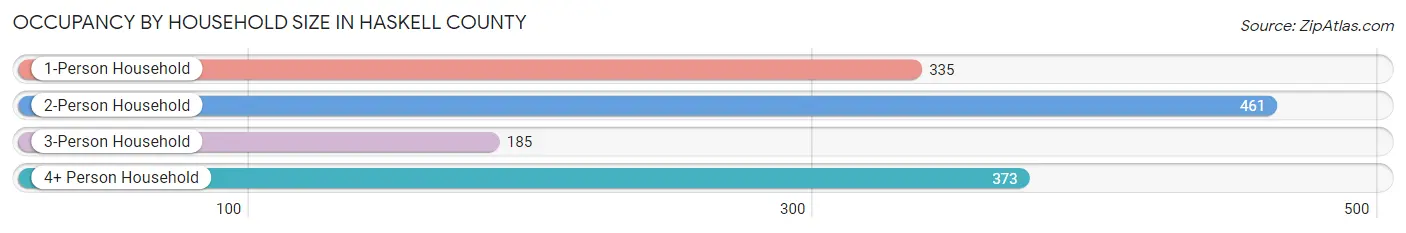
| Household Size | # Housing Units | % Housing Units |
| 1-Person Household | 335 | 24.7% |
| 2-Person Household | 461 | 34.1% |
| 3-Person Household | 185 | 13.7% |
| 4+ Person Household | 373 | 27.6% |
| Total Housing Units | 1,354 | 100.0% |
Occupancy by Ownership by Household Size in Haskell County
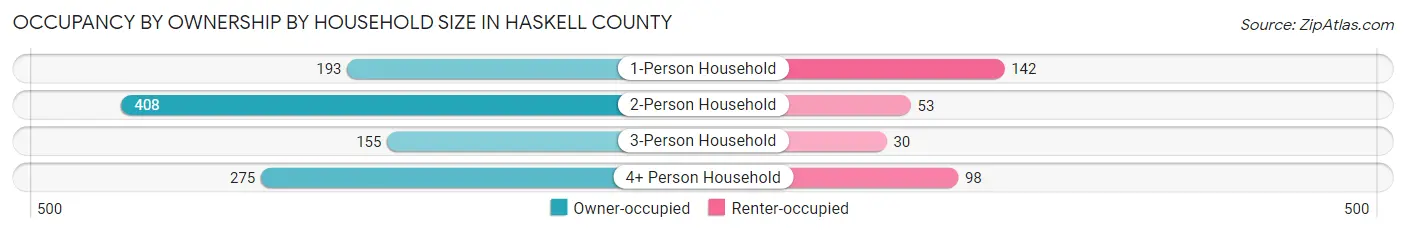
| Household Size | Owner-occupied | Renter-occupied |
| 1-Person Household | 193 (57.6%) | 142 (42.4%) |
| 2-Person Household | 408 (88.5%) | 53 (11.5%) |
| 3-Person Household | 155 (83.8%) | 30 (16.2%) |
| 4+ Person Household | 275 (73.7%) | 98 (26.3%) |
| Total Housing Units | 1,031 (76.1%) | 323 (23.9%) |
Occupancy by Educational Attainment in Haskell County
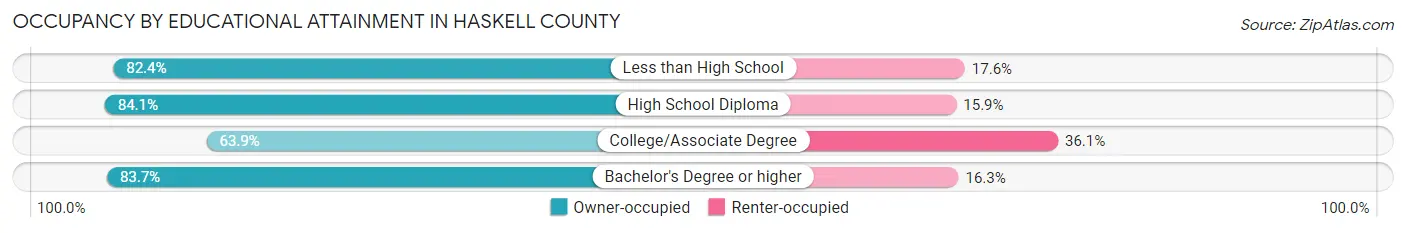
| Household Size | Owner-occupied | Renter-occupied |
| Less than High School | 267 (82.4%) | 57 (17.6%) |
| High School Diploma | 238 (84.1%) | 45 (15.9%) |
| College/Associate Degree | 321 (63.9%) | 181 (36.1%) |
| Bachelor's Degree or higher | 205 (83.7%) | 40 (16.3%) |
Occupancy by Age of Householder in Haskell County
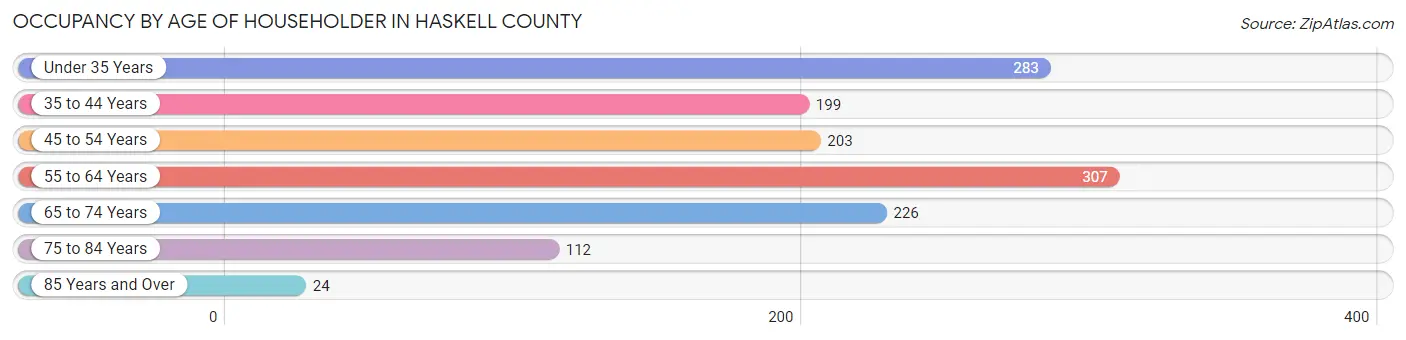
| Age Bracket | # Households | % Households |
| Under 35 Years | 283 | 20.9% |
| 35 to 44 Years | 199 | 14.7% |
| 45 to 54 Years | 203 | 15.0% |
| 55 to 64 Years | 307 | 22.7% |
| 65 to 74 Years | 226 | 16.7% |
| 75 to 84 Years | 112 | 8.3% |
| 85 Years and Over | 24 | 1.8% |
| Total | 1,354 | 100.0% |
Housing Finances in Haskell County
Median Income by Occupancy in Haskell County
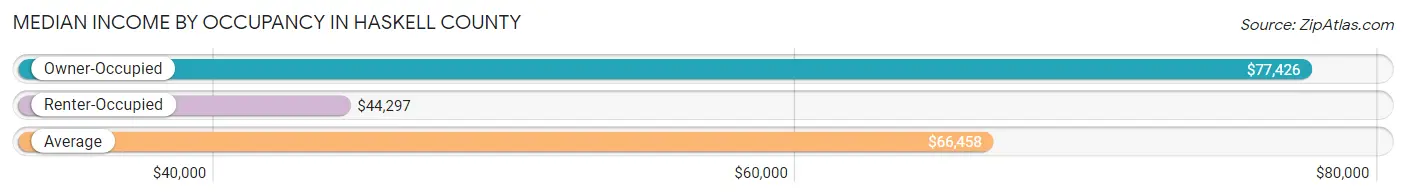
| Occupancy Type | # Households | Median Income |
| Owner-Occupied | 1,031 (76.1%) | $77,426 |
| Renter-Occupied | 323 (23.9%) | $44,297 |
| Average | 1,354 (100.0%) | $66,458 |
Occupancy by Householder Income Bracket in Haskell County
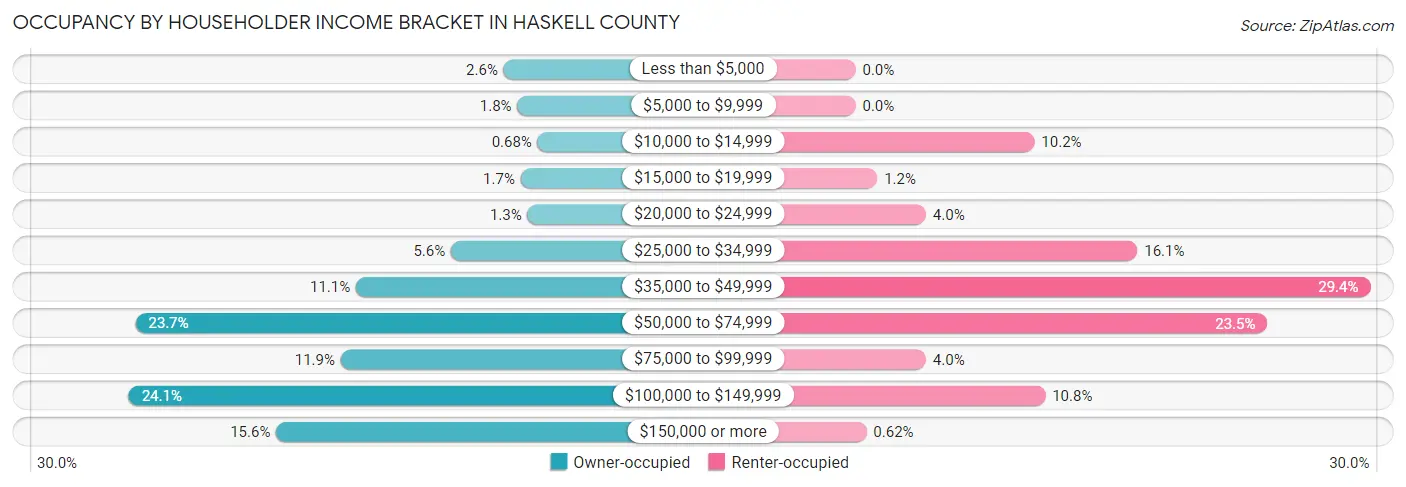
| Income Bracket | Owner-occupied | Renter-occupied |
| Less than $5,000 | 27 (2.6%) | 0 (0.0%) |
| $5,000 to $9,999 | 19 (1.8%) | 0 (0.0%) |
| $10,000 to $14,999 | 7 (0.7%) | 33 (10.2%) |
| $15,000 to $19,999 | 17 (1.7%) | 4 (1.2%) |
| $20,000 to $24,999 | 13 (1.3%) | 13 (4.0%) |
| $25,000 to $34,999 | 58 (5.6%) | 52 (16.1%) |
| $35,000 to $49,999 | 114 (11.1%) | 95 (29.4%) |
| $50,000 to $74,999 | 244 (23.7%) | 76 (23.5%) |
| $75,000 to $99,999 | 123 (11.9%) | 13 (4.0%) |
| $100,000 to $149,999 | 248 (24.0%) | 35 (10.8%) |
| $150,000 or more | 161 (15.6%) | 2 (0.6%) |
| Total | 1,031 (100.0%) | 323 (100.0%) |
Monthly Housing Cost Tiers in Haskell County
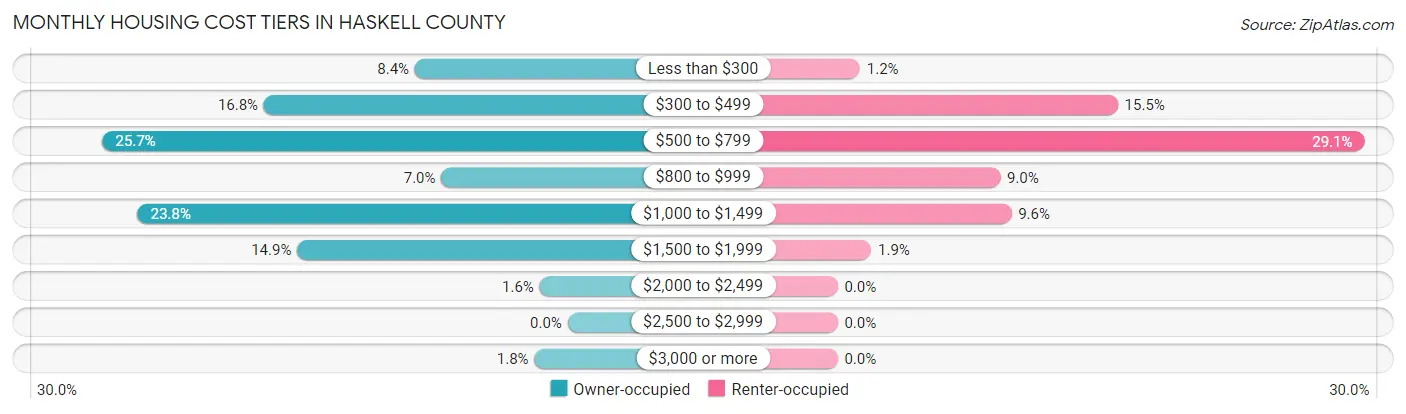
| Monthly Cost | Owner-occupied | Renter-occupied |
| Less than $300 | 87 (8.4%) | 4 (1.2%) |
| $300 to $499 | 173 (16.8%) | 50 (15.5%) |
| $500 to $799 | 265 (25.7%) | 94 (29.1%) |
| $800 to $999 | 72 (7.0%) | 29 (9.0%) |
| $1,000 to $1,499 | 245 (23.8%) | 31 (9.6%) |
| $1,500 to $1,999 | 154 (14.9%) | 6 (1.9%) |
| $2,000 to $2,499 | 16 (1.5%) | 0 (0.0%) |
| $2,500 to $2,999 | 0 (0.0%) | 0 (0.0%) |
| $3,000 or more | 19 (1.8%) | 0 (0.0%) |
| Total | 1,031 (100.0%) | 323 (100.0%) |
Physical Housing Characteristics in Haskell County
Housing Structures in Haskell County
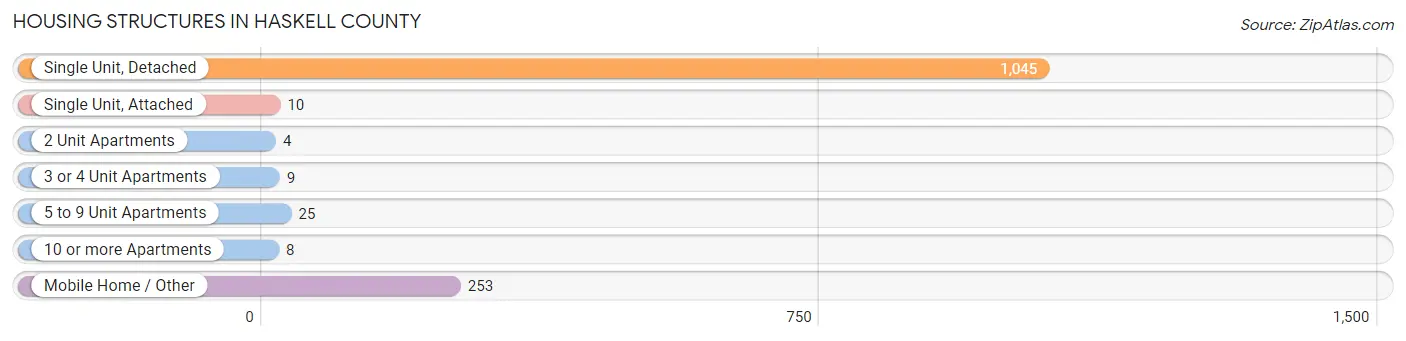
| Structure Type | # Housing Units | % Housing Units |
| Single Unit, Detached | 1,045 | 77.2% |
| Single Unit, Attached | 10 | 0.7% |
| 2 Unit Apartments | 4 | 0.3% |
| 3 or 4 Unit Apartments | 9 | 0.7% |
| 5 to 9 Unit Apartments | 25 | 1.8% |
| 10 or more Apartments | 8 | 0.6% |
| Mobile Home / Other | 253 | 18.7% |
| Total | 1,354 | 100.0% |
Housing Structures by Occupancy in Haskell County
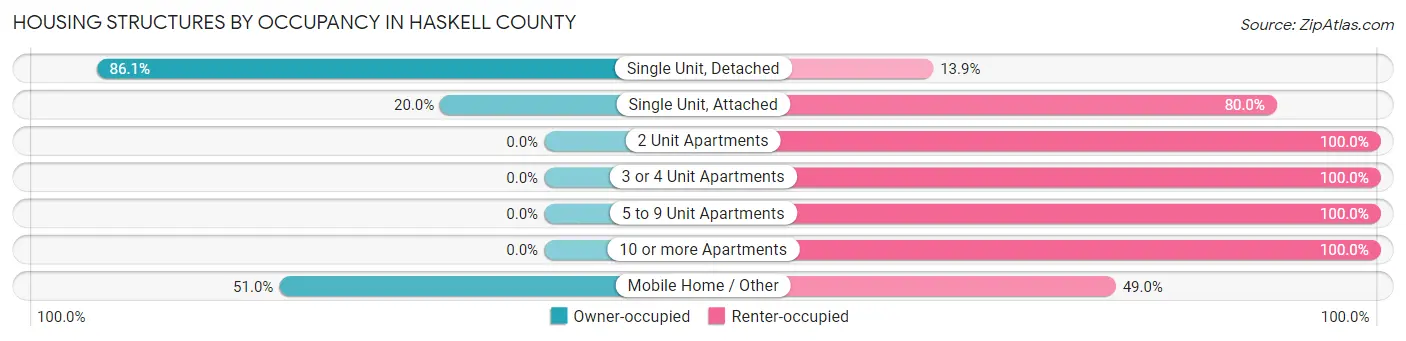
| Structure Type | Owner-occupied | Renter-occupied |
| Single Unit, Detached | 900 (86.1%) | 145 (13.9%) |
| Single Unit, Attached | 2 (20.0%) | 8 (80.0%) |
| 2 Unit Apartments | 0 (0.0%) | 4 (100.0%) |
| 3 or 4 Unit Apartments | 0 (0.0%) | 9 (100.0%) |
| 5 to 9 Unit Apartments | 0 (0.0%) | 25 (100.0%) |
| 10 or more Apartments | 0 (0.0%) | 8 (100.0%) |
| Mobile Home / Other | 129 (51.0%) | 124 (49.0%) |
| Total | 1,031 (76.1%) | 323 (23.9%) |
Housing Structures by Number of Rooms in Haskell County
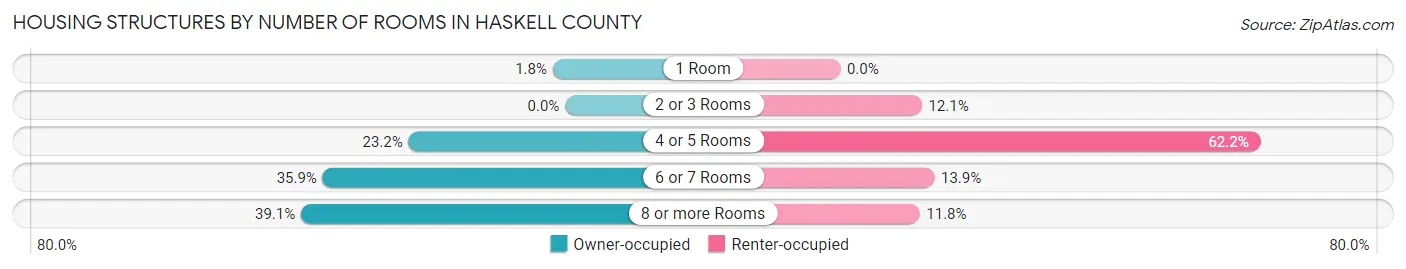
| Number of Rooms | Owner-occupied | Renter-occupied |
| 1 Room | 19 (1.8%) | 0 (0.0%) |
| 2 or 3 Rooms | 0 (0.0%) | 39 (12.1%) |
| 4 or 5 Rooms | 239 (23.2%) | 201 (62.2%) |
| 6 or 7 Rooms | 370 (35.9%) | 45 (13.9%) |
| 8 or more Rooms | 403 (39.1%) | 38 (11.8%) |
| Total | 1,031 (100.0%) | 323 (100.0%) |
Housing Structure by Heating Type in Haskell County
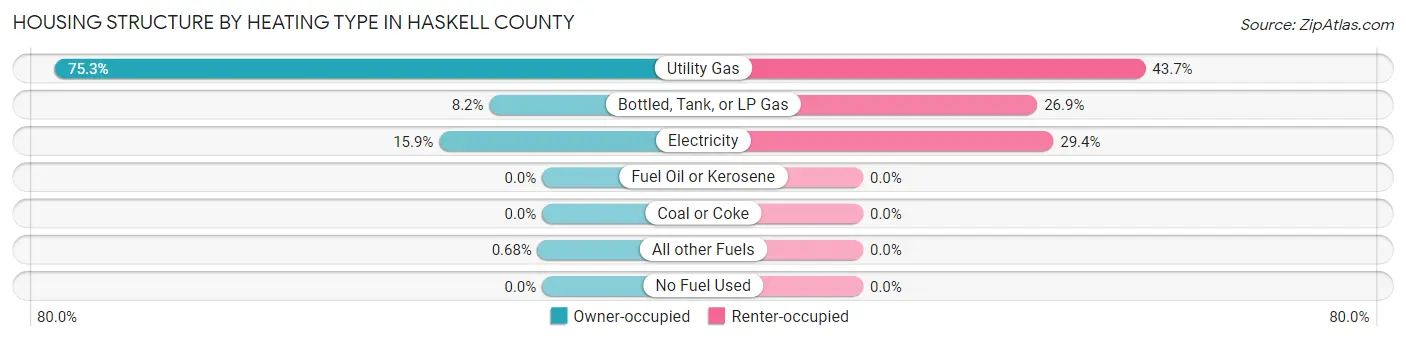
| Heating Type | Owner-occupied | Renter-occupied |
| Utility Gas | 776 (75.3%) | 141 (43.6%) |
| Bottled, Tank, or LP Gas | 84 (8.2%) | 87 (26.9%) |
| Electricity | 164 (15.9%) | 95 (29.4%) |
| Fuel Oil or Kerosene | 0 (0.0%) | 0 (0.0%) |
| Coal or Coke | 0 (0.0%) | 0 (0.0%) |
| All other Fuels | 7 (0.7%) | 0 (0.0%) |
| No Fuel Used | 0 (0.0%) | 0 (0.0%) |
| Total | 1,031 (100.0%) | 323 (100.0%) |
Household Vehicle Usage in Haskell County
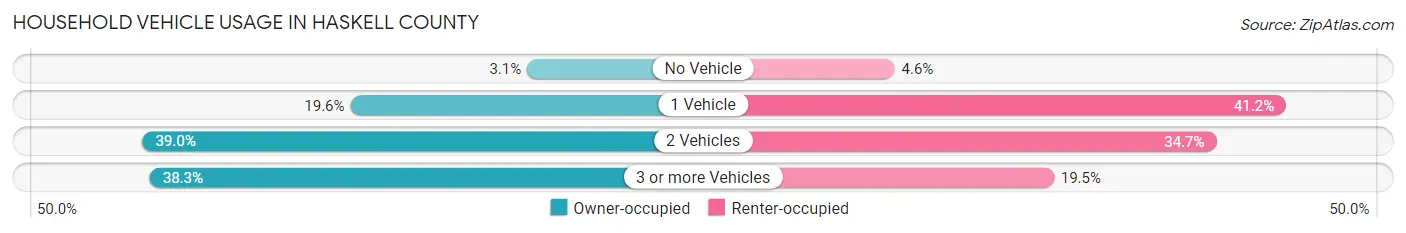
| Vehicles per Household | Owner-occupied | Renter-occupied |
| No Vehicle | 32 (3.1%) | 15 (4.6%) |
| 1 Vehicle | 202 (19.6%) | 133 (41.2%) |
| 2 Vehicles | 402 (39.0%) | 112 (34.7%) |
| 3 or more Vehicles | 395 (38.3%) | 63 (19.5%) |
| Total | 1,031 (100.0%) | 323 (100.0%) |
Real Estate & Mortgages in Haskell County
Real Estate and Mortgage Overview in Haskell County
| Characteristic | Without Mortgage | With Mortgage |
| Housing Units | 624 | 407 |
| Median Property Value | $110,800 | $158,800 |
| Median Household Income | $68,804 | $86 |
| Monthly Housing Costs | $554 | $19 |
| Real Estate Taxes | $2,049 | $0 |
Property Value by Mortgage Status in Haskell County
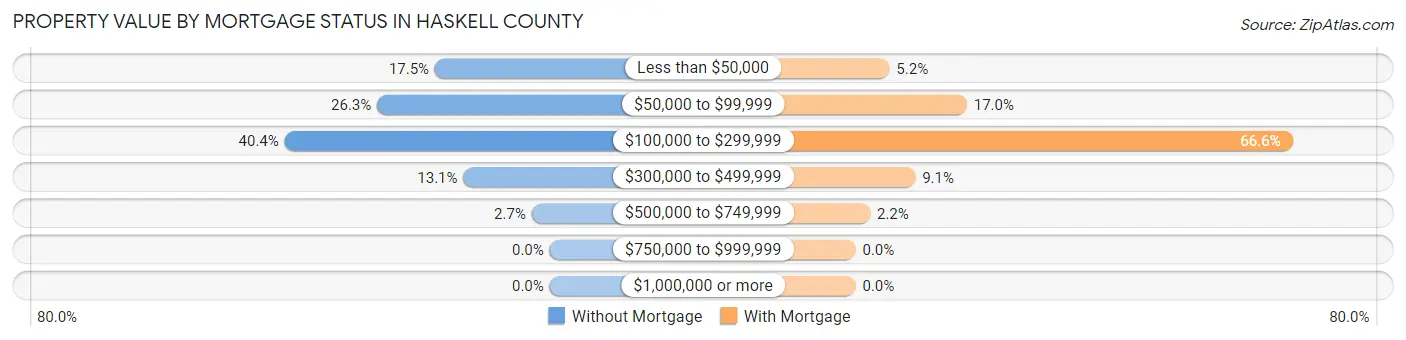
| Property Value | Without Mortgage | With Mortgage |
| Less than $50,000 | 109 (17.5%) | 21 (5.2%) |
| $50,000 to $99,999 | 164 (26.3%) | 69 (17.0%) |
| $100,000 to $299,999 | 252 (40.4%) | 271 (66.6%) |
| $300,000 to $499,999 | 82 (13.1%) | 37 (9.1%) |
| $500,000 to $749,999 | 17 (2.7%) | 9 (2.2%) |
| $750,000 to $999,999 | 0 (0.0%) | 0 (0.0%) |
| $1,000,000 or more | 0 (0.0%) | 0 (0.0%) |
| Total | 624 (100.0%) | 407 (100.0%) |
Household Income by Mortgage Status in Haskell County
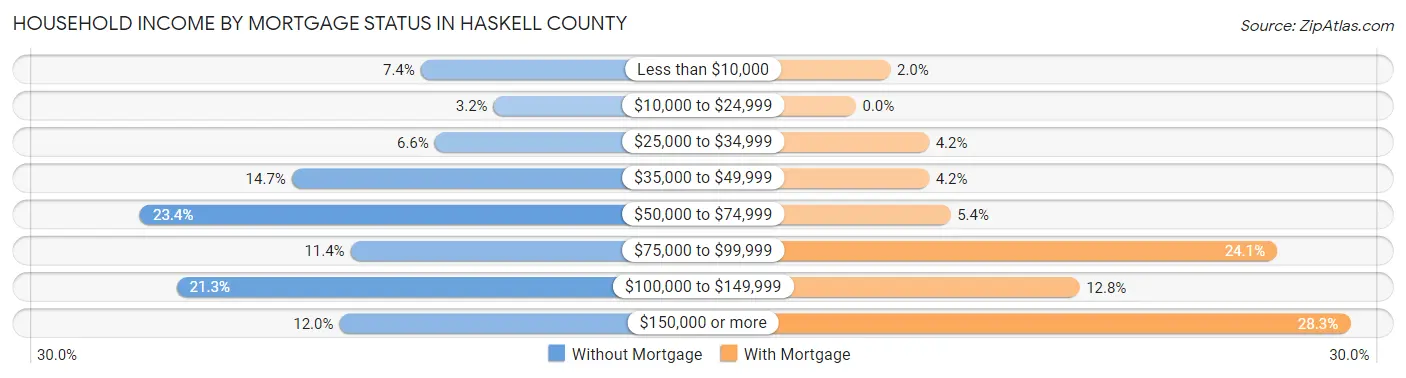
| Household Income | Without Mortgage | With Mortgage |
| Less than $10,000 | 46 (7.4%) | 8 (2.0%) |
| $10,000 to $24,999 | 20 (3.2%) | 0 (0.0%) |
| $25,000 to $34,999 | 41 (6.6%) | 17 (4.2%) |
| $35,000 to $49,999 | 92 (14.7%) | 17 (4.2%) |
| $50,000 to $74,999 | 146 (23.4%) | 22 (5.4%) |
| $75,000 to $99,999 | 71 (11.4%) | 98 (24.1%) |
| $100,000 to $149,999 | 133 (21.3%) | 52 (12.8%) |
| $150,000 or more | 75 (12.0%) | 115 (28.3%) |
| Total | 624 (100.0%) | 407 (100.0%) |
Property Value to Household Income Ratio in Haskell County
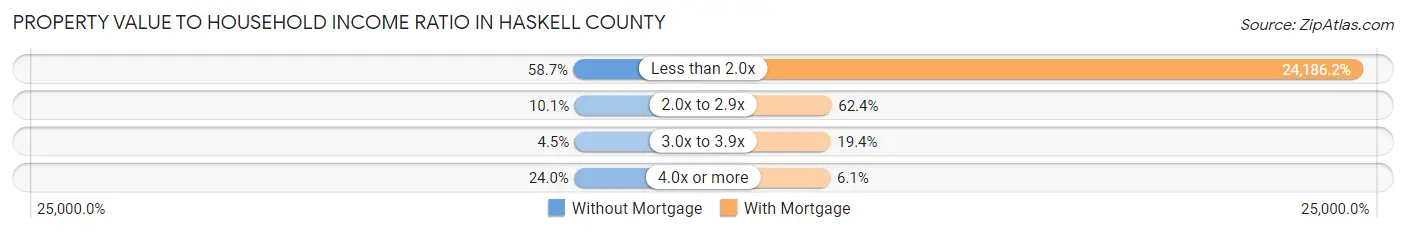
| Value-to-Income Ratio | Without Mortgage | With Mortgage |
| Less than 2.0x | 366 (58.7%) | 98,438 (24,186.2%) |
| 2.0x to 2.9x | 63 (10.1%) | 254 (62.4%) |
| 3.0x to 3.9x | 28 (4.5%) | 79 (19.4%) |
| 4.0x or more | 150 (24.0%) | 25 (6.1%) |
| Total | 624 (100.0%) | 407 (100.0%) |
Real Estate Taxes by Mortgage Status in Haskell County
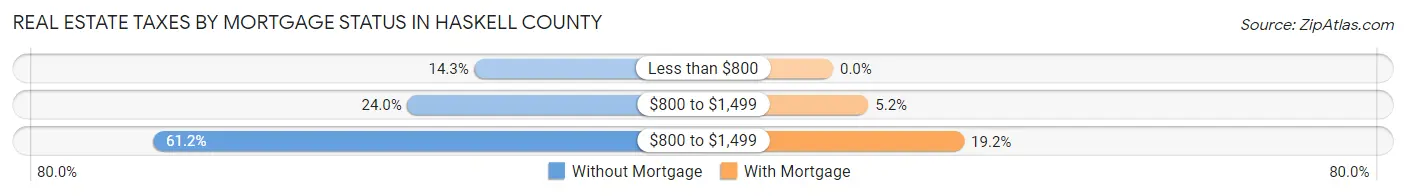
| Property Taxes | Without Mortgage | With Mortgage |
| Less than $800 | 89 (14.3%) | 0 (0.0%) |
| $800 to $1,499 | 150 (24.0%) | 21 (5.2%) |
| $800 to $1,499 | 382 (61.2%) | 78 (19.2%) |
| Total | 624 (100.0%) | 407 (100.0%) |
Health & Disability in Haskell County
Health Insurance Coverage by Age in Haskell County
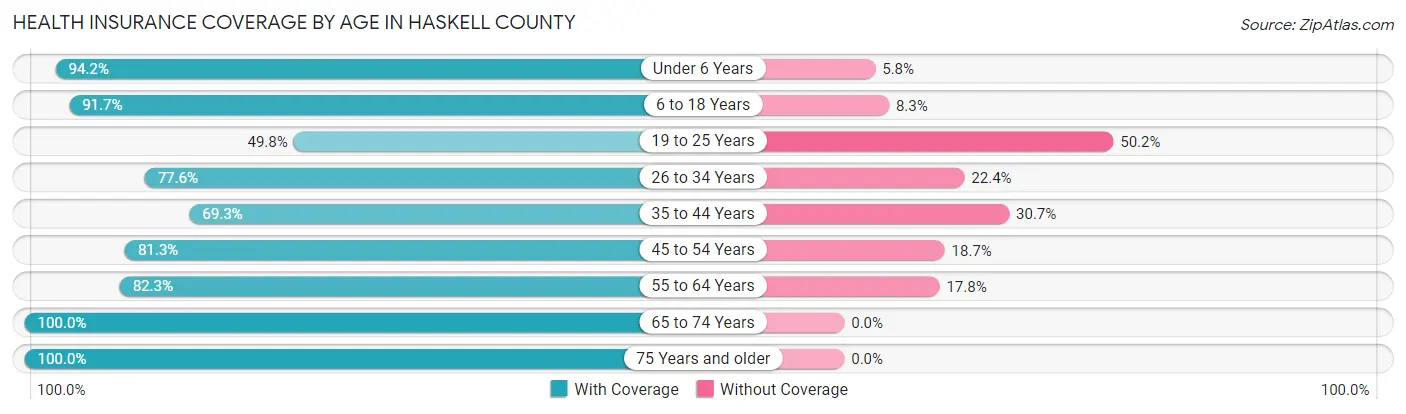
| Age Bracket | With Coverage | Without Coverage |
| Under 6 Years | 310 (94.2%) | 19 (5.8%) |
| 6 to 18 Years | 660 (91.7%) | 60 (8.3%) |
| 19 to 25 Years | 156 (49.8%) | 157 (50.2%) |
| 26 to 34 Years | 291 (77.6%) | 84 (22.4%) |
| 35 to 44 Years | 347 (69.3%) | 154 (30.7%) |
| 45 to 54 Years | 330 (81.3%) | 76 (18.7%) |
| 55 to 64 Years | 417 (82.3%) | 90 (17.7%) |
| 65 to 74 Years | 367 (100.0%) | 0 (0.0%) |
| 75 Years and older | 165 (100.0%) | 0 (0.0%) |
| Total | 3,043 (82.6%) | 640 (17.4%) |
Health Insurance Coverage by Citizenship Status in Haskell County
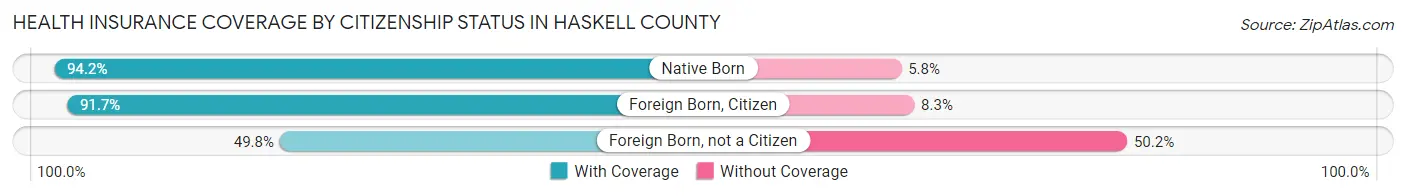
| Citizenship Status | With Coverage | Without Coverage |
| Native Born | 310 (94.2%) | 19 (5.8%) |
| Foreign Born, Citizen | 660 (91.7%) | 60 (8.3%) |
| Foreign Born, not a Citizen | 156 (49.8%) | 157 (50.2%) |
Health Insurance Coverage by Household Income in Haskell County
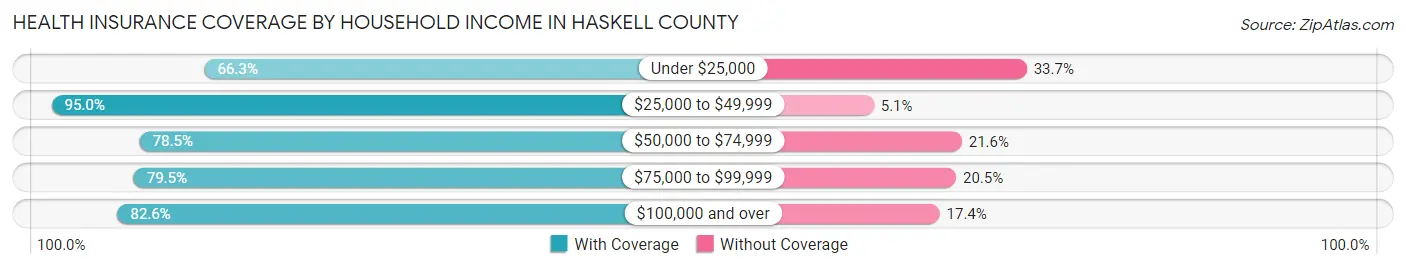
| Household Income | With Coverage | Without Coverage |
| Under $25,000 | 177 (66.3%) | 90 (33.7%) |
| $25,000 to $49,999 | 695 (95.0%) | 37 (5.1%) |
| $50,000 to $74,999 | 626 (78.4%) | 172 (21.5%) |
| $75,000 to $99,999 | 338 (79.5%) | 87 (20.5%) |
| $100,000 and over | 1,207 (82.6%) | 254 (17.4%) |
Public vs Private Health Insurance Coverage by Age in Haskell County
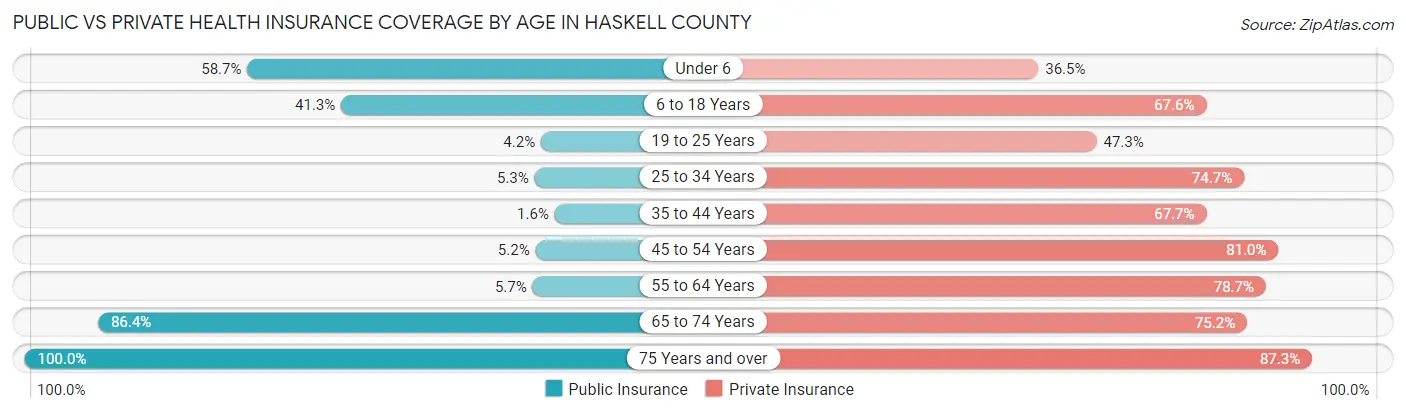
| Age Bracket | Public Insurance | Private Insurance |
| Under 6 | 193 (58.7%) | 120 (36.5%) |
| 6 to 18 Years | 297 (41.2%) | 487 (67.6%) |
| 19 to 25 Years | 13 (4.2%) | 148 (47.3%) |
| 25 to 34 Years | 20 (5.3%) | 280 (74.7%) |
| 35 to 44 Years | 8 (1.6%) | 339 (67.7%) |
| 45 to 54 Years | 21 (5.2%) | 329 (81.0%) |
| 55 to 64 Years | 29 (5.7%) | 399 (78.7%) |
| 65 to 74 Years | 317 (86.4%) | 276 (75.2%) |
| 75 Years and over | 165 (100.0%) | 144 (87.3%) |
| Total | 1,063 (28.9%) | 2,522 (68.5%) |
Disability Status by Sex by Age in Haskell County
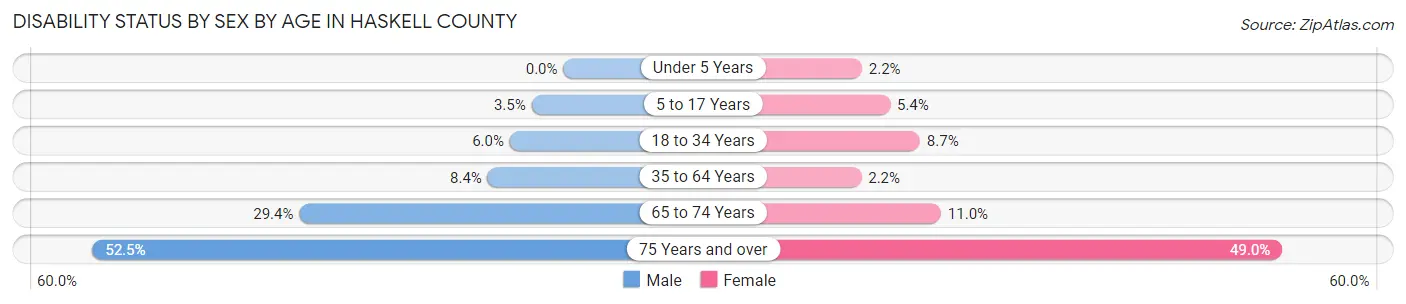
| Age Bracket | Male | Female |
| Under 5 Years | 0 (0.0%) | 4 (2.2%) |
| 5 to 17 Years | 14 (3.5%) | 18 (5.4%) |
| 18 to 34 Years | 22 (6.0%) | 32 (8.7%) |
| 35 to 64 Years | 57 (8.4%) | 16 (2.2%) |
| 65 to 74 Years | 60 (29.4%) | 18 (11.0%) |
| 75 Years and over | 32 (52.5%) | 51 (49.0%) |
Disability Class by Sex by Age in Haskell County
Disability Class: Hearing Difficulty
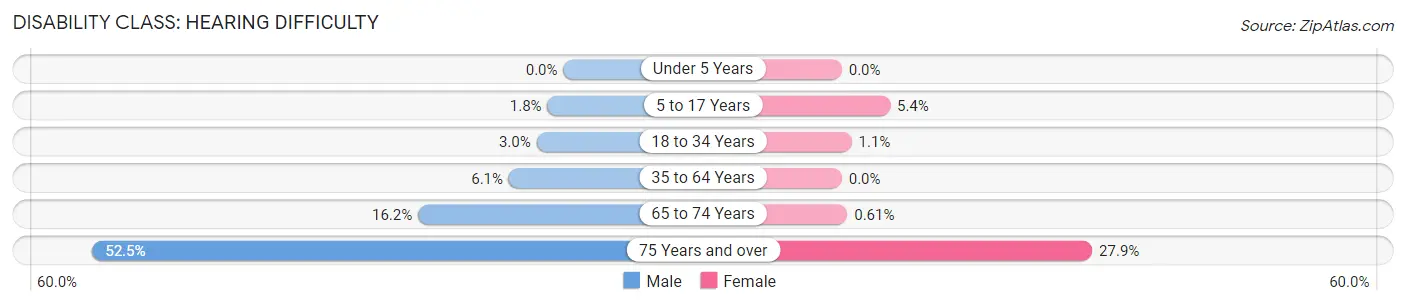
| Age Bracket | Male | Female |
| Under 5 Years | 0 (0.0%) | 0 (0.0%) |
| 5 to 17 Years | 7 (1.8%) | 18 (5.4%) |
| 18 to 34 Years | 11 (3.0%) | 4 (1.1%) |
| 35 to 64 Years | 41 (6.1%) | 0 (0.0%) |
| 65 to 74 Years | 33 (16.2%) | 1 (0.6%) |
| 75 Years and over | 32 (52.5%) | 29 (27.9%) |
Disability Class: Vision Difficulty
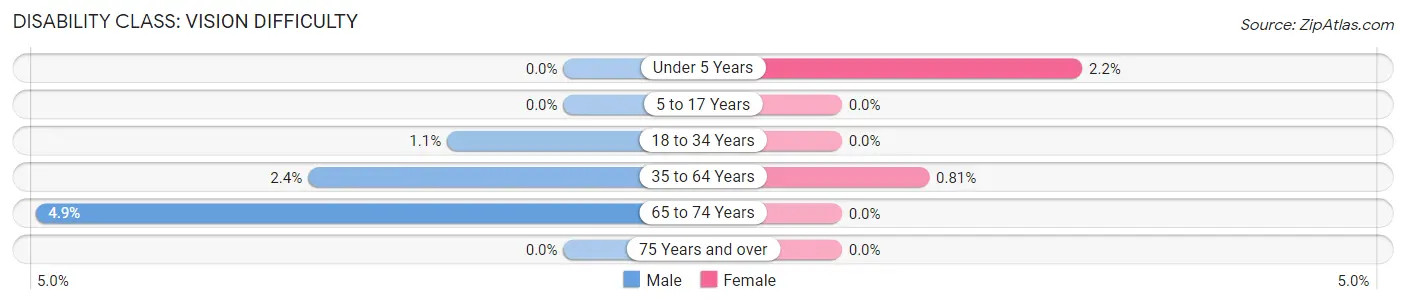
| Age Bracket | Male | Female |
| Under 5 Years | 0 (0.0%) | 4 (2.2%) |
| 5 to 17 Years | 0 (0.0%) | 0 (0.0%) |
| 18 to 34 Years | 4 (1.1%) | 0 (0.0%) |
| 35 to 64 Years | 16 (2.4%) | 6 (0.8%) |
| 65 to 74 Years | 10 (4.9%) | 0 (0.0%) |
| 75 Years and over | 0 (0.0%) | 0 (0.0%) |
Disability Class: Cognitive Difficulty
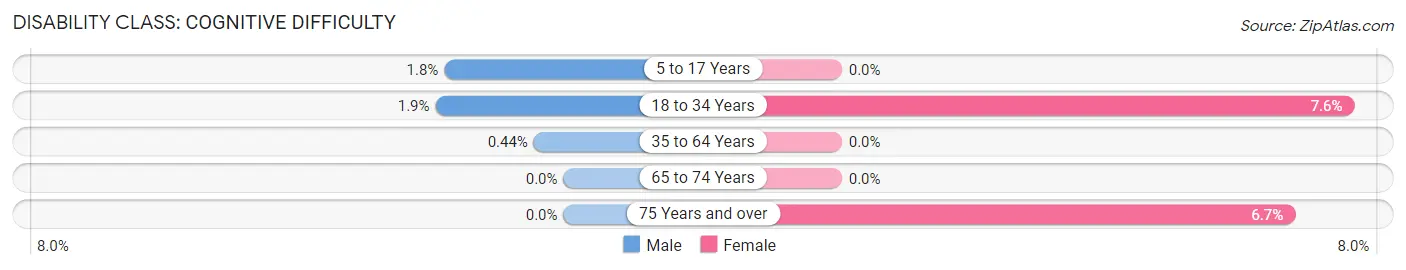
| Age Bracket | Male | Female |
| 5 to 17 Years | 7 (1.8%) | 0 (0.0%) |
| 18 to 34 Years | 7 (1.9%) | 28 (7.6%) |
| 35 to 64 Years | 3 (0.4%) | 0 (0.0%) |
| 65 to 74 Years | 0 (0.0%) | 0 (0.0%) |
| 75 Years and over | 0 (0.0%) | 7 (6.7%) |
Disability Class: Ambulatory Difficulty
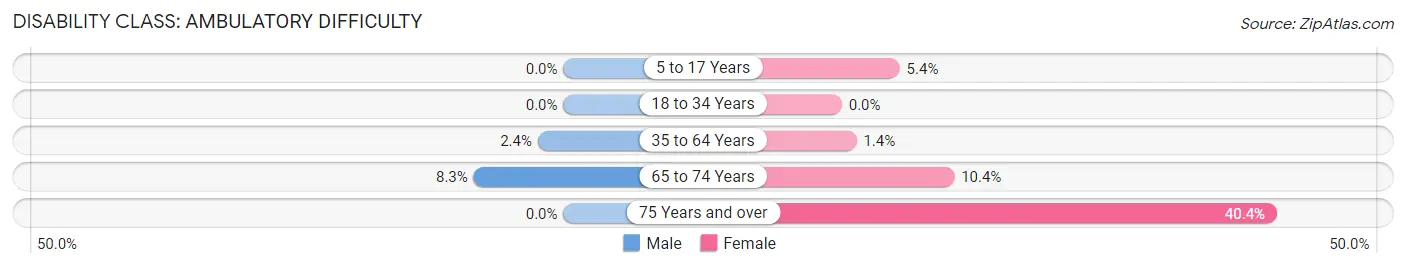
| Age Bracket | Male | Female |
| 5 to 17 Years | 0 (0.0%) | 18 (5.4%) |
| 18 to 34 Years | 0 (0.0%) | 0 (0.0%) |
| 35 to 64 Years | 16 (2.4%) | 10 (1.4%) |
| 65 to 74 Years | 17 (8.3%) | 17 (10.4%) |
| 75 Years and over | 0 (0.0%) | 42 (40.4%) |
Disability Class: Self-Care Difficulty
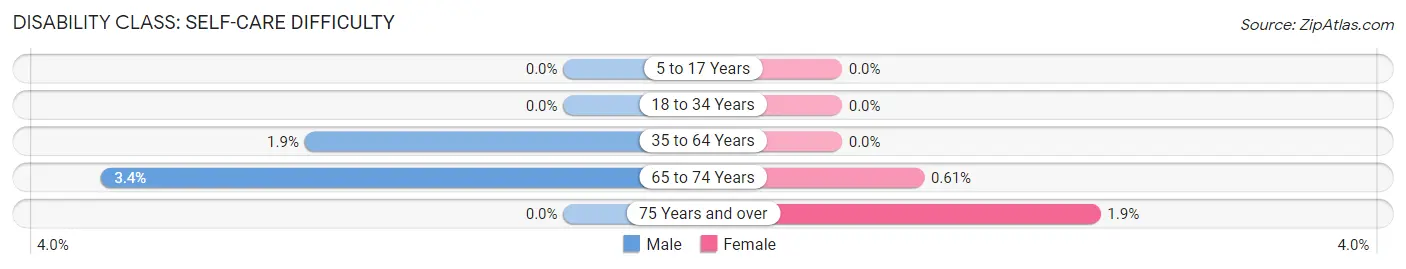
| Age Bracket | Male | Female |
| 5 to 17 Years | 0 (0.0%) | 0 (0.0%) |
| 18 to 34 Years | 0 (0.0%) | 0 (0.0%) |
| 35 to 64 Years | 13 (1.9%) | 0 (0.0%) |
| 65 to 74 Years | 7 (3.4%) | 1 (0.6%) |
| 75 Years and over | 0 (0.0%) | 2 (1.9%) |
Technology Access in Haskell County
Computing Device Access in Haskell County
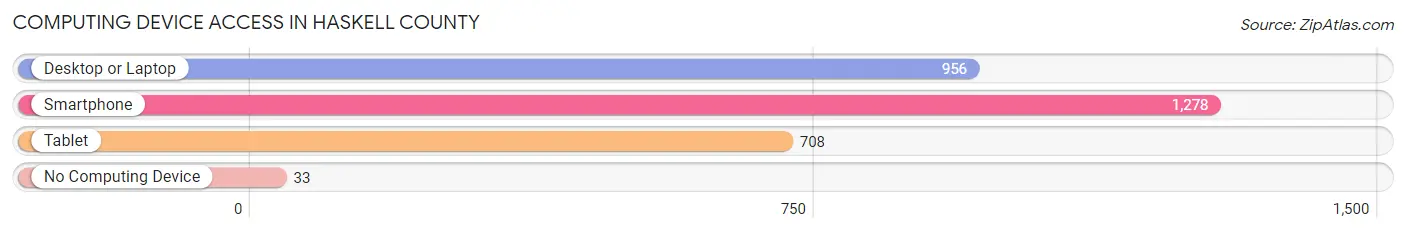
| Device Type | # Households | % Households |
| Desktop or Laptop | 956 | 70.6% |
| Smartphone | 1,278 | 94.4% |
| Tablet | 708 | 52.3% |
| No Computing Device | 33 | 2.4% |
| Total | 1,354 | 100.0% |
Internet Access in Haskell County
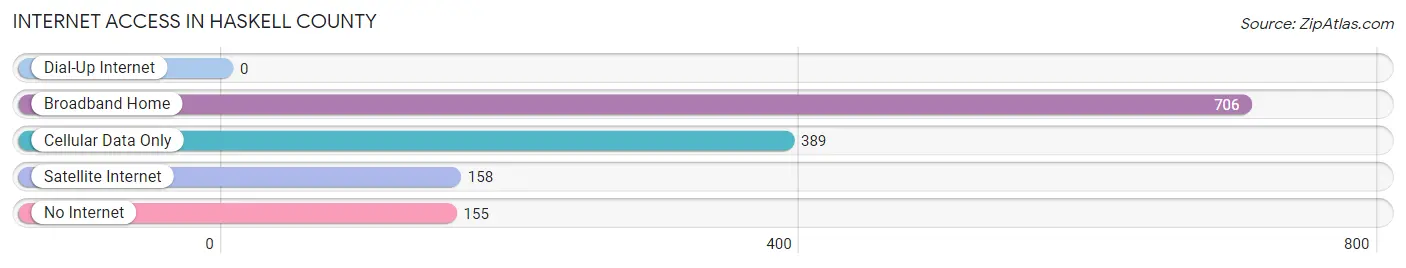
| Internet Type | # Households | % Households |
| Dial-Up Internet | 0 | 0.0% |
| Broadband Home | 706 | 52.1% |
| Cellular Data Only | 389 | 28.7% |
| Satellite Internet | 158 | 11.7% |
| No Internet | 155 | 11.5% |
| Total | 1,354 | 100.0% |
Haskell County Summary
Haskell County, Kansas is located in the southwestern corner of the state, and is bordered by Finney County to the north, Seward County to the east, Gray County to the south, and Stanton County to the west. The county seat is Sublette, and the largest city is Satanta. The county was named after Dudley C. Haskell, a member of the first Kansas State Senate.
Geography
Haskell County covers an area of 890 square miles, and is located in the High Plains region of the Great Plains. The county is mostly flat, with some rolling hills in the east. The Arkansas River flows through the county, and there are several small lakes and reservoirs. The county is mostly covered in grassland, with some areas of cropland.
Demographics
As of the 2010 census, Haskell County had a population of 4,256. The racial makeup of the county was 84.2% White, 0.7% African American, 0.9% Native American, 0.2% Asian, 11.7% from other races, and 2.3% from two or more races. Hispanic or Latino of any race were 20.2% of the population.
Economy
Agriculture is the main economic activity in Haskell County. The county is home to several large farms, and the main crops grown are wheat, corn, sorghum, and soybeans. Cattle and sheep are also raised in the county.
The county also has a small manufacturing sector, with several small factories producing a variety of products. The county also has a small tourism industry, with several attractions such as the Haskell County Historical Museum and the Haskell County Fair.
History
Haskell County was established in 1887, and was named after Dudley C. Haskell, a member of the first Kansas State Senate. The county was originally populated by Native American tribes, including the Kiowa, Comanche, and Apache.
In the late 19th century, the county was settled by European immigrants, mostly from Germany and Russia. The county was largely agricultural, and the main crops grown were wheat, corn, and sorghum.
In the early 20th century, the county experienced a population boom, as many people moved to the area to take advantage of the fertile land and the booming agricultural industry. The county also experienced an economic boom during this time, as several small factories were established in the county.
In the late 20th century, the county experienced a decline in population, as many people moved away to larger cities. The county also experienced a decline in the agricultural industry, as many farms were unable to compete with larger, more efficient farms.
Today, Haskell County is a largely rural county, with a population of just over 4,000. The county is still largely agricultural, and the main crops grown are wheat, corn, sorghum, and soybeans. The county also has a small manufacturing sector, and a small tourism industry.
Common Questions
What is Per Capita Income in Haskell County?
Per Capita income in Haskell County is $32,908.
What is the Median Family Income in Haskell County?
Median Family Income in Haskell County is $91,696.
What is the Median Household income in Haskell County?
Median Household Income in Haskell County is $66,458.
What is Income or Wage Gap in Haskell County?
Income or Wage Gap in Haskell County is 32.6%.
Women in Haskell County earn 67.4 cents for every dollar earned by a man.
What is Inequality or Gini Index in Haskell County?
Inequality or Gini Index in Haskell County is 0.40.
What is the Total Population of Haskell County?
Total Population of Haskell County is 3,735.
What is the Total Male Population of Haskell County?
Total Male Population of Haskell County is 1,824.
What is the Total Female Population of Haskell County?
Total Female Population of Haskell County is 1,911.
What is the Ratio of Males per 100 Females in Haskell County?
There are 95.45 Males per 100 Females in Haskell County.
What is the Ratio of Females per 100 Males in Haskell County?
There are 104.77 Females per 100 Males in Haskell County.
What is the Median Population Age in Haskell County?
Median Population Age in Haskell County is 38.0 Years.
What is the Average Family Size in Haskell County
Average Family Size in Haskell County is 3.4 People.
What is the Average Household Size in Haskell County
Average Household Size in Haskell County is 2.7 People.
How Large is the Labor Force in Haskell County?
There are 1,878 People in the Labor Forcein in Haskell County.
What is the Percentage of People in the Labor Force in Haskell County?
66.2% of People are in the Labor Force in Haskell County.
What is the Unemployment Rate in Haskell County?
Unemployment Rate in Haskell County is 3.5%.