Harper County, KS Map & Demographics
Harper County Map
Harper County Overview
$26,970
PER CAPITA INCOME
$64,750
AVG FAMILY INCOME
$53,032
AVG HOUSEHOLD INCOME
40.6%
WAGE / INCOME GAP [ % ]
59.4¢/ $1
WAGE / INCOME GAP [ $ ]
0.44
INEQUALITY / GINI INDEX
5,457
TOTAL POPULATION
2,698
MALE POPULATION
2,759
FEMALE POPULATION
97.79
MALES / 100 FEMALES
102.26
FEMALES / 100 MALES
41.5
MEDIAN AGE
3.1
AVG FAMILY SIZE
2.4
AVG HOUSEHOLD SIZE
2,287
LABOR FORCE [ PEOPLE ]
53.5%
PERCENT IN LABOR FORCE
5.3%
UNEMPLOYMENT RATE
Harper County Area Codes
Income in Harper County
Income Overview in Harper County
Per Capita Income in Harper County is $26,970, while median incomes of families and households are $64,750 and $53,032 respectively.
| Characteristic | Number | Measure |
| Per Capita Income | 5,457 | $26,970 |
| Median Family Income | 1,346 | $64,750 |
| Mean Family Income | 1,346 | $81,945 |
| Median Household Income | 2,186 | $53,032 |
| Mean Household Income | 2,186 | $67,153 |
| Income Deficit | 1,346 | $0 |
| Wage / Income Gap (%) | 5,457 | 40.57% |
| Wage / Income Gap ($) | 5,457 | 59.43¢ per $1 |
| Gini / Inequality Index | 5,457 | 0.44 |
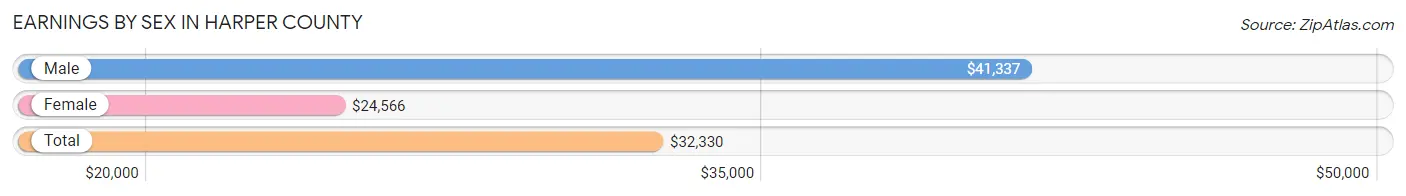
Earnings by Sex in Harper County
Average Earnings in Harper County are $32,330, $41,337 for men and $24,566 for women, a difference of 40.6%.
| Sex | Number | Average Earnings |
| Male | 1,304 (54.6%) | $41,337 |
| Female | 1,084 (45.4%) | $24,566 |
| Total | 2,388 (100.0%) | $32,330 |
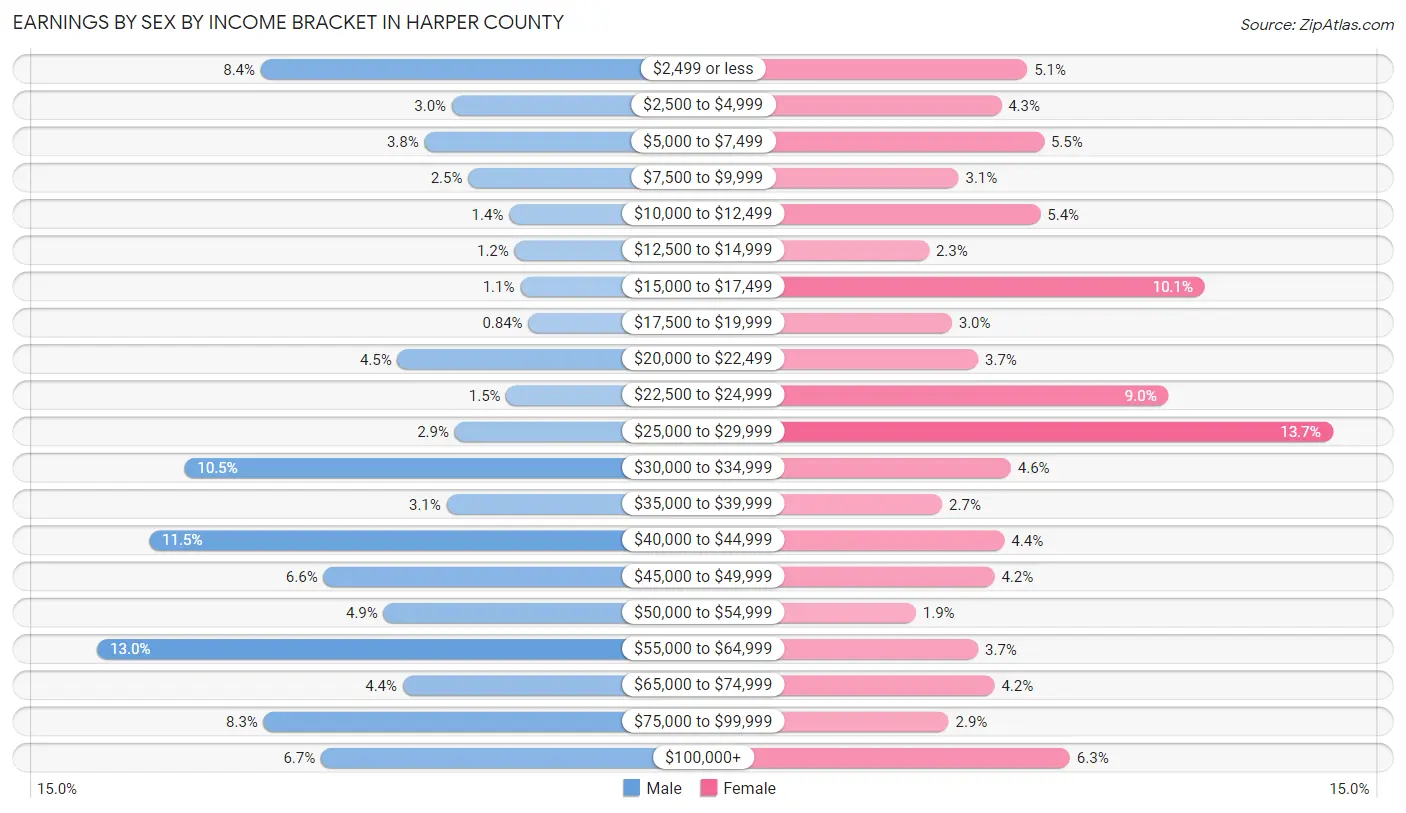
Earnings by Sex by Income Bracket in Harper County
The most common earnings brackets in Harper County are $55,000 to $64,999 for men (169 | 13.0%) and $25,000 to $29,999 for women (148 | 13.7%).
| Income | Male | Female |
| $2,499 or less | 109 (8.4%) | 55 (5.1%) |
| $2,500 to $4,999 | 39 (3.0%) | 47 (4.3%) |
| $5,000 to $7,499 | 49 (3.8%) | 60 (5.5%) |
| $7,500 to $9,999 | 33 (2.5%) | 34 (3.1%) |
| $10,000 to $12,499 | 18 (1.4%) | 59 (5.4%) |
| $12,500 to $14,999 | 16 (1.2%) | 25 (2.3%) |
| $15,000 to $17,499 | 14 (1.1%) | 109 (10.1%) |
| $17,500 to $19,999 | 11 (0.8%) | 32 (2.9%) |
| $20,000 to $22,499 | 59 (4.5%) | 40 (3.7%) |
| $22,500 to $24,999 | 19 (1.5%) | 98 (9.0%) |
| $25,000 to $29,999 | 38 (2.9%) | 148 (13.7%) |
| $30,000 to $34,999 | 137 (10.5%) | 50 (4.6%) |
| $35,000 to $39,999 | 41 (3.1%) | 29 (2.7%) |
| $40,000 to $44,999 | 150 (11.5%) | 48 (4.4%) |
| $45,000 to $49,999 | 86 (6.6%) | 45 (4.2%) |
| $50,000 to $54,999 | 64 (4.9%) | 21 (1.9%) |
| $55,000 to $64,999 | 169 (13.0%) | 40 (3.7%) |
| $65,000 to $74,999 | 57 (4.4%) | 45 (4.2%) |
| $75,000 to $99,999 | 108 (8.3%) | 31 (2.9%) |
| $100,000+ | 87 (6.7%) | 68 (6.3%) |
| Total | 1,304 (100.0%) | 1,084 (100.0%) |
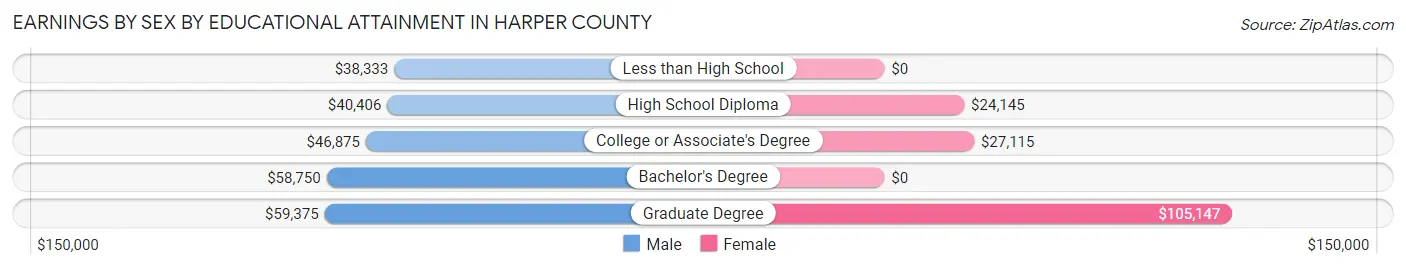
Earnings by Sex by Educational Attainment in Harper County
Average earnings in Harper County are $42,316 for men and $26,318 for women, a difference of 37.8%. Men with an educational attainment of graduate degree enjoy the highest average annual earnings of $59,375, while those with less than high school education earn the least with $38,333. Women with an educational attainment of graduate degree earn the most with the average annual earnings of $105,147, while those with high school diploma education have the smallest earnings of $24,145.
| Educational Attainment | Male Income | Female Income |
| Less than High School | $38,333 | $0 |
| High School Diploma | $40,406 | $24,145 |
| College or Associate's Degree | $46,875 | $27,115 |
| Bachelor's Degree | $58,750 | $0 |
| Graduate Degree | $59,375 | $105,147 |
| Total | $42,316 | $26,318 |
Family Income in Harper County
Family Income Brackets in Harper County
According to the Harper County family income data, there are 345 families falling into the $50,000 to $74,999 income range, which is the most common income bracket and makes up 25.6% of all families. Conversely, the $10,000 to $14,999 income bracket is the least frequent group with only 24 families (1.8%) belonging to this category.
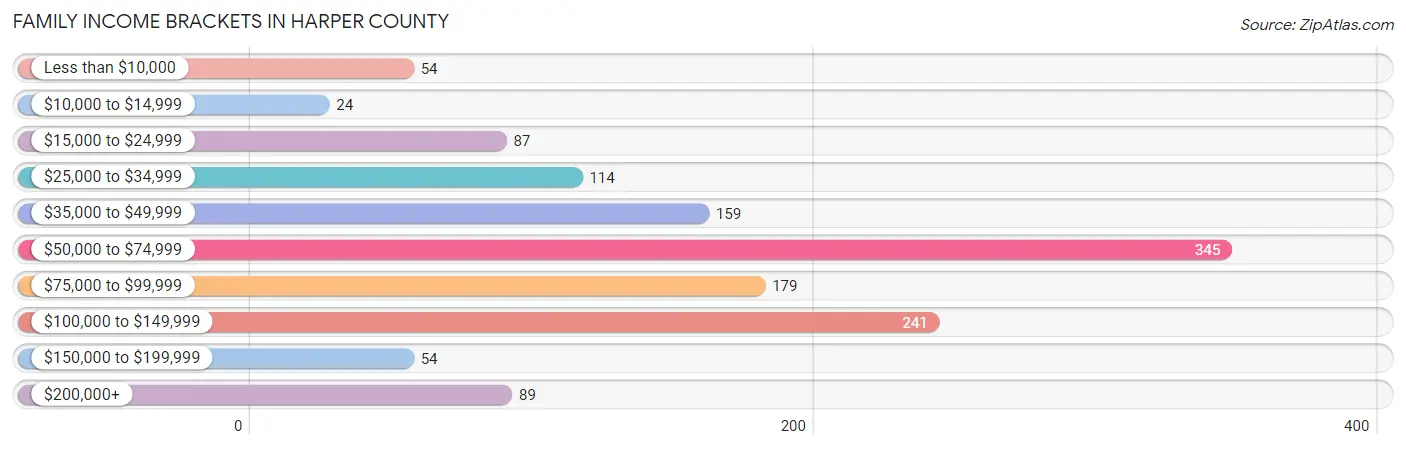
| Income Bracket | # Families | % Families |
| Less than $10,000 | 54 | 4.0% |
| $10,000 to $14,999 | 24 | 1.8% |
| $15,000 to $24,999 | 87 | 6.5% |
| $25,000 to $34,999 | 114 | 8.5% |
| $35,000 to $49,999 | 159 | 11.8% |
| $50,000 to $74,999 | 345 | 25.6% |
| $75,000 to $99,999 | 179 | 13.3% |
| $100,000 to $149,999 | 241 | 17.9% |
| $150,000 to $199,999 | 54 | 4.0% |
| $200,000+ | 89 | 6.6% |
Family Income by Famaliy Size in Harper County
5-person families (79 | 5.9%) account for the highest median family income in Harper County with $122,083 per family, while 2-person families (749 | 55.6%) have the highest median income of $32,756 per family member.
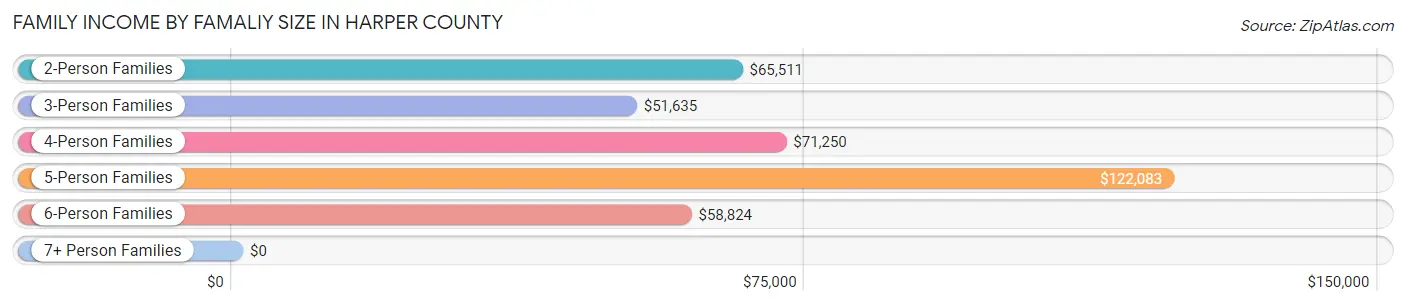
| Income Bracket | # Families | Median Income |
| 2-Person Families | 749 (55.6%) | $65,511 |
| 3-Person Families | 213 (15.8%) | $51,635 |
| 4-Person Families | 202 (15.0%) | $71,250 |
| 5-Person Families | 79 (5.9%) | $122,083 |
| 6-Person Families | 50 (3.7%) | $58,824 |
| 7+ Person Families | 53 (3.9%) | $0 |
| Total | 1,346 (100.0%) | $64,750 |
Family Income by Number of Earners in Harper County
The median family income in Harper County is $64,750, with families comprising 3+ earners (45) having the highest median family income of $113,393, while families with no earners (246) have the lowest median family income of $51,667, accounting for 3.3% and 18.3% of families, respectively.
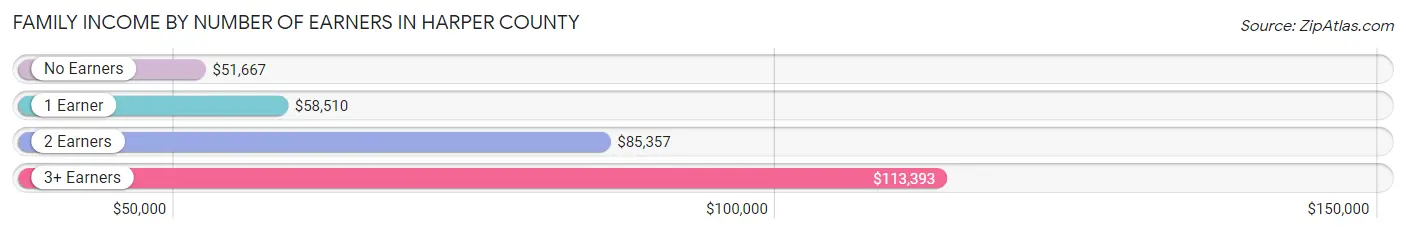
| Number of Earners | # Families | Median Income |
| No Earners | 246 (18.3%) | $51,667 |
| 1 Earner | 493 (36.6%) | $58,510 |
| 2 Earners | 562 (41.7%) | $85,357 |
| 3+ Earners | 45 (3.3%) | $113,393 |
| Total | 1,346 (100.0%) | $64,750 |
Household Income in Harper County
Household Income Brackets in Harper County
With 536 households falling in the category, the $50,000 to $74,999 income range is the most frequent in Harper County, accounting for 24.5% of all households. In contrast, only 72 households (3.3%) fall into the $150,000 to $199,999 income bracket, making it the least populous group.
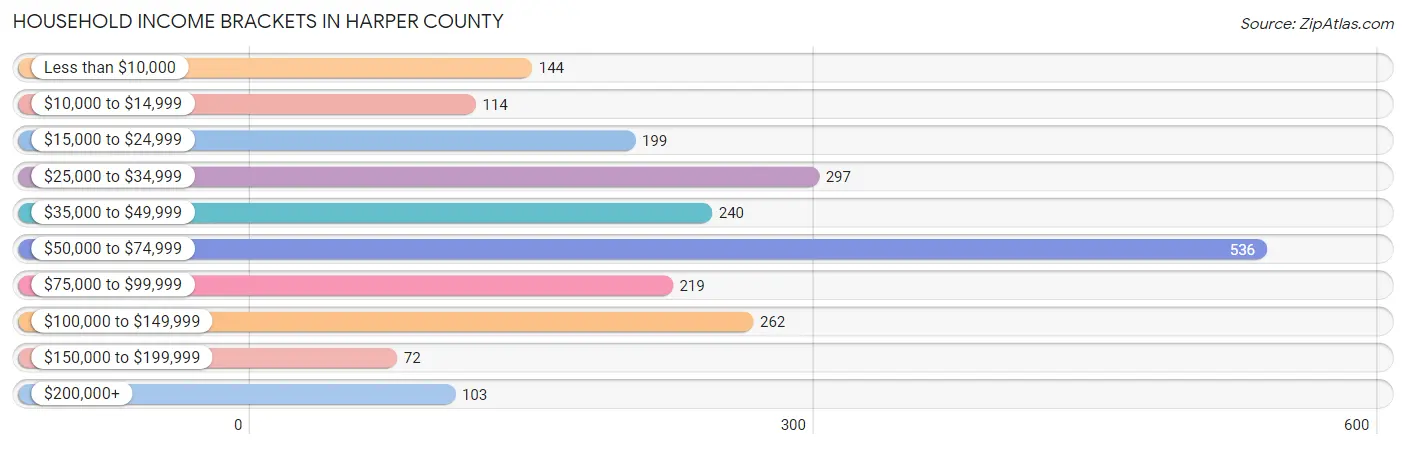
| Income Bracket | # Households | % Households |
| Less than $10,000 | 144 | 6.6% |
| $10,000 to $14,999 | 114 | 5.2% |
| $15,000 to $24,999 | 199 | 9.1% |
| $25,000 to $34,999 | 297 | 13.6% |
| $35,000 to $49,999 | 240 | 11.0% |
| $50,000 to $74,999 | 536 | 24.5% |
| $75,000 to $99,999 | 219 | 10.0% |
| $100,000 to $149,999 | 262 | 12.0% |
| $150,000 to $199,999 | 72 | 3.3% |
| $200,000+ | 103 | 4.7% |
Household Income by Householder Age in Harper County
The median household income in Harper County is $53,032, with the highest median household income of $60,284 found in the 25 to 44 years age bracket for the primary householder. A total of 629 households (28.8%) fall into this category. Meanwhile, the 15 to 24 years age bracket for the primary householder has the lowest median household income of $16,488, with 85 households (3.9%) in this group.
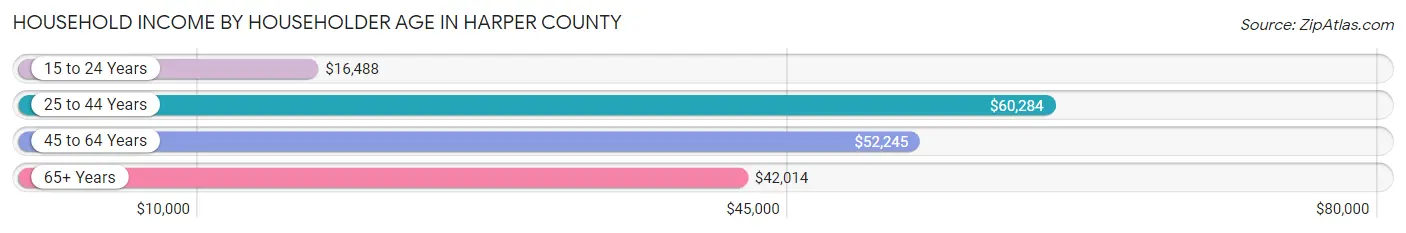
| Income Bracket | # Households | Median Income |
| 15 to 24 Years | 85 (3.9%) | $16,488 |
| 25 to 44 Years | 629 (28.8%) | $60,284 |
| 45 to 64 Years | 749 (34.3%) | $52,245 |
| 65+ Years | 723 (33.1%) | $42,014 |
| Total | 2,186 (100.0%) | $53,032 |
Poverty in Harper County
Income Below Poverty by Sex and Age in Harper County
With 15.2% poverty level for males and 15.8% for females among the residents of Harper County, 5 year old males and under 5 year old females are the most vulnerable to poverty, with 9 males (42.9%) and 58 females (31.0%) in their respective age groups living below the poverty level.
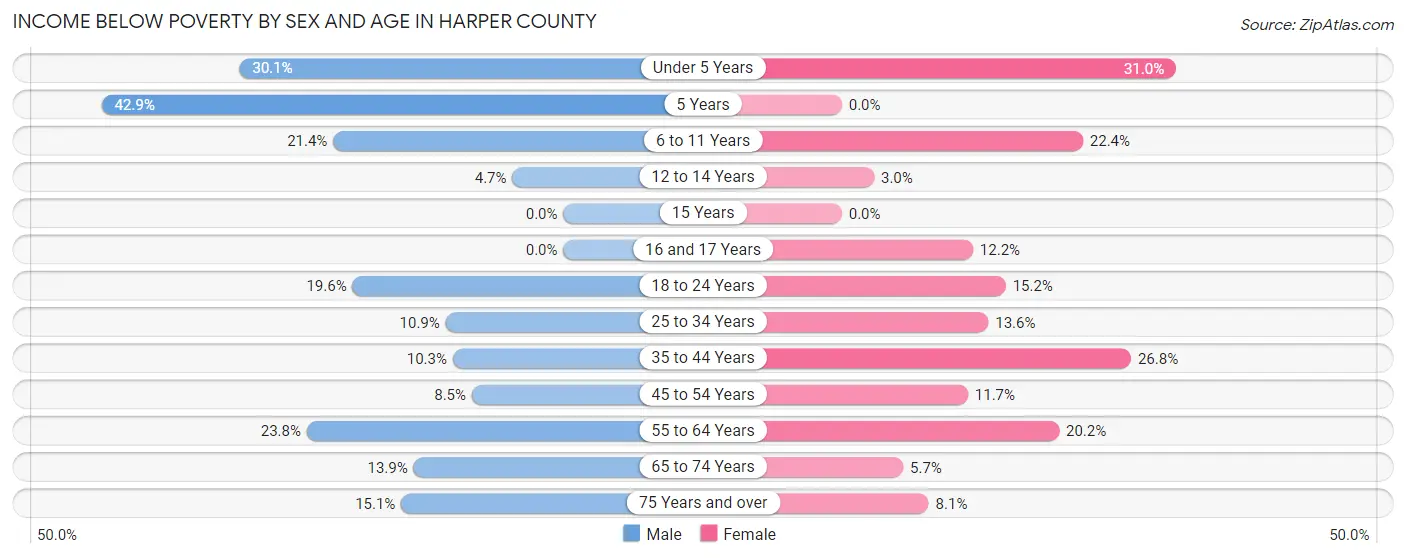
| Age Bracket | Male | Female |
| Under 5 Years | 46 (30.1%) | 58 (31.0%) |
| 5 Years | 9 (42.9%) | 0 (0.0%) |
| 6 to 11 Years | 44 (21.4%) | 66 (22.4%) |
| 12 to 14 Years | 7 (4.7%) | 2 (3.0%) |
| 15 Years | 0 (0.0%) | 0 (0.0%) |
| 16 and 17 Years | 0 (0.0%) | 14 (12.2%) |
| 18 to 24 Years | 36 (19.6%) | 33 (15.2%) |
| 25 to 34 Years | 27 (10.9%) | 31 (13.6%) |
| 35 to 44 Years | 35 (10.3%) | 73 (26.8%) |
| 45 to 54 Years | 23 (8.5%) | 33 (11.7%) |
| 55 to 64 Years | 95 (23.8%) | 77 (20.2%) |
| 65 to 74 Years | 46 (13.9%) | 19 (5.7%) |
| 75 Years and over | 31 (15.0%) | 20 (8.1%) |
| Total | 399 (15.2%) | 426 (15.8%) |
Income Above Poverty by Sex and Age in Harper County
According to the poverty statistics in Harper County, males aged 15 years and females aged 5 years are the age groups that are most secure financially, with 100.0% of males and 100.0% of females in these age groups living above the poverty line.
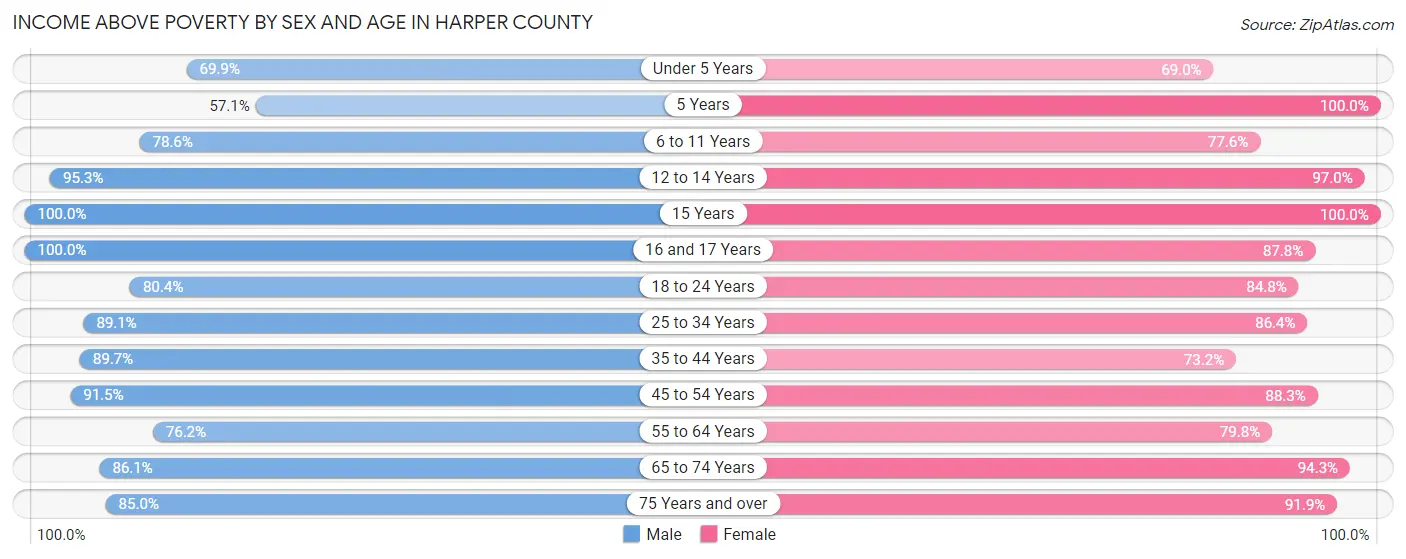
| Age Bracket | Male | Female |
| Under 5 Years | 107 (69.9%) | 129 (69.0%) |
| 5 Years | 12 (57.1%) | 15 (100.0%) |
| 6 to 11 Years | 162 (78.6%) | 229 (77.6%) |
| 12 to 14 Years | 141 (95.3%) | 65 (97.0%) |
| 15 Years | 39 (100.0%) | 51 (100.0%) |
| 16 and 17 Years | 73 (100.0%) | 101 (87.8%) |
| 18 to 24 Years | 148 (80.4%) | 184 (84.8%) |
| 25 to 34 Years | 220 (89.1%) | 197 (86.4%) |
| 35 to 44 Years | 306 (89.7%) | 199 (73.2%) |
| 45 to 54 Years | 248 (91.5%) | 249 (88.3%) |
| 55 to 64 Years | 304 (76.2%) | 305 (79.8%) |
| 65 to 74 Years | 285 (86.1%) | 315 (94.3%) |
| 75 Years and over | 175 (85.0%) | 228 (91.9%) |
| Total | 2,220 (84.8%) | 2,267 (84.2%) |
Income Below Poverty Among Married-Couple Families in Harper County
The poverty statistics for married-couple families in Harper County show that 6.9% or 69 of the total 1,000 families live below the poverty line. Families with 5 or more children have the highest poverty rate of 90.3%, comprising of 28 families. On the other hand, families with no children have the lowest poverty rate of 2.8%, which includes 17 families.
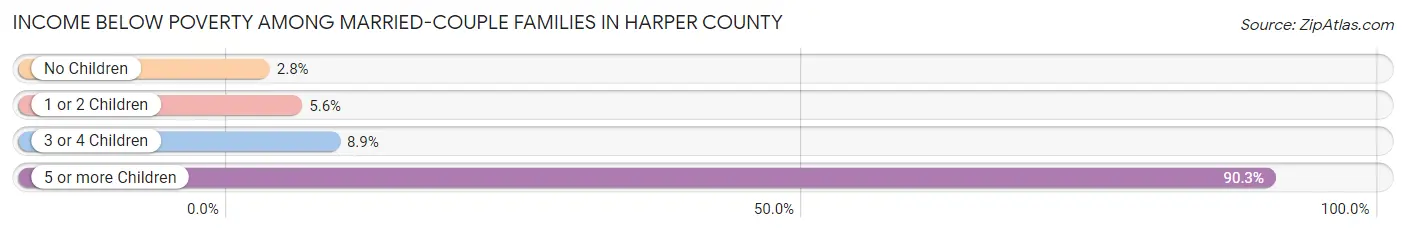
| Children | Above Poverty | Below Poverty |
| No Children | 596 (97.2%) | 17 (2.8%) |
| 1 or 2 Children | 219 (94.4%) | 13 (5.6%) |
| 3 or 4 Children | 113 (91.1%) | 11 (8.9%) |
| 5 or more Children | 3 (9.7%) | 28 (90.3%) |
| Total | 931 (93.1%) | 69 (6.9%) |
Income Below Poverty Among Single-Parent Households in Harper County
According to the poverty data in Harper County, 4.7% or 7 single-father households and 31.5% or 62 single-mother households are living below the poverty line. Among single-father households, those with no children have the highest poverty rate, with 7 households (8.7%) experiencing poverty. Likewise, among single-mother households, those with 1 or 2 children have the highest poverty rate, with 48 households (43.2%) falling below the poverty line.
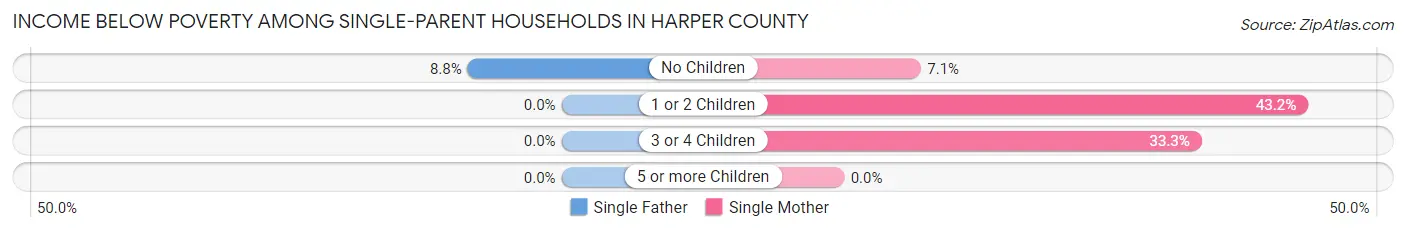
| Children | Single Father | Single Mother |
| No Children | 7 (8.7%) | 4 (7.1%) |
| 1 or 2 Children | 0 (0.0%) | 48 (43.2%) |
| 3 or 4 Children | 0 (0.0%) | 10 (33.3%) |
| 5 or more Children | 0 (0.0%) | 0 (0.0%) |
| Total | 7 (4.7%) | 62 (31.5%) |
Income Below Poverty Among Married-Couple vs Single-Parent Households in Harper County
The poverty data for Harper County shows that 69 of the married-couple family households (6.9%) and 69 of the single-parent households (19.9%) are living below the poverty level. Within the married-couple family households, those with 5 or more children have the highest poverty rate, with 28 households (90.3%) falling below the poverty line. Among the single-parent households, those with 1 or 2 children have the highest poverty rate, with 48 household (28.4%) living below poverty.
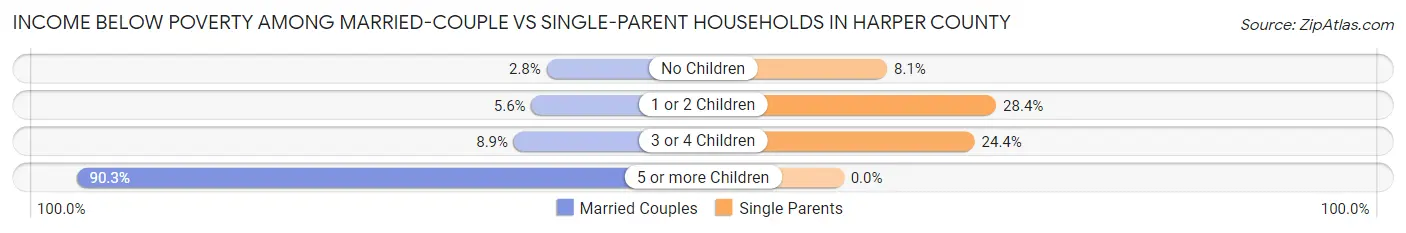
| Children | Married-Couple Families | Single-Parent Households |
| No Children | 17 (2.8%) | 11 (8.1%) |
| 1 or 2 Children | 13 (5.6%) | 48 (28.4%) |
| 3 or 4 Children | 11 (8.9%) | 10 (24.4%) |
| 5 or more Children | 28 (90.3%) | 0 (0.0%) |
| Total | 69 (6.9%) | 69 (19.9%) |
Race in Harper County
The most populous races in Harper County are White / Caucasian (4,970 | 91.1%), Hispanic or Latino (388 | 7.1%), and Two or more Races (282 | 5.2%).
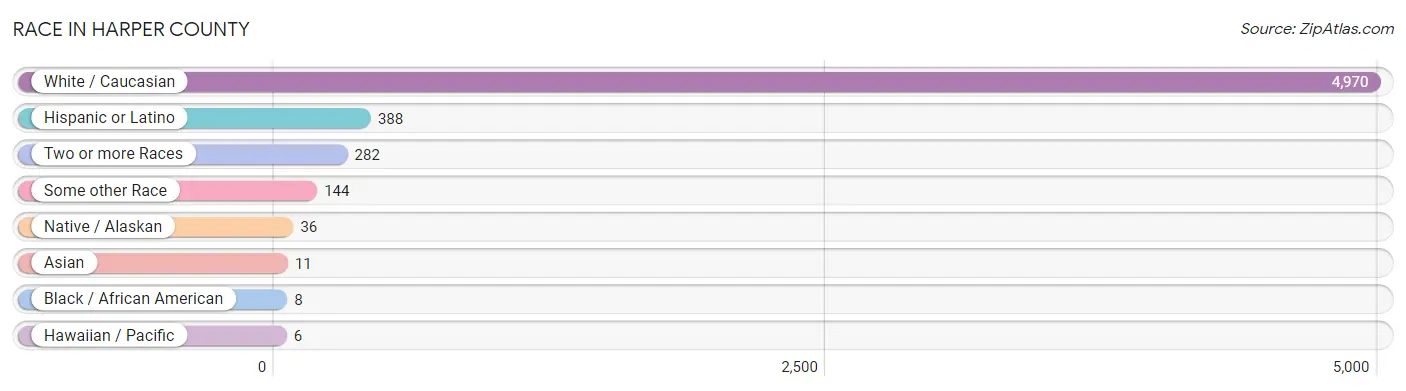
| Race | # Population | % Population |
| Asian | 11 | 0.2% |
| Black / African American | 8 | 0.2% |
| Hawaiian / Pacific | 6 | 0.1% |
| Hispanic or Latino | 388 | 7.1% |
| Native / Alaskan | 36 | 0.7% |
| White / Caucasian | 4,970 | 91.1% |
| Two or more Races | 282 | 5.2% |
| Some other Race | 144 | 2.6% |
| Total | 5,457 | 100.0% |
Ancestry in Harper County
The most populous ancestries reported in Harper County are German (1,222 | 22.4%), English (607 | 11.1%), Irish (482 | 8.8%), American (424 | 7.8%), and Mexican (279 | 5.1%), together accounting for 55.2% of all Harper County residents.
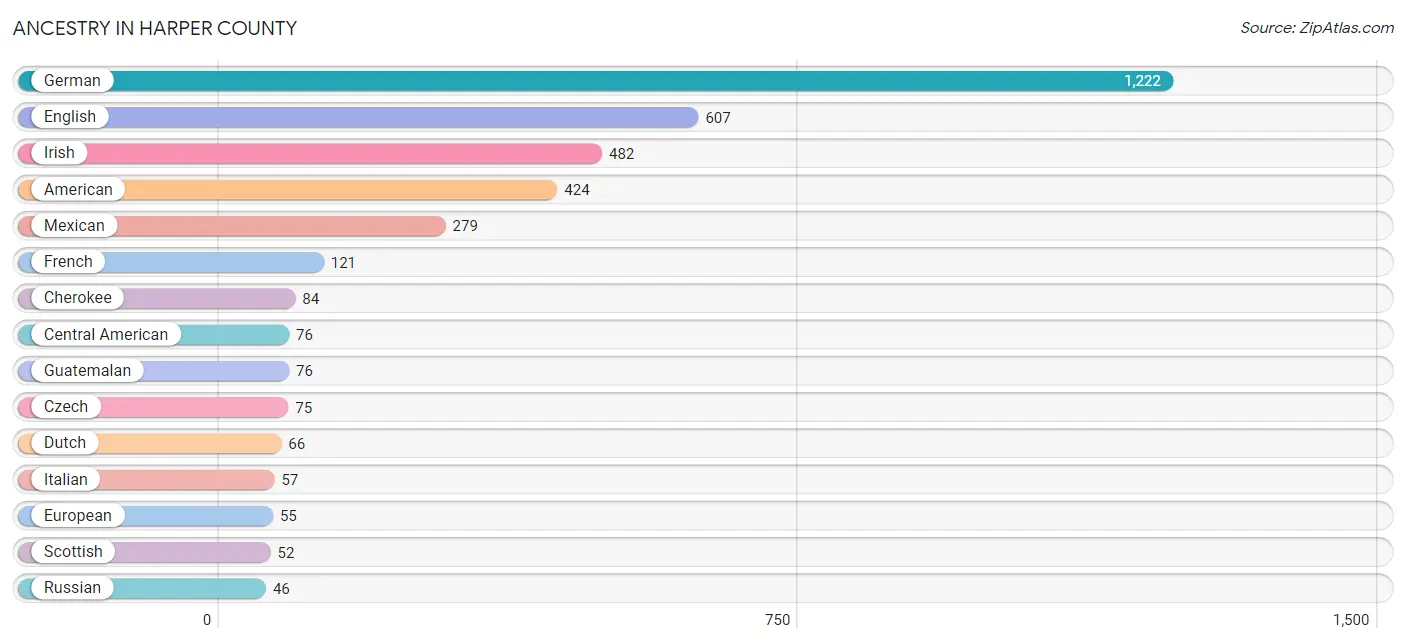
| Ancestry | # Population | % Population |
| American | 424 | 7.8% |
| Apache | 5 | 0.1% |
| Austrian | 8 | 0.2% |
| Blackfeet | 25 | 0.5% |
| British | 14 | 0.3% |
| Central American | 76 | 1.4% |
| Cherokee | 84 | 1.5% |
| Chickasaw | 3 | 0.1% |
| Choctaw | 39 | 0.7% |
| Comanche | 3 | 0.1% |
| Creek | 5 | 0.1% |
| Cuban | 6 | 0.1% |
| Czech | 75 | 1.4% |
| Czechoslovakian | 12 | 0.2% |
| Dutch | 66 | 1.2% |
| English | 607 | 11.1% |
| European | 55 | 1.0% |
| French | 121 | 2.2% |
| French Canadian | 2 | 0.0% |
| German | 1,222 | 22.4% |
| Guatemalan | 76 | 1.4% |
| Irish | 482 | 8.8% |
| Italian | 57 | 1.0% |
| Kiowa | 1 | 0.0% |
| Korean | 12 | 0.2% |
| Lumbee | 8 | 0.2% |
| Mexican | 279 | 5.1% |
| Mexican American Indian | 6 | 0.1% |
| Native Hawaiian | 3 | 0.1% |
| Navajo | 13 | 0.2% |
| Norwegian | 12 | 0.2% |
| Pennsylvania German | 4 | 0.1% |
| Polish | 30 | 0.5% |
| Potawatomi | 3 | 0.1% |
| Russian | 46 | 0.8% |
| Scandinavian | 2 | 0.0% |
| Scotch-Irish | 37 | 0.7% |
| Scottish | 52 | 0.9% |
| Seminole | 5 | 0.1% |
| Spaniard | 22 | 0.4% |
| Swedish | 41 | 0.7% |
| Swiss | 20 | 0.4% |
| Thai | 6 | 0.1% |
| Welsh | 38 | 0.7% | View All 44 Rows |
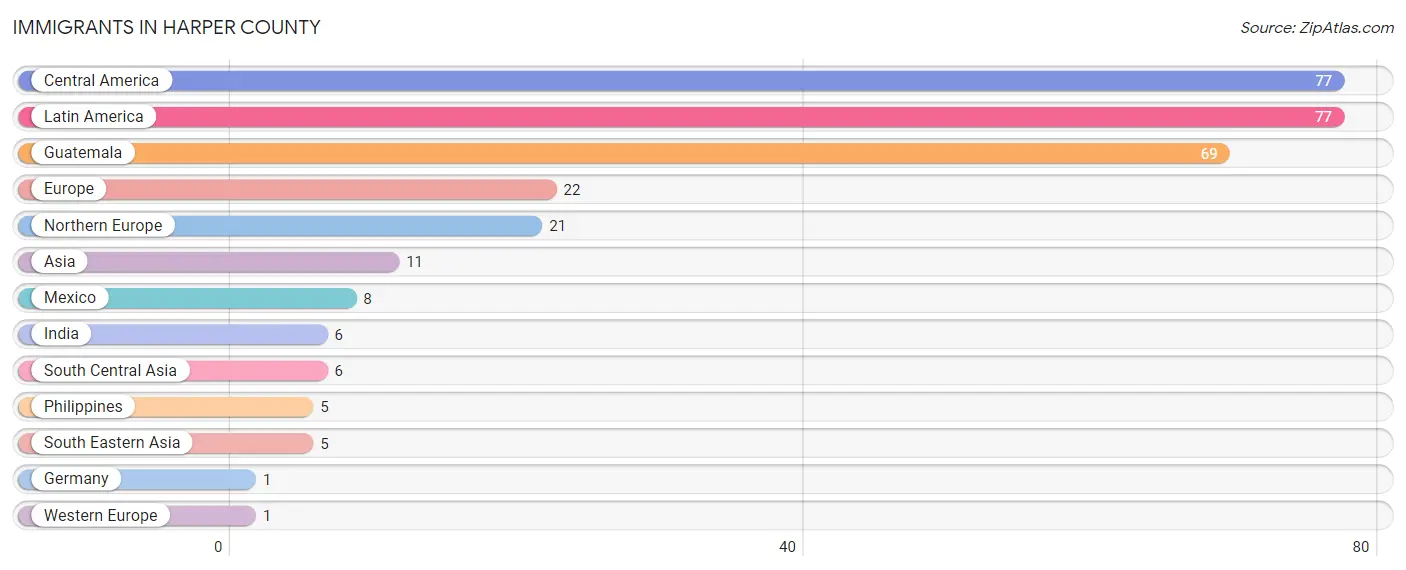
Immigrants in Harper County
The most numerous immigrant groups reported in Harper County came from Central America (77 | 1.4%), Latin America (77 | 1.4%), Guatemala (69 | 1.3%), Europe (22 | 0.4%), and Northern Europe (21 | 0.4%), together accounting for 4.9% of all Harper County residents.
| Immigration Origin | # Population | % Population |
| Asia | 11 | 0.2% |
| Central America | 77 | 1.4% |
| Europe | 22 | 0.4% |
| Germany | 1 | 0.0% |
| Guatemala | 69 | 1.3% |
| India | 6 | 0.1% |
| Latin America | 77 | 1.4% |
| Mexico | 8 | 0.2% |
| Northern Europe | 21 | 0.4% |
| Philippines | 5 | 0.1% |
| South Central Asia | 6 | 0.1% |
| South Eastern Asia | 5 | 0.1% |
| Western Europe | 1 | 0.0% | View All 13 Rows |
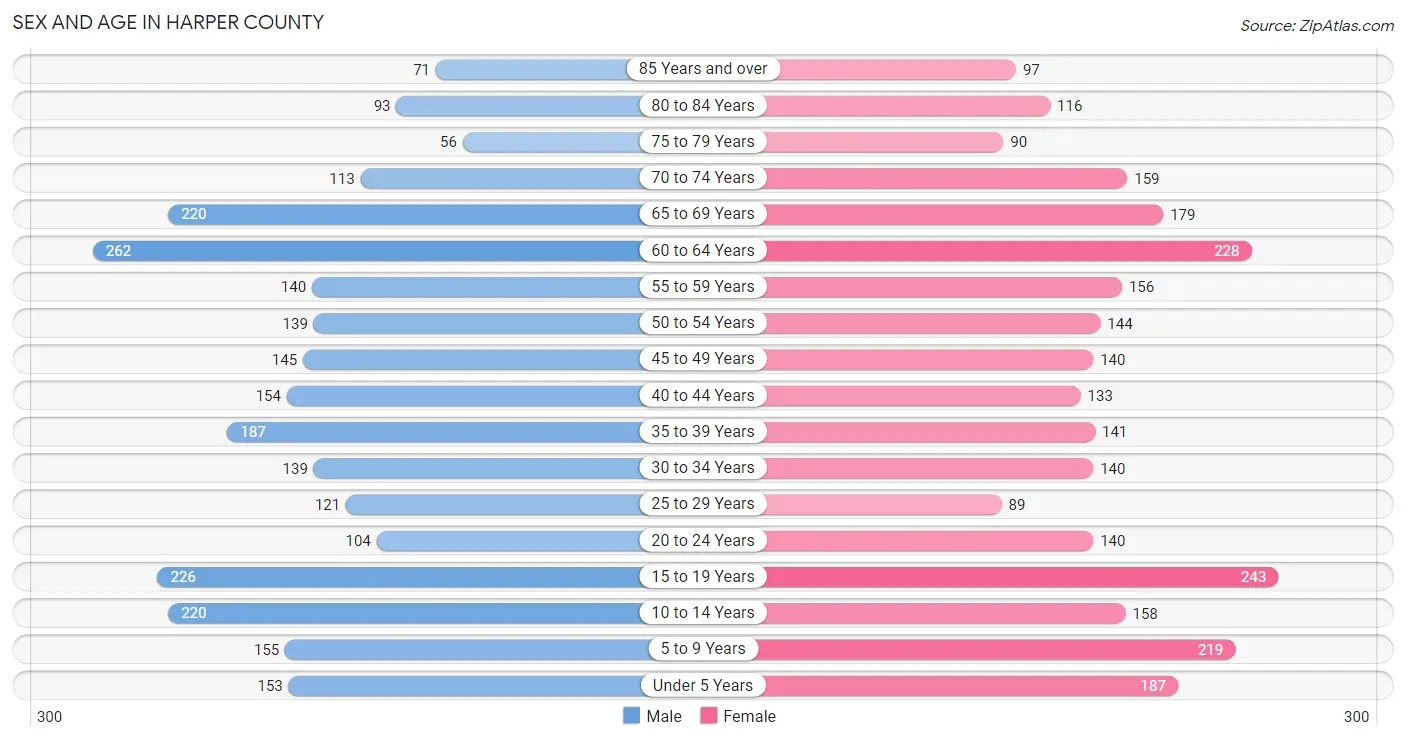
Sex and Age in Harper County
Sex and Age in Harper County
The most populous age groups in Harper County are 60 to 64 Years (262 | 9.7%) for men and 15 to 19 Years (243 | 8.8%) for women.
| Age Bracket | Male | Female |
| Under 5 Years | 153 (5.7%) | 187 (6.8%) |
| 5 to 9 Years | 155 (5.7%) | 219 (7.9%) |
| 10 to 14 Years | 220 (8.2%) | 158 (5.7%) |
| 15 to 19 Years | 226 (8.4%) | 243 (8.8%) |
| 20 to 24 Years | 104 (3.8%) | 140 (5.1%) |
| 25 to 29 Years | 121 (4.5%) | 89 (3.2%) |
| 30 to 34 Years | 139 (5.1%) | 140 (5.1%) |
| 35 to 39 Years | 187 (6.9%) | 141 (5.1%) |
| 40 to 44 Years | 154 (5.7%) | 133 (4.8%) |
| 45 to 49 Years | 145 (5.4%) | 140 (5.1%) |
| 50 to 54 Years | 139 (5.1%) | 144 (5.2%) |
| 55 to 59 Years | 140 (5.2%) | 156 (5.7%) |
| 60 to 64 Years | 262 (9.7%) | 228 (8.3%) |
| 65 to 69 Years | 220 (8.2%) | 179 (6.5%) |
| 70 to 74 Years | 113 (4.2%) | 159 (5.8%) |
| 75 to 79 Years | 56 (2.1%) | 90 (3.3%) |
| 80 to 84 Years | 93 (3.5%) | 116 (4.2%) |
| 85 Years and over | 71 (2.6%) | 97 (3.5%) |
| Total | 2,698 (100.0%) | 2,759 (100.0%) |
Families and Households in Harper County
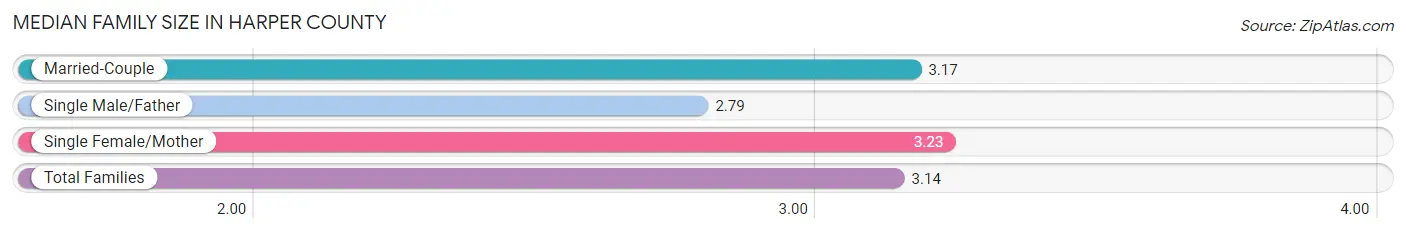
Median Family Size in Harper County
The median family size in Harper County is 3.14 persons per family, with single female/mother families (197 | 14.6%) accounting for the largest median family size of 3.23 persons per family. On the other hand, single male/father families (149 | 11.1%) represent the smallest median family size with 2.79 persons per family.
| Family Type | # Families | Family Size |
| Married-Couple | 1,000 (74.3%) | 3.17 |
| Single Male/Father | 149 (11.1%) | 2.79 |
| Single Female/Mother | 197 (14.6%) | 3.23 |
| Total Families | 1,346 (100.0%) | 3.14 |
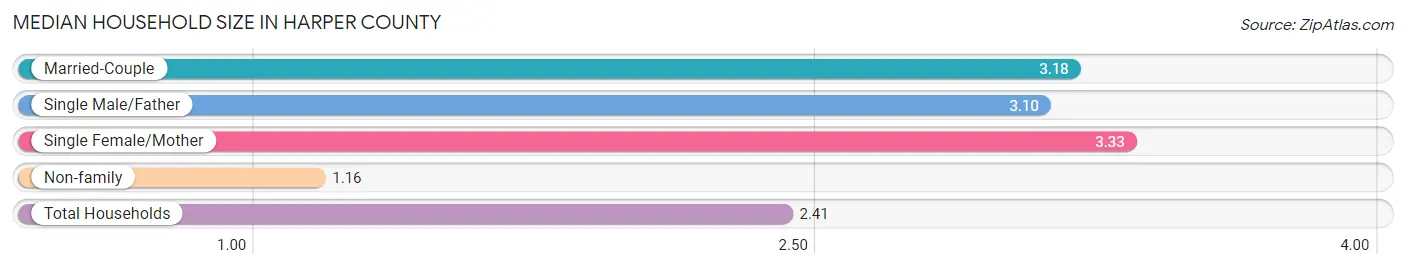
Median Household Size in Harper County
The median household size in Harper County is 2.41 persons per household, with single female/mother households (197 | 9.0%) accounting for the largest median household size of 3.33 persons per household. non-family households (840 | 38.4%) represent the smallest median household size with 1.16 persons per household.
| Household Type | # Households | Household Size |
| Married-Couple | 1,000 (45.8%) | 3.18 |
| Single Male/Father | 149 (6.8%) | 3.10 |
| Single Female/Mother | 197 (9.0%) | 3.33 |
| Non-family | 840 (38.4%) | 1.16 |
| Total Households | 2,186 (100.0%) | 2.41 |
Household Size by Marriage Status in Harper County
Out of a total of 2,186 households in Harper County, 1,346 (61.6%) are family households, while 840 (38.4%) are nonfamily households. The most numerous type of family households are 2-person households, comprising 749, and the most common type of nonfamily households are 1-person households, comprising 724.
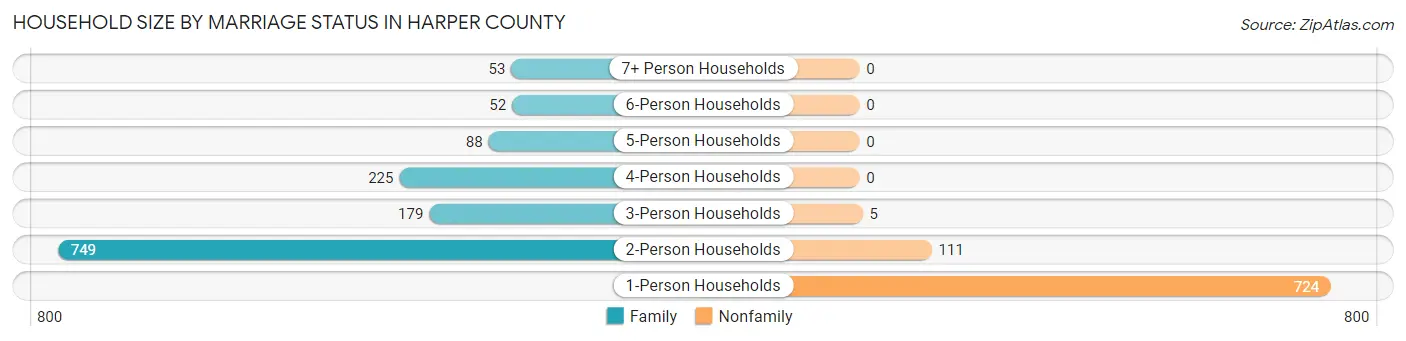
| Household Size | Family Households | Nonfamily Households |
| 1-Person Households | - | 724 (33.1%) |
| 2-Person Households | 749 (34.3%) | 111 (5.1%) |
| 3-Person Households | 179 (8.2%) | 5 (0.2%) |
| 4-Person Households | 225 (10.3%) | 0 (0.0%) |
| 5-Person Households | 88 (4.0%) | 0 (0.0%) |
| 6-Person Households | 52 (2.4%) | 0 (0.0%) |
| 7+ Person Households | 53 (2.4%) | 0 (0.0%) |
| Total | 1,346 (61.6%) | 840 (38.4%) |
Female Fertility in Harper County
Fertility by Age in Harper County
Average fertility rate in Harper County is 102.0 births per 1,000 women. Women in the age bracket of 20 to 34 years have the highest fertility rate with 192.0 births per 1,000 women. Women in the age bracket of 20 to 34 years acount for 65.7% of all women with births.
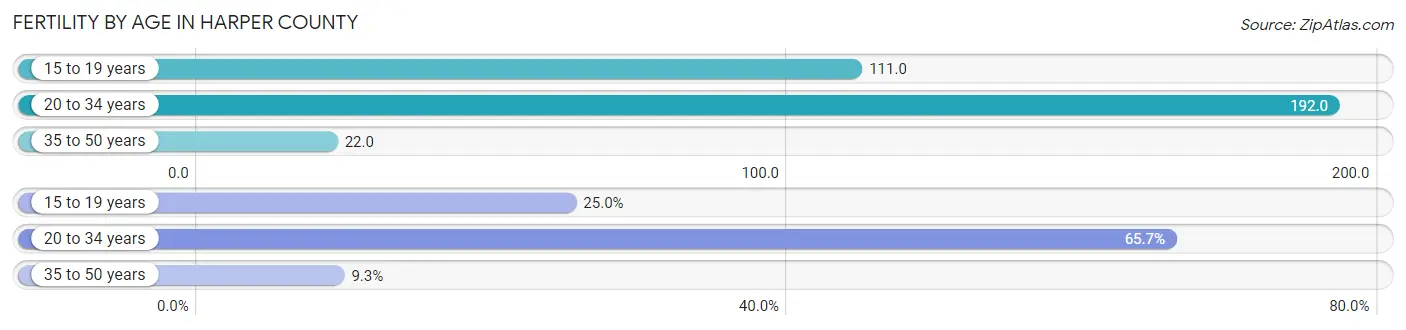
| Age Bracket | Women with Births | Births / 1,000 Women |
| 15 to 19 years | 27 (25.0%) | 111.0 |
| 20 to 34 years | 71 (65.7%) | 192.0 |
| 35 to 50 years | 10 (9.3%) | 22.0 |
| Total | 108 (100.0%) | 102.0 |
Fertility by Age by Marriage Status in Harper County
58.3% of women with births (108) in Harper County are married. The highest percentage of unmarried women with births falls into 15 to 19 years age bracket with 100.0% of them unmarried at the time of birth, while the lowest percentage of unmarried women with births belong to 35 to 50 years age bracket with 0.0% of them unmarried.
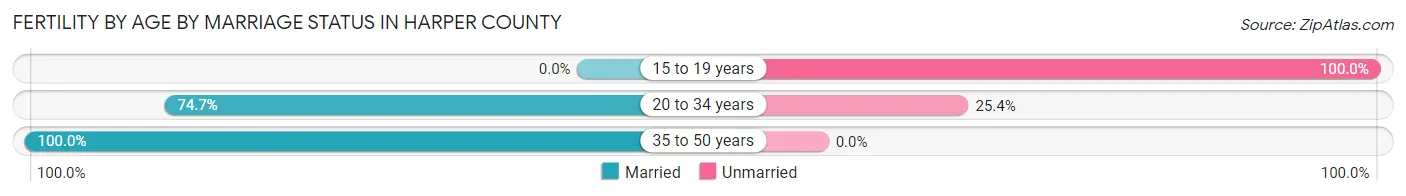
| Age Bracket | Married | Unmarried |
| 15 to 19 years | 0 (0.0%) | 27 (100.0%) |
| 20 to 34 years | 53 (74.7%) | 18 (25.4%) |
| 35 to 50 years | 10 (100.0%) | 0 (0.0%) |
| Total | 63 (58.3%) | 45 (41.7%) |
Fertility by Education in Harper County
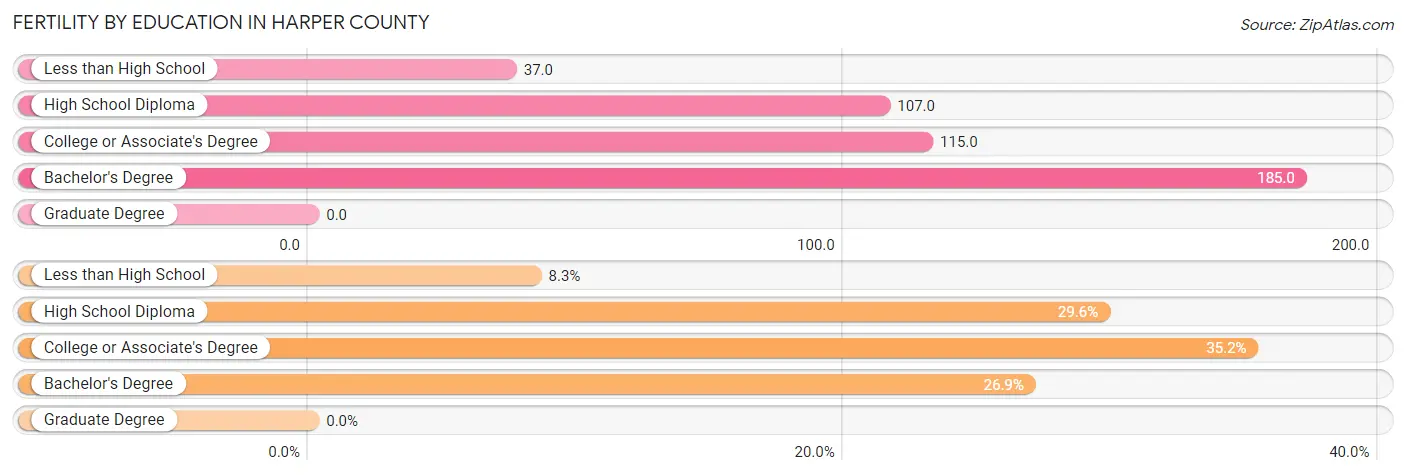
| Educational Attainment | Women with Births | Births / 1,000 Women |
| Less than High School | 9 (8.3%) | 37.0 |
| High School Diploma | 32 (29.6%) | 107.0 |
| College or Associate's Degree | 38 (35.2%) | 115.0 |
| Bachelor's Degree | 29 (26.9%) | 185.0 |
| Graduate Degree | 0 (0.0%) | 0.0 |
| Total | 108 (100.0%) | 102.0 |
Fertility by Education by Marriage Status in Harper County
41.7% of women with births in Harper County are unmarried. Women with the educational attainment of less than high school are most likely to be married with 100.0% of them married at childbirth, while women with the educational attainment of high school diploma are least likely to be married with 84.4% of them unmarried at childbirth.
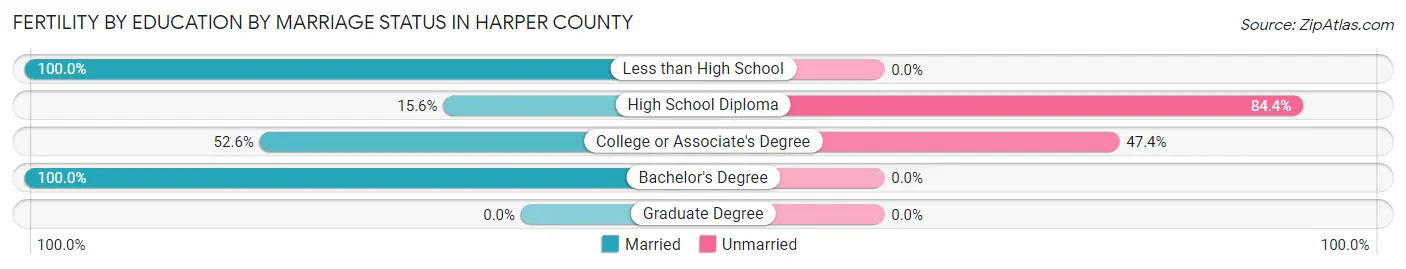
| Educational Attainment | Married | Unmarried |
| Less than High School | 9 (100.0%) | 0 (0.0%) |
| High School Diploma | 5 (15.6%) | 27 (84.4%) |
| College or Associate's Degree | 20 (52.6%) | 18 (47.4%) |
| Bachelor's Degree | 29 (100.0%) | 0 (0.0%) |
| Graduate Degree | 0 (0.0%) | 0 (0.0%) |
| Total | 63 (58.3%) | 45 (41.7%) |
Employment Characteristics in Harper County
Employment by Class of Employer in Harper County
Among the 2,140 employed individuals in Harper County, private company employees (1,192 | 55.7%), not-for-profit organizations (311 | 14.5%), and local government employees (231 | 10.8%) make up the most common classes of employment.
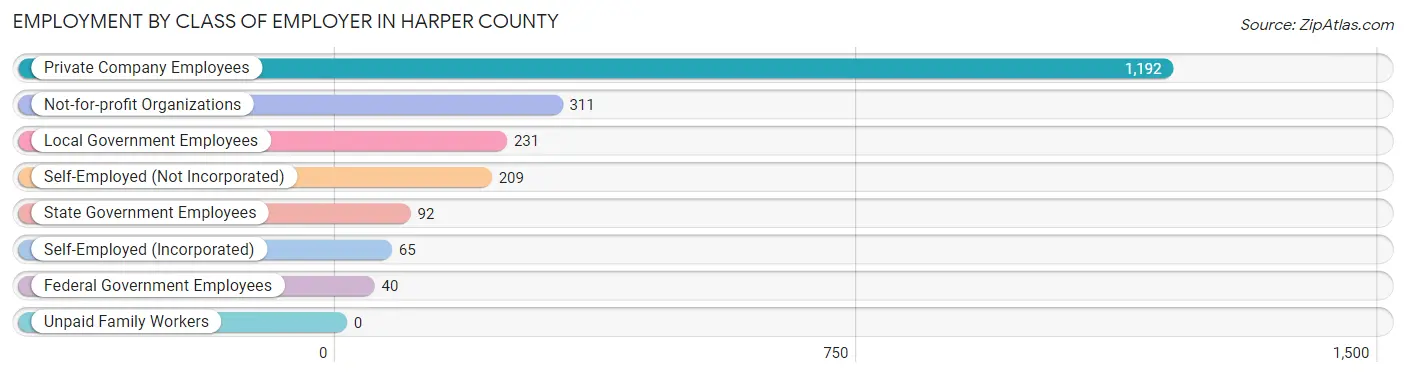
| Employer Class | # Employees | % Employees |
| Private Company Employees | 1,192 | 55.7% |
| Self-Employed (Incorporated) | 65 | 3.0% |
| Self-Employed (Not Incorporated) | 209 | 9.8% |
| Not-for-profit Organizations | 311 | 14.5% |
| Local Government Employees | 231 | 10.8% |
| State Government Employees | 92 | 4.3% |
| Federal Government Employees | 40 | 1.9% |
| Unpaid Family Workers | 0 | 0.0% |
| Total | 2,140 | 100.0% |
Employment Status by Age in Harper County
According to the labor force statistics for Harper County, out of the total population over 16 years of age (4,275), 53.5% or 2,287 individuals are in the labor force, with 5.3% or 121 of them unemployed. The age group with the highest labor force participation rate is 25 to 29 years, with 91.4% or 192 individuals in the labor force. Within the labor force, the 16 to 19 years age range has the highest percentage of unemployed individuals, with 35.9% or 66 of them being unemployed.
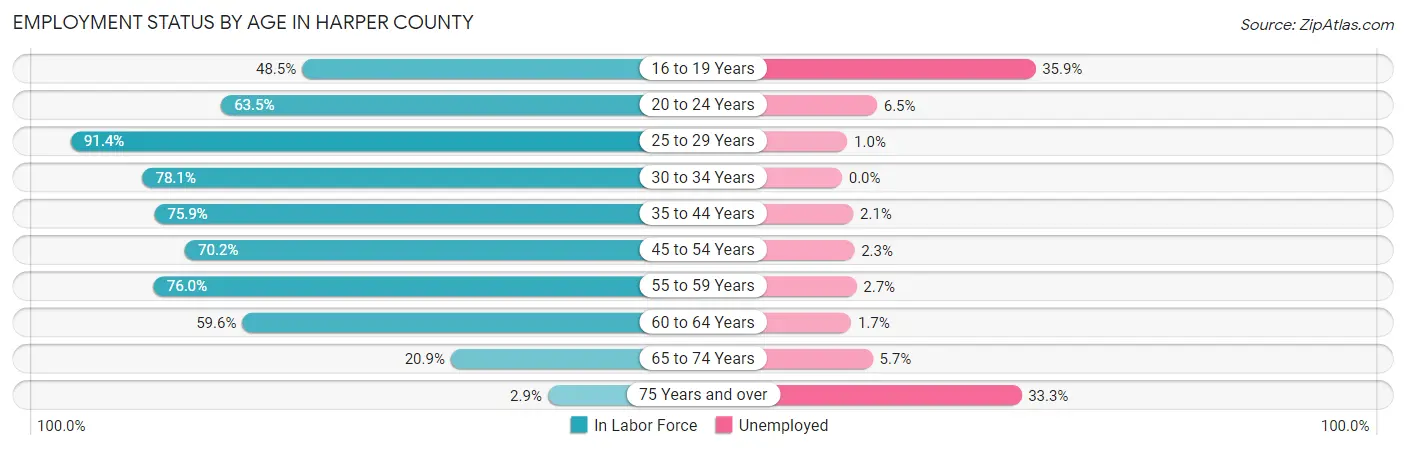
| Age Bracket | In Labor Force | Unemployed |
| 16 to 19 Years | 184 (48.5%) | 66 (35.9%) |
| 20 to 24 Years | 155 (63.5%) | 10 (6.5%) |
| 25 to 29 Years | 192 (91.4%) | 2 (1.0%) |
| 30 to 34 Years | 218 (78.1%) | 0 (0.0%) |
| 35 to 44 Years | 467 (75.9%) | 10 (2.1%) |
| 45 to 54 Years | 399 (70.2%) | 9 (2.3%) |
| 55 to 59 Years | 225 (76.0%) | 6 (2.7%) |
| 60 to 64 Years | 292 (59.6%) | 5 (1.7%) |
| 65 to 74 Years | 140 (20.9%) | 8 (5.7%) |
| 75 Years and over | 15 (2.9%) | 5 (33.3%) |
| Total | 2,287 (53.5%) | 121 (5.3%) |
Employment Status by Educational Attainment in Harper County
According to labor force statistics for Harper County, 72.9% of individuals (1,792) out of the total population between 25 and 64 years of age (2,458) are in the labor force, with 1.8% or 32 of them being unemployed. The group with the highest labor force participation rate are those with the educational attainment of bachelor's degree or higher, with 85.1% or 342 individuals in the labor force. Within the labor force, individuals with less than high school education have the highest percentage of unemployment, with 20.2% or 20 of them being unemployed.
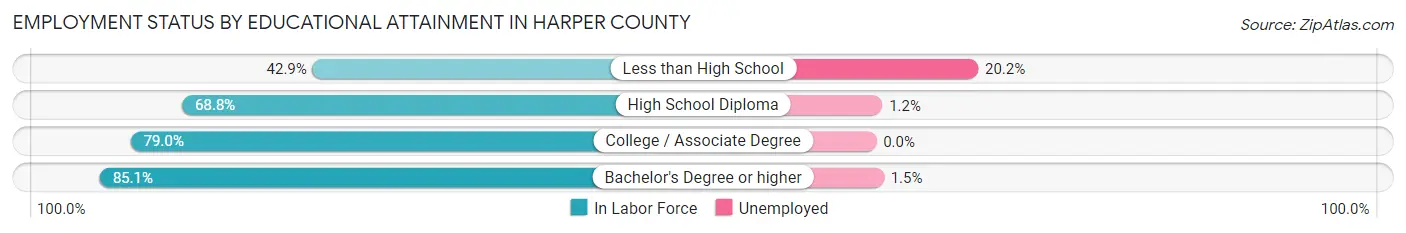
| Educational Attainment | In Labor Force | Unemployed |
| Less than High School | 99 (42.9%) | 47 (20.2%) |
| High School Diploma | 603 (68.8%) | 11 (1.2%) |
| College / Associate Degree | 749 (79.0%) | 0 (0.0%) |
| Bachelor's Degree or higher | 342 (85.1%) | 6 (1.5%) |
| Total | 1,792 (72.9%) | 44 (1.8%) |
Employment Occupations by Sex in Harper County
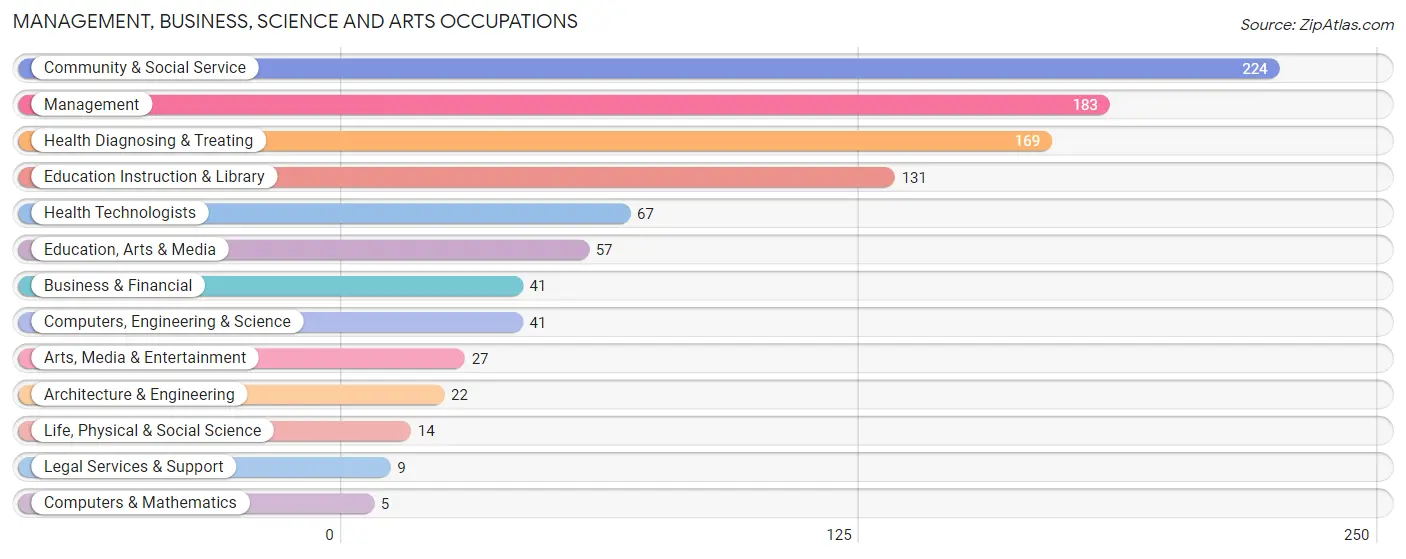
Management, Business, Science and Arts Occupations
The most common Management, Business, Science and Arts occupations in Harper County are Community & Social Service (224 | 10.3%), Management (183 | 8.5%), Health Diagnosing & Treating (169 | 7.8%), Education Instruction & Library (131 | 6.0%), and Health Technologists (67 | 3.1%).
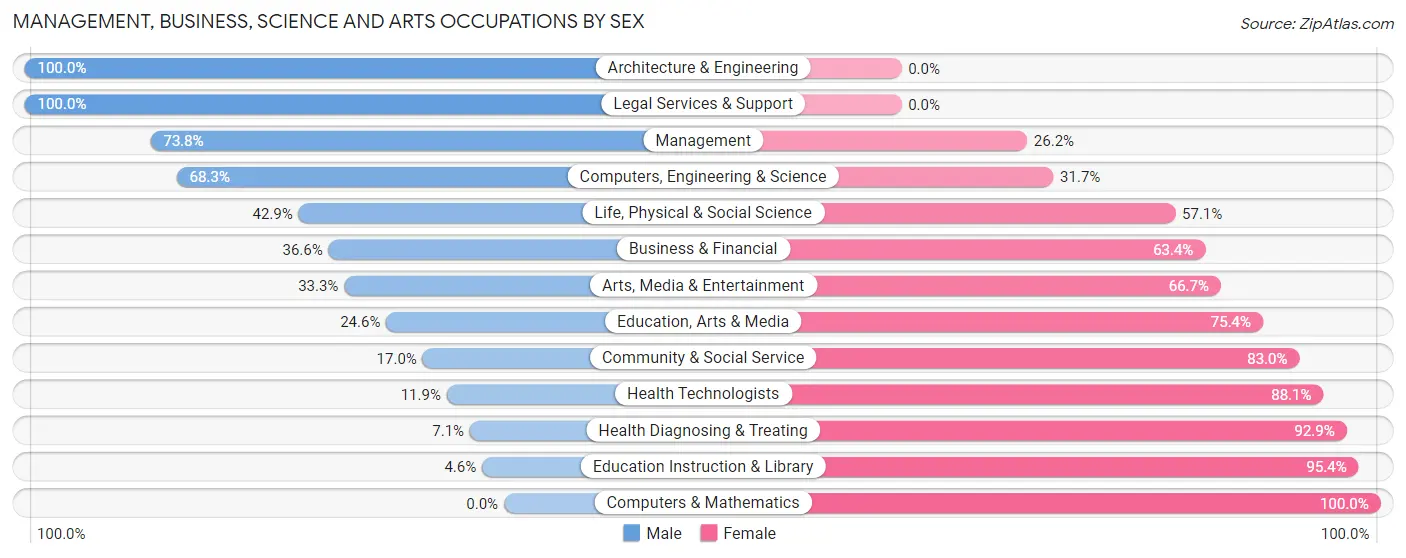
Management, Business, Science and Arts Occupations by Sex
Within the Management, Business, Science and Arts occupations in Harper County, the most male-oriented occupations are Architecture & Engineering (100.0%), Legal Services & Support (100.0%), and Management (73.8%), while the most female-oriented occupations are Computers & Mathematics (100.0%), Education Instruction & Library (95.4%), and Health Diagnosing & Treating (92.9%).
| Occupation | Male | Female |
| Management | 135 (73.8%) | 48 (26.2%) |
| Business & Financial | 15 (36.6%) | 26 (63.4%) |
| Computers, Engineering & Science | 28 (68.3%) | 13 (31.7%) |
| Computers & Mathematics | 0 (0.0%) | 5 (100.0%) |
| Architecture & Engineering | 22 (100.0%) | 0 (0.0%) |
| Life, Physical & Social Science | 6 (42.9%) | 8 (57.1%) |
| Community & Social Service | 38 (17.0%) | 186 (83.0%) |
| Education, Arts & Media | 14 (24.6%) | 43 (75.4%) |
| Legal Services & Support | 9 (100.0%) | 0 (0.0%) |
| Education Instruction & Library | 6 (4.6%) | 125 (95.4%) |
| Arts, Media & Entertainment | 9 (33.3%) | 18 (66.7%) |
| Health Diagnosing & Treating | 12 (7.1%) | 157 (92.9%) |
| Health Technologists | 8 (11.9%) | 59 (88.1%) |
| Total (Category) | 228 (34.6%) | 430 (65.3%) |
| Total (Overall) | 1,169 (54.0%) | 997 (46.0%) |
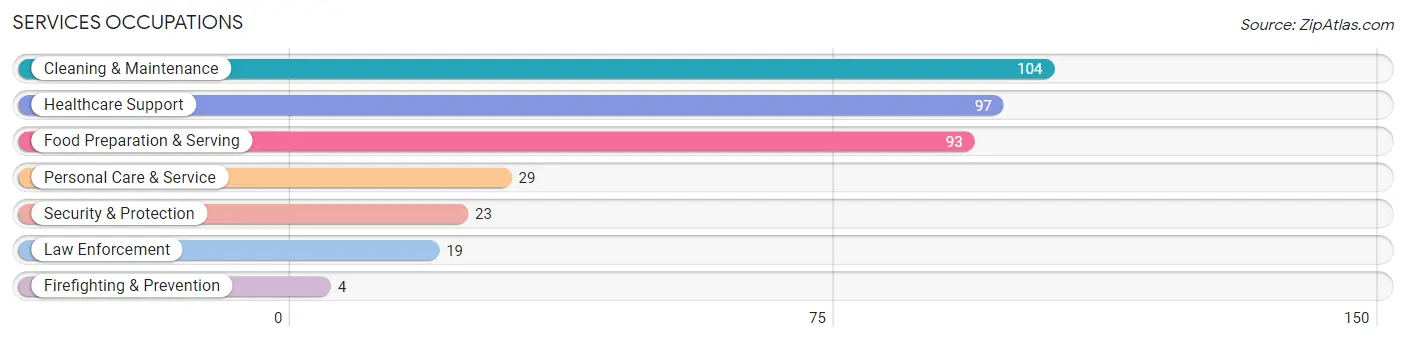
Services Occupations
The most common Services occupations in Harper County are Cleaning & Maintenance (104 | 4.8%), Healthcare Support (97 | 4.5%), Food Preparation & Serving (93 | 4.3%), Personal Care & Service (29 | 1.3%), and Security & Protection (23 | 1.1%).
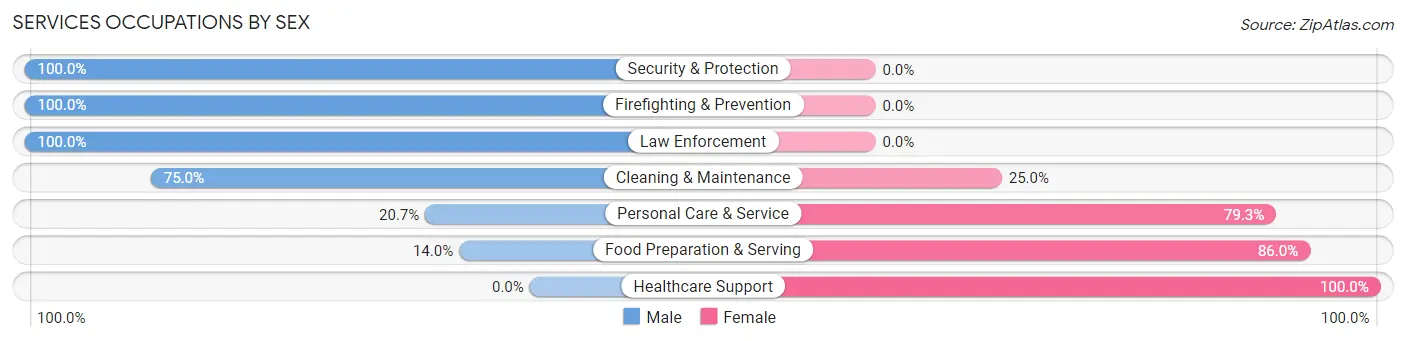
Services Occupations by Sex
Within the Services occupations in Harper County, the most male-oriented occupations are Security & Protection (100.0%), Firefighting & Prevention (100.0%), and Law Enforcement (100.0%), while the most female-oriented occupations are Healthcare Support (100.0%), Food Preparation & Serving (86.0%), and Personal Care & Service (79.3%).
| Occupation | Male | Female |
| Healthcare Support | 0 (0.0%) | 97 (100.0%) |
| Security & Protection | 23 (100.0%) | 0 (0.0%) |
| Firefighting & Prevention | 4 (100.0%) | 0 (0.0%) |
| Law Enforcement | 19 (100.0%) | 0 (0.0%) |
| Food Preparation & Serving | 13 (14.0%) | 80 (86.0%) |
| Cleaning & Maintenance | 78 (75.0%) | 26 (25.0%) |
| Personal Care & Service | 6 (20.7%) | 23 (79.3%) |
| Total (Category) | 120 (34.7%) | 226 (65.3%) |
| Total (Overall) | 1,169 (54.0%) | 997 (46.0%) |
Sales and Office Occupations
The most common Sales and Office occupations in Harper County are Office & Administration (193 | 8.9%), and Sales & Related (192 | 8.9%).
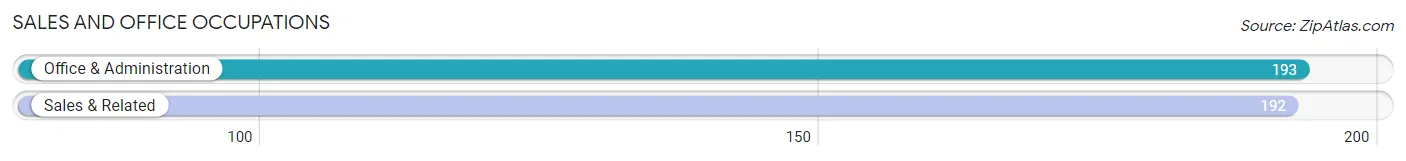
Sales and Office Occupations by Sex
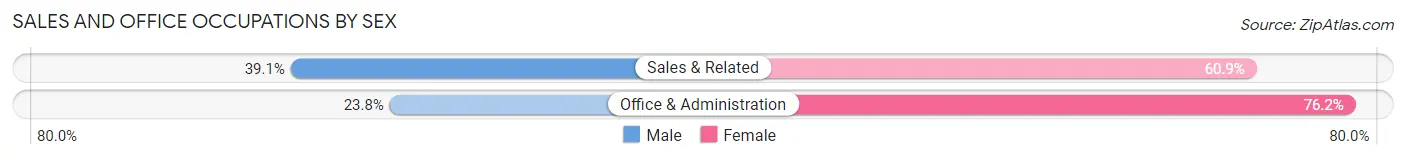
| Occupation | Male | Female |
| Sales & Related | 75 (39.1%) | 117 (60.9%) |
| Office & Administration | 46 (23.8%) | 147 (76.2%) |
| Total (Category) | 121 (31.4%) | 264 (68.6%) |
| Total (Overall) | 1,169 (54.0%) | 997 (46.0%) |
Natural Resources, Construction and Maintenance Occupations
The most common Natural Resources, Construction and Maintenance occupations in Harper County are Installation, Maintenance & Repair (180 | 8.3%), Construction & Extraction (108 | 5.0%), and Farming, Fishing & Forestry (92 | 4.3%).
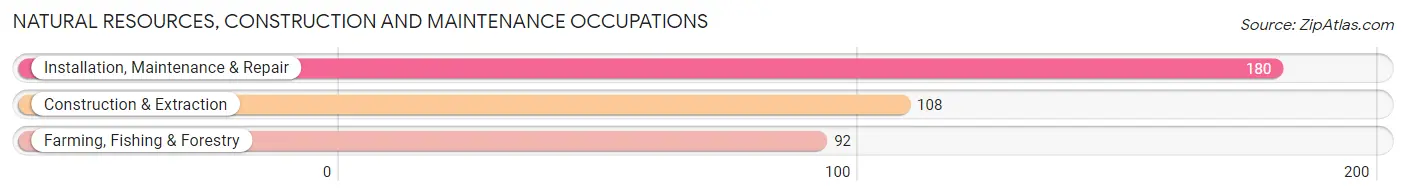
Natural Resources, Construction and Maintenance Occupations by Sex
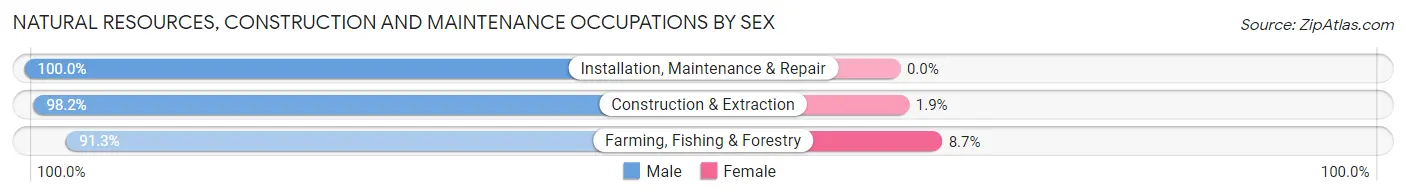
| Occupation | Male | Female |
| Farming, Fishing & Forestry | 84 (91.3%) | 8 (8.7%) |
| Construction & Extraction | 106 (98.2%) | 2 (1.8%) |
| Installation, Maintenance & Repair | 180 (100.0%) | 0 (0.0%) |
| Total (Category) | 370 (97.4%) | 10 (2.6%) |
| Total (Overall) | 1,169 (54.0%) | 997 (46.0%) |
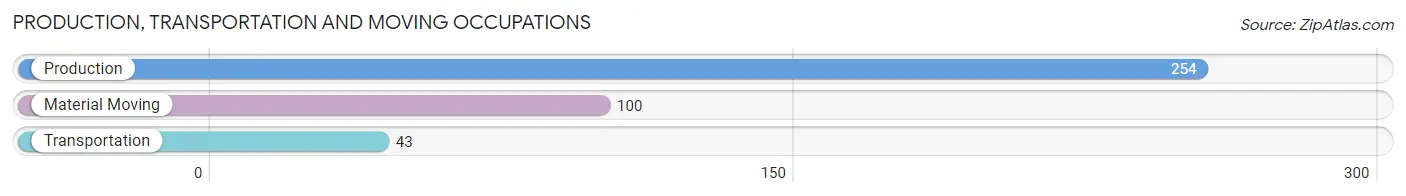
Production, Transportation and Moving Occupations
The most common Production, Transportation and Moving occupations in Harper County are Production (254 | 11.7%), Material Moving (100 | 4.6%), and Transportation (43 | 2.0%).
Production, Transportation and Moving Occupations by Sex
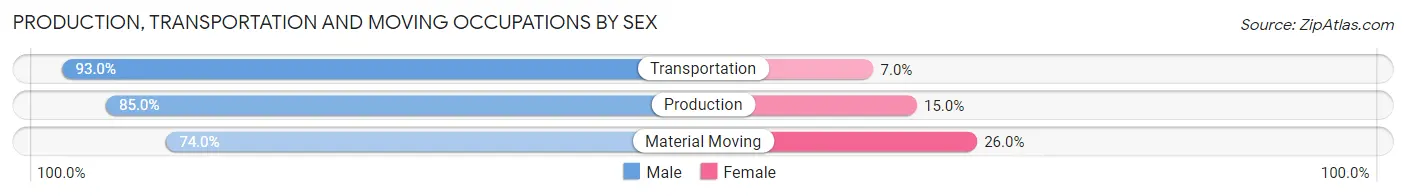
| Occupation | Male | Female |
| Production | 216 (85.0%) | 38 (15.0%) |
| Transportation | 40 (93.0%) | 3 (7.0%) |
| Material Moving | 74 (74.0%) | 26 (26.0%) |
| Total (Category) | 330 (83.1%) | 67 (16.9%) |
| Total (Overall) | 1,169 (54.0%) | 997 (46.0%) |
Employment Industries by Sex in Harper County
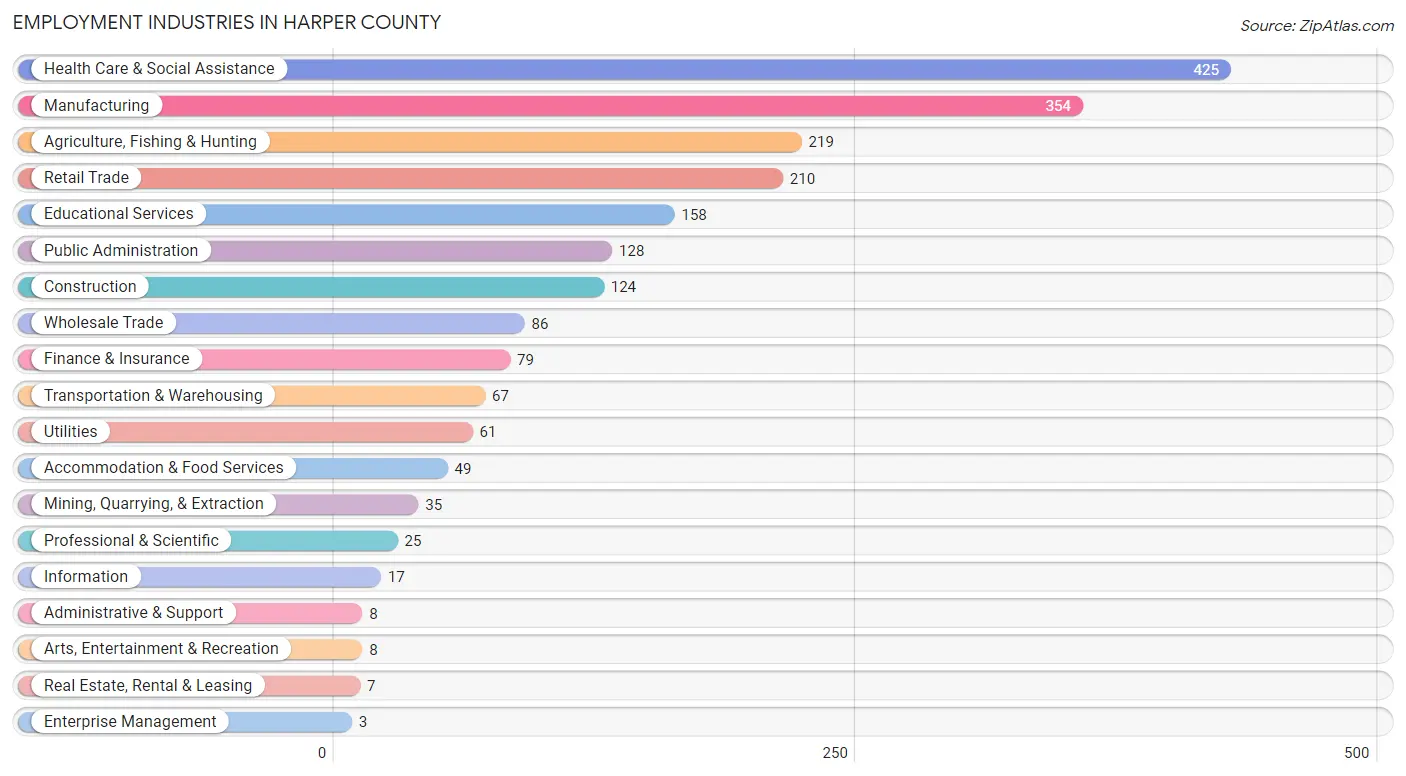
Employment Industries in Harper County
The major employment industries in Harper County include Health Care & Social Assistance (425 | 19.6%), Manufacturing (354 | 16.3%), Agriculture, Fishing & Hunting (219 | 10.1%), Retail Trade (210 | 9.7%), and Educational Services (158 | 7.3%).
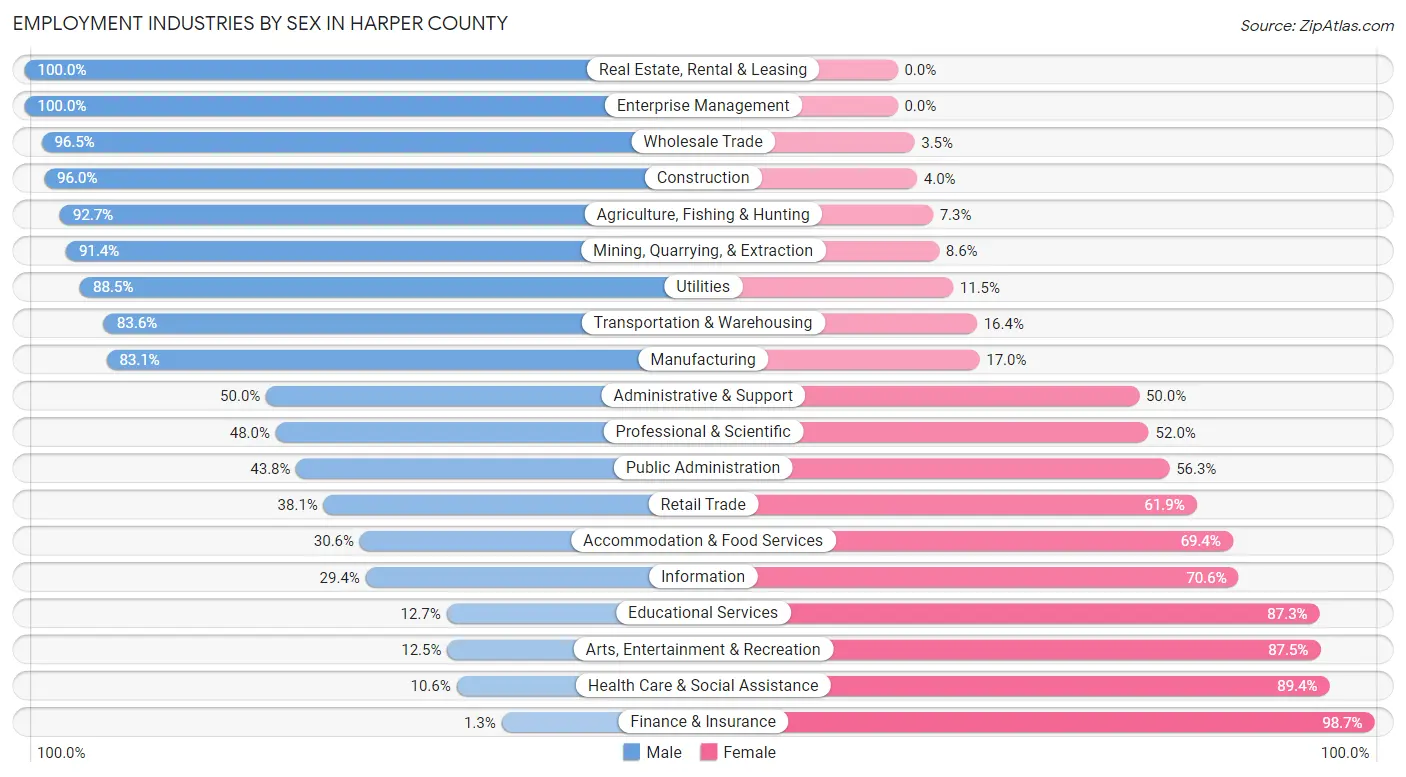
Employment Industries by Sex in Harper County
The Harper County industries that see more men than women are Real Estate, Rental & Leasing (100.0%), Enterprise Management (100.0%), and Wholesale Trade (96.5%), whereas the industries that tend to have a higher number of women are Finance & Insurance (98.7%), Health Care & Social Assistance (89.4%), and Arts, Entertainment & Recreation (87.5%).
| Industry | Male | Female |
| Agriculture, Fishing & Hunting | 203 (92.7%) | 16 (7.3%) |
| Mining, Quarrying, & Extraction | 32 (91.4%) | 3 (8.6%) |
| Construction | 119 (96.0%) | 5 (4.0%) |
| Manufacturing | 294 (83.1%) | 60 (17.0%) |
| Wholesale Trade | 83 (96.5%) | 3 (3.5%) |
| Retail Trade | 80 (38.1%) | 130 (61.9%) |
| Transportation & Warehousing | 56 (83.6%) | 11 (16.4%) |
| Utilities | 54 (88.5%) | 7 (11.5%) |
| Information | 5 (29.4%) | 12 (70.6%) |
| Finance & Insurance | 1 (1.3%) | 78 (98.7%) |
| Real Estate, Rental & Leasing | 7 (100.0%) | 0 (0.0%) |
| Professional & Scientific | 12 (48.0%) | 13 (52.0%) |
| Enterprise Management | 3 (100.0%) | 0 (0.0%) |
| Administrative & Support | 4 (50.0%) | 4 (50.0%) |
| Educational Services | 20 (12.7%) | 138 (87.3%) |
| Health Care & Social Assistance | 45 (10.6%) | 380 (89.4%) |
| Arts, Entertainment & Recreation | 1 (12.5%) | 7 (87.5%) |
| Accommodation & Food Services | 15 (30.6%) | 34 (69.4%) |
| Public Administration | 56 (43.8%) | 72 (56.2%) |
| Total | 1,169 (54.0%) | 997 (46.0%) |
Education in Harper County
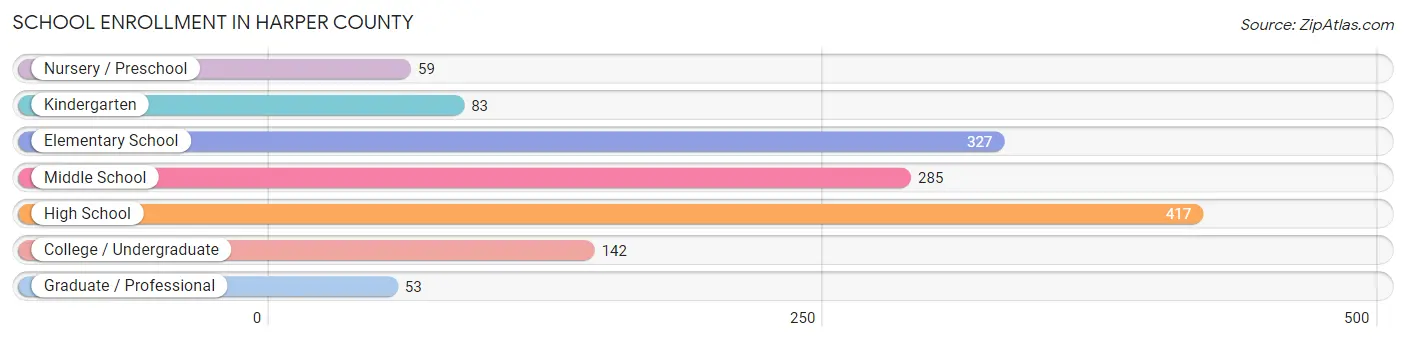
School Enrollment in Harper County
The most common levels of schooling among the 1,366 students in Harper County are high school (417 | 30.5%), elementary school (327 | 23.9%), and middle school (285 | 20.9%).
| School Level | # Students | % Students |
| Nursery / Preschool | 59 | 4.3% |
| Kindergarten | 83 | 6.1% |
| Elementary School | 327 | 23.9% |
| Middle School | 285 | 20.9% |
| High School | 417 | 30.5% |
| College / Undergraduate | 142 | 10.4% |
| Graduate / Professional | 53 | 3.9% |
| Total | 1,366 | 100.0% |
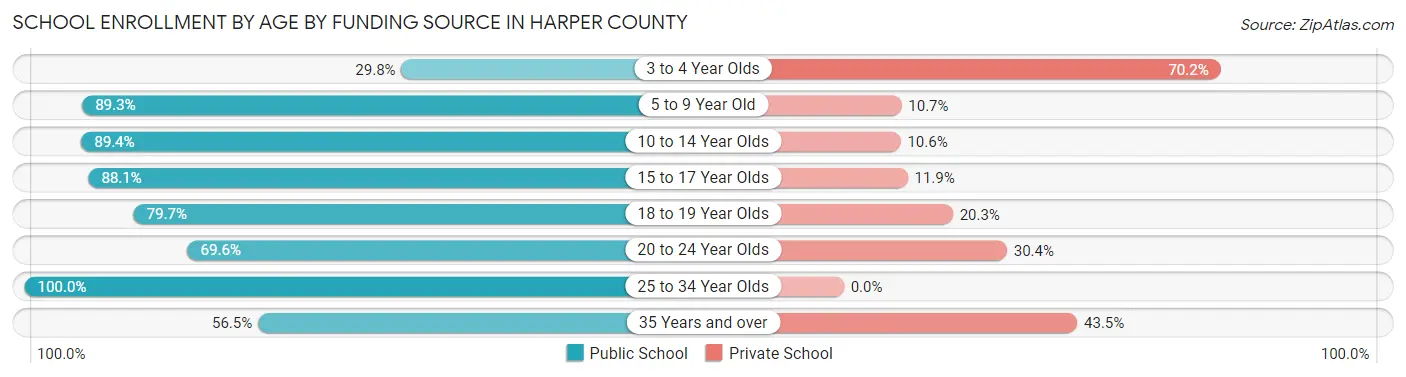
School Enrollment by Age by Funding Source in Harper County
Out of a total of 1,366 students who are enrolled in schools in Harper County, 231 (16.9%) attend a private institution, while the remaining 1,135 (83.1%) are enrolled in public schools. The age group of 3 to 4 year olds has the highest likelihood of being enrolled in private schools, with 40 (70.2% in the age bracket) enrolled. Conversely, the age group of 25 to 34 year olds has the lowest likelihood of being enrolled in a private school, with 23 (100.0% in the age bracket) attending a public institution.
| Age Bracket | Public School | Private School |
| 3 to 4 Year Olds | 17 (29.8%) | 40 (70.2%) |
| 5 to 9 Year Old | 324 (89.3%) | 39 (10.7%) |
| 10 to 14 Year Olds | 338 (89.4%) | 40 (10.6%) |
| 15 to 17 Year Olds | 237 (88.1%) | 32 (11.9%) |
| 18 to 19 Year Olds | 102 (79.7%) | 26 (20.3%) |
| 20 to 24 Year Olds | 55 (69.6%) | 24 (30.4%) |
| 25 to 34 Year Olds | 23 (100.0%) | 0 (0.0%) |
| 35 Years and over | 39 (56.5%) | 30 (43.5%) |
| Total | 1,135 (83.1%) | 231 (16.9%) |
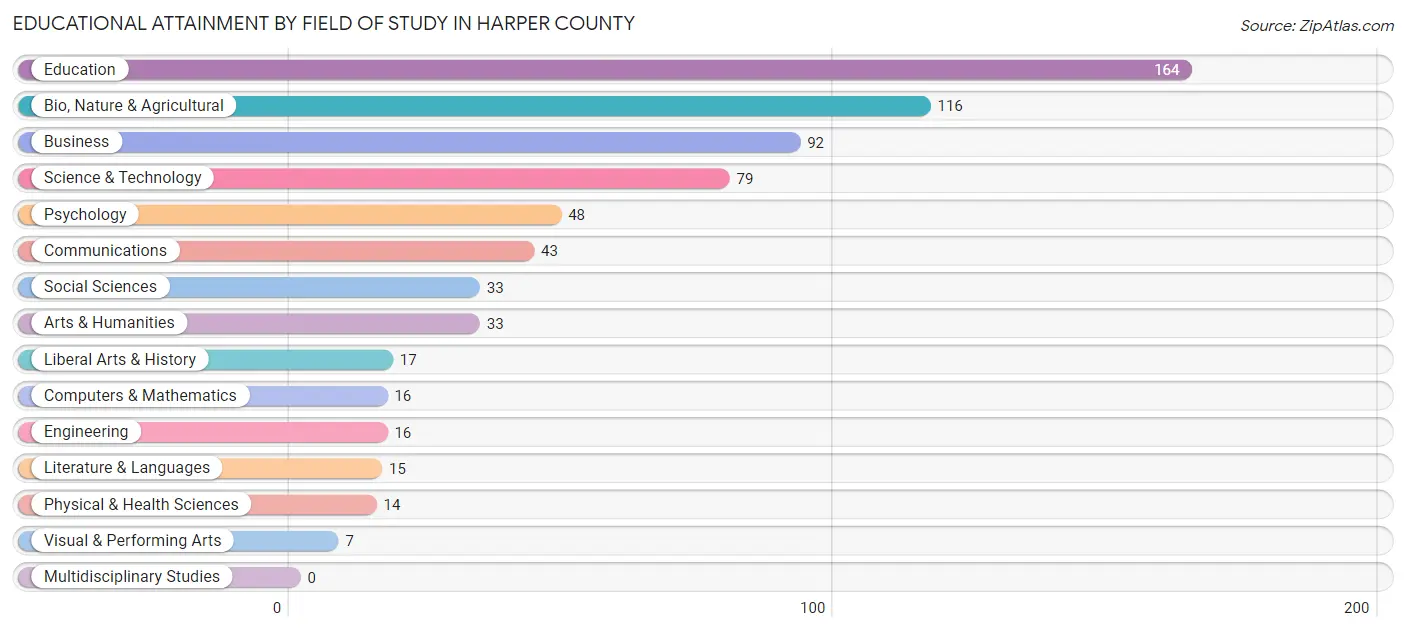
Educational Attainment by Field of Study in Harper County
Education (164 | 23.7%), bio, nature & agricultural (116 | 16.7%), business (92 | 13.3%), science & technology (79 | 11.4%), and psychology (48 | 6.9%) are the most common fields of study among 693 individuals in Harper County who have obtained a bachelor's degree or higher.
| Field of Study | # Graduates | % Graduates |
| Computers & Mathematics | 16 | 2.3% |
| Bio, Nature & Agricultural | 116 | 16.7% |
| Physical & Health Sciences | 14 | 2.0% |
| Psychology | 48 | 6.9% |
| Social Sciences | 33 | 4.8% |
| Engineering | 16 | 2.3% |
| Multidisciplinary Studies | 0 | 0.0% |
| Science & Technology | 79 | 11.4% |
| Business | 92 | 13.3% |
| Education | 164 | 23.7% |
| Literature & Languages | 15 | 2.2% |
| Liberal Arts & History | 17 | 2.5% |
| Visual & Performing Arts | 7 | 1.0% |
| Communications | 43 | 6.2% |
| Arts & Humanities | 33 | 4.8% |
| Total | 693 | 100.0% |
Transportation & Commute in Harper County
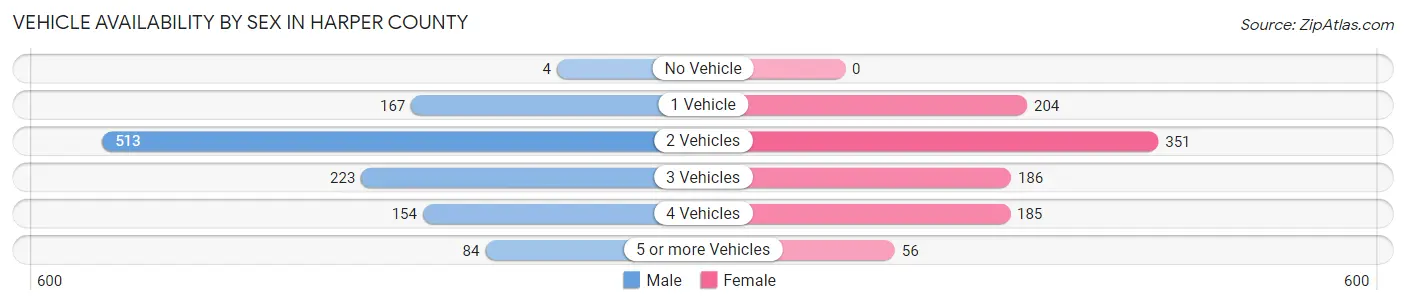
Vehicle Availability by Sex in Harper County
The most prevalent vehicle ownership categories in Harper County are males with 2 vehicles (513, accounting for 44.8%) and females with 2 vehicles (351, making up 52.2%).
| Vehicles Available | Male | Female |
| No Vehicle | 4 (0.4%) | 0 (0.0%) |
| 1 Vehicle | 167 (14.6%) | 204 (20.8%) |
| 2 Vehicles | 513 (44.8%) | 351 (35.7%) |
| 3 Vehicles | 223 (19.5%) | 186 (18.9%) |
| 4 Vehicles | 154 (13.5%) | 185 (18.8%) |
| 5 or more Vehicles | 84 (7.3%) | 56 (5.7%) |
| Total | 1,145 (100.0%) | 982 (100.0%) |
Commute Time in Harper County
The most frequently occuring commute durations in Harper County are 5 to 9 minutes (541 commuters, 26.7%), less than 5 minutes (442 commuters, 21.8%), and 15 to 19 minutes (286 commuters, 14.1%).
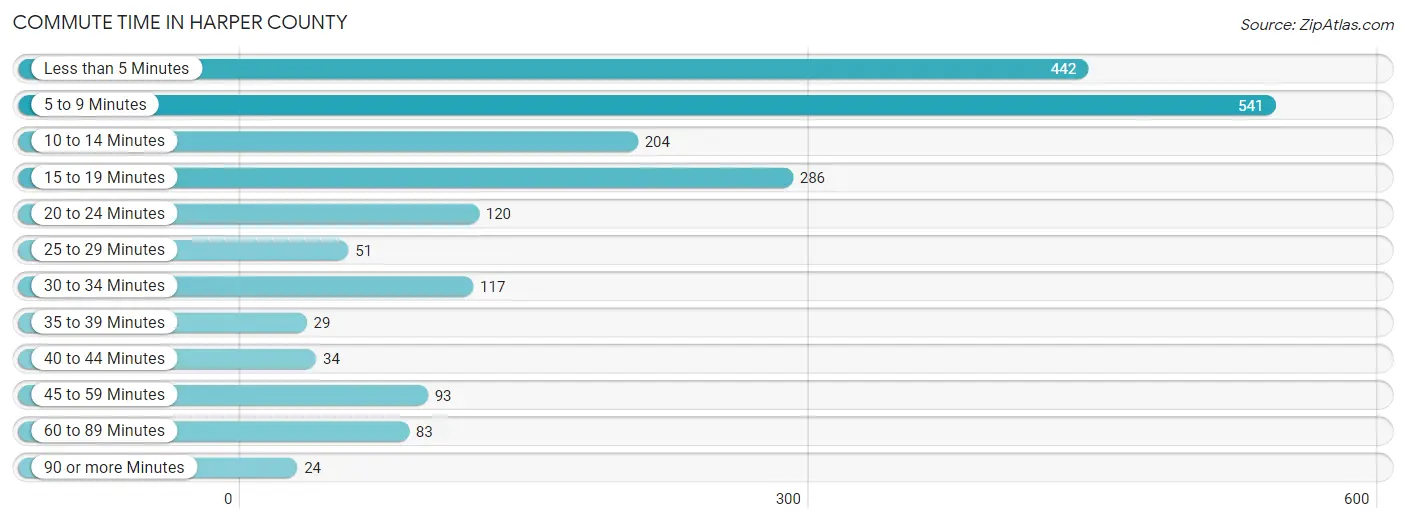
| Commute Time | # Commuters | % Commuters |
| Less than 5 Minutes | 442 | 21.8% |
| 5 to 9 Minutes | 541 | 26.7% |
| 10 to 14 Minutes | 204 | 10.1% |
| 15 to 19 Minutes | 286 | 14.1% |
| 20 to 24 Minutes | 120 | 5.9% |
| 25 to 29 Minutes | 51 | 2.5% |
| 30 to 34 Minutes | 117 | 5.8% |
| 35 to 39 Minutes | 29 | 1.4% |
| 40 to 44 Minutes | 34 | 1.7% |
| 45 to 59 Minutes | 93 | 4.6% |
| 60 to 89 Minutes | 83 | 4.1% |
| 90 or more Minutes | 24 | 1.2% |
Commute Time by Sex in Harper County
The most common commute times in Harper County are 5 to 9 minutes (301 commuters, 26.7%) for males and 5 to 9 minutes (240 commuters, 26.8%) for females.
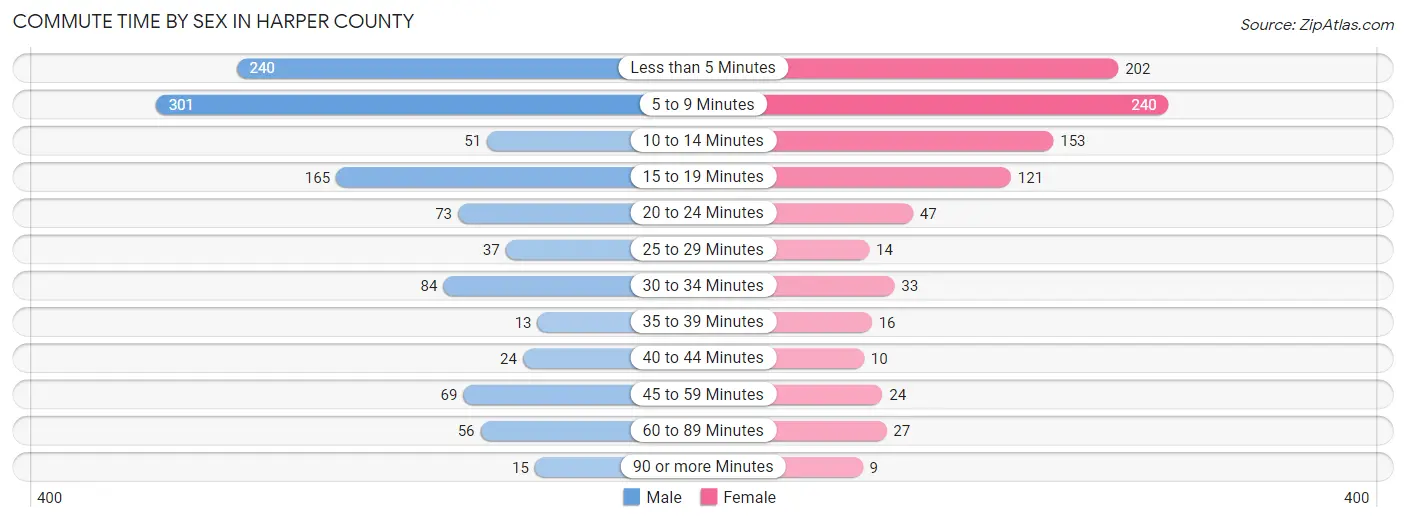
| Commute Time | Male | Female |
| Less than 5 Minutes | 240 (21.3%) | 202 (22.5%) |
| 5 to 9 Minutes | 301 (26.7%) | 240 (26.8%) |
| 10 to 14 Minutes | 51 (4.5%) | 153 (17.1%) |
| 15 to 19 Minutes | 165 (14.6%) | 121 (13.5%) |
| 20 to 24 Minutes | 73 (6.5%) | 47 (5.2%) |
| 25 to 29 Minutes | 37 (3.3%) | 14 (1.6%) |
| 30 to 34 Minutes | 84 (7.4%) | 33 (3.7%) |
| 35 to 39 Minutes | 13 (1.1%) | 16 (1.8%) |
| 40 to 44 Minutes | 24 (2.1%) | 10 (1.1%) |
| 45 to 59 Minutes | 69 (6.1%) | 24 (2.7%) |
| 60 to 89 Minutes | 56 (5.0%) | 27 (3.0%) |
| 90 or more Minutes | 15 (1.3%) | 9 (1.0%) |
Time of Departure to Work by Sex in Harper County
The most frequent times of departure to work in Harper County are 7:00 AM to 7:29 AM (256, 22.7%) for males and 7:30 AM to 7:59 AM (347, 38.7%) for females.
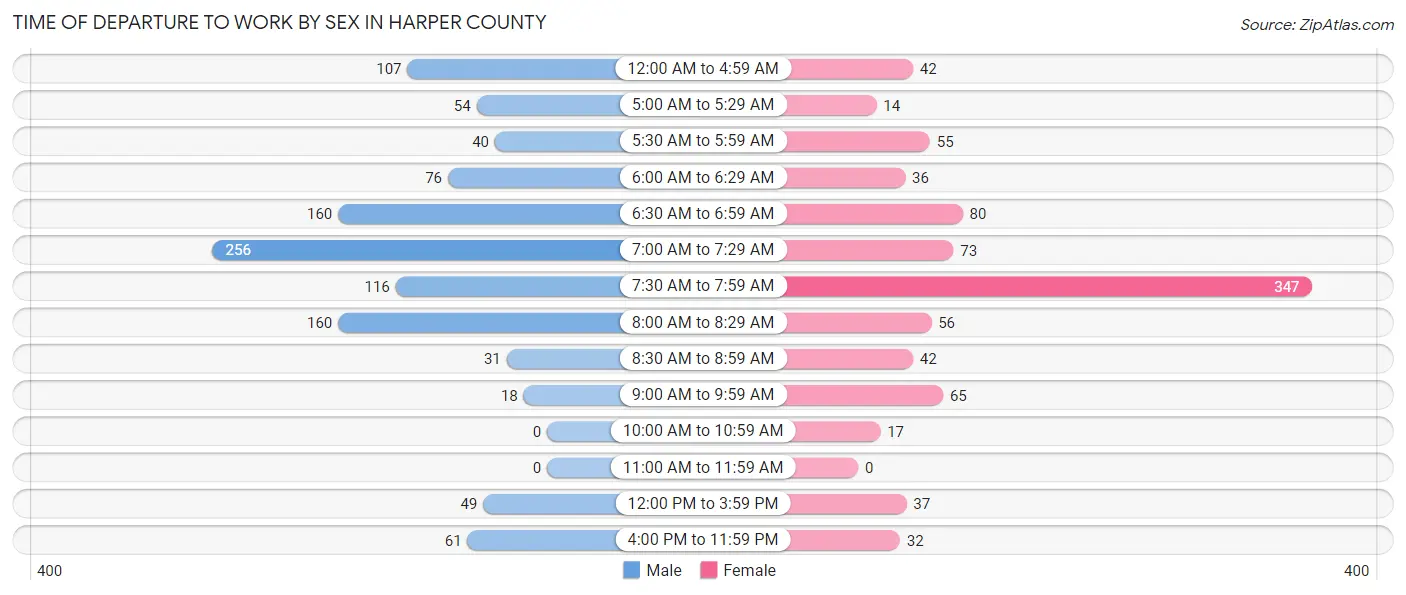
| Time of Departure | Male | Female |
| 12:00 AM to 4:59 AM | 107 (9.5%) | 42 (4.7%) |
| 5:00 AM to 5:29 AM | 54 (4.8%) | 14 (1.6%) |
| 5:30 AM to 5:59 AM | 40 (3.5%) | 55 (6.1%) |
| 6:00 AM to 6:29 AM | 76 (6.7%) | 36 (4.0%) |
| 6:30 AM to 6:59 AM | 160 (14.2%) | 80 (8.9%) |
| 7:00 AM to 7:29 AM | 256 (22.7%) | 73 (8.2%) |
| 7:30 AM to 7:59 AM | 116 (10.3%) | 347 (38.7%) |
| 8:00 AM to 8:29 AM | 160 (14.2%) | 56 (6.2%) |
| 8:30 AM to 8:59 AM | 31 (2.8%) | 42 (4.7%) |
| 9:00 AM to 9:59 AM | 18 (1.6%) | 65 (7.2%) |
| 10:00 AM to 10:59 AM | 0 (0.0%) | 17 (1.9%) |
| 11:00 AM to 11:59 AM | 0 (0.0%) | 0 (0.0%) |
| 12:00 PM to 3:59 PM | 49 (4.3%) | 37 (4.1%) |
| 4:00 PM to 11:59 PM | 61 (5.4%) | 32 (3.6%) |
| Total | 1,128 (100.0%) | 896 (100.0%) |
Housing Occupancy in Harper County
Occupancy by Ownership in Harper County
Of the total 2,186 dwellings in Harper County, owner-occupied units account for 1,609 (73.6%), while renter-occupied units make up 577 (26.4%).
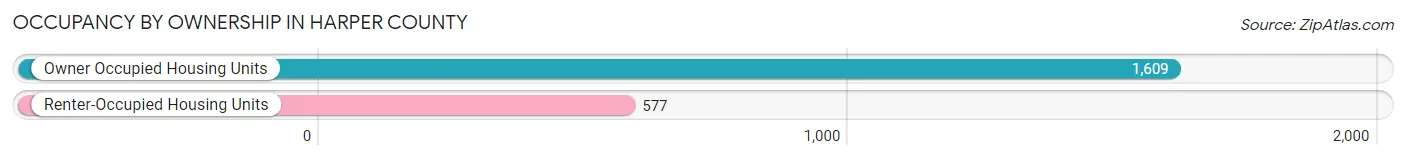
| Occupancy | # Housing Units | % Housing Units |
| Owner Occupied Housing Units | 1,609 | 73.6% |
| Renter-Occupied Housing Units | 577 | 26.4% |
| Total Occupied Housing Units | 2,186 | 100.0% |
Occupancy by Household Size in Harper County
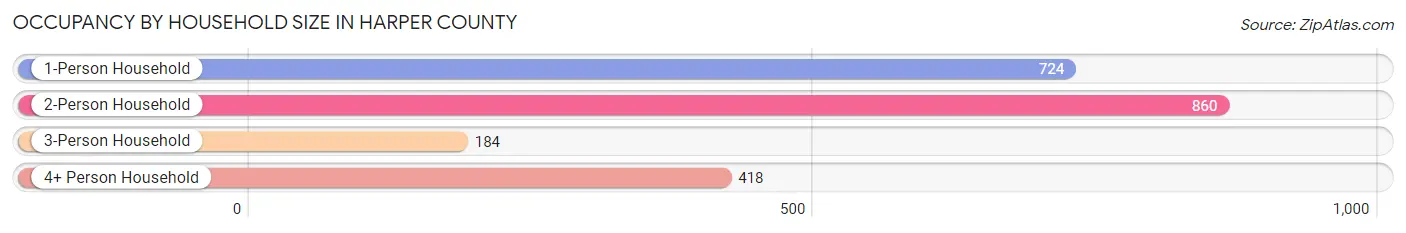
| Household Size | # Housing Units | % Housing Units |
| 1-Person Household | 724 | 33.1% |
| 2-Person Household | 860 | 39.3% |
| 3-Person Household | 184 | 8.4% |
| 4+ Person Household | 418 | 19.1% |
| Total Housing Units | 2,186 | 100.0% |
Occupancy by Ownership by Household Size in Harper County
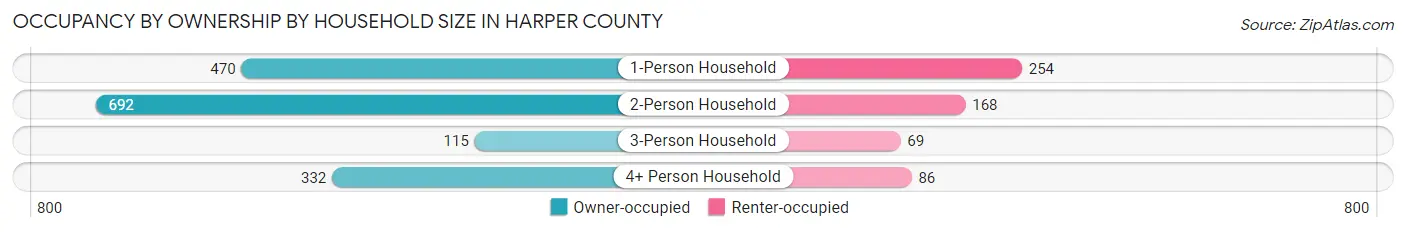
| Household Size | Owner-occupied | Renter-occupied |
| 1-Person Household | 470 (64.9%) | 254 (35.1%) |
| 2-Person Household | 692 (80.5%) | 168 (19.5%) |
| 3-Person Household | 115 (62.5%) | 69 (37.5%) |
| 4+ Person Household | 332 (79.4%) | 86 (20.6%) |
| Total Housing Units | 1,609 (73.6%) | 577 (26.4%) |
Occupancy by Educational Attainment in Harper County
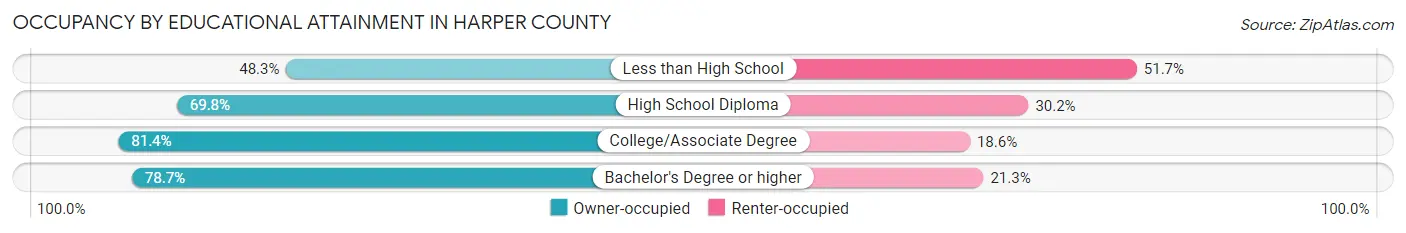
| Household Size | Owner-occupied | Renter-occupied |
| Less than High School | 114 (48.3%) | 122 (51.7%) |
| High School Diploma | 488 (69.8%) | 211 (30.2%) |
| College/Associate Degree | 674 (81.4%) | 154 (18.6%) |
| Bachelor's Degree or higher | 333 (78.7%) | 90 (21.3%) |
Occupancy by Age of Householder in Harper County
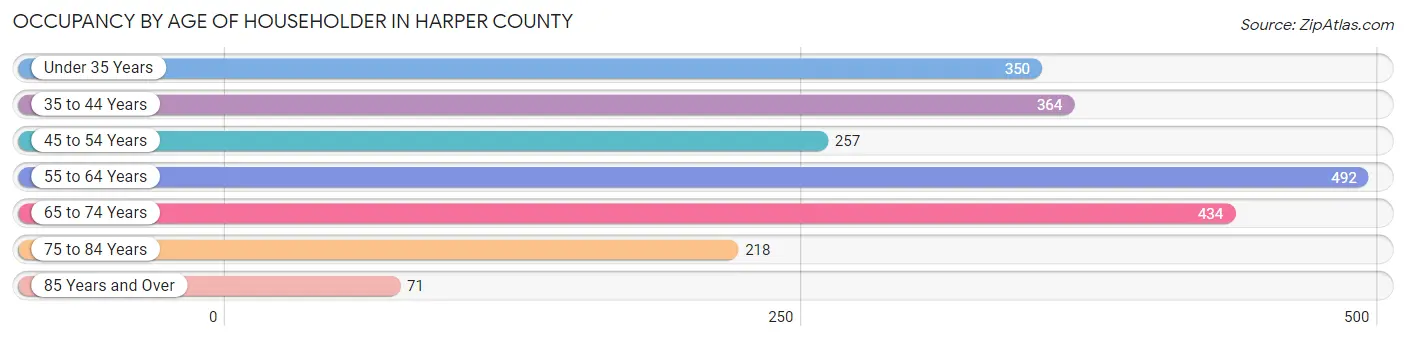
| Age Bracket | # Households | % Households |
| Under 35 Years | 350 | 16.0% |
| 35 to 44 Years | 364 | 16.7% |
| 45 to 54 Years | 257 | 11.8% |
| 55 to 64 Years | 492 | 22.5% |
| 65 to 74 Years | 434 | 19.9% |
| 75 to 84 Years | 218 | 10.0% |
| 85 Years and Over | 71 | 3.3% |
| Total | 2,186 | 100.0% |
Housing Finances in Harper County
Median Income by Occupancy in Harper County
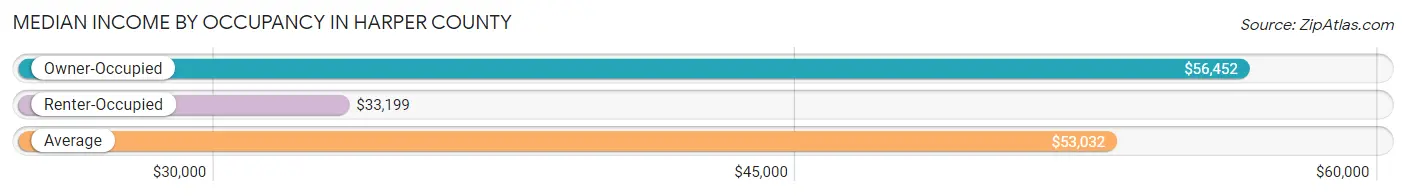
| Occupancy Type | # Households | Median Income |
| Owner-Occupied | 1,609 (73.6%) | $56,452 |
| Renter-Occupied | 577 (26.4%) | $33,199 |
| Average | 2,186 (100.0%) | $53,032 |
Occupancy by Householder Income Bracket in Harper County
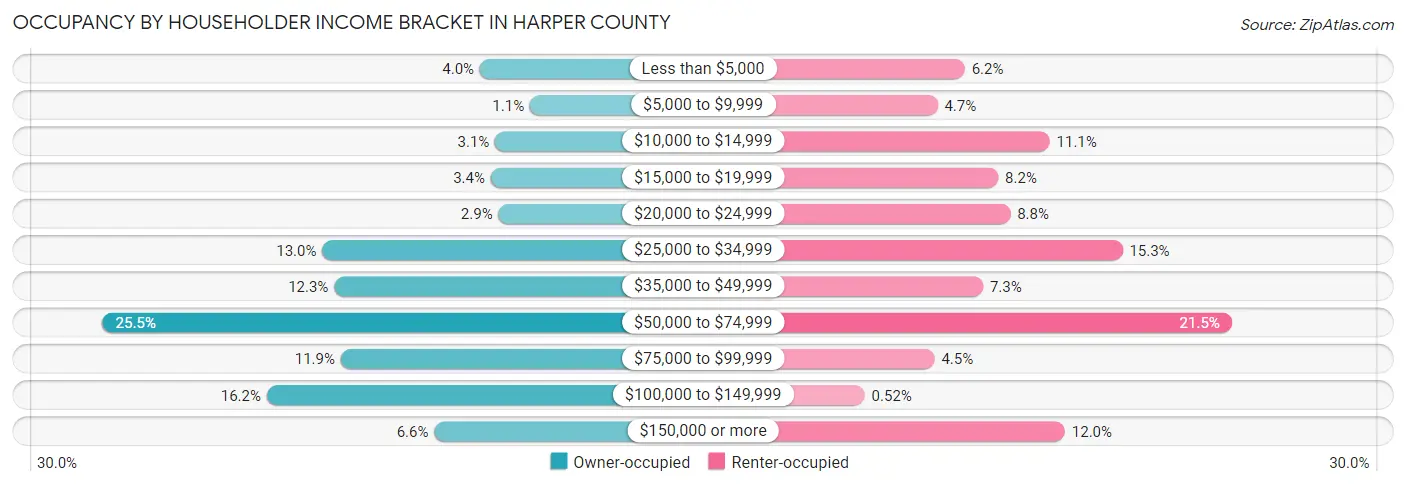
| Income Bracket | Owner-occupied | Renter-occupied |
| Less than $5,000 | 64 (4.0%) | 36 (6.2%) |
| $5,000 to $9,999 | 18 (1.1%) | 27 (4.7%) |
| $10,000 to $14,999 | 50 (3.1%) | 64 (11.1%) |
| $15,000 to $19,999 | 54 (3.4%) | 47 (8.2%) |
| $20,000 to $24,999 | 47 (2.9%) | 51 (8.8%) |
| $25,000 to $34,999 | 209 (13.0%) | 88 (15.2%) |
| $35,000 to $49,999 | 198 (12.3%) | 42 (7.3%) |
| $50,000 to $74,999 | 411 (25.5%) | 124 (21.5%) |
| $75,000 to $99,999 | 192 (11.9%) | 26 (4.5%) |
| $100,000 to $149,999 | 260 (16.2%) | 3 (0.5%) |
| $150,000 or more | 106 (6.6%) | 69 (12.0%) |
| Total | 1,609 (100.0%) | 577 (100.0%) |
Monthly Housing Cost Tiers in Harper County
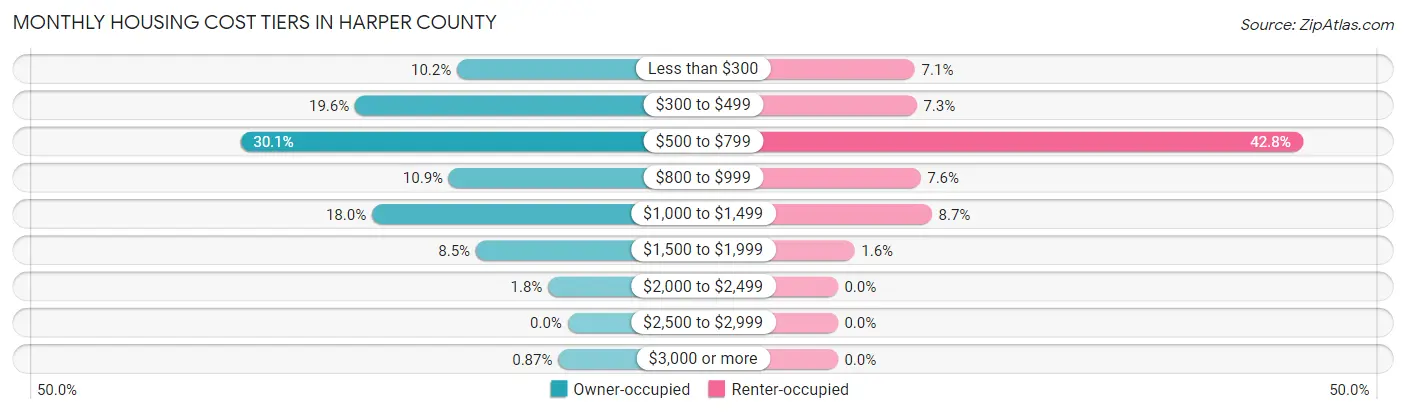
| Monthly Cost | Owner-occupied | Renter-occupied |
| Less than $300 | 164 (10.2%) | 41 (7.1%) |
| $300 to $499 | 315 (19.6%) | 42 (7.3%) |
| $500 to $799 | 485 (30.1%) | 247 (42.8%) |
| $800 to $999 | 176 (10.9%) | 44 (7.6%) |
| $1,000 to $1,499 | 290 (18.0%) | 50 (8.7%) |
| $1,500 to $1,999 | 136 (8.5%) | 9 (1.6%) |
| $2,000 to $2,499 | 29 (1.8%) | 0 (0.0%) |
| $2,500 to $2,999 | 0 (0.0%) | 0 (0.0%) |
| $3,000 or more | 14 (0.9%) | 0 (0.0%) |
| Total | 1,609 (100.0%) | 577 (100.0%) |
Physical Housing Characteristics in Harper County
Housing Structures in Harper County
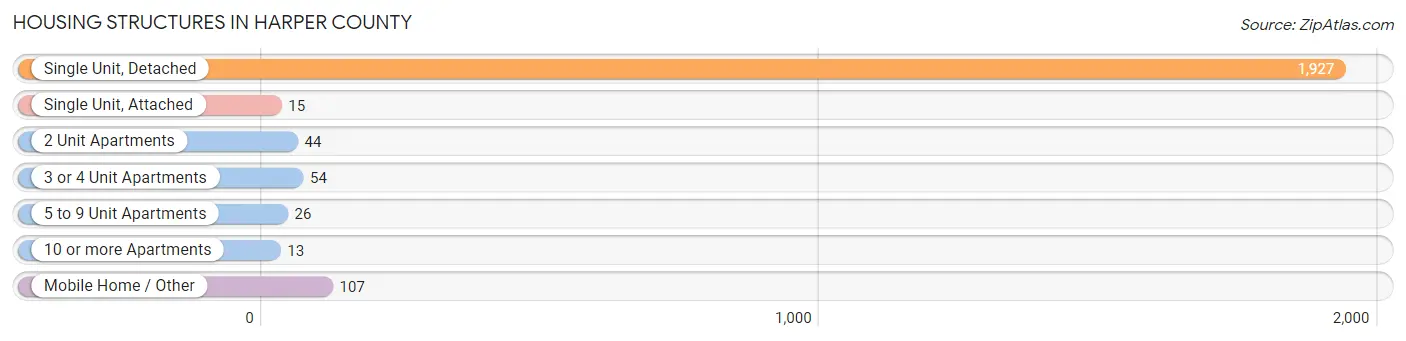
| Structure Type | # Housing Units | % Housing Units |
| Single Unit, Detached | 1,927 | 88.1% |
| Single Unit, Attached | 15 | 0.7% |
| 2 Unit Apartments | 44 | 2.0% |
| 3 or 4 Unit Apartments | 54 | 2.5% |
| 5 to 9 Unit Apartments | 26 | 1.2% |
| 10 or more Apartments | 13 | 0.6% |
| Mobile Home / Other | 107 | 4.9% |
| Total | 2,186 | 100.0% |
Housing Structures by Occupancy in Harper County
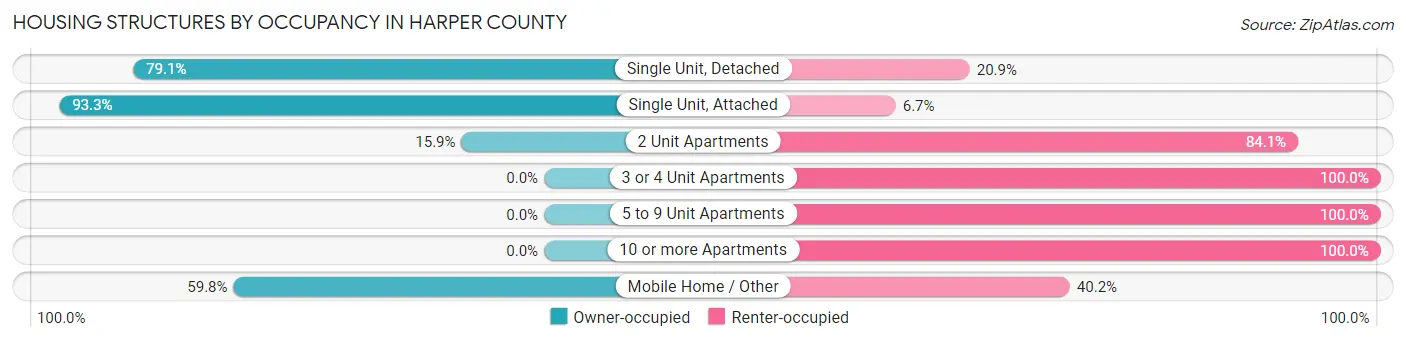
| Structure Type | Owner-occupied | Renter-occupied |
| Single Unit, Detached | 1,524 (79.1%) | 403 (20.9%) |
| Single Unit, Attached | 14 (93.3%) | 1 (6.7%) |
| 2 Unit Apartments | 7 (15.9%) | 37 (84.1%) |
| 3 or 4 Unit Apartments | 0 (0.0%) | 54 (100.0%) |
| 5 to 9 Unit Apartments | 0 (0.0%) | 26 (100.0%) |
| 10 or more Apartments | 0 (0.0%) | 13 (100.0%) |
| Mobile Home / Other | 64 (59.8%) | 43 (40.2%) |
| Total | 1,609 (73.6%) | 577 (26.4%) |
Housing Structures by Number of Rooms in Harper County
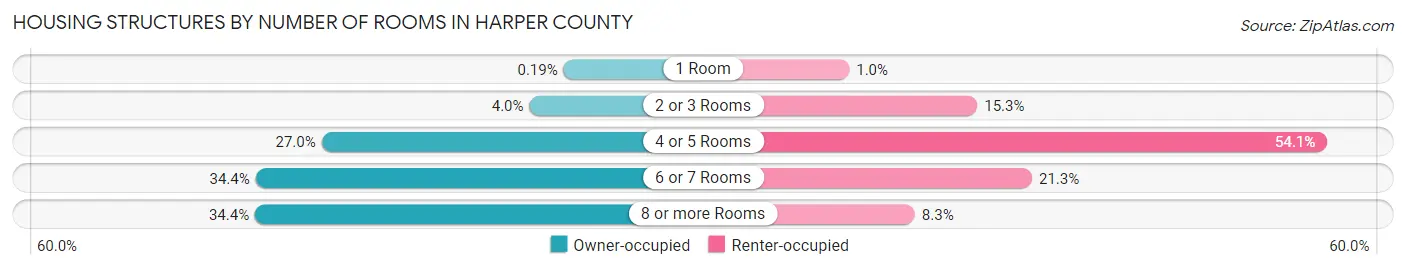
| Number of Rooms | Owner-occupied | Renter-occupied |
| 1 Room | 3 (0.2%) | 6 (1.0%) |
| 2 or 3 Rooms | 64 (4.0%) | 88 (15.2%) |
| 4 or 5 Rooms | 435 (27.0%) | 312 (54.1%) |
| 6 or 7 Rooms | 553 (34.4%) | 123 (21.3%) |
| 8 or more Rooms | 554 (34.4%) | 48 (8.3%) |
| Total | 1,609 (100.0%) | 577 (100.0%) |
Housing Structure by Heating Type in Harper County
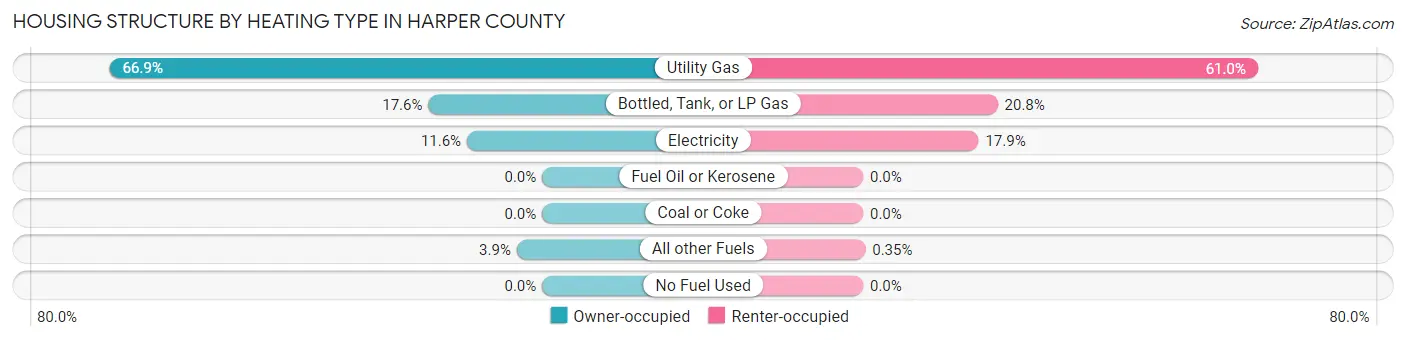
| Heating Type | Owner-occupied | Renter-occupied |
| Utility Gas | 1,076 (66.9%) | 352 (61.0%) |
| Bottled, Tank, or LP Gas | 283 (17.6%) | 120 (20.8%) |
| Electricity | 187 (11.6%) | 103 (17.8%) |
| Fuel Oil or Kerosene | 0 (0.0%) | 0 (0.0%) |
| Coal or Coke | 0 (0.0%) | 0 (0.0%) |
| All other Fuels | 63 (3.9%) | 2 (0.4%) |
| No Fuel Used | 0 (0.0%) | 0 (0.0%) |
| Total | 1,609 (100.0%) | 577 (100.0%) |
Household Vehicle Usage in Harper County
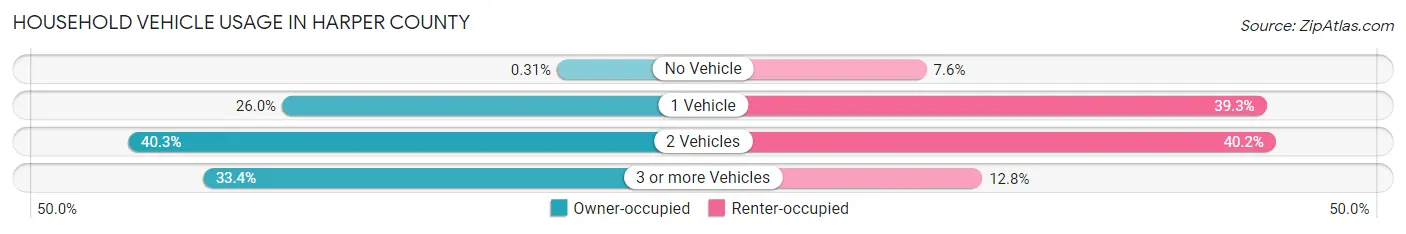
| Vehicles per Household | Owner-occupied | Renter-occupied |
| No Vehicle | 5 (0.3%) | 44 (7.6%) |
| 1 Vehicle | 418 (26.0%) | 227 (39.3%) |
| 2 Vehicles | 649 (40.3%) | 232 (40.2%) |
| 3 or more Vehicles | 537 (33.4%) | 74 (12.8%) |
| Total | 1,609 (100.0%) | 577 (100.0%) |
Real Estate & Mortgages in Harper County
Real Estate and Mortgage Overview in Harper County
| Characteristic | Without Mortgage | With Mortgage |
| Housing Units | 1,025 | 584 |
| Median Property Value | $61,300 | $104,500 |
| Median Household Income | $50,734 | $69 |
| Monthly Housing Costs | $517 | $14 |
| Real Estate Taxes | $1,258 | $3 |
Property Value by Mortgage Status in Harper County
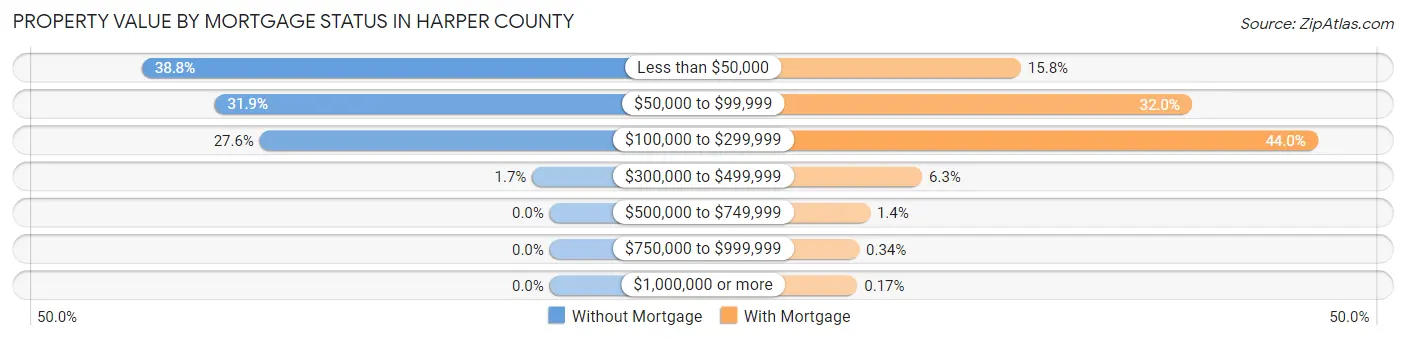
| Property Value | Without Mortgage | With Mortgage |
| Less than $50,000 | 398 (38.8%) | 92 (15.8%) |
| $50,000 to $99,999 | 327 (31.9%) | 187 (32.0%) |
| $100,000 to $299,999 | 283 (27.6%) | 257 (44.0%) |
| $300,000 to $499,999 | 17 (1.7%) | 37 (6.3%) |
| $500,000 to $749,999 | 0 (0.0%) | 8 (1.4%) |
| $750,000 to $999,999 | 0 (0.0%) | 2 (0.3%) |
| $1,000,000 or more | 0 (0.0%) | 1 (0.2%) |
| Total | 1,025 (100.0%) | 584 (100.0%) |
Household Income by Mortgage Status in Harper County
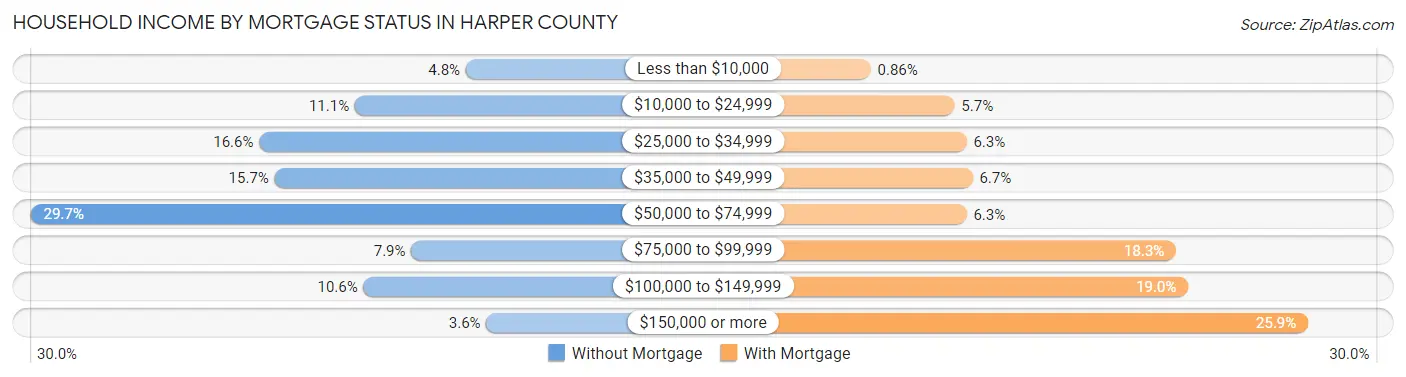
| Household Income | Without Mortgage | With Mortgage |
| Less than $10,000 | 49 (4.8%) | 5 (0.9%) |
| $10,000 to $24,999 | 114 (11.1%) | 33 (5.7%) |
| $25,000 to $34,999 | 170 (16.6%) | 37 (6.3%) |
| $35,000 to $49,999 | 161 (15.7%) | 39 (6.7%) |
| $50,000 to $74,999 | 304 (29.7%) | 37 (6.3%) |
| $75,000 to $99,999 | 81 (7.9%) | 107 (18.3%) |
| $100,000 to $149,999 | 109 (10.6%) | 111 (19.0%) |
| $150,000 or more | 37 (3.6%) | 151 (25.9%) |
| Total | 1,025 (100.0%) | 584 (100.0%) |
Property Value to Household Income Ratio in Harper County
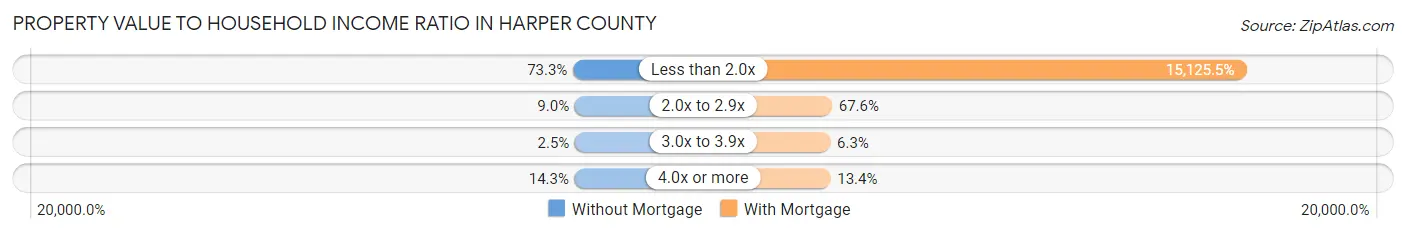
| Value-to-Income Ratio | Without Mortgage | With Mortgage |
| Less than 2.0x | 751 (73.3%) | 88,333 (15,125.5%) |
| 2.0x to 2.9x | 92 (9.0%) | 395 (67.6%) |
| 3.0x to 3.9x | 26 (2.5%) | 37 (6.3%) |
| 4.0x or more | 147 (14.3%) | 78 (13.4%) |
| Total | 1,025 (100.0%) | 584 (100.0%) |
Real Estate Taxes by Mortgage Status in Harper County
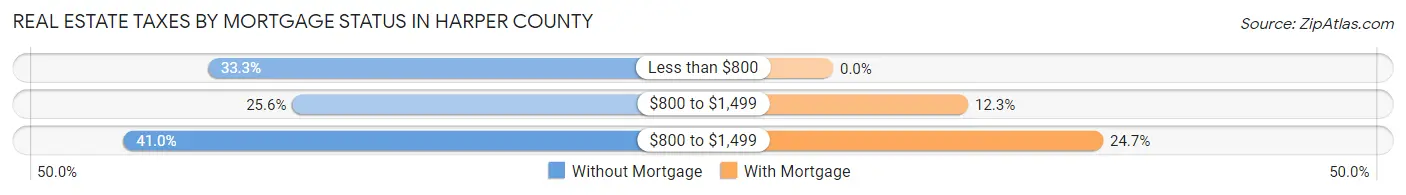
| Property Taxes | Without Mortgage | With Mortgage |
| Less than $800 | 341 (33.3%) | 0 (0.0%) |
| $800 to $1,499 | 262 (25.6%) | 72 (12.3%) |
| $800 to $1,499 | 420 (41.0%) | 144 (24.7%) |
| Total | 1,025 (100.0%) | 584 (100.0%) |
Health & Disability in Harper County
Health Insurance Coverage by Age in Harper County
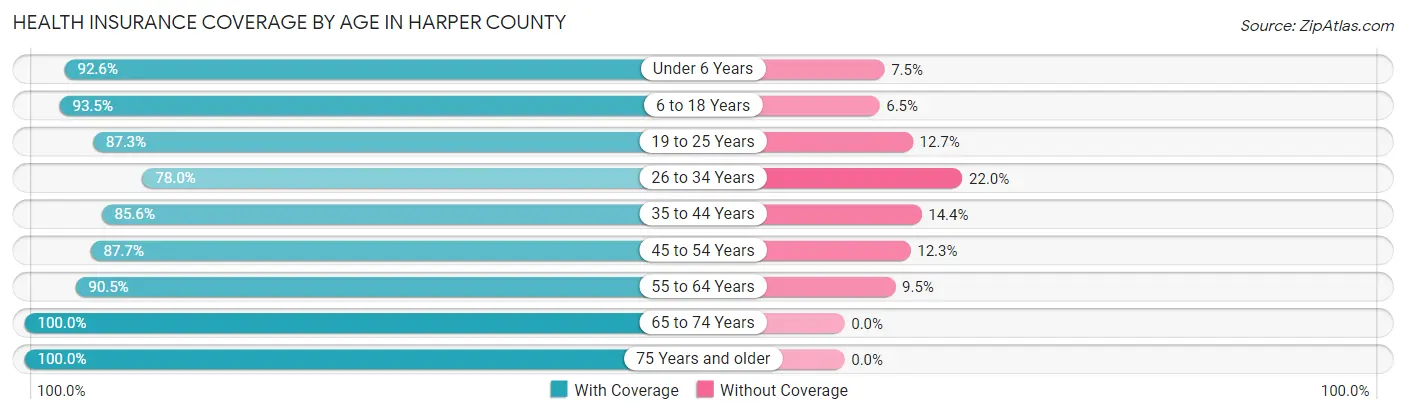
| Age Bracket | With Coverage | Without Coverage |
| Under 6 Years | 348 (92.5%) | 28 (7.4%) |
| 6 to 18 Years | 1,046 (93.5%) | 73 (6.5%) |
| 19 to 25 Years | 274 (87.3%) | 40 (12.7%) |
| 26 to 34 Years | 341 (78.0%) | 96 (22.0%) |
| 35 to 44 Years | 525 (85.6%) | 88 (14.4%) |
| 45 to 54 Years | 485 (87.7%) | 68 (12.3%) |
| 55 to 64 Years | 707 (90.5%) | 74 (9.5%) |
| 65 to 74 Years | 665 (100.0%) | 0 (0.0%) |
| 75 Years and older | 454 (100.0%) | 0 (0.0%) |
| Total | 4,845 (91.2%) | 467 (8.8%) |
Health Insurance Coverage by Citizenship Status in Harper County
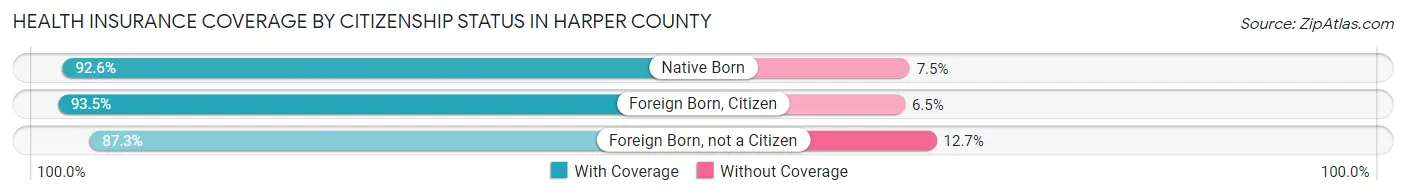
| Citizenship Status | With Coverage | Without Coverage |
| Native Born | 348 (92.5%) | 28 (7.4%) |
| Foreign Born, Citizen | 1,046 (93.5%) | 73 (6.5%) |
| Foreign Born, not a Citizen | 274 (87.3%) | 40 (12.7%) |
Health Insurance Coverage by Household Income in Harper County
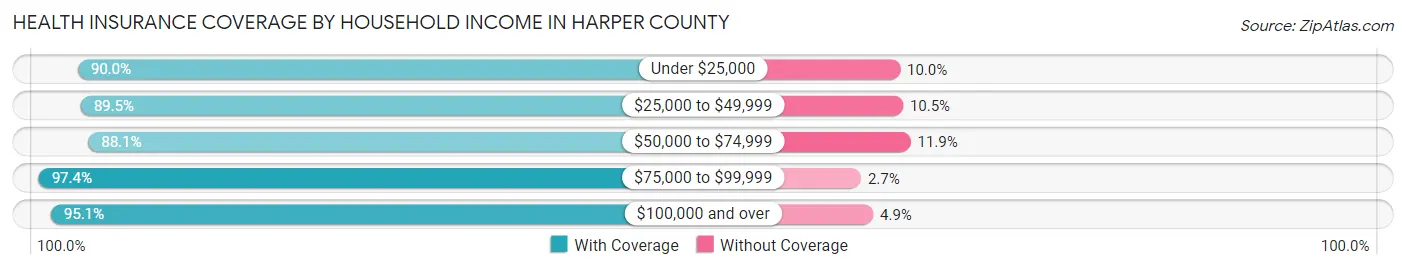
| Household Income | With Coverage | Without Coverage |
| Under $25,000 | 713 (90.0%) | 79 (10.0%) |
| $25,000 to $49,999 | 944 (89.5%) | 111 (10.5%) |
| $50,000 to $74,999 | 1,320 (88.1%) | 179 (11.9%) |
| $75,000 to $99,999 | 587 (97.4%) | 16 (2.6%) |
| $100,000 and over | 1,254 (95.1%) | 65 (4.9%) |
Public vs Private Health Insurance Coverage by Age in Harper County
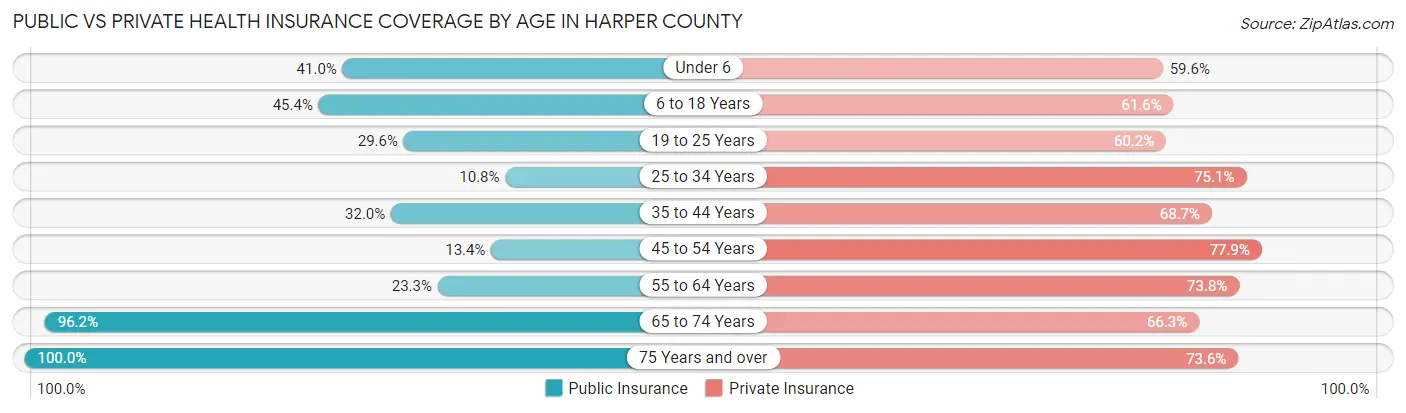
| Age Bracket | Public Insurance | Private Insurance |
| Under 6 | 154 (41.0%) | 224 (59.6%) |
| 6 to 18 Years | 508 (45.4%) | 689 (61.6%) |
| 19 to 25 Years | 93 (29.6%) | 189 (60.2%) |
| 25 to 34 Years | 47 (10.8%) | 328 (75.1%) |
| 35 to 44 Years | 196 (32.0%) | 421 (68.7%) |
| 45 to 54 Years | 74 (13.4%) | 431 (77.9%) |
| 55 to 64 Years | 182 (23.3%) | 576 (73.8%) |
| 65 to 74 Years | 640 (96.2%) | 441 (66.3%) |
| 75 Years and over | 454 (100.0%) | 334 (73.6%) |
| Total | 2,348 (44.2%) | 3,633 (68.4%) |
Disability Status by Sex by Age in Harper County
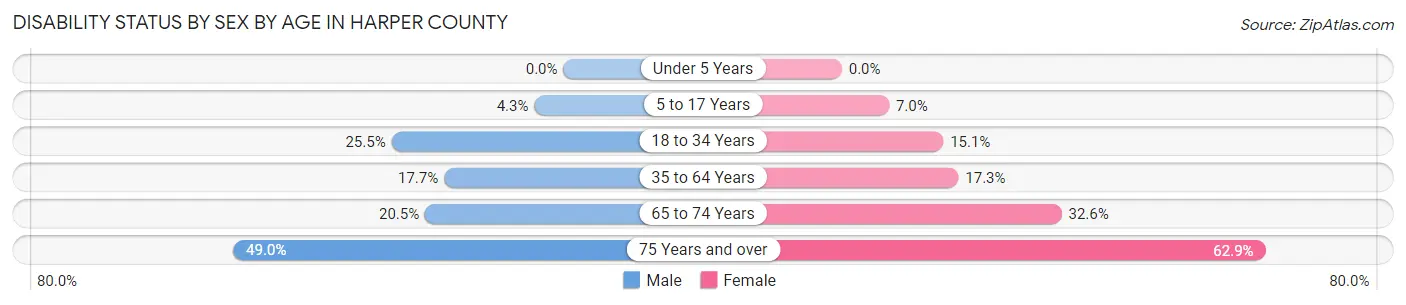
| Age Bracket | Male | Female |
| Under 5 Years | 0 (0.0%) | 0 (0.0%) |
| 5 to 17 Years | 21 (4.3%) | 38 (7.0%) |
| 18 to 34 Years | 110 (25.5%) | 67 (15.1%) |
| 35 to 64 Years | 179 (17.7%) | 162 (17.3%) |
| 65 to 74 Years | 68 (20.5%) | 109 (32.6%) |
| 75 Years and over | 101 (49.0%) | 156 (62.9%) |
Disability Class by Sex by Age in Harper County
Disability Class: Hearing Difficulty
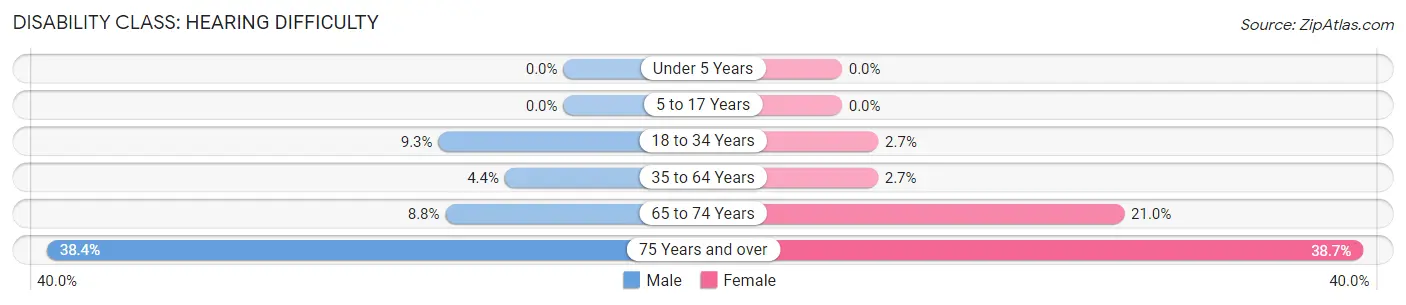
| Age Bracket | Male | Female |
| Under 5 Years | 0 (0.0%) | 0 (0.0%) |
| 5 to 17 Years | 0 (0.0%) | 0 (0.0%) |
| 18 to 34 Years | 40 (9.3%) | 12 (2.7%) |
| 35 to 64 Years | 44 (4.3%) | 25 (2.7%) |
| 65 to 74 Years | 29 (8.8%) | 70 (21.0%) |
| 75 Years and over | 79 (38.4%) | 96 (38.7%) |
Disability Class: Vision Difficulty
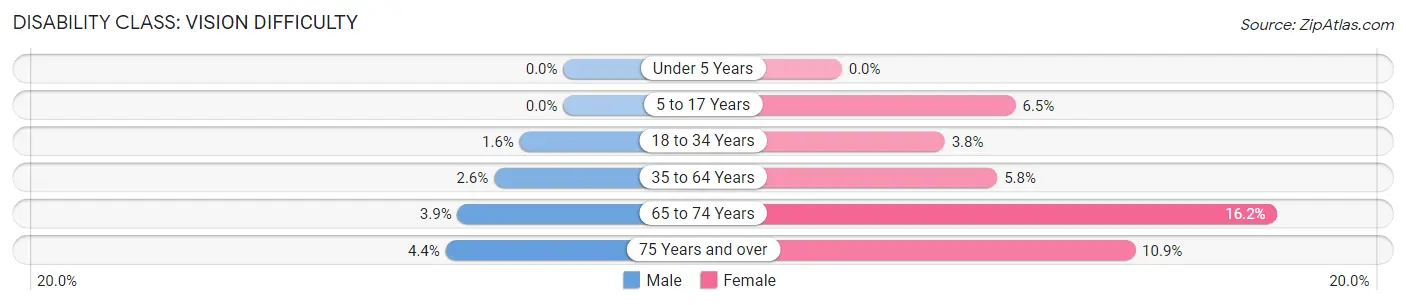
| Age Bracket | Male | Female |
| Under 5 Years | 0 (0.0%) | 0 (0.0%) |
| 5 to 17 Years | 0 (0.0%) | 35 (6.5%) |
| 18 to 34 Years | 7 (1.6%) | 17 (3.8%) |
| 35 to 64 Years | 26 (2.6%) | 54 (5.8%) |
| 65 to 74 Years | 13 (3.9%) | 54 (16.2%) |
| 75 Years and over | 9 (4.4%) | 27 (10.9%) |
Disability Class: Cognitive Difficulty
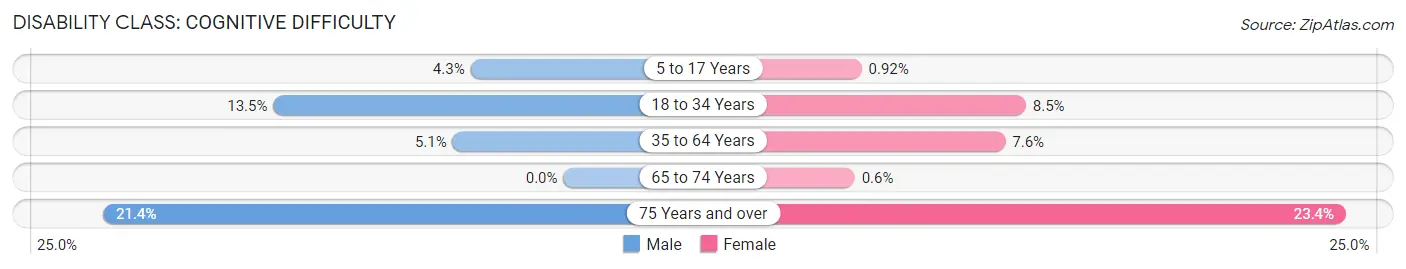
| Age Bracket | Male | Female |
| 5 to 17 Years | 21 (4.3%) | 5 (0.9%) |
| 18 to 34 Years | 58 (13.5%) | 38 (8.5%) |
| 35 to 64 Years | 52 (5.1%) | 71 (7.6%) |
| 65 to 74 Years | 0 (0.0%) | 2 (0.6%) |
| 75 Years and over | 44 (21.4%) | 58 (23.4%) |
Disability Class: Ambulatory Difficulty
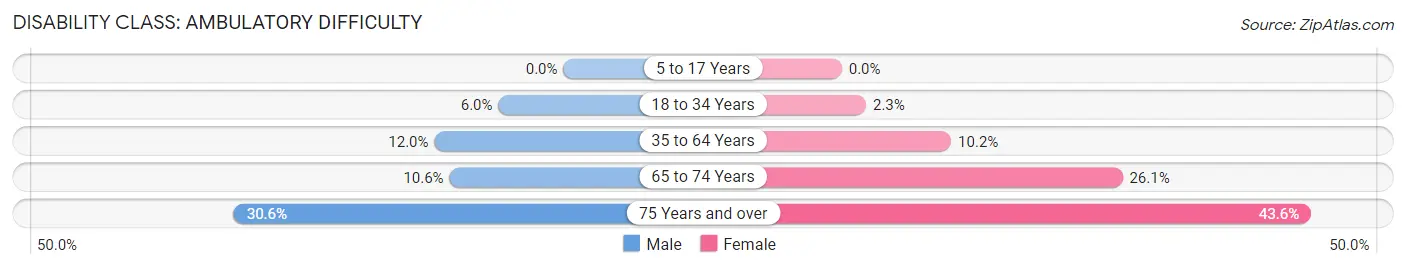
| Age Bracket | Male | Female |
| 5 to 17 Years | 0 (0.0%) | 0 (0.0%) |
| 18 to 34 Years | 26 (6.0%) | 10 (2.2%) |
| 35 to 64 Years | 121 (12.0%) | 95 (10.2%) |
| 65 to 74 Years | 35 (10.6%) | 87 (26.1%) |
| 75 Years and over | 63 (30.6%) | 108 (43.5%) |
Disability Class: Self-Care Difficulty
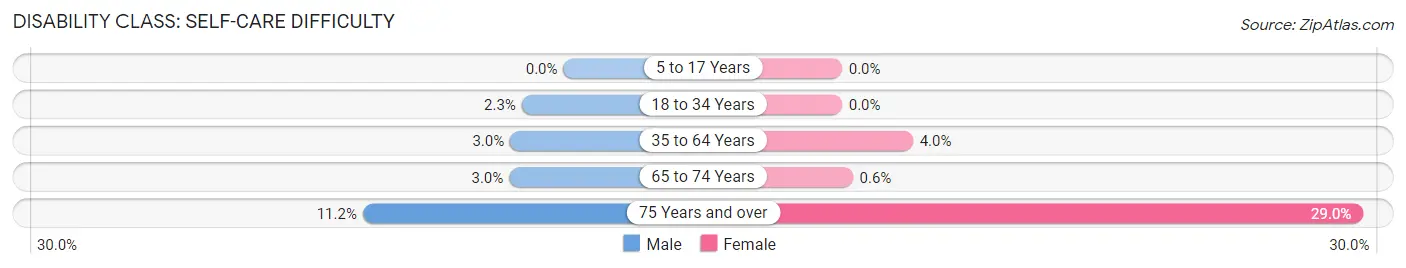
| Age Bracket | Male | Female |
| 5 to 17 Years | 0 (0.0%) | 0 (0.0%) |
| 18 to 34 Years | 10 (2.3%) | 0 (0.0%) |
| 35 to 64 Years | 30 (3.0%) | 37 (4.0%) |
| 65 to 74 Years | 10 (3.0%) | 2 (0.6%) |
| 75 Years and over | 23 (11.2%) | 72 (29.0%) |
Technology Access in Harper County
Computing Device Access in Harper County
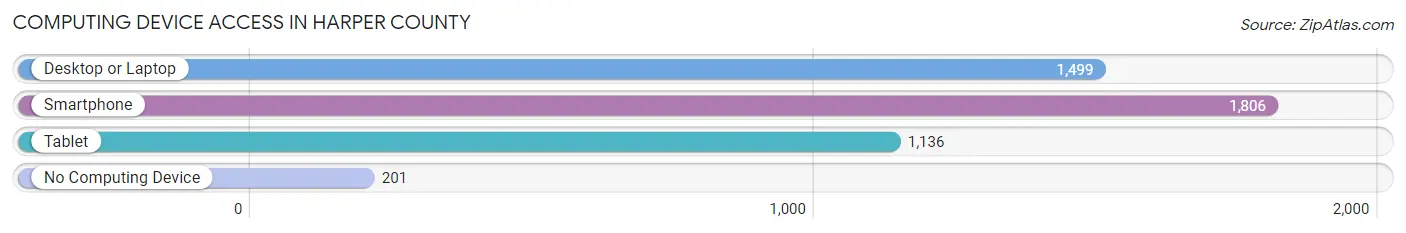
| Device Type | # Households | % Households |
| Desktop or Laptop | 1,499 | 68.6% |
| Smartphone | 1,806 | 82.6% |
| Tablet | 1,136 | 52.0% |
| No Computing Device | 201 | 9.2% |
| Total | 2,186 | 100.0% |
Internet Access in Harper County
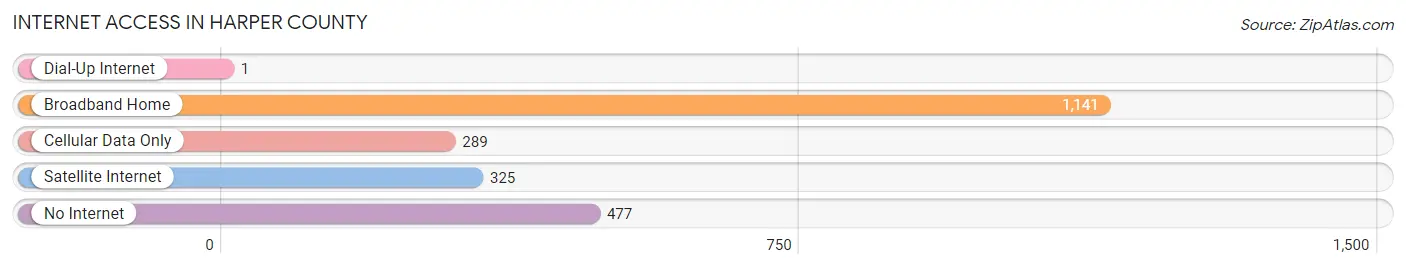
| Internet Type | # Households | % Households |
| Dial-Up Internet | 1 | 0.1% |
| Broadband Home | 1,141 | 52.2% |
| Cellular Data Only | 289 | 13.2% |
| Satellite Internet | 325 | 14.9% |
| No Internet | 477 | 21.8% |
| Total | 2,186 | 100.0% |
Harper County Summary
Harper County is located in the south-central region of Kansas, and is bordered by Barber County to the north, Kingman County to the east, Sumner County to the south, and Woods County, Oklahoma to the west. The county seat is Anthony, and the largest city is Harper. As of the 2010 census, the population was 6,034.
History
Harper County was established in 1867, and was named for Sergeant Marion Harper, who was killed in the Civil War. The county was originally part of the Cherokee Outlet, and was opened to settlement in 1893. The first settlers arrived in 1894, and the county was officially organized in 1895.
The county was initially an agricultural area, with wheat, corn, and sorghum being the main crops. In the early 1900s, oil and gas were discovered in the county, and the oil boom of the 1920s and 1930s brought a large influx of people and money to the area.
Geography
Harper County covers an area of 876 square miles, and is located in the Great Plains region of the United States. The county is mostly flat, with some rolling hills in the western part of the county. The Arkansas River runs through the county, and there are several small lakes and reservoirs.
The climate is semi-arid, with hot summers and cold winters. The average annual precipitation is about 22 inches.
Economy
Agriculture is the main economic activity in Harper County. The main crops are wheat, corn, sorghum, and hay. Cattle and sheep are also raised in the county.
Oil and gas production is also an important part of the economy. There are several oil and gas fields in the county, and the production of oil and gas has been increasing in recent years.
The county also has a growing tourism industry, with several attractions, including the Harper County Museum, the Harper County Historical Society, and the Harper County Fair.
Demographics
As of the 2010 census, there were 6,034 people, 2,323 households, and 1,619 families living in the county. The population density was 6.9 people per square mile. The racial makeup of the county was 95.3% White, 0.7% Black or African American, 0.7% Native American, 0.3% Asian, 0.1% Pacific Islander, 1.3% from other races, and 1.6% from two or more races. Hispanic or Latino of any race were 3.2% of the population.
The median income for a household in the county was $41,945, and the median income for a family was $50,938. The per capita income for the county was $20,845. About 11.2% of families and 14.2% of the population were below the poverty line, including 19.2% of those under age 18 and 8.2% of those age 65 or over.
Common Questions
What is Per Capita Income in Harper County?
Per Capita income in Harper County is $26,970.
What is the Median Family Income in Harper County?
Median Family Income in Harper County is $64,750.
What is the Median Household income in Harper County?
Median Household Income in Harper County is $53,032.
What is Income or Wage Gap in Harper County?
Income or Wage Gap in Harper County is 40.6%.
Women in Harper County earn 59.4 cents for every dollar earned by a man.
What is Inequality or Gini Index in Harper County?
Inequality or Gini Index in Harper County is 0.44.
What is the Total Population of Harper County?
Total Population of Harper County is 5,457.
What is the Total Male Population of Harper County?
Total Male Population of Harper County is 2,698.
What is the Total Female Population of Harper County?
Total Female Population of Harper County is 2,759.
What is the Ratio of Males per 100 Females in Harper County?
There are 97.79 Males per 100 Females in Harper County.
What is the Ratio of Females per 100 Males in Harper County?
There are 102.26 Females per 100 Males in Harper County.
What is the Median Population Age in Harper County?
Median Population Age in Harper County is 41.5 Years.
What is the Average Family Size in Harper County
Average Family Size in Harper County is 3.1 People.
What is the Average Household Size in Harper County
Average Household Size in Harper County is 2.4 People.
How Large is the Labor Force in Harper County?
There are 2,287 People in the Labor Forcein in Harper County.
What is the Percentage of People in the Labor Force in Harper County?
53.5% of People are in the Labor Force in Harper County.
What is the Unemployment Rate in Harper County?
Unemployment Rate in Harper County is 5.3%.