Hamilton County, KS Map & Demographics
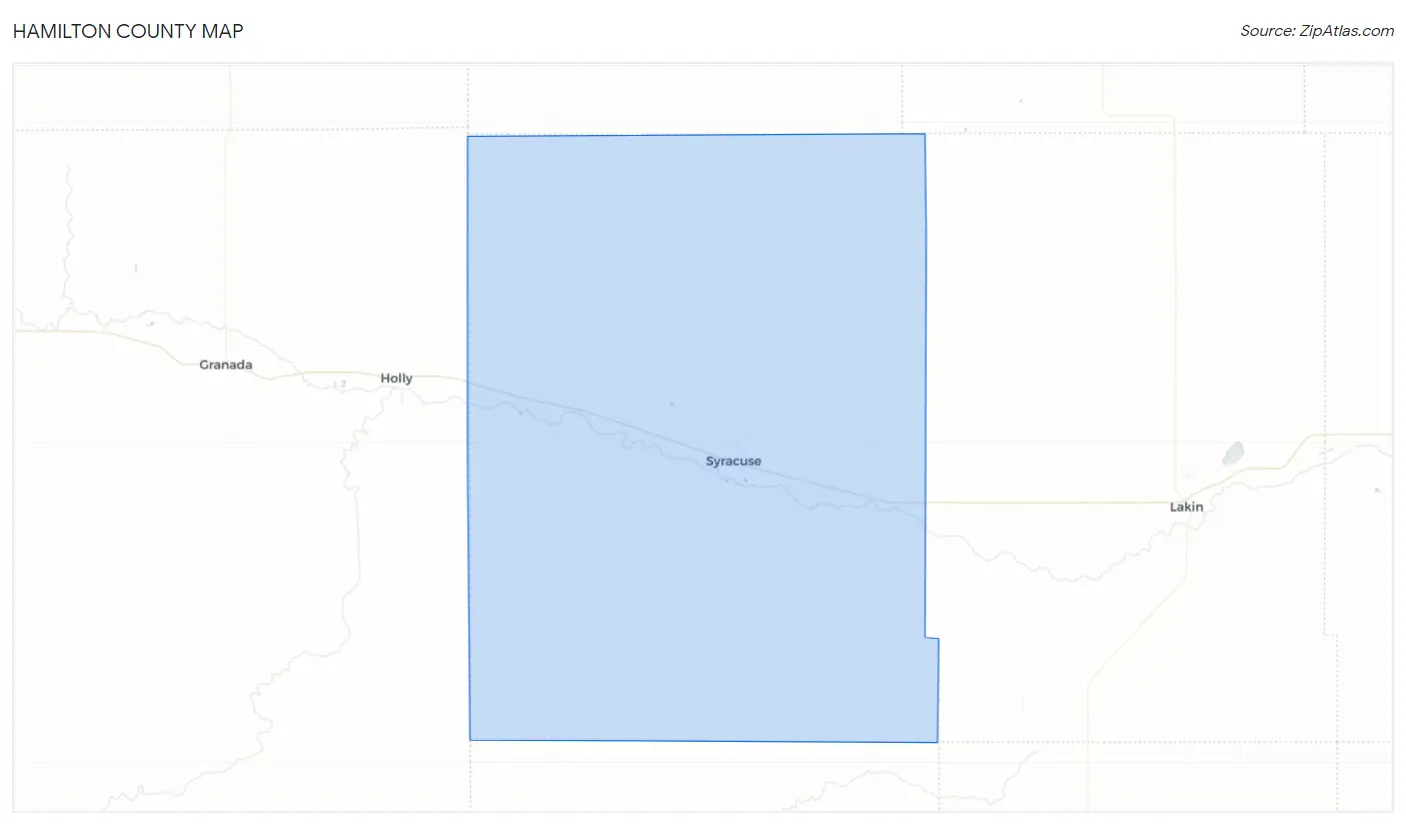
Hamilton County Map
Hamilton County Overview
$28,145
PER CAPITA INCOME
$73,350
AVG FAMILY INCOME
$58,750
AVG HOUSEHOLD INCOME
40.8%
WAGE / INCOME GAP [ % ]
59.2¢/ $1
WAGE / INCOME GAP [ $ ]
0.39
INEQUALITY / GINI INDEX
2,520
TOTAL POPULATION
1,287
MALE POPULATION
1,233
FEMALE POPULATION
104.38
MALES / 100 FEMALES
95.80
FEMALES / 100 MALES
35.4
MEDIAN AGE
4.5
AVG FAMILY SIZE
3.5
AVG HOUSEHOLD SIZE
1,174
LABOR FORCE [ PEOPLE ]
64.1%
PERCENT IN LABOR FORCE
Hamilton County Area Codes
Income in Hamilton County
Income Overview in Hamilton County
Per Capita Income in Hamilton County is $28,145, while median incomes of families and households are $73,350 and $58,750 respectively.
| Characteristic | Number | Measure |
| Per Capita Income | 2,520 | $28,145 |
| Median Family Income | 459 | $73,350 |
| Mean Family Income | 459 | $83,702 |
| Median Household Income | 716 | $58,750 |
| Mean Household Income | 716 | $72,397 |
| Income Deficit | 459 | $0 |
| Wage / Income Gap (%) | 2,520 | 40.82% |
| Wage / Income Gap ($) | 2,520 | 59.18¢ per $1 |
| Gini / Inequality Index | 2,520 | 0.39 |
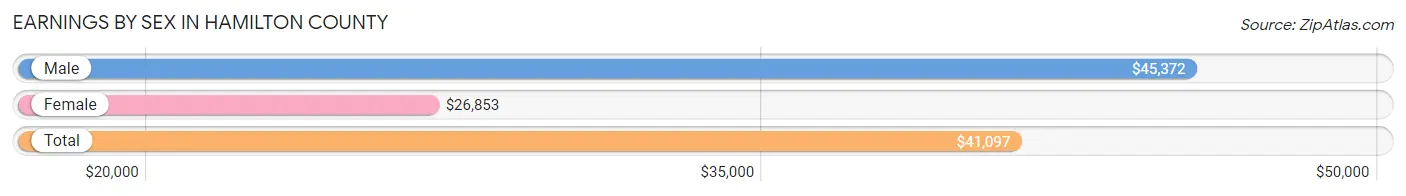
Earnings by Sex in Hamilton County
Average Earnings in Hamilton County are $41,097, $45,372 for men and $26,853 for women, a difference of 40.8%.
| Sex | Number | Average Earnings |
| Male | 794 (63.0%) | $45,372 |
| Female | 467 (37.0%) | $26,853 |
| Total | 1,261 (100.0%) | $41,097 |
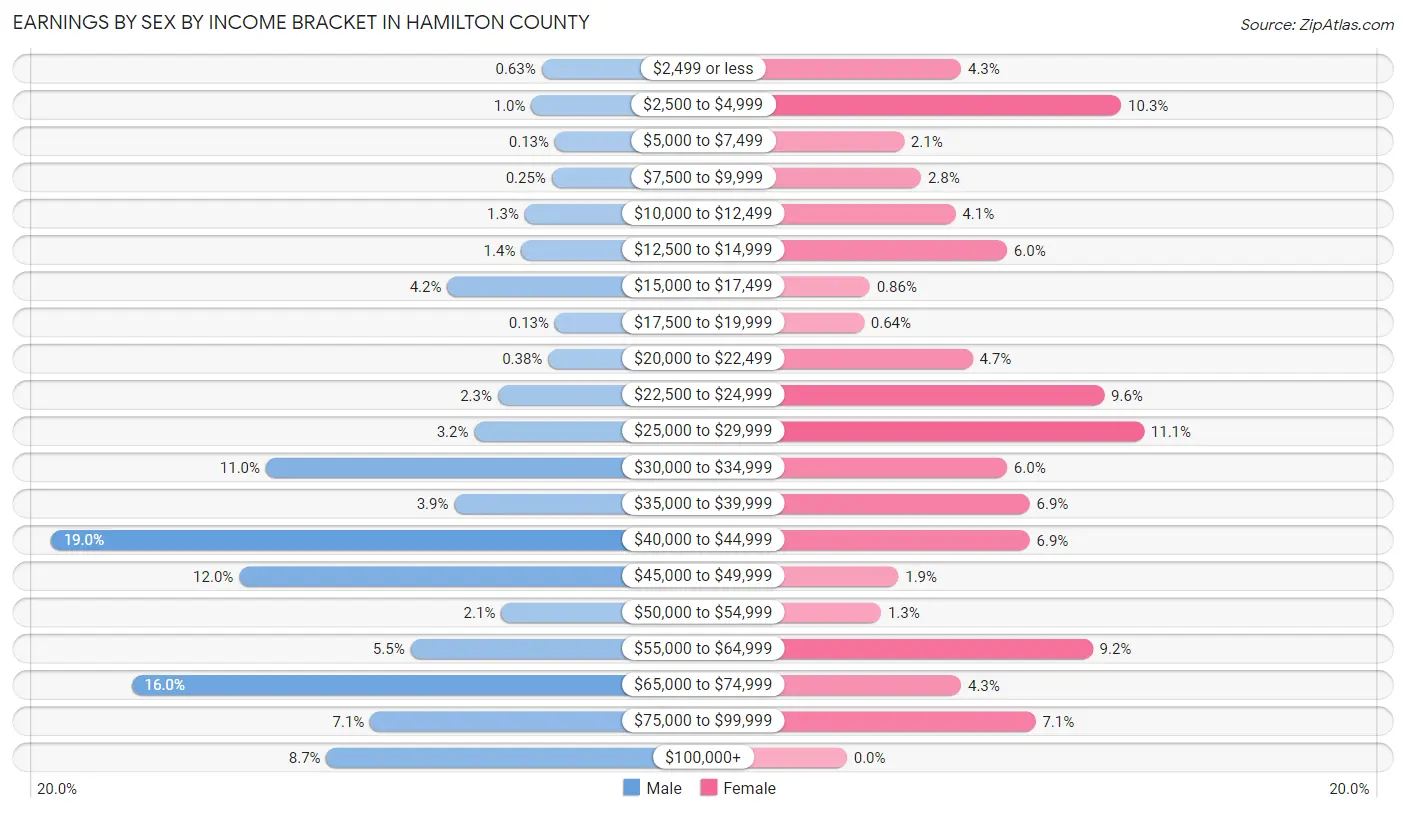
Earnings by Sex by Income Bracket in Hamilton County
The most common earnings brackets in Hamilton County are $40,000 to $44,999 for men (151 | 19.0%) and $25,000 to $29,999 for women (52 | 11.1%).
| Income | Male | Female |
| $2,499 or less | 5 (0.6%) | 20 (4.3%) |
| $2,500 to $4,999 | 8 (1.0%) | 48 (10.3%) |
| $5,000 to $7,499 | 1 (0.1%) | 10 (2.1%) |
| $7,500 to $9,999 | 2 (0.3%) | 13 (2.8%) |
| $10,000 to $12,499 | 10 (1.3%) | 19 (4.1%) |
| $12,500 to $14,999 | 11 (1.4%) | 28 (6.0%) |
| $15,000 to $17,499 | 33 (4.2%) | 4 (0.9%) |
| $17,500 to $19,999 | 1 (0.1%) | 3 (0.6%) |
| $20,000 to $22,499 | 3 (0.4%) | 22 (4.7%) |
| $22,500 to $24,999 | 18 (2.3%) | 45 (9.6%) |
| $25,000 to $29,999 | 25 (3.2%) | 52 (11.1%) |
| $30,000 to $34,999 | 87 (11.0%) | 28 (6.0%) |
| $35,000 to $39,999 | 31 (3.9%) | 32 (6.9%) |
| $40,000 to $44,999 | 151 (19.0%) | 32 (6.9%) |
| $45,000 to $49,999 | 95 (12.0%) | 9 (1.9%) |
| $50,000 to $54,999 | 17 (2.1%) | 6 (1.3%) |
| $55,000 to $64,999 | 44 (5.5%) | 43 (9.2%) |
| $65,000 to $74,999 | 127 (16.0%) | 20 (4.3%) |
| $75,000 to $99,999 | 56 (7.0%) | 33 (7.1%) |
| $100,000+ | 69 (8.7%) | 0 (0.0%) |
| Total | 794 (100.0%) | 467 (100.0%) |
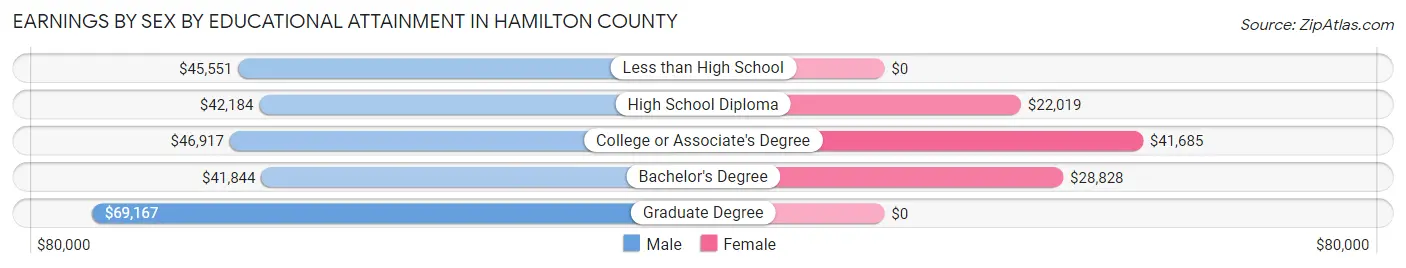
Earnings by Sex by Educational Attainment in Hamilton County
Average earnings in Hamilton County are $44,432 for men and $32,143 for women, a difference of 27.7%. Men with an educational attainment of graduate degree enjoy the highest average annual earnings of $69,167, while those with bachelor's degree education earn the least with $41,844. Women with an educational attainment of college or associate's degree earn the most with the average annual earnings of $41,685, while those with high school diploma education have the smallest earnings of $22,019.
| Educational Attainment | Male Income | Female Income |
| Less than High School | $45,551 | $0 |
| High School Diploma | $42,184 | $22,019 |
| College or Associate's Degree | $46,917 | $41,685 |
| Bachelor's Degree | $41,844 | $28,828 |
| Graduate Degree | $69,167 | $0 |
| Total | $44,432 | $32,143 |
Family Income in Hamilton County
Family Income Brackets in Hamilton County
According to the Hamilton County family income data, there are 128 families falling into the $100,000 to $149,999 income range, which is the most common income bracket and makes up 27.9% of all families.
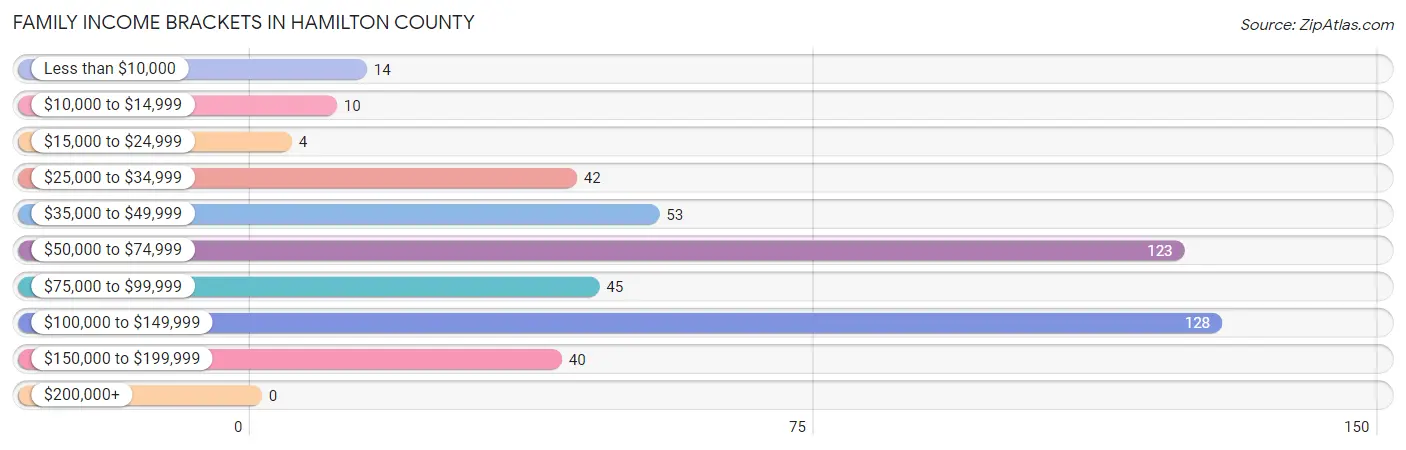
| Income Bracket | # Families | % Families |
| Less than $10,000 | 14 | 3.1% |
| $10,000 to $14,999 | 10 | 2.2% |
| $15,000 to $24,999 | 4 | 0.9% |
| $25,000 to $34,999 | 42 | 9.2% |
| $35,000 to $49,999 | 53 | 11.5% |
| $50,000 to $74,999 | 123 | 26.8% |
| $75,000 to $99,999 | 45 | 9.8% |
| $100,000 to $149,999 | 128 | 27.9% |
| $150,000 to $199,999 | 40 | 8.7% |
| $200,000+ | 0 | 0.0% |
Family Income by Famaliy Size in Hamilton County
6-person families (46 | 10.0%) account for the highest median family income in Hamilton County with $171,250 per family, while 2-person families (236 | 51.4%) have the highest median income of $33,584 per family member.
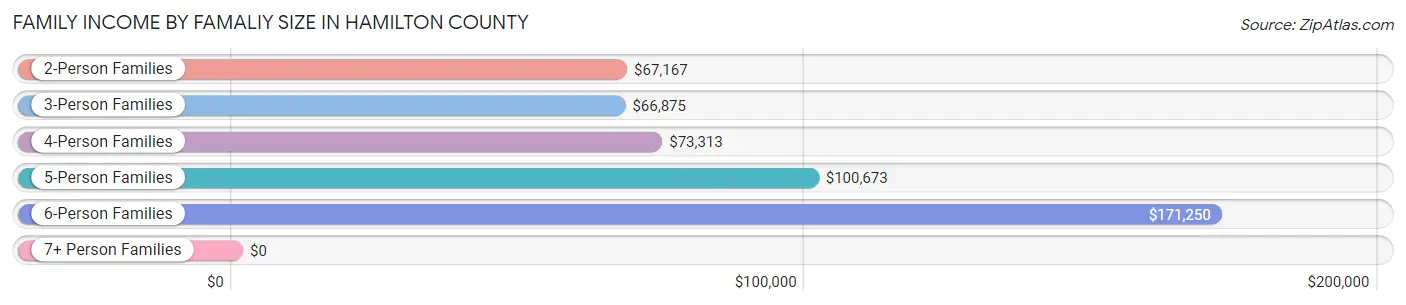
| Income Bracket | # Families | Median Income |
| 2-Person Families | 236 (51.4%) | $67,167 |
| 3-Person Families | 81 (17.6%) | $66,875 |
| 4-Person Families | 45 (9.8%) | $73,313 |
| 5-Person Families | 51 (11.1%) | $100,673 |
| 6-Person Families | 46 (10.0%) | $171,250 |
| 7+ Person Families | 0 (0.0%) | $0 |
| Total | 459 (100.0%) | $73,350 |
Family Income by Number of Earners in Hamilton County
The median family income in Hamilton County is $73,350, with families comprising 3+ earners (19) having the highest median family income of $125,750, while families with no earners (80) have the lowest median family income of $43,000, accounting for 4.1% and 17.4% of families, respectively.
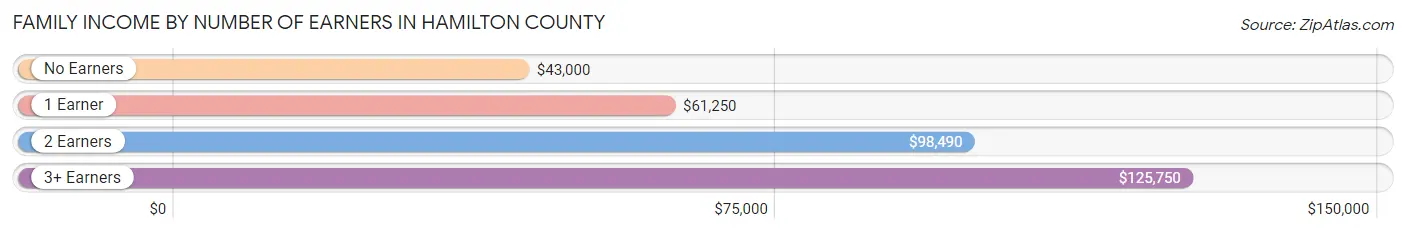
| Number of Earners | # Families | Median Income |
| No Earners | 80 (17.4%) | $43,000 |
| 1 Earner | 145 (31.6%) | $61,250 |
| 2 Earners | 215 (46.8%) | $98,490 |
| 3+ Earners | 19 (4.1%) | $125,750 |
| Total | 459 (100.0%) | $73,350 |
Household Income in Hamilton County
Household Income Brackets in Hamilton County
With 144 households falling in the category, the $100,000 to $149,999 income range is the most frequent in Hamilton County, accounting for 20.1% of all households.
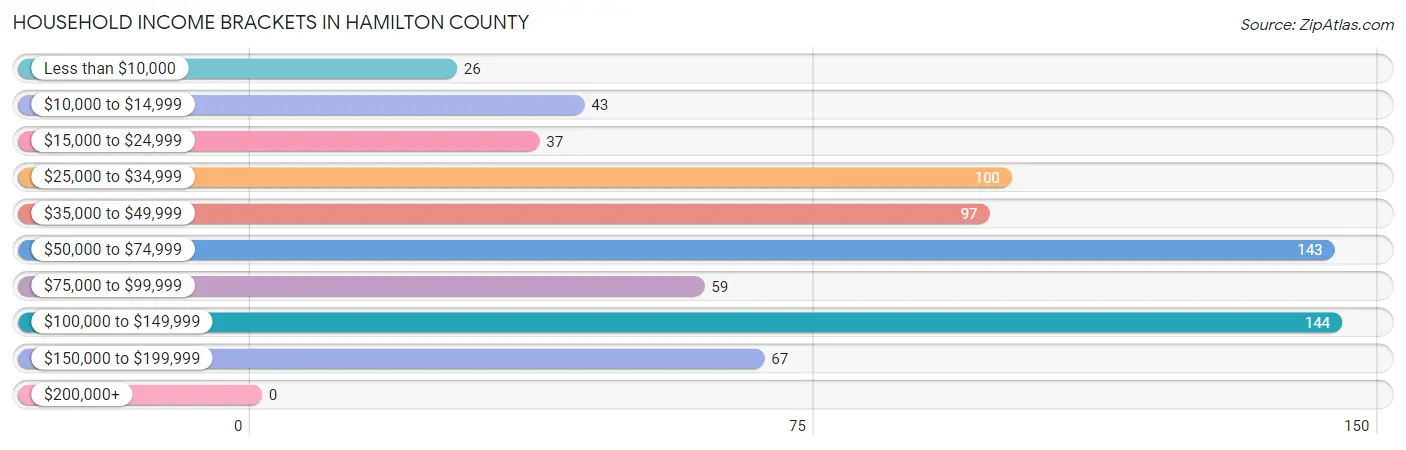
| Income Bracket | # Households | % Households |
| Less than $10,000 | 26 | 3.6% |
| $10,000 to $14,999 | 43 | 6.0% |
| $15,000 to $24,999 | 37 | 5.2% |
| $25,000 to $34,999 | 100 | 14.0% |
| $35,000 to $49,999 | 97 | 13.5% |
| $50,000 to $74,999 | 143 | 20.0% |
| $75,000 to $99,999 | 59 | 8.2% |
| $100,000 to $149,999 | 144 | 20.1% |
| $150,000 to $199,999 | 67 | 9.4% |
| $200,000+ | 0 | 0.0% |
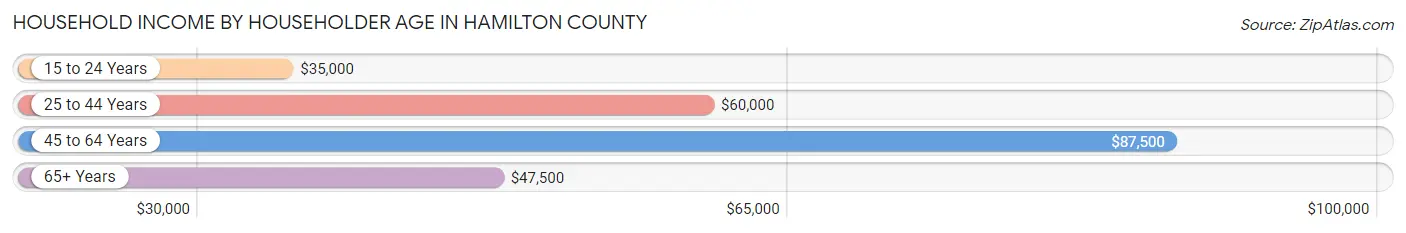
Household Income by Householder Age in Hamilton County
The median household income in Hamilton County is $58,750, with the highest median household income of $87,500 found in the 45 to 64 years age bracket for the primary householder. A total of 238 households (33.2%) fall into this category. Meanwhile, the 15 to 24 years age bracket for the primary householder has the lowest median household income of $35,000, with 32 households (4.5%) in this group.
| Income Bracket | # Households | Median Income |
| 15 to 24 Years | 32 (4.5%) | $35,000 |
| 25 to 44 Years | 216 (30.2%) | $60,000 |
| 45 to 64 Years | 238 (33.2%) | $87,500 |
| 65+ Years | 230 (32.1%) | $47,500 |
| Total | 716 (100.0%) | $58,750 |
Poverty in Hamilton County
Income Below Poverty by Sex and Age in Hamilton County
With 4.1% poverty level for males and 11.8% for females among the residents of Hamilton County, 16 and 17 year old males and 75 year old and over females are the most vulnerable to poverty, with 13 males (21.3%) and 33 females (31.7%) in their respective age groups living below the poverty level.
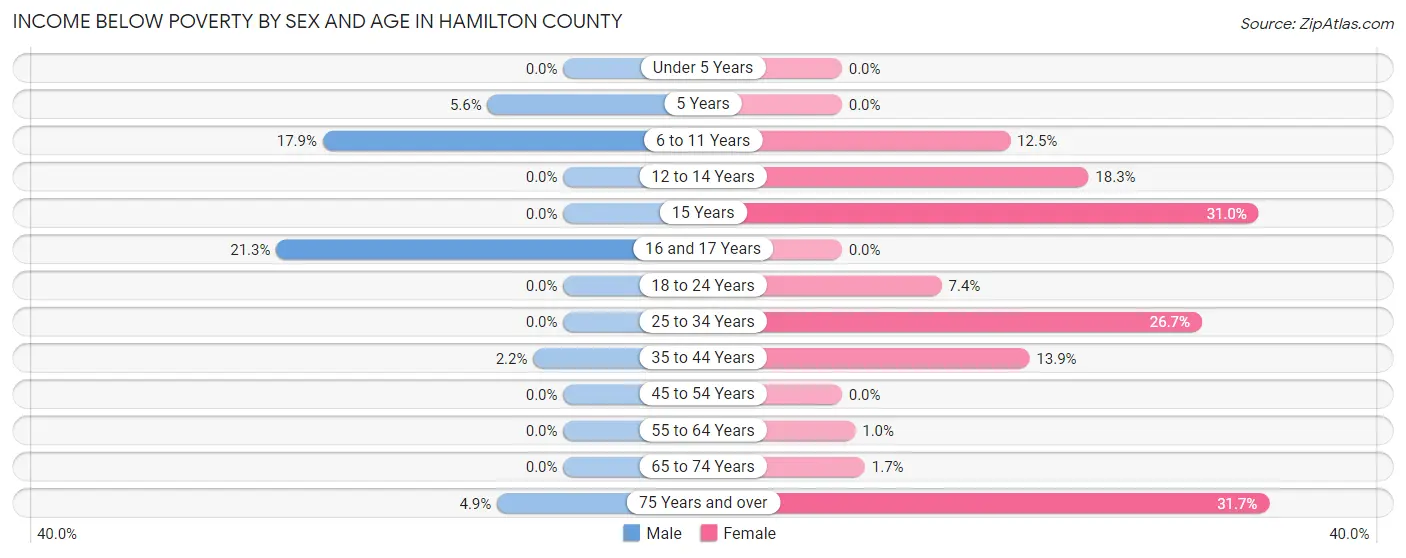
| Age Bracket | Male | Female |
| Under 5 Years | 0 (0.0%) | 0 (0.0%) |
| 5 Years | 4 (5.6%) | 0 (0.0%) |
| 6 to 11 Years | 25 (17.9%) | 21 (12.5%) |
| 12 to 14 Years | 0 (0.0%) | 13 (18.3%) |
| 15 Years | 0 (0.0%) | 13 (30.9%) |
| 16 and 17 Years | 13 (21.3%) | 0 (0.0%) |
| 18 to 24 Years | 0 (0.0%) | 8 (7.4%) |
| 25 to 34 Years | 0 (0.0%) | 27 (26.7%) |
| 35 to 44 Years | 7 (2.2%) | 28 (13.9%) |
| 45 to 54 Years | 0 (0.0%) | 0 (0.0%) |
| 55 to 64 Years | 0 (0.0%) | 1 (1.0%) |
| 65 to 74 Years | 0 (0.0%) | 2 (1.7%) |
| 75 Years and over | 3 (4.9%) | 33 (31.7%) |
| Total | 52 (4.1%) | 146 (11.8%) |
Income Above Poverty by Sex and Age in Hamilton County
According to the poverty statistics in Hamilton County, males aged under 5 years and females aged under 5 years are the age groups that are most secure financially, with 100.0% of males and 100.0% of females in these age groups living above the poverty line.
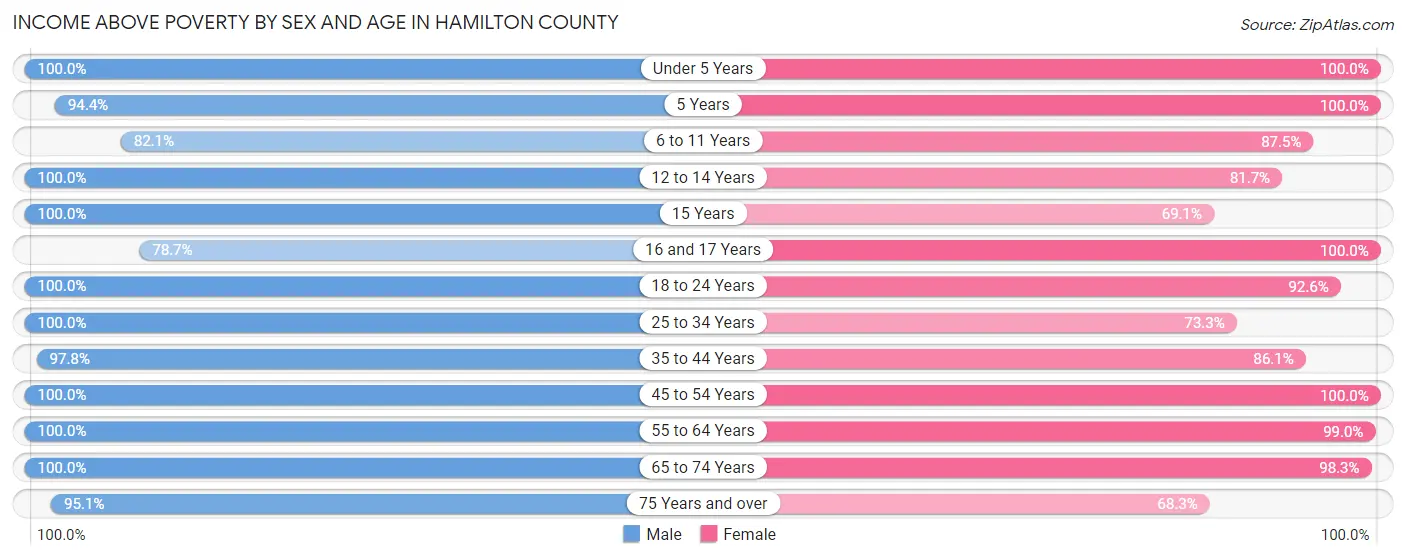
| Age Bracket | Male | Female |
| Under 5 Years | 67 (100.0%) | 81 (100.0%) |
| 5 Years | 67 (94.4%) | 15 (100.0%) |
| 6 to 11 Years | 115 (82.1%) | 147 (87.5%) |
| 12 to 14 Years | 23 (100.0%) | 58 (81.7%) |
| 15 Years | 10 (100.0%) | 29 (69.1%) |
| 16 and 17 Years | 48 (78.7%) | 15 (100.0%) |
| 18 to 24 Years | 133 (100.0%) | 100 (92.6%) |
| 25 to 34 Years | 145 (100.0%) | 74 (73.3%) |
| 35 to 44 Years | 307 (97.8%) | 173 (86.1%) |
| 45 to 54 Years | 52 (100.0%) | 110 (100.0%) |
| 55 to 64 Years | 122 (100.0%) | 99 (99.0%) |
| 65 to 74 Years | 79 (100.0%) | 115 (98.3%) |
| 75 Years and over | 58 (95.1%) | 71 (68.3%) |
| Total | 1,226 (95.9%) | 1,087 (88.2%) |
Income Below Poverty Among Married-Couple Families in Hamilton County
The poverty statistics for married-couple families in Hamilton County show that 3.7% or 13 of the total 348 families live below the poverty line. Families with 3 or 4 children have the highest poverty rate of 12.3%, comprising of 10 families. On the other hand, families with 1 or 2 children have the lowest poverty rate of 0.0%, which includes 0 families.
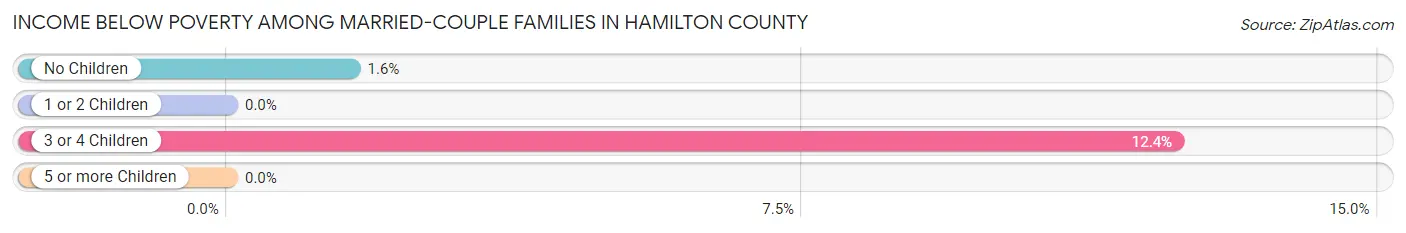
| Children | Above Poverty | Below Poverty |
| No Children | 185 (98.4%) | 3 (1.6%) |
| 1 or 2 Children | 79 (100.0%) | 0 (0.0%) |
| 3 or 4 Children | 71 (87.6%) | 10 (12.3%) |
| 5 or more Children | 0 (0.0%) | 0 (0.0%) |
| Total | 335 (96.3%) | 13 (3.7%) |
Income Below Poverty Among Single-Parent Households in Hamilton County
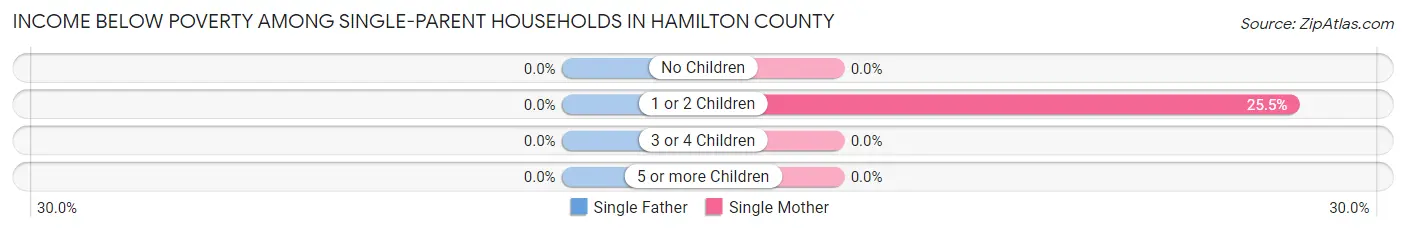
| Children | Single Father | Single Mother |
| No Children | 0 (0.0%) | 0 (0.0%) |
| 1 or 2 Children | 0 (0.0%) | 14 (25.5%) |
| 3 or 4 Children | 0 (0.0%) | 0 (0.0%) |
| 5 or more Children | 0 (0.0%) | 0 (0.0%) |
| Total | 0 (0.0%) | 14 (17.7%) |
Income Below Poverty Among Married-Couple vs Single-Parent Households in Hamilton County
The poverty data for Hamilton County shows that 13 of the married-couple family households (3.7%) and 14 of the single-parent households (12.6%) are living below the poverty level. Within the married-couple family households, those with 3 or 4 children have the highest poverty rate, with 10 households (12.3%) falling below the poverty line. Among the single-parent households, those with 1 or 2 children have the highest poverty rate, with 14 household (25.5%) living below poverty.
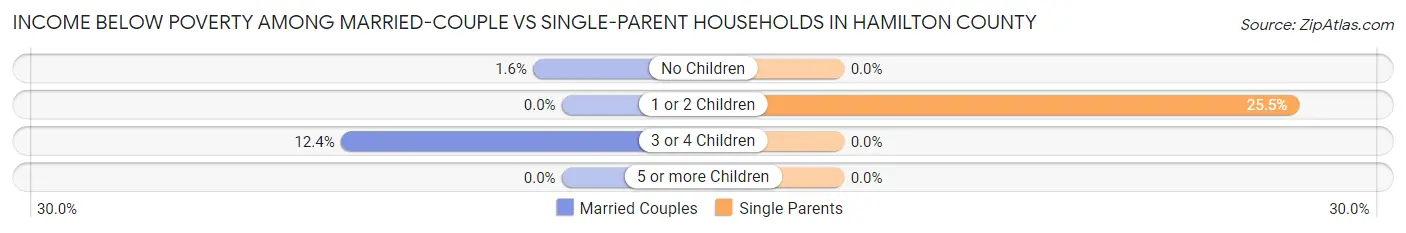
| Children | Married-Couple Families | Single-Parent Households |
| No Children | 3 (1.6%) | 0 (0.0%) |
| 1 or 2 Children | 0 (0.0%) | 14 (25.5%) |
| 3 or 4 Children | 10 (12.3%) | 0 (0.0%) |
| 5 or more Children | 0 (0.0%) | 0 (0.0%) |
| Total | 13 (3.7%) | 14 (12.6%) |
Race in Hamilton County
The most populous races in Hamilton County are White / Caucasian (2,055 | 81.6%), Hispanic or Latino (857 | 34.0%), and Two or more Races (263 | 10.4%).
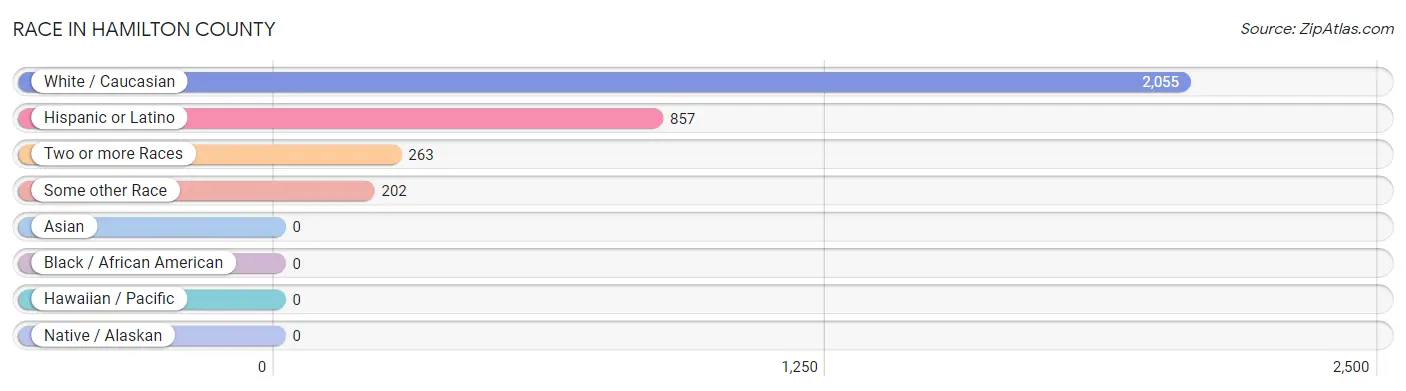
| Race | # Population | % Population |
| Asian | 0 | 0.0% |
| Black / African American | 0 | 0.0% |
| Hawaiian / Pacific | 0 | 0.0% |
| Hispanic or Latino | 857 | 34.0% |
| Native / Alaskan | 0 | 0.0% |
| White / Caucasian | 2,055 | 81.6% |
| Two or more Races | 263 | 10.4% |
| Some other Race | 202 | 8.0% |
| Total | 2,520 | 100.0% |
Ancestry in Hamilton County
The most populous ancestries reported in Hamilton County are German (648 | 25.7%), Mexican (641 | 25.4%), English (295 | 11.7%), Swedish (182 | 7.2%), and Central American (126 | 5.0%), together accounting for 75.1% of all Hamilton County residents.
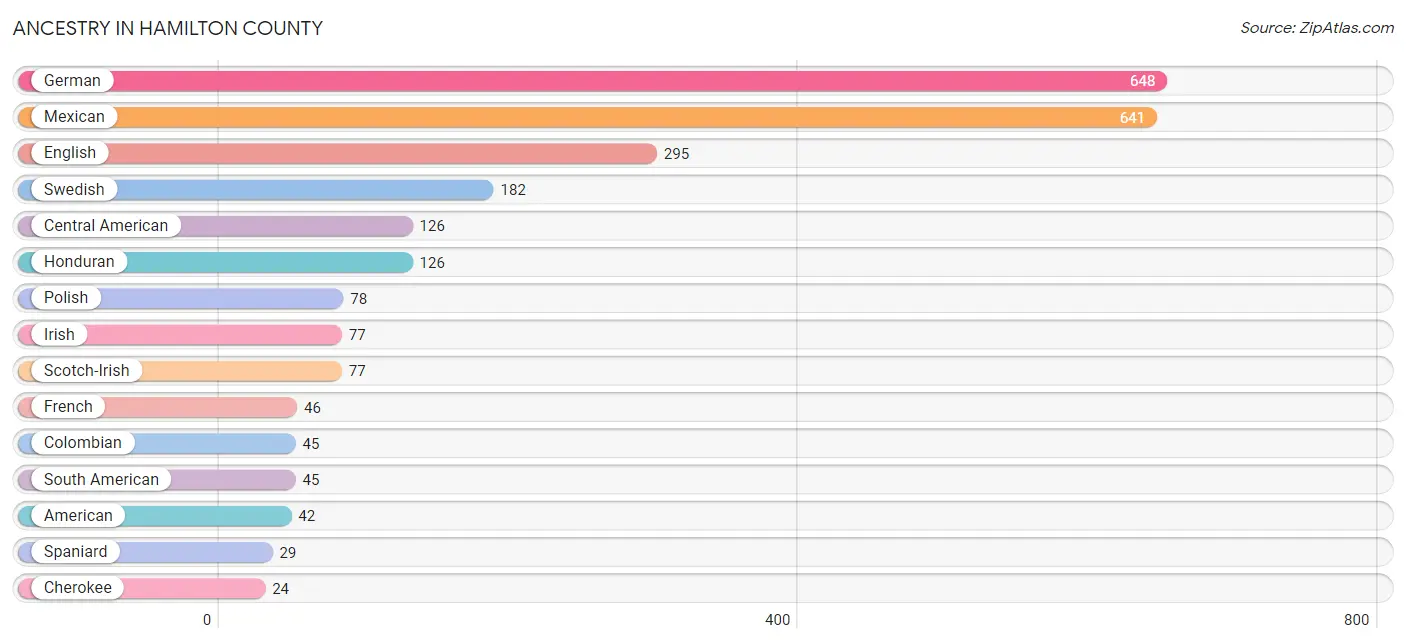
| Ancestry | # Population | % Population |
| American | 42 | 1.7% |
| British | 13 | 0.5% |
| Central American | 126 | 5.0% |
| Cherokee | 24 | 0.9% |
| Colombian | 45 | 1.8% |
| Danish | 3 | 0.1% |
| Dutch | 18 | 0.7% |
| Dutch West Indian | 1 | 0.0% |
| English | 295 | 11.7% |
| European | 3 | 0.1% |
| French | 46 | 1.8% |
| German | 648 | 25.7% |
| Honduran | 126 | 5.0% |
| Irish | 77 | 3.1% |
| Italian | 1 | 0.0% |
| Mexican | 641 | 25.4% |
| Mexican American Indian | 15 | 0.6% |
| Norwegian | 13 | 0.5% |
| Polish | 78 | 3.1% |
| Russian | 5 | 0.2% |
| Scotch-Irish | 77 | 3.1% |
| Scottish | 4 | 0.2% |
| South American | 45 | 1.8% |
| Spaniard | 29 | 1.1% |
| Swedish | 182 | 7.2% |
| Swiss | 4 | 0.2% | View All 26 Rows |
Immigrants in Hamilton County
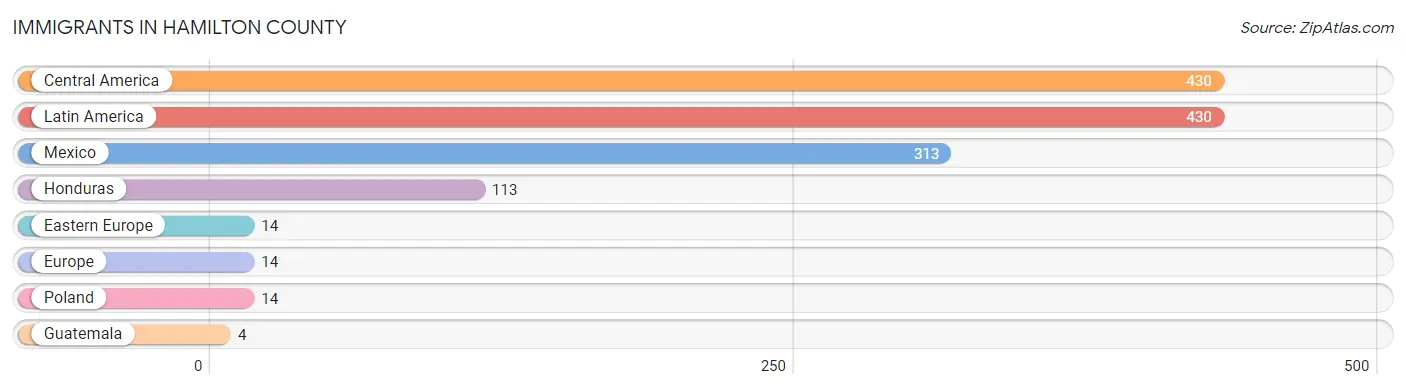
The most numerous immigrant groups reported in Hamilton County came from Central America (430 | 17.1%), Latin America (430 | 17.1%), Mexico (313 | 12.4%), Honduras (113 | 4.5%), and Eastern Europe (14 | 0.6%), together accounting for 51.6% of all Hamilton County residents.
| Immigration Origin | # Population | % Population |
| Central America | 430 | 17.1% |
| Eastern Europe | 14 | 0.6% |
| Europe | 14 | 0.6% |
| Guatemala | 4 | 0.2% |
| Honduras | 113 | 4.5% |
| Latin America | 430 | 17.1% |
| Mexico | 313 | 12.4% |
| Poland | 14 | 0.6% | View All 8 Rows |
Sex and Age in Hamilton County
Sex and Age in Hamilton County
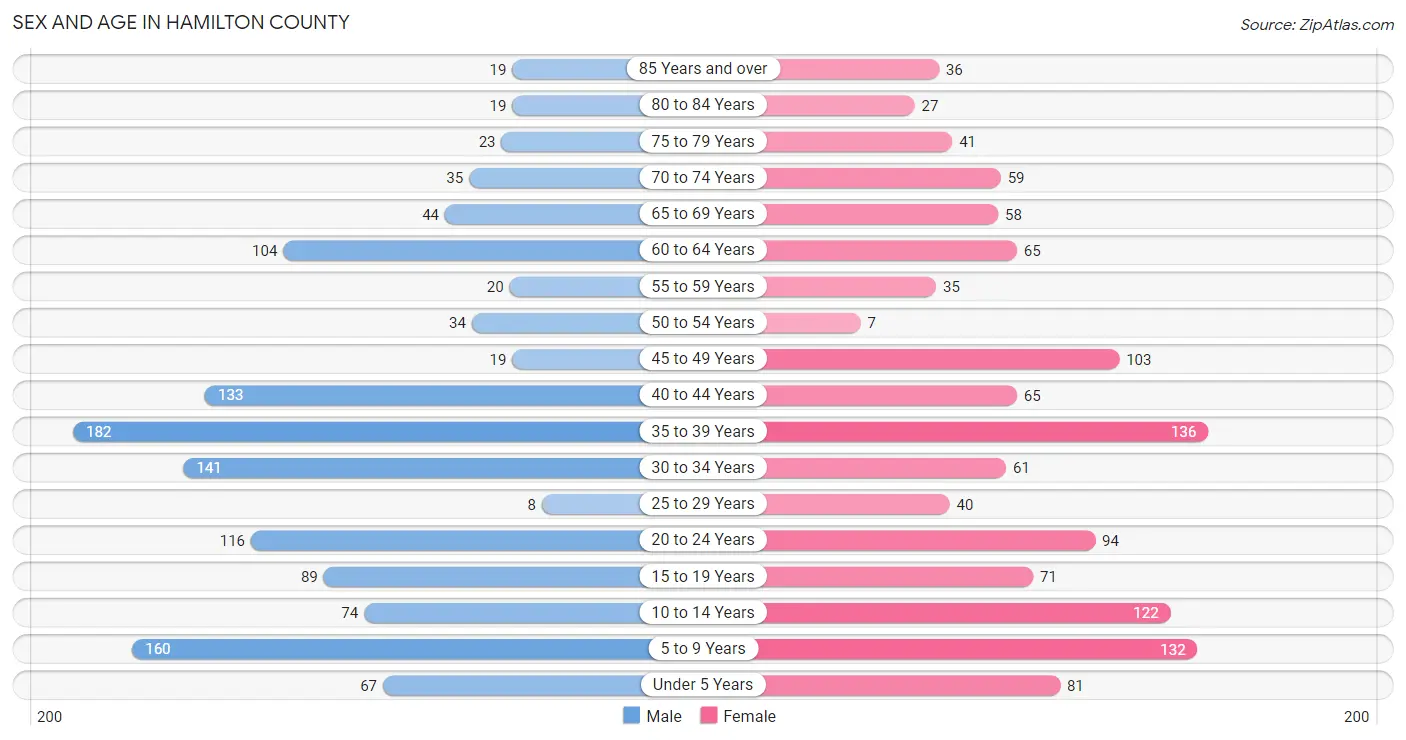
The most populous age groups in Hamilton County are 35 to 39 Years (182 | 14.1%) for men and 35 to 39 Years (136 | 11.0%) for women.
| Age Bracket | Male | Female |
| Under 5 Years | 67 (5.2%) | 81 (6.6%) |
| 5 to 9 Years | 160 (12.4%) | 132 (10.7%) |
| 10 to 14 Years | 74 (5.8%) | 122 (9.9%) |
| 15 to 19 Years | 89 (6.9%) | 71 (5.8%) |
| 20 to 24 Years | 116 (9.0%) | 94 (7.6%) |
| 25 to 29 Years | 8 (0.6%) | 40 (3.2%) |
| 30 to 34 Years | 141 (11.0%) | 61 (5.0%) |
| 35 to 39 Years | 182 (14.1%) | 136 (11.0%) |
| 40 to 44 Years | 133 (10.3%) | 65 (5.3%) |
| 45 to 49 Years | 19 (1.5%) | 103 (8.4%) |
| 50 to 54 Years | 34 (2.6%) | 7 (0.6%) |
| 55 to 59 Years | 20 (1.5%) | 35 (2.8%) |
| 60 to 64 Years | 104 (8.1%) | 65 (5.3%) |
| 65 to 69 Years | 44 (3.4%) | 58 (4.7%) |
| 70 to 74 Years | 35 (2.7%) | 59 (4.8%) |
| 75 to 79 Years | 23 (1.8%) | 41 (3.3%) |
| 80 to 84 Years | 19 (1.5%) | 27 (2.2%) |
| 85 Years and over | 19 (1.5%) | 36 (2.9%) |
| Total | 1,287 (100.0%) | 1,233 (100.0%) |
Families and Households in Hamilton County
Median Family Size in Hamilton County
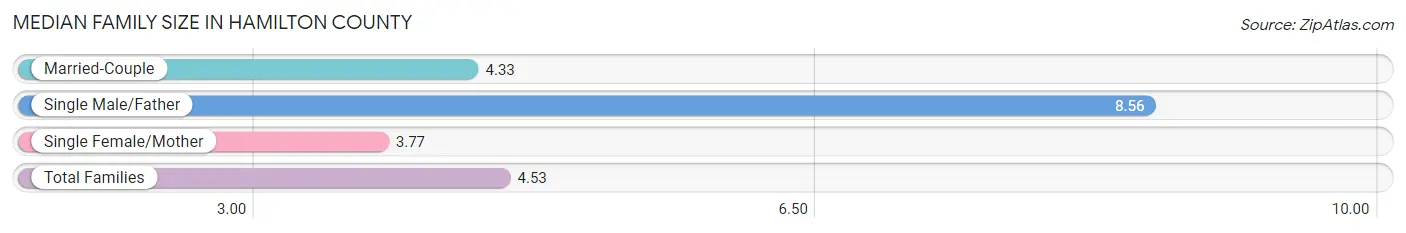
The median family size in Hamilton County is 4.53 persons per family, with single male/father families (32 | 7.0%) accounting for the largest median family size of 8.56 persons per family. On the other hand, single female/mother families (79 | 17.2%) represent the smallest median family size with 3.77 persons per family.
| Family Type | # Families | Family Size |
| Married-Couple | 348 (75.8%) | 4.33 |
| Single Male/Father | 32 (7.0%) | 8.56 |
| Single Female/Mother | 79 (17.2%) | 3.77 |
| Total Families | 459 (100.0%) | 4.53 |
Median Household Size in Hamilton County
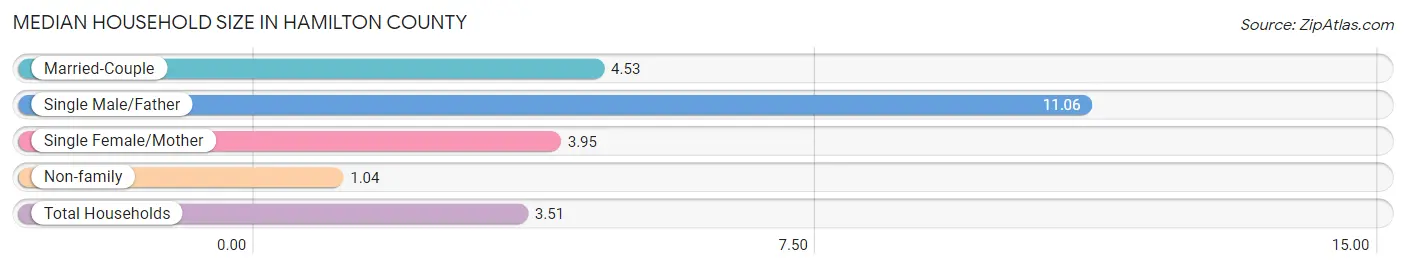
The median household size in Hamilton County is 3.51 persons per household, with single male/father households (32 | 4.5%) accounting for the largest median household size of 11.06 persons per household. non-family households (257 | 35.9%) represent the smallest median household size with 1.04 persons per household.
| Household Type | # Households | Household Size |
| Married-Couple | 348 (48.6%) | 4.53 |
| Single Male/Father | 32 (4.5%) | 11.06 |
| Single Female/Mother | 79 (11.0%) | 3.95 |
| Non-family | 257 (35.9%) | 1.04 |
| Total Households | 716 (100.0%) | 3.51 |
Household Size by Marriage Status in Hamilton County
Out of a total of 716 households in Hamilton County, 459 (64.1%) are family households, while 257 (35.9%) are nonfamily households. The most numerous type of family households are 2-person households, comprising 230, and the most common type of nonfamily households are 1-person households, comprising 246.
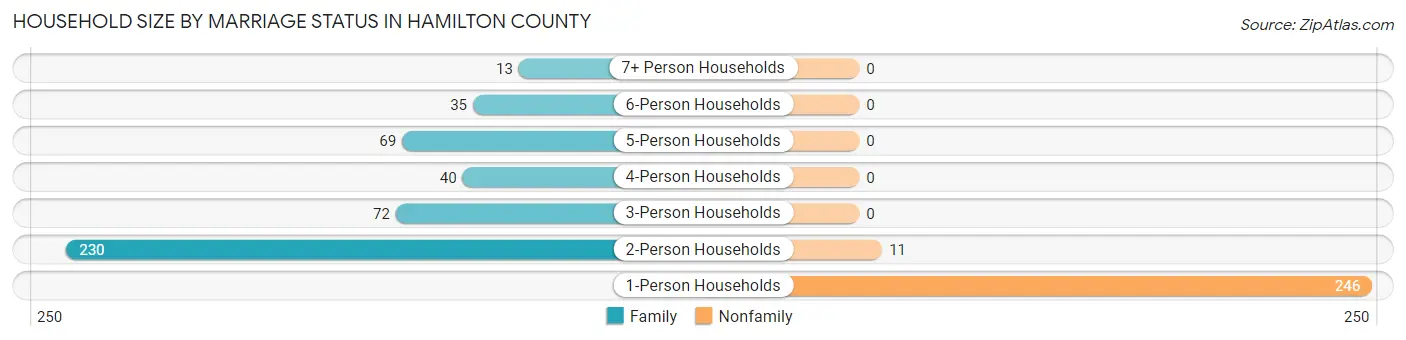
| Household Size | Family Households | Nonfamily Households |
| 1-Person Households | - | 246 (34.4%) |
| 2-Person Households | 230 (32.1%) | 11 (1.5%) |
| 3-Person Households | 72 (10.1%) | 0 (0.0%) |
| 4-Person Households | 40 (5.6%) | 0 (0.0%) |
| 5-Person Households | 69 (9.6%) | 0 (0.0%) |
| 6-Person Households | 35 (4.9%) | 0 (0.0%) |
| 7+ Person Households | 13 (1.8%) | 0 (0.0%) |
| Total | 459 (64.1%) | 257 (35.9%) |
Female Fertility in Hamilton County
Fertility by Age in Hamilton County
Average fertility rate in Hamilton County is 84.0 births per 1,000 women. Women in the age bracket of 20 to 34 years have the highest fertility rate with 246.0 births per 1,000 women. Women in the age bracket of 20 to 34 years acount for 100.0% of all women with births.
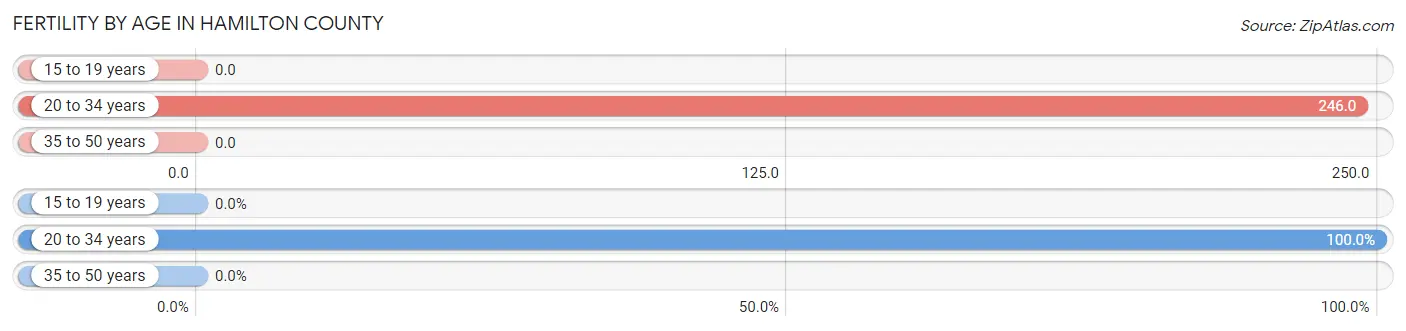
| Age Bracket | Women with Births | Births / 1,000 Women |
| 15 to 19 years | 0 (0.0%) | 0.0 |
| 20 to 34 years | 48 (100.0%) | 246.0 |
| 35 to 50 years | 0 (0.0%) | 0.0 |
| Total | 48 (100.0%) | 84.0 |
Fertility by Age by Marriage Status in Hamilton County
6.2% of women with births (48) in Hamilton County are married. The highest percentage of unmarried women with births falls into 20 to 34 years age bracket with 93.8% of them unmarried at the time of birth, while the lowest percentage of unmarried women with births belong to 20 to 34 years age bracket with 93.8% of them unmarried.
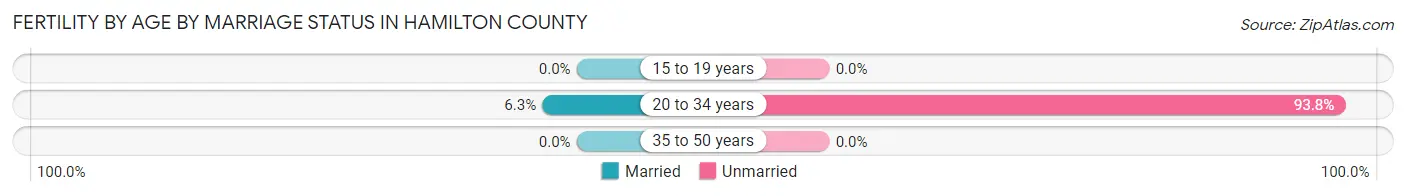
| Age Bracket | Married | Unmarried |
| 15 to 19 years | 0 (0.0%) | 0 (0.0%) |
| 20 to 34 years | 3 (6.2%) | 45 (93.8%) |
| 35 to 50 years | 0 (0.0%) | 0 (0.0%) |
| Total | 3 (6.2%) | 45 (93.8%) |
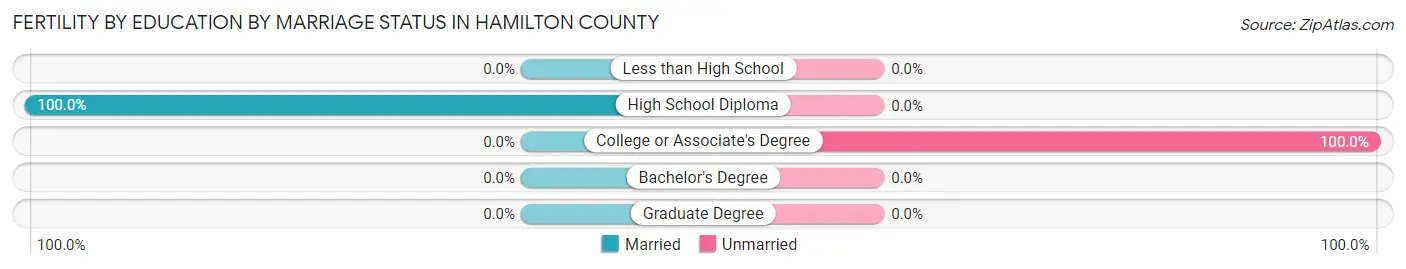
Fertility by Education in Hamilton County
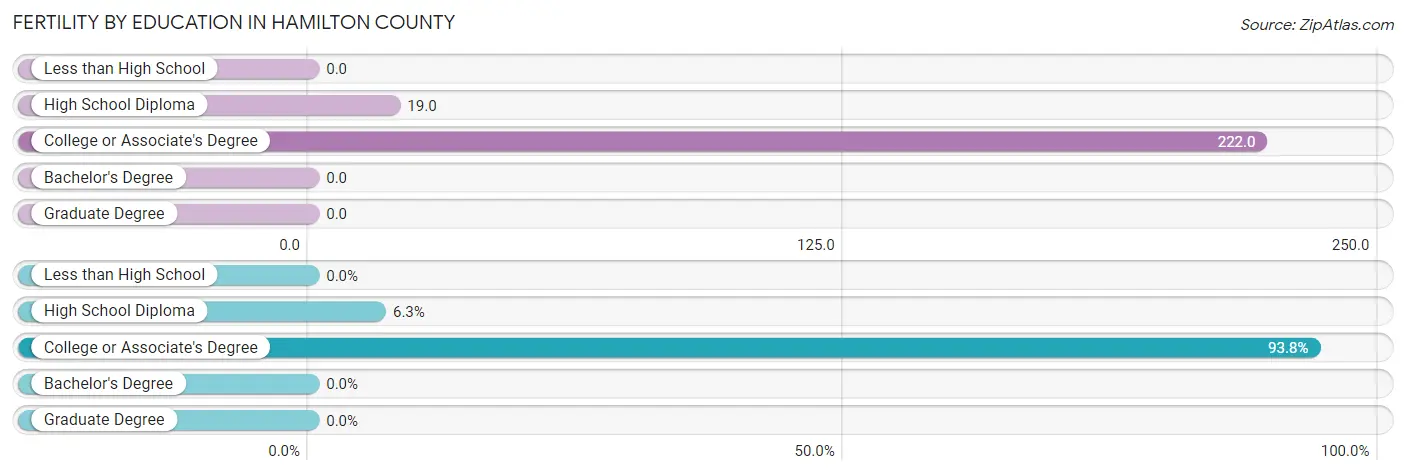
| Educational Attainment | Women with Births | Births / 1,000 Women |
| Less than High School | 0 (0.0%) | 0.0 |
| High School Diploma | 3 (6.2%) | 19.0 |
| College or Associate's Degree | 45 (93.8%) | 222.0 |
| Bachelor's Degree | 0 (0.0%) | 0.0 |
| Graduate Degree | 0 (0.0%) | 0.0 |
| Total | 48 (100.0%) | 84.0 |
Fertility by Education by Marriage Status in Hamilton County
93.8% of women with births in Hamilton County are unmarried. Women with the educational attainment of high school diploma are most likely to be married with 100.0% of them married at childbirth, while women with the educational attainment of college or associate's degree are least likely to be married with 100.0% of them unmarried at childbirth.
| Educational Attainment | Married | Unmarried |
| Less than High School | 0 (0.0%) | 0 (0.0%) |
| High School Diploma | 3 (100.0%) | 0 (0.0%) |
| College or Associate's Degree | 0 (0.0%) | 45 (100.0%) |
| Bachelor's Degree | 0 (0.0%) | 0 (0.0%) |
| Graduate Degree | 0 (0.0%) | 0 (0.0%) |
| Total | 3 (6.2%) | 45 (93.8%) |
Employment Characteristics in Hamilton County
Employment by Class of Employer in Hamilton County
Among the 1,161 employed individuals in Hamilton County, private company employees (718 | 61.8%), self-employed (not incorporated) (119 | 10.2%), and not-for-profit organizations (117 | 10.1%) make up the most common classes of employment.
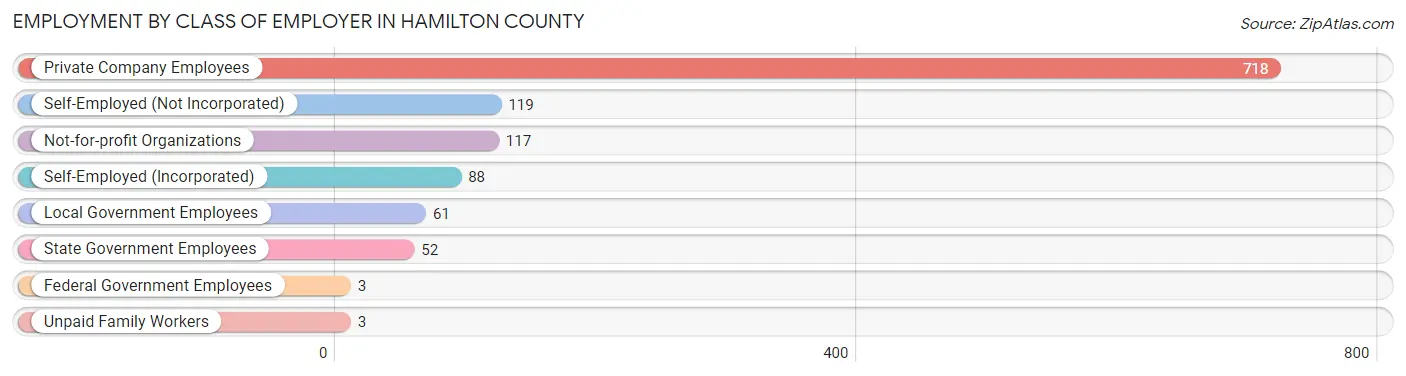
| Employer Class | # Employees | % Employees |
| Private Company Employees | 718 | 61.8% |
| Self-Employed (Incorporated) | 88 | 7.6% |
| Self-Employed (Not Incorporated) | 119 | 10.2% |
| Not-for-profit Organizations | 117 | 10.1% |
| Local Government Employees | 61 | 5.2% |
| State Government Employees | 52 | 4.5% |
| Federal Government Employees | 3 | 0.3% |
| Unpaid Family Workers | 3 | 0.3% |
| Total | 1,161 | 100.0% |
Employment Status by Age in Hamilton County
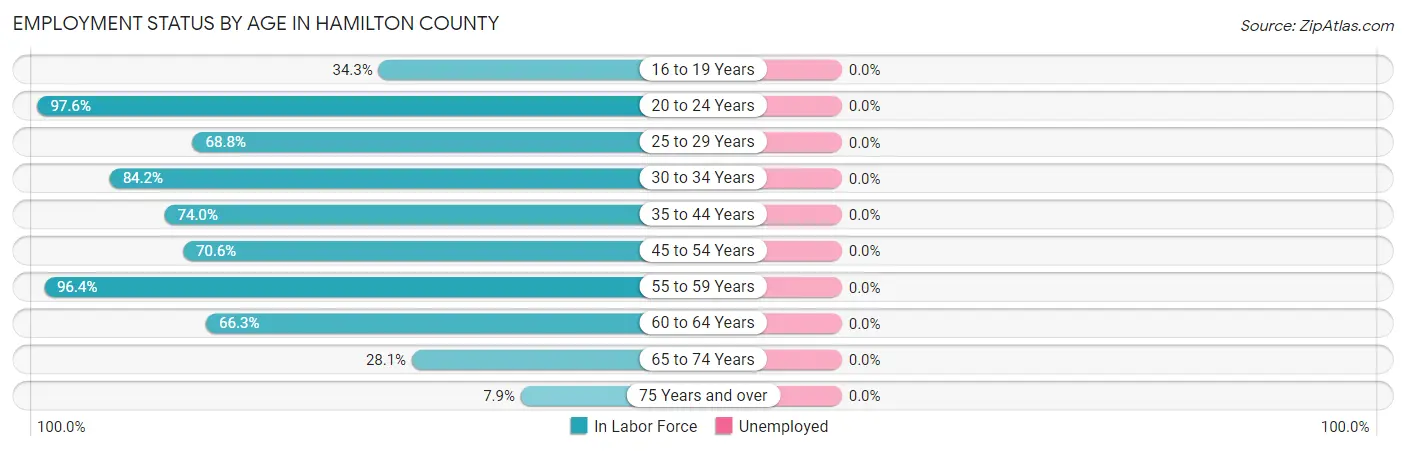
| Age Bracket | In Labor Force | Unemployed |
| 16 to 19 Years | 37 (34.3%) | 0 (0.0%) |
| 20 to 24 Years | 205 (97.6%) | 0 (0.0%) |
| 25 to 29 Years | 33 (68.8%) | 0 (0.0%) |
| 30 to 34 Years | 170 (84.2%) | 0 (0.0%) |
| 35 to 44 Years | 382 (74.0%) | 0 (0.0%) |
| 45 to 54 Years | 115 (70.6%) | 0 (0.0%) |
| 55 to 59 Years | 53 (96.4%) | 0 (0.0%) |
| 60 to 64 Years | 112 (66.3%) | 0 (0.0%) |
| 65 to 74 Years | 55 (28.1%) | 0 (0.0%) |
| 75 Years and over | 13 (7.9%) | 0 (0.0%) |
| Total | 1,174 (64.1%) | 0 (0.0%) |
Employment Status by Educational Attainment in Hamilton County
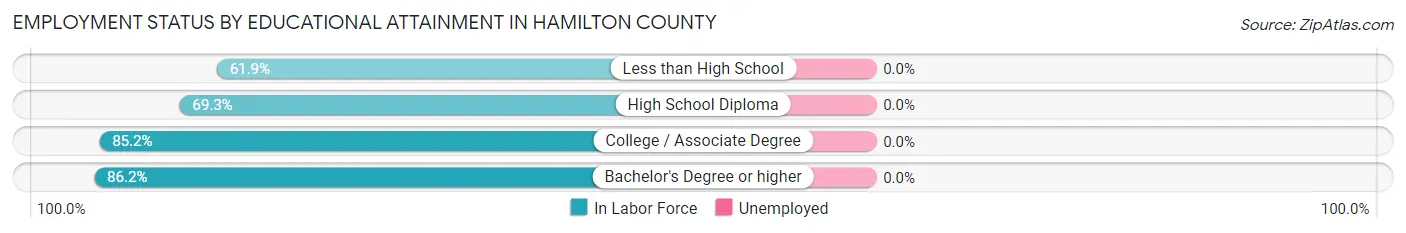
| Educational Attainment | In Labor Force | Unemployed |
| Less than High School | 117 (61.9%) | 0 (0.0%) |
| High School Diploma | 330 (69.3%) | 0 (0.0%) |
| College / Associate Degree | 230 (85.2%) | 0 (0.0%) |
| Bachelor's Degree or higher | 188 (86.2%) | 0 (0.0%) |
| Total | 865 (75.0%) | 0 (0.0%) |
Employment Occupations by Sex in Hamilton County
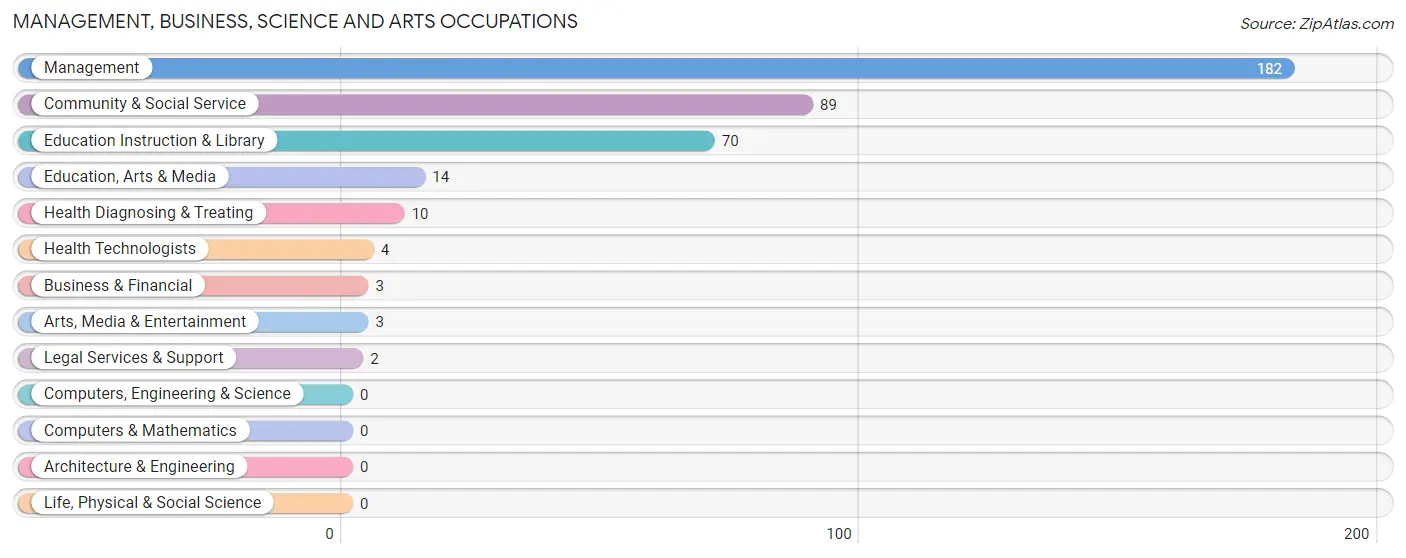
Management, Business, Science and Arts Occupations
The most common Management, Business, Science and Arts occupations in Hamilton County are Management (182 | 15.5%), Community & Social Service (89 | 7.6%), Education Instruction & Library (70 | 6.0%), Education, Arts & Media (14 | 1.2%), and Health Diagnosing & Treating (10 | 0.9%).
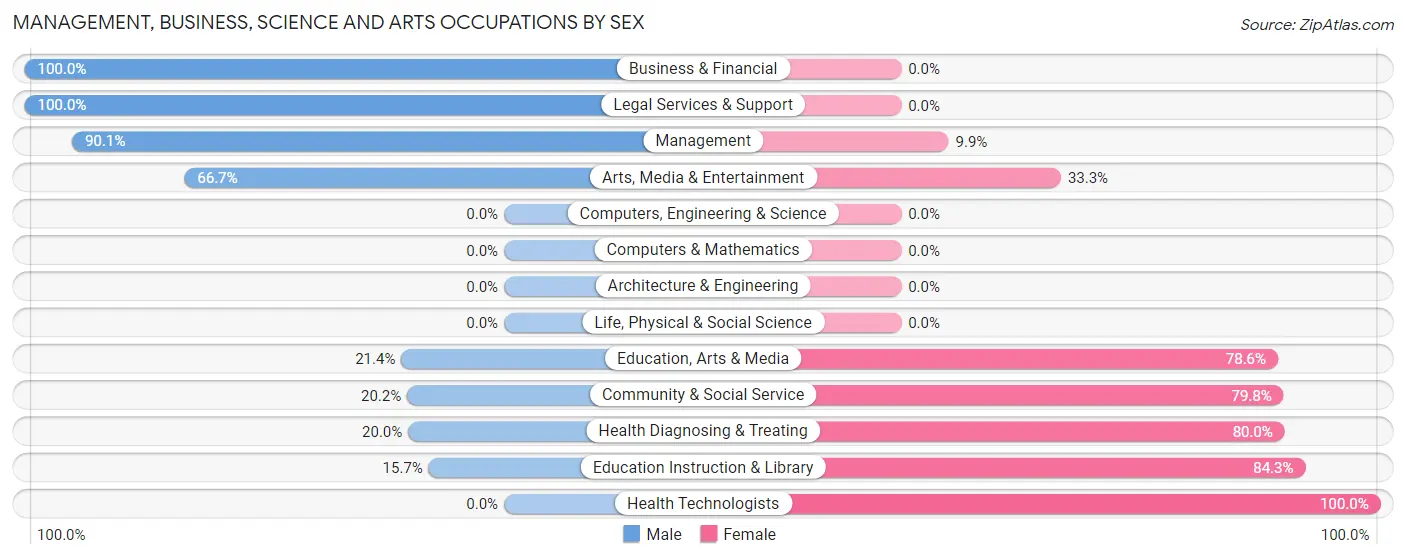
Management, Business, Science and Arts Occupations by Sex
Within the Management, Business, Science and Arts occupations in Hamilton County, the most male-oriented occupations are Business & Financial (100.0%), Legal Services & Support (100.0%), and Management (90.1%), while the most female-oriented occupations are Health Technologists (100.0%), Education Instruction & Library (84.3%), and Health Diagnosing & Treating (80.0%).
| Occupation | Male | Female |
| Management | 164 (90.1%) | 18 (9.9%) |
| Business & Financial | 3 (100.0%) | 0 (0.0%) |
| Computers, Engineering & Science | 0 (0.0%) | 0 (0.0%) |
| Computers & Mathematics | 0 (0.0%) | 0 (0.0%) |
| Architecture & Engineering | 0 (0.0%) | 0 (0.0%) |
| Life, Physical & Social Science | 0 (0.0%) | 0 (0.0%) |
| Community & Social Service | 18 (20.2%) | 71 (79.8%) |
| Education, Arts & Media | 3 (21.4%) | 11 (78.6%) |
| Legal Services & Support | 2 (100.0%) | 0 (0.0%) |
| Education Instruction & Library | 11 (15.7%) | 59 (84.3%) |
| Arts, Media & Entertainment | 2 (66.7%) | 1 (33.3%) |
| Health Diagnosing & Treating | 2 (20.0%) | 8 (80.0%) |
| Health Technologists | 0 (0.0%) | 4 (100.0%) |
| Total (Category) | 187 (65.8%) | 97 (34.2%) |
| Total (Overall) | 739 (62.9%) | 436 (37.1%) |
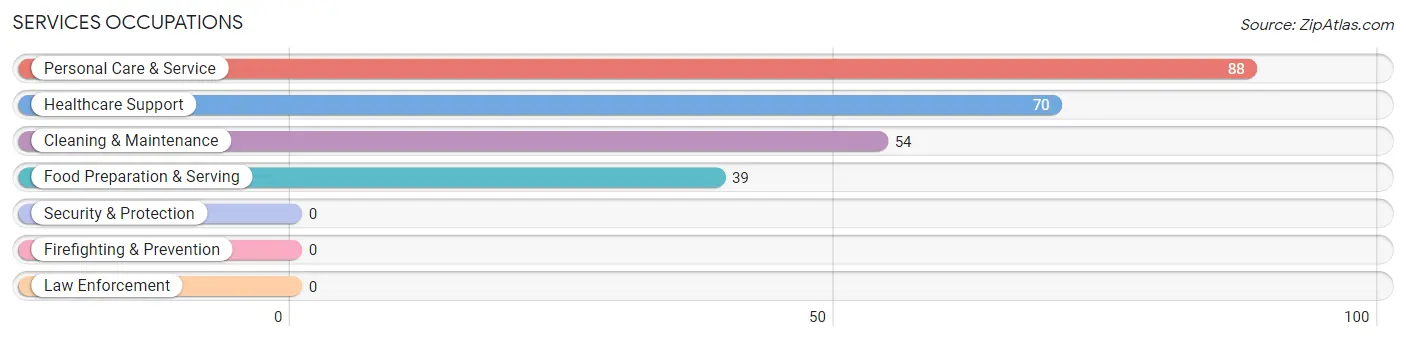
Services Occupations
The most common Services occupations in Hamilton County are Personal Care & Service (88 | 7.5%), Healthcare Support (70 | 6.0%), Cleaning & Maintenance (54 | 4.6%), and Food Preparation & Serving (39 | 3.3%).
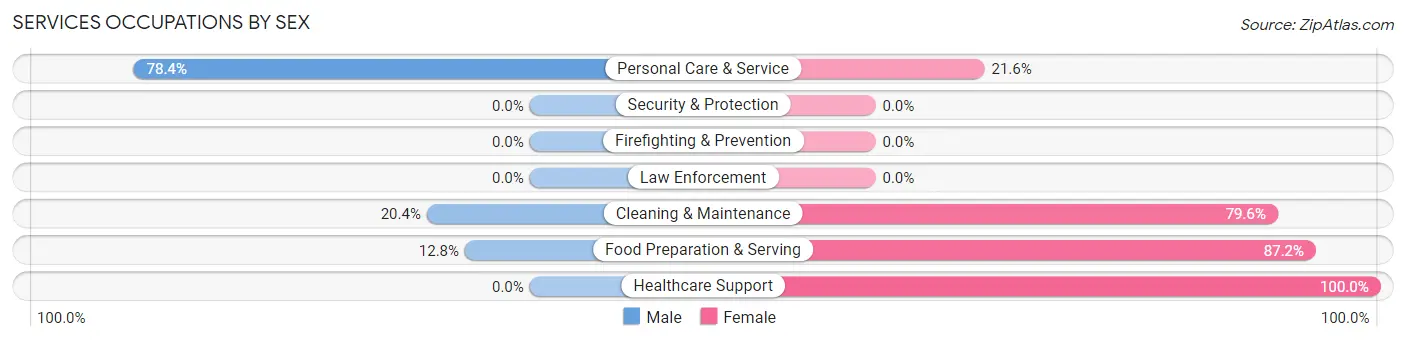
Services Occupations by Sex
Within the Services occupations in Hamilton County, the most male-oriented occupations are Personal Care & Service (78.4%), Cleaning & Maintenance (20.4%), and Food Preparation & Serving (12.8%), while the most female-oriented occupations are Healthcare Support (100.0%), Food Preparation & Serving (87.2%), and Cleaning & Maintenance (79.6%).
| Occupation | Male | Female |
| Healthcare Support | 0 (0.0%) | 70 (100.0%) |
| Security & Protection | 0 (0.0%) | 0 (0.0%) |
| Firefighting & Prevention | 0 (0.0%) | 0 (0.0%) |
| Law Enforcement | 0 (0.0%) | 0 (0.0%) |
| Food Preparation & Serving | 5 (12.8%) | 34 (87.2%) |
| Cleaning & Maintenance | 11 (20.4%) | 43 (79.6%) |
| Personal Care & Service | 69 (78.4%) | 19 (21.6%) |
| Total (Category) | 85 (33.9%) | 166 (66.1%) |
| Total (Overall) | 739 (62.9%) | 436 (37.1%) |
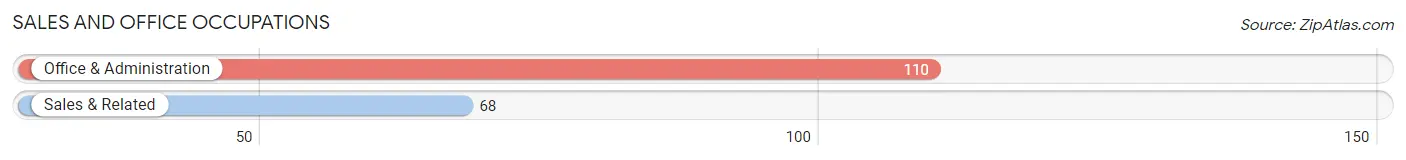
Sales and Office Occupations
The most common Sales and Office occupations in Hamilton County are Office & Administration (110 | 9.4%), and Sales & Related (68 | 5.8%).
Sales and Office Occupations by Sex
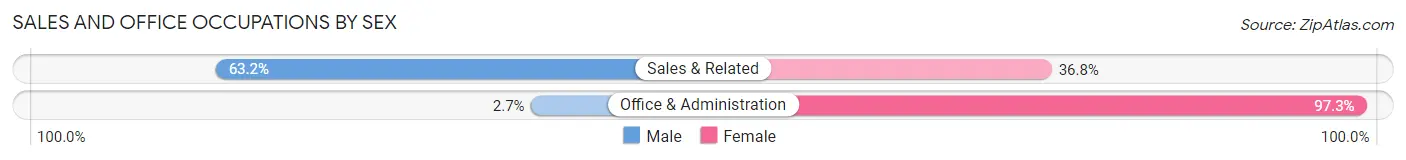
| Occupation | Male | Female |
| Sales & Related | 43 (63.2%) | 25 (36.8%) |
| Office & Administration | 3 (2.7%) | 107 (97.3%) |
| Total (Category) | 46 (25.8%) | 132 (74.2%) |
| Total (Overall) | 739 (62.9%) | 436 (37.1%) |
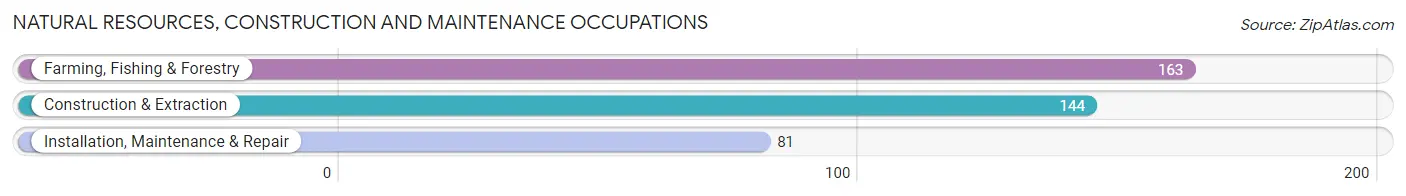
Natural Resources, Construction and Maintenance Occupations
The most common Natural Resources, Construction and Maintenance occupations in Hamilton County are Farming, Fishing & Forestry (163 | 13.9%), Construction & Extraction (144 | 12.3%), and Installation, Maintenance & Repair (81 | 6.9%).
Natural Resources, Construction and Maintenance Occupations by Sex
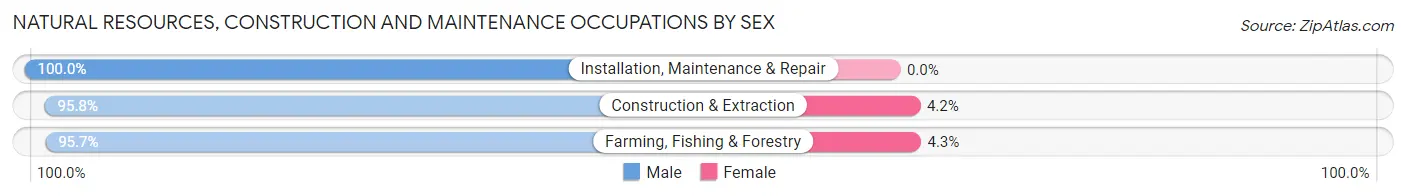
| Occupation | Male | Female |
| Farming, Fishing & Forestry | 156 (95.7%) | 7 (4.3%) |
| Construction & Extraction | 138 (95.8%) | 6 (4.2%) |
| Installation, Maintenance & Repair | 81 (100.0%) | 0 (0.0%) |
| Total (Category) | 375 (96.7%) | 13 (3.4%) |
| Total (Overall) | 739 (62.9%) | 436 (37.1%) |
Production, Transportation and Moving Occupations
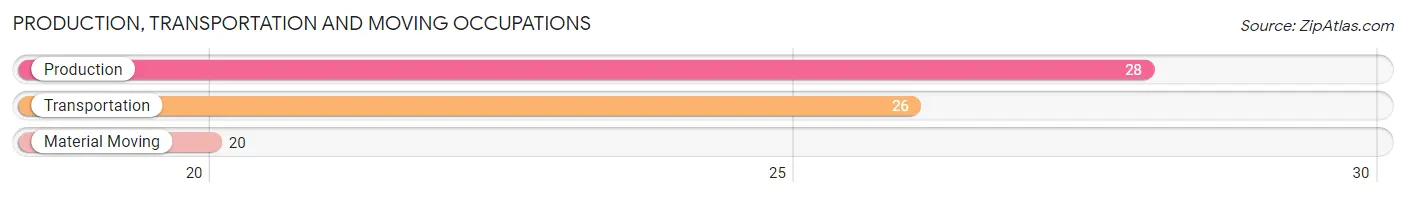
The most common Production, Transportation and Moving occupations in Hamilton County are Production (28 | 2.4%), Transportation (26 | 2.2%), and Material Moving (20 | 1.7%).
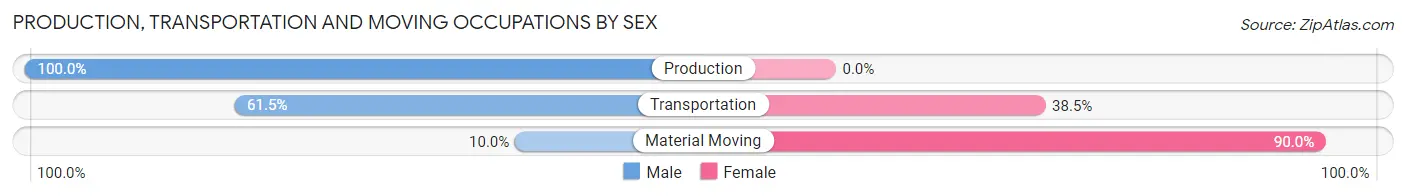
Production, Transportation and Moving Occupations by Sex
| Occupation | Male | Female |
| Production | 28 (100.0%) | 0 (0.0%) |
| Transportation | 16 (61.5%) | 10 (38.5%) |
| Material Moving | 2 (10.0%) | 18 (90.0%) |
| Total (Category) | 46 (62.2%) | 28 (37.8%) |
| Total (Overall) | 739 (62.9%) | 436 (37.1%) |
Employment Industries by Sex in Hamilton County
Employment Industries in Hamilton County
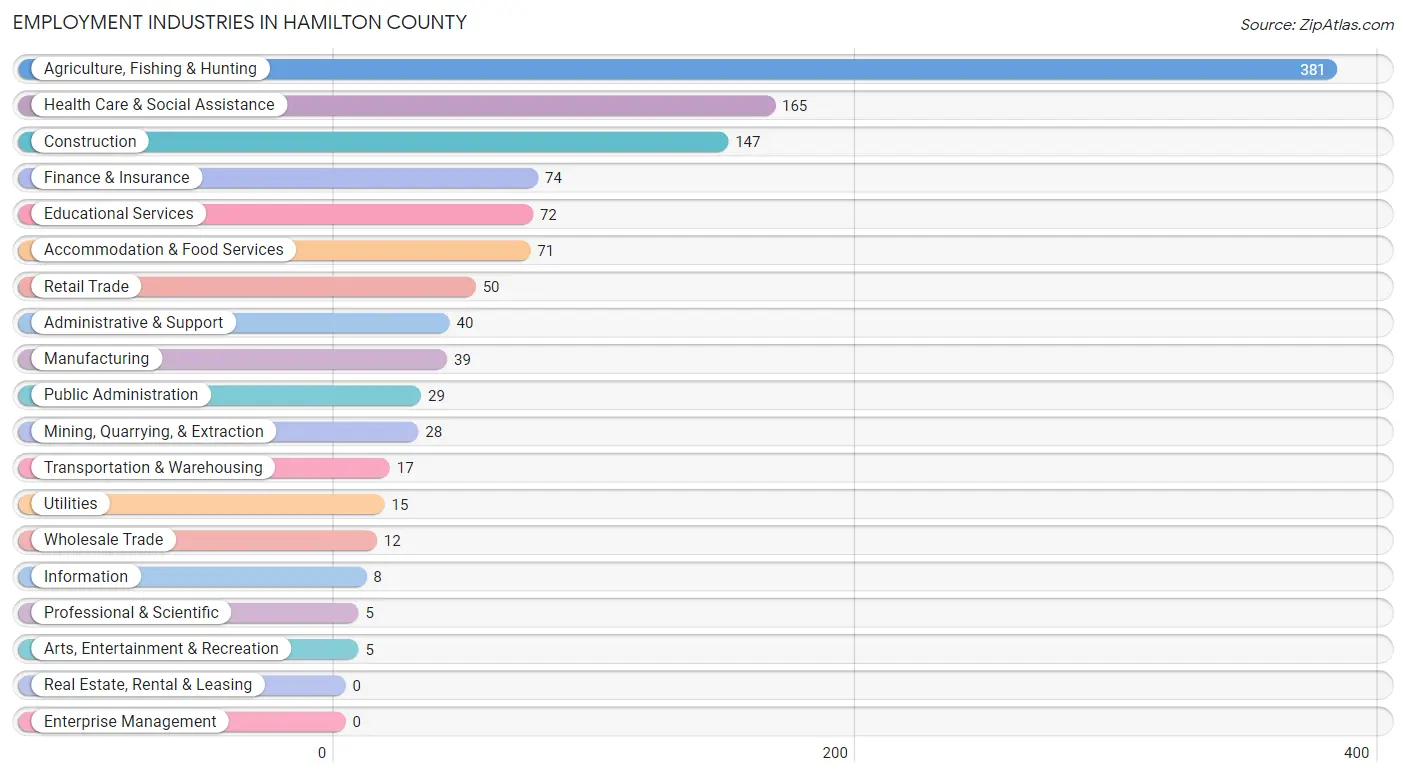
The major employment industries in Hamilton County include Agriculture, Fishing & Hunting (381 | 32.4%), Health Care & Social Assistance (165 | 14.0%), Construction (147 | 12.5%), Finance & Insurance (74 | 6.3%), and Educational Services (72 | 6.1%).
Employment Industries by Sex in Hamilton County
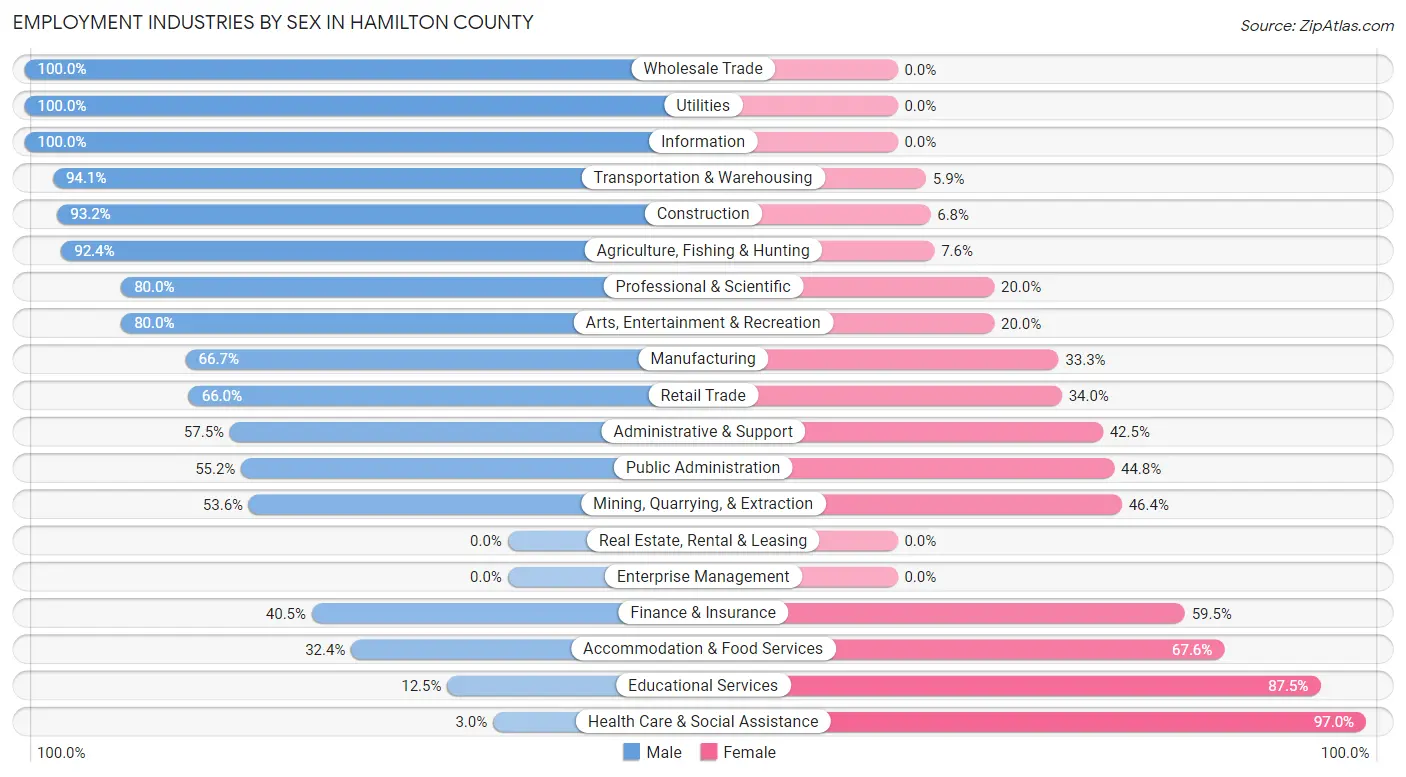
The Hamilton County industries that see more men than women are Wholesale Trade (100.0%), Utilities (100.0%), and Information (100.0%), whereas the industries that tend to have a higher number of women are Health Care & Social Assistance (97.0%), Educational Services (87.5%), and Accommodation & Food Services (67.6%).
| Industry | Male | Female |
| Agriculture, Fishing & Hunting | 352 (92.4%) | 29 (7.6%) |
| Mining, Quarrying, & Extraction | 15 (53.6%) | 13 (46.4%) |
| Construction | 137 (93.2%) | 10 (6.8%) |
| Manufacturing | 26 (66.7%) | 13 (33.3%) |
| Wholesale Trade | 12 (100.0%) | 0 (0.0%) |
| Retail Trade | 33 (66.0%) | 17 (34.0%) |
| Transportation & Warehousing | 16 (94.1%) | 1 (5.9%) |
| Utilities | 15 (100.0%) | 0 (0.0%) |
| Information | 8 (100.0%) | 0 (0.0%) |
| Finance & Insurance | 30 (40.5%) | 44 (59.5%) |
| Real Estate, Rental & Leasing | 0 (0.0%) | 0 (0.0%) |
| Professional & Scientific | 4 (80.0%) | 1 (20.0%) |
| Enterprise Management | 0 (0.0%) | 0 (0.0%) |
| Administrative & Support | 23 (57.5%) | 17 (42.5%) |
| Educational Services | 9 (12.5%) | 63 (87.5%) |
| Health Care & Social Assistance | 5 (3.0%) | 160 (97.0%) |
| Arts, Entertainment & Recreation | 4 (80.0%) | 1 (20.0%) |
| Accommodation & Food Services | 23 (32.4%) | 48 (67.6%) |
| Public Administration | 16 (55.2%) | 13 (44.8%) |
| Total | 739 (62.9%) | 436 (37.1%) |
Education in Hamilton County
School Enrollment in Hamilton County
The most common levels of schooling among the 727 students in Hamilton County are middle school (162 | 22.3%), elementary school (156 | 21.5%), and high school (138 | 19.0%).
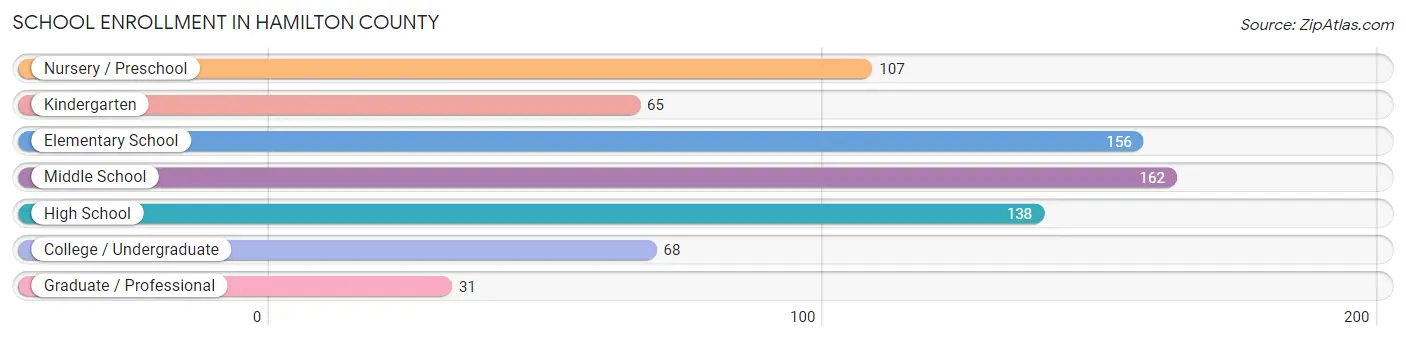
| School Level | # Students | % Students |
| Nursery / Preschool | 107 | 14.7% |
| Kindergarten | 65 | 8.9% |
| Elementary School | 156 | 21.5% |
| Middle School | 162 | 22.3% |
| High School | 138 | 19.0% |
| College / Undergraduate | 68 | 9.3% |
| Graduate / Professional | 31 | 4.3% |
| Total | 727 | 100.0% |
School Enrollment by Age by Funding Source in Hamilton County
Out of a total of 727 students who are enrolled in schools in Hamilton County, 114 (15.7%) attend a private institution, while the remaining 613 (84.3%) are enrolled in public schools. The age group of 3 to 4 year olds has the highest likelihood of being enrolled in private schools, with 49 (96.1% in the age bracket) enrolled. Conversely, the age group of 10 to 14 year olds has the lowest likelihood of being enrolled in a private school, with 183 (100.0% in the age bracket) attending a public institution.
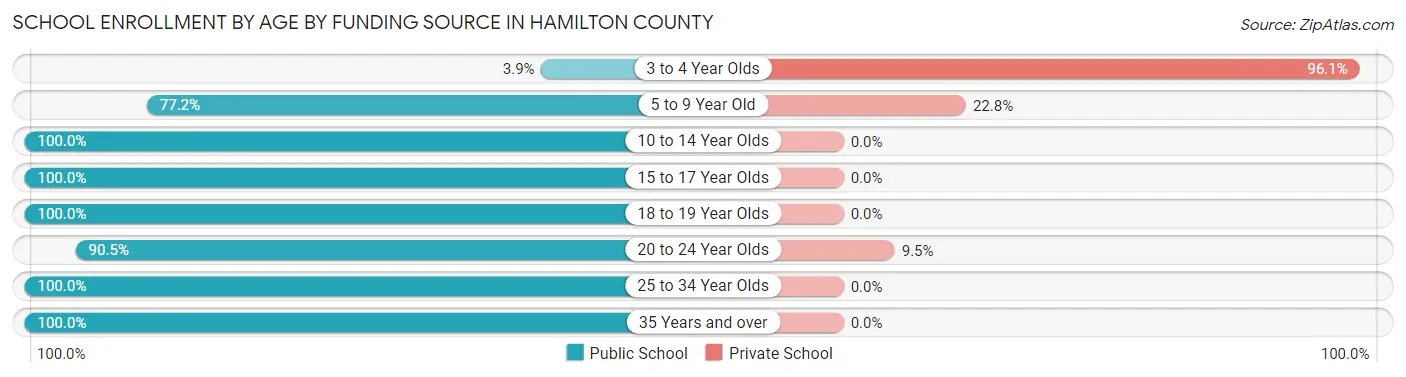
| Age Bracket | Public School | Private School |
| 3 to 4 Year Olds | 2 (3.9%) | 49 (96.1%) |
| 5 to 9 Year Old | 200 (77.2%) | 59 (22.8%) |
| 10 to 14 Year Olds | 183 (100.0%) | 0 (0.0%) |
| 15 to 17 Year Olds | 128 (100.0%) | 0 (0.0%) |
| 18 to 19 Year Olds | 7 (100.0%) | 0 (0.0%) |
| 20 to 24 Year Olds | 57 (90.5%) | 6 (9.5%) |
| 25 to 34 Year Olds | 2 (100.0%) | 0 (0.0%) |
| 35 Years and over | 34 (100.0%) | 0 (0.0%) |
| Total | 613 (84.3%) | 114 (15.7%) |
Educational Attainment by Field of Study in Hamilton County
Bio, nature & agricultural (114 | 38.9%), education (67 | 22.9%), business (27 | 9.2%), social sciences (16 | 5.5%), and arts & humanities (14 | 4.8%) are the most common fields of study among 293 individuals in Hamilton County who have obtained a bachelor's degree or higher.
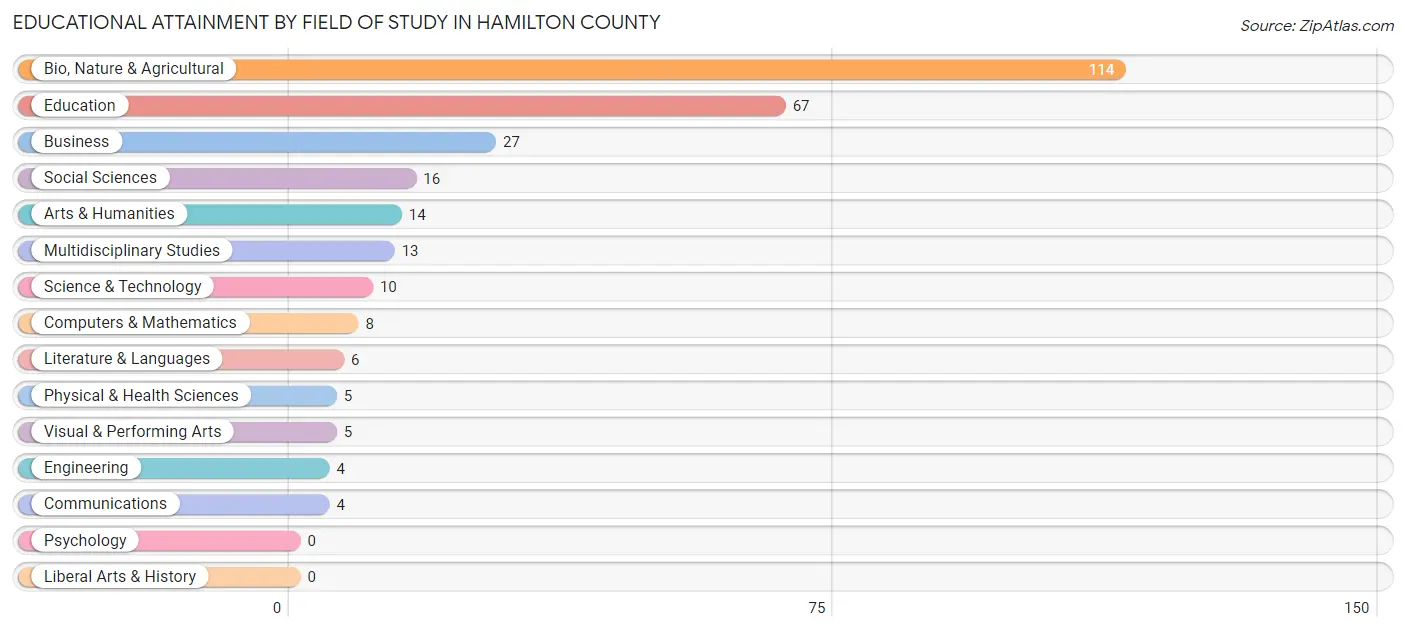
| Field of Study | # Graduates | % Graduates |
| Computers & Mathematics | 8 | 2.7% |
| Bio, Nature & Agricultural | 114 | 38.9% |
| Physical & Health Sciences | 5 | 1.7% |
| Psychology | 0 | 0.0% |
| Social Sciences | 16 | 5.5% |
| Engineering | 4 | 1.4% |
| Multidisciplinary Studies | 13 | 4.4% |
| Science & Technology | 10 | 3.4% |
| Business | 27 | 9.2% |
| Education | 67 | 22.9% |
| Literature & Languages | 6 | 2.1% |
| Liberal Arts & History | 0 | 0.0% |
| Visual & Performing Arts | 5 | 1.7% |
| Communications | 4 | 1.4% |
| Arts & Humanities | 14 | 4.8% |
| Total | 293 | 100.0% |
Transportation & Commute in Hamilton County
Vehicle Availability by Sex in Hamilton County
The most prevalent vehicle ownership categories in Hamilton County are males with 4 vehicles (252, accounting for 34.1%) and females with 4 vehicles (26, making up 59.7%).
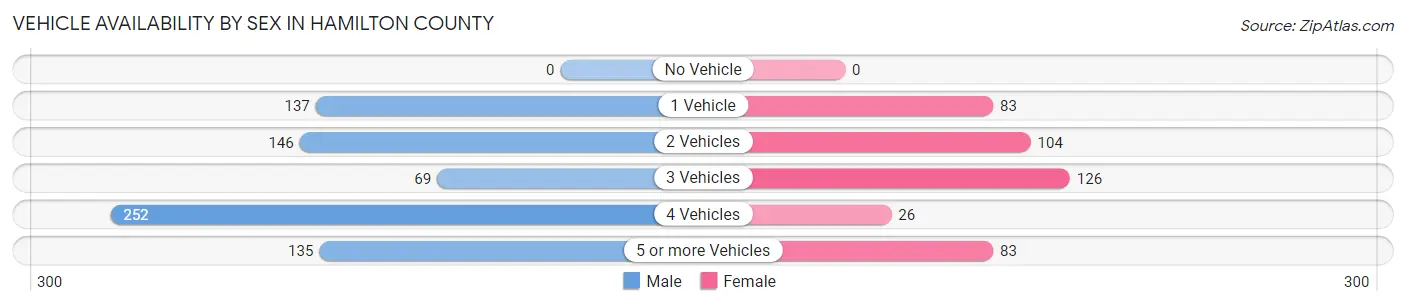
| Vehicles Available | Male | Female |
| No Vehicle | 0 (0.0%) | 0 (0.0%) |
| 1 Vehicle | 137 (18.5%) | 83 (19.7%) |
| 2 Vehicles | 146 (19.8%) | 104 (24.6%) |
| 3 Vehicles | 69 (9.3%) | 126 (29.9%) |
| 4 Vehicles | 252 (34.1%) | 26 (6.2%) |
| 5 or more Vehicles | 135 (18.3%) | 83 (19.7%) |
| Total | 739 (100.0%) | 422 (100.0%) |
Commute Time in Hamilton County
The most frequently occuring commute durations in Hamilton County are 5 to 9 minutes (244 commuters, 22.3%), less than 5 minutes (219 commuters, 20.0%), and 30 to 34 minutes (178 commuters, 16.3%).
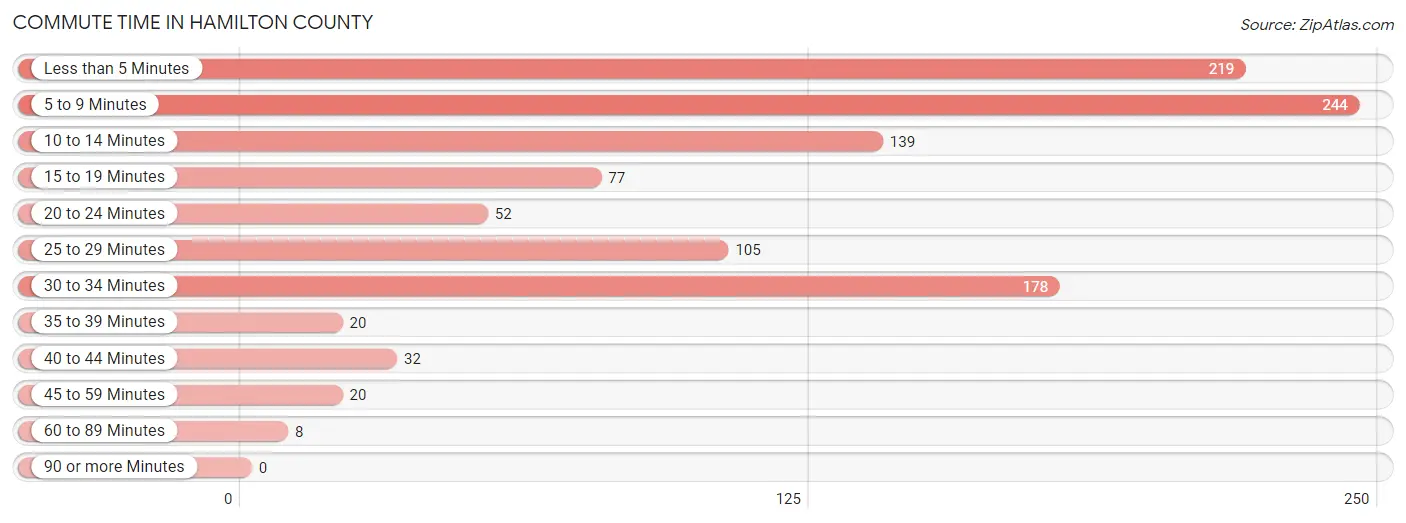
| Commute Time | # Commuters | % Commuters |
| Less than 5 Minutes | 219 | 20.0% |
| 5 to 9 Minutes | 244 | 22.3% |
| 10 to 14 Minutes | 139 | 12.7% |
| 15 to 19 Minutes | 77 | 7.0% |
| 20 to 24 Minutes | 52 | 4.8% |
| 25 to 29 Minutes | 105 | 9.6% |
| 30 to 34 Minutes | 178 | 16.3% |
| 35 to 39 Minutes | 20 | 1.8% |
| 40 to 44 Minutes | 32 | 2.9% |
| 45 to 59 Minutes | 20 | 1.8% |
| 60 to 89 Minutes | 8 | 0.7% |
| 90 or more Minutes | 0 | 0.0% |
Commute Time by Sex in Hamilton County
The most common commute times in Hamilton County are 30 to 34 minutes (175 commuters, 24.8%) for males and 5 to 9 minutes (137 commuters, 35.3%) for females.
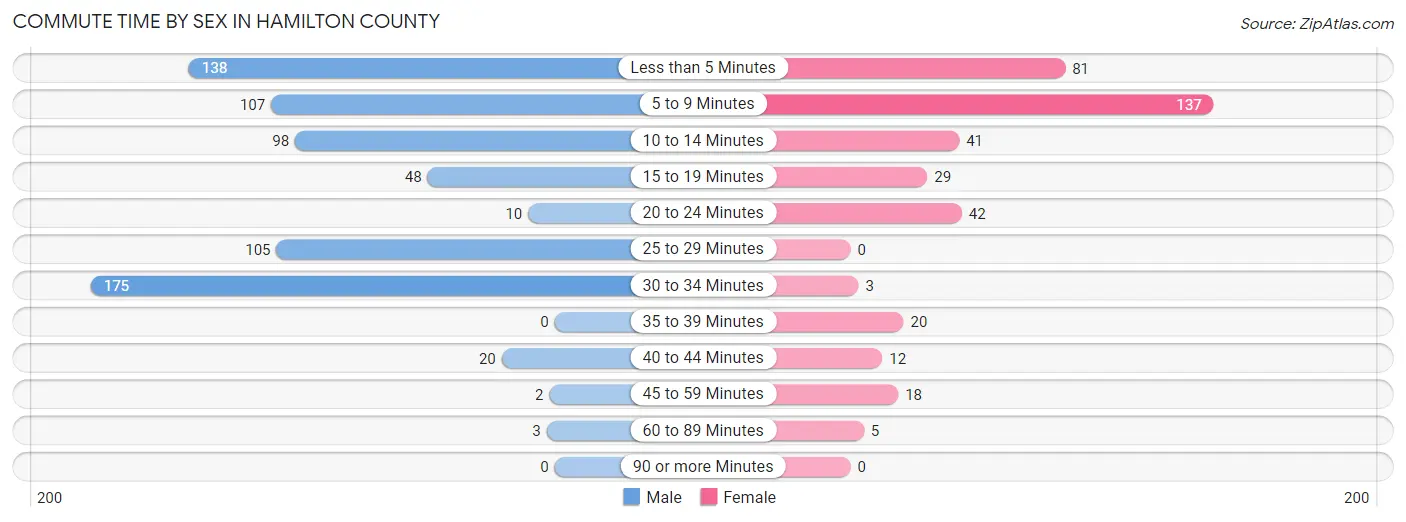
| Commute Time | Male | Female |
| Less than 5 Minutes | 138 (19.6%) | 81 (20.9%) |
| 5 to 9 Minutes | 107 (15.2%) | 137 (35.3%) |
| 10 to 14 Minutes | 98 (13.9%) | 41 (10.6%) |
| 15 to 19 Minutes | 48 (6.8%) | 29 (7.5%) |
| 20 to 24 Minutes | 10 (1.4%) | 42 (10.8%) |
| 25 to 29 Minutes | 105 (14.9%) | 0 (0.0%) |
| 30 to 34 Minutes | 175 (24.8%) | 3 (0.8%) |
| 35 to 39 Minutes | 0 (0.0%) | 20 (5.1%) |
| 40 to 44 Minutes | 20 (2.8%) | 12 (3.1%) |
| 45 to 59 Minutes | 2 (0.3%) | 18 (4.6%) |
| 60 to 89 Minutes | 3 (0.4%) | 5 (1.3%) |
| 90 or more Minutes | 0 (0.0%) | 0 (0.0%) |
Time of Departure to Work by Sex in Hamilton County
The most frequent times of departure to work in Hamilton County are 6:00 AM to 6:29 AM (137, 19.4%) for males and 8:00 AM to 8:29 AM (74, 19.1%) for females.
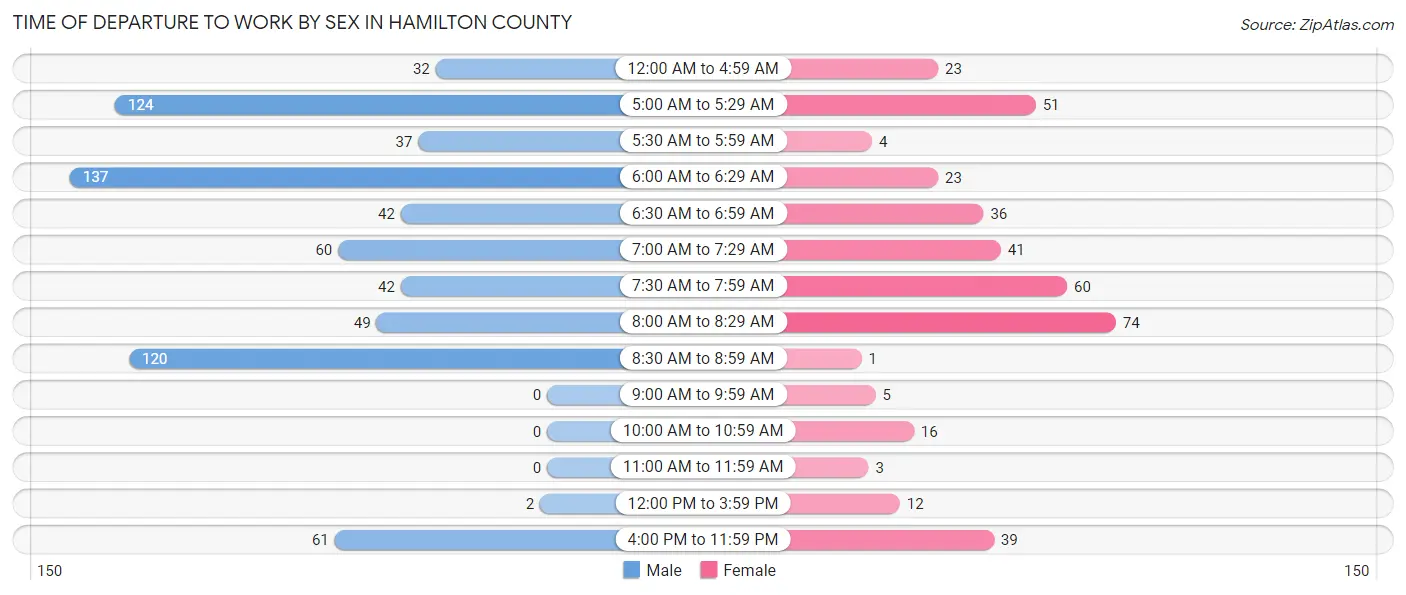
| Time of Departure | Male | Female |
| 12:00 AM to 4:59 AM | 32 (4.5%) | 23 (5.9%) |
| 5:00 AM to 5:29 AM | 124 (17.6%) | 51 (13.1%) |
| 5:30 AM to 5:59 AM | 37 (5.2%) | 4 (1.0%) |
| 6:00 AM to 6:29 AM | 137 (19.4%) | 23 (5.9%) |
| 6:30 AM to 6:59 AM | 42 (5.9%) | 36 (9.3%) |
| 7:00 AM to 7:29 AM | 60 (8.5%) | 41 (10.6%) |
| 7:30 AM to 7:59 AM | 42 (5.9%) | 60 (15.5%) |
| 8:00 AM to 8:29 AM | 49 (6.9%) | 74 (19.1%) |
| 8:30 AM to 8:59 AM | 120 (17.0%) | 1 (0.3%) |
| 9:00 AM to 9:59 AM | 0 (0.0%) | 5 (1.3%) |
| 10:00 AM to 10:59 AM | 0 (0.0%) | 16 (4.1%) |
| 11:00 AM to 11:59 AM | 0 (0.0%) | 3 (0.8%) |
| 12:00 PM to 3:59 PM | 2 (0.3%) | 12 (3.1%) |
| 4:00 PM to 11:59 PM | 61 (8.6%) | 39 (10.1%) |
| Total | 706 (100.0%) | 388 (100.0%) |
Housing Occupancy in Hamilton County
Occupancy by Ownership in Hamilton County
Of the total 716 dwellings in Hamilton County, owner-occupied units account for 555 (77.5%), while renter-occupied units make up 161 (22.5%).
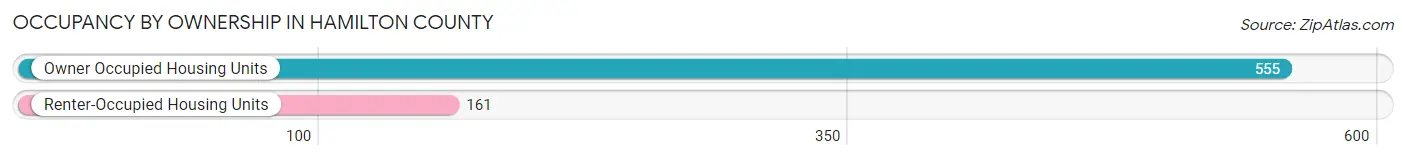
| Occupancy | # Housing Units | % Housing Units |
| Owner Occupied Housing Units | 555 | 77.5% |
| Renter-Occupied Housing Units | 161 | 22.5% |
| Total Occupied Housing Units | 716 | 100.0% |
Occupancy by Household Size in Hamilton County
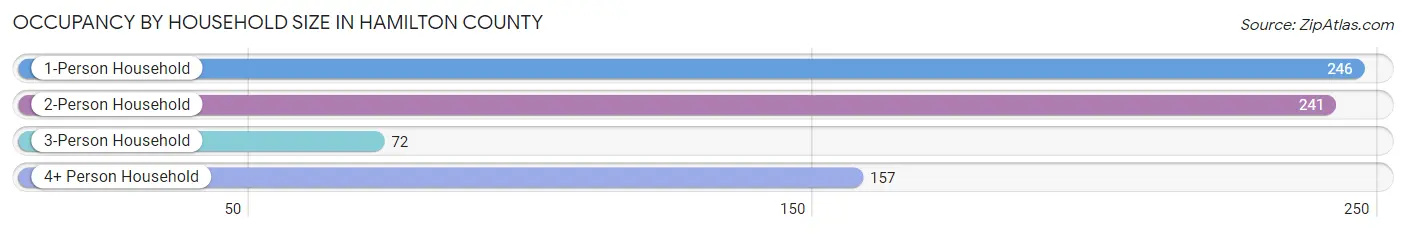
| Household Size | # Housing Units | % Housing Units |
| 1-Person Household | 246 | 34.4% |
| 2-Person Household | 241 | 33.7% |
| 3-Person Household | 72 | 10.1% |
| 4+ Person Household | 157 | 21.9% |
| Total Housing Units | 716 | 100.0% |
Occupancy by Ownership by Household Size in Hamilton County
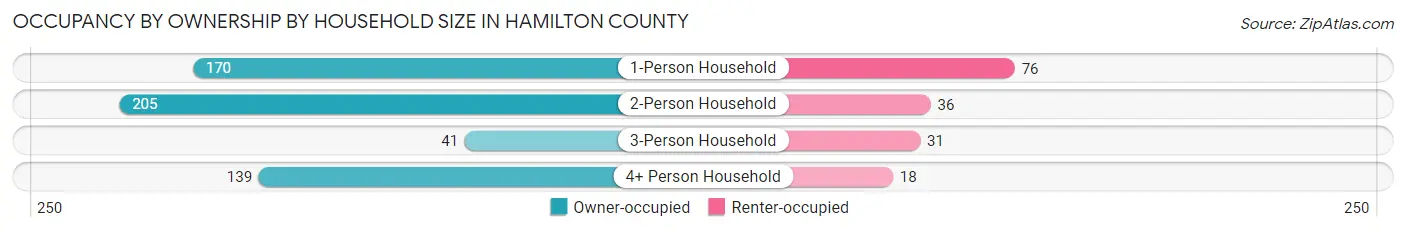
| Household Size | Owner-occupied | Renter-occupied |
| 1-Person Household | 170 (69.1%) | 76 (30.9%) |
| 2-Person Household | 205 (85.1%) | 36 (14.9%) |
| 3-Person Household | 41 (56.9%) | 31 (43.1%) |
| 4+ Person Household | 139 (88.5%) | 18 (11.5%) |
| Total Housing Units | 555 (77.5%) | 161 (22.5%) |
Occupancy by Educational Attainment in Hamilton County
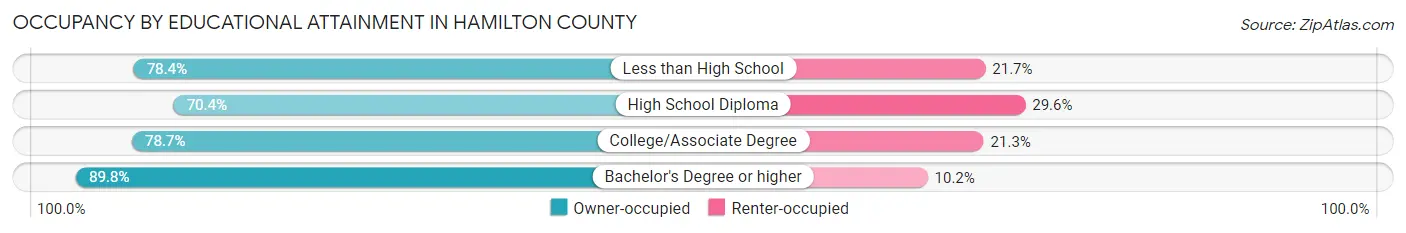
| Household Size | Owner-occupied | Renter-occupied |
| Less than High School | 76 (78.3%) | 21 (21.6%) |
| High School Diploma | 162 (70.4%) | 68 (29.6%) |
| College/Associate Degree | 229 (78.7%) | 62 (21.3%) |
| Bachelor's Degree or higher | 88 (89.8%) | 10 (10.2%) |
Occupancy by Age of Householder in Hamilton County
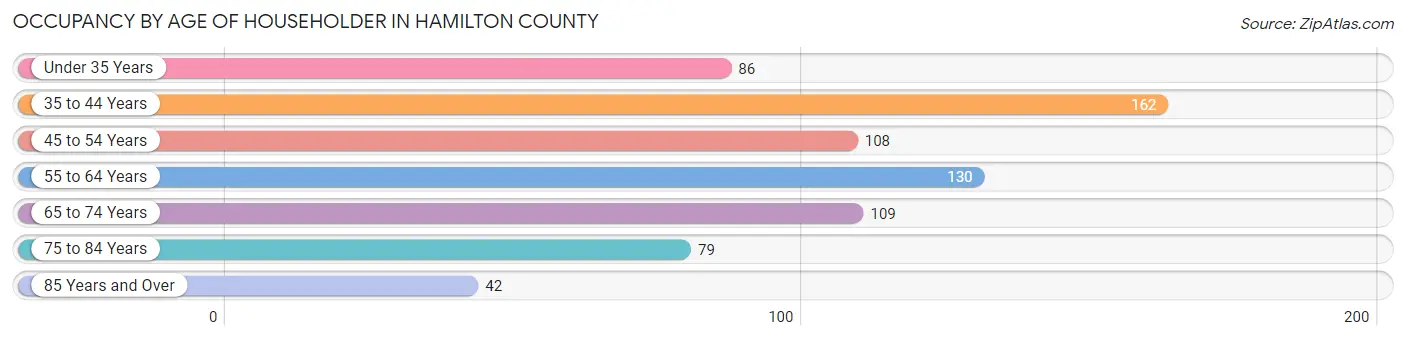
| Age Bracket | # Households | % Households |
| Under 35 Years | 86 | 12.0% |
| 35 to 44 Years | 162 | 22.6% |
| 45 to 54 Years | 108 | 15.1% |
| 55 to 64 Years | 130 | 18.2% |
| 65 to 74 Years | 109 | 15.2% |
| 75 to 84 Years | 79 | 11.0% |
| 85 Years and Over | 42 | 5.9% |
| Total | 716 | 100.0% |
Housing Finances in Hamilton County
Median Income by Occupancy in Hamilton County
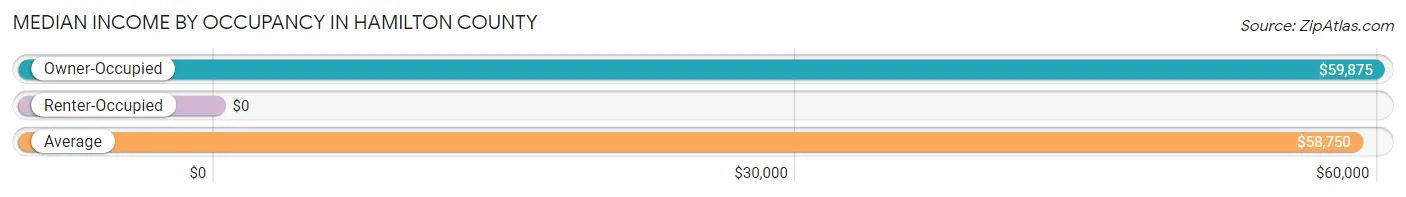
| Occupancy Type | # Households | Median Income |
| Owner-Occupied | 555 (77.5%) | $59,875 |
| Renter-Occupied | 161 (22.5%) | $0 |
| Average | 716 (100.0%) | $58,750 |
Occupancy by Householder Income Bracket in Hamilton County
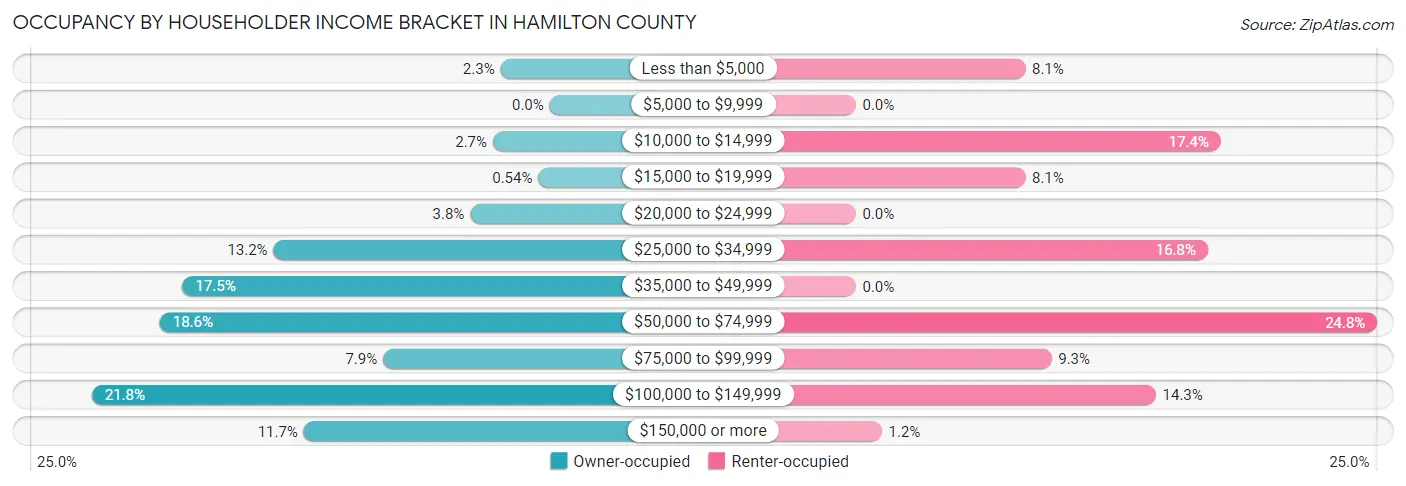
| Income Bracket | Owner-occupied | Renter-occupied |
| Less than $5,000 | 13 (2.3%) | 13 (8.1%) |
| $5,000 to $9,999 | 0 (0.0%) | 0 (0.0%) |
| $10,000 to $14,999 | 15 (2.7%) | 28 (17.4%) |
| $15,000 to $19,999 | 3 (0.5%) | 13 (8.1%) |
| $20,000 to $24,999 | 21 (3.8%) | 0 (0.0%) |
| $25,000 to $34,999 | 73 (13.2%) | 27 (16.8%) |
| $35,000 to $49,999 | 97 (17.5%) | 0 (0.0%) |
| $50,000 to $74,999 | 103 (18.6%) | 40 (24.8%) |
| $75,000 to $99,999 | 44 (7.9%) | 15 (9.3%) |
| $100,000 to $149,999 | 121 (21.8%) | 23 (14.3%) |
| $150,000 or more | 65 (11.7%) | 2 (1.2%) |
| Total | 555 (100.0%) | 161 (100.0%) |
Monthly Housing Cost Tiers in Hamilton County
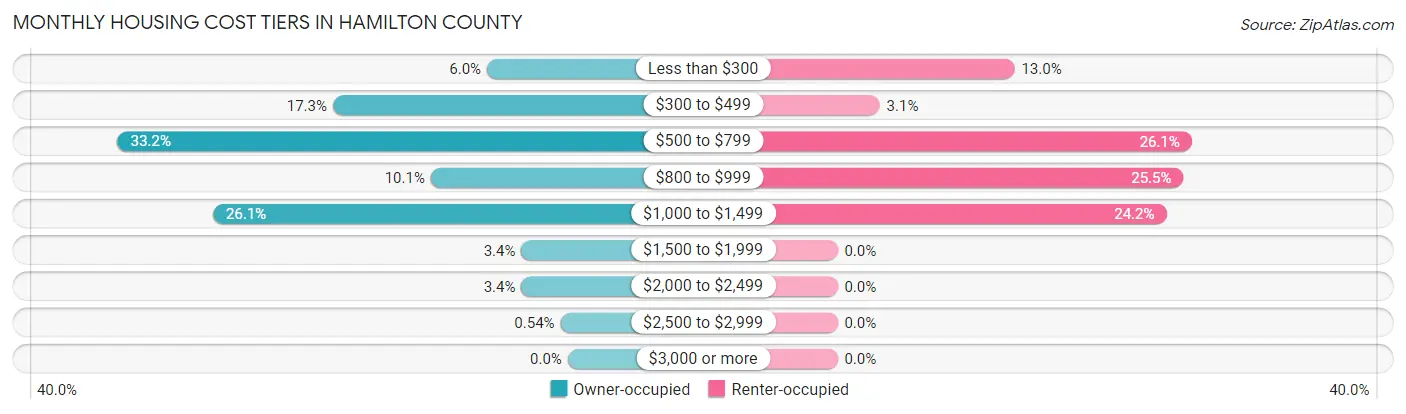
| Monthly Cost | Owner-occupied | Renter-occupied |
| Less than $300 | 33 (5.9%) | 21 (13.0%) |
| $300 to $499 | 96 (17.3%) | 5 (3.1%) |
| $500 to $799 | 184 (33.2%) | 42 (26.1%) |
| $800 to $999 | 56 (10.1%) | 41 (25.5%) |
| $1,000 to $1,499 | 145 (26.1%) | 39 (24.2%) |
| $1,500 to $1,999 | 19 (3.4%) | 0 (0.0%) |
| $2,000 to $2,499 | 19 (3.4%) | 0 (0.0%) |
| $2,500 to $2,999 | 3 (0.5%) | 0 (0.0%) |
| $3,000 or more | 0 (0.0%) | 0 (0.0%) |
| Total | 555 (100.0%) | 161 (100.0%) |
Physical Housing Characteristics in Hamilton County
Housing Structures in Hamilton County
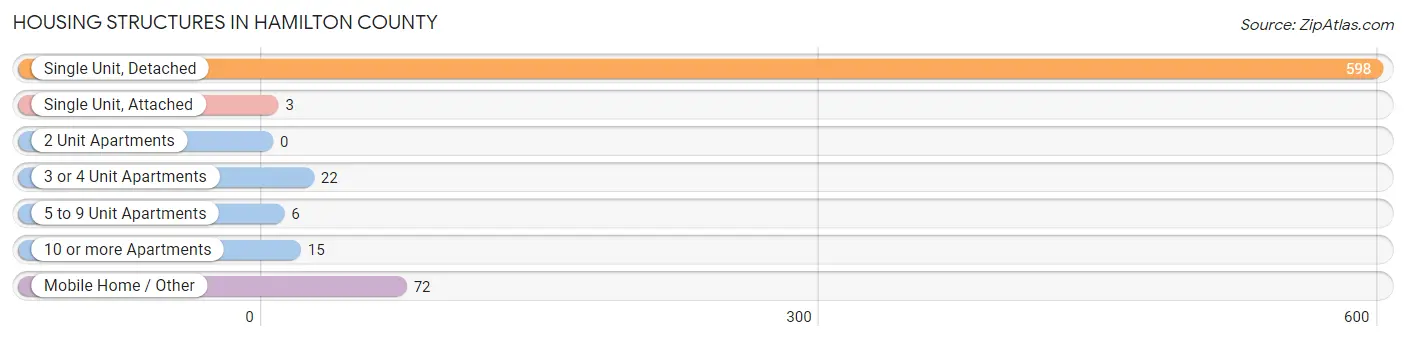
| Structure Type | # Housing Units | % Housing Units |
| Single Unit, Detached | 598 | 83.5% |
| Single Unit, Attached | 3 | 0.4% |
| 2 Unit Apartments | 0 | 0.0% |
| 3 or 4 Unit Apartments | 22 | 3.1% |
| 5 to 9 Unit Apartments | 6 | 0.8% |
| 10 or more Apartments | 15 | 2.1% |
| Mobile Home / Other | 72 | 10.1% |
| Total | 716 | 100.0% |
Housing Structures by Occupancy in Hamilton County
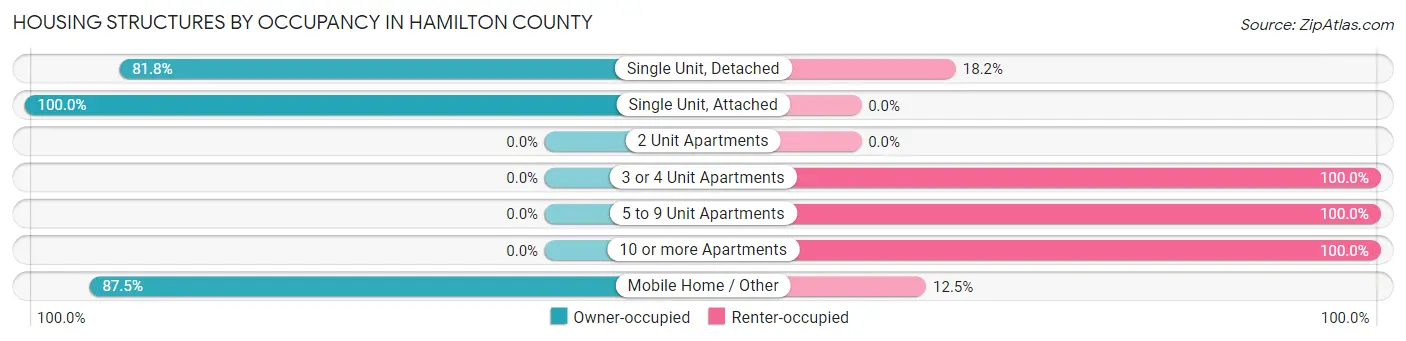
| Structure Type | Owner-occupied | Renter-occupied |
| Single Unit, Detached | 489 (81.8%) | 109 (18.2%) |
| Single Unit, Attached | 3 (100.0%) | 0 (0.0%) |
| 2 Unit Apartments | 0 (0.0%) | 0 (0.0%) |
| 3 or 4 Unit Apartments | 0 (0.0%) | 22 (100.0%) |
| 5 to 9 Unit Apartments | 0 (0.0%) | 6 (100.0%) |
| 10 or more Apartments | 0 (0.0%) | 15 (100.0%) |
| Mobile Home / Other | 63 (87.5%) | 9 (12.5%) |
| Total | 555 (77.5%) | 161 (22.5%) |
Housing Structures by Number of Rooms in Hamilton County
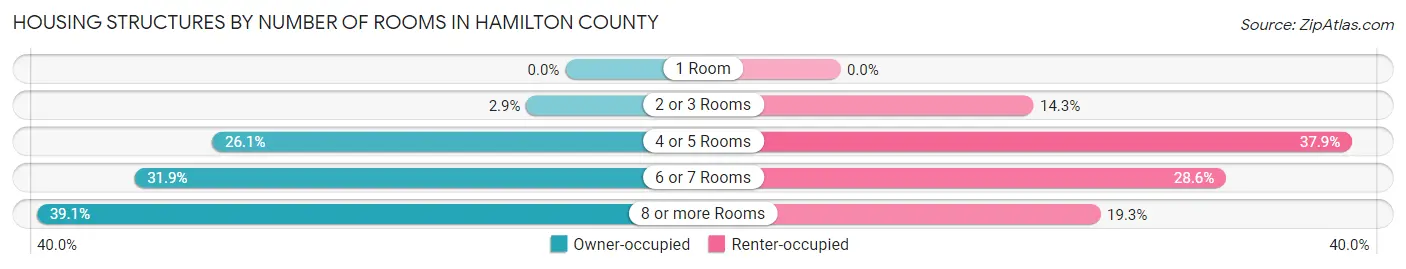
| Number of Rooms | Owner-occupied | Renter-occupied |
| 1 Room | 0 (0.0%) | 0 (0.0%) |
| 2 or 3 Rooms | 16 (2.9%) | 23 (14.3%) |
| 4 or 5 Rooms | 145 (26.1%) | 61 (37.9%) |
| 6 or 7 Rooms | 177 (31.9%) | 46 (28.6%) |
| 8 or more Rooms | 217 (39.1%) | 31 (19.3%) |
| Total | 555 (100.0%) | 161 (100.0%) |
Housing Structure by Heating Type in Hamilton County
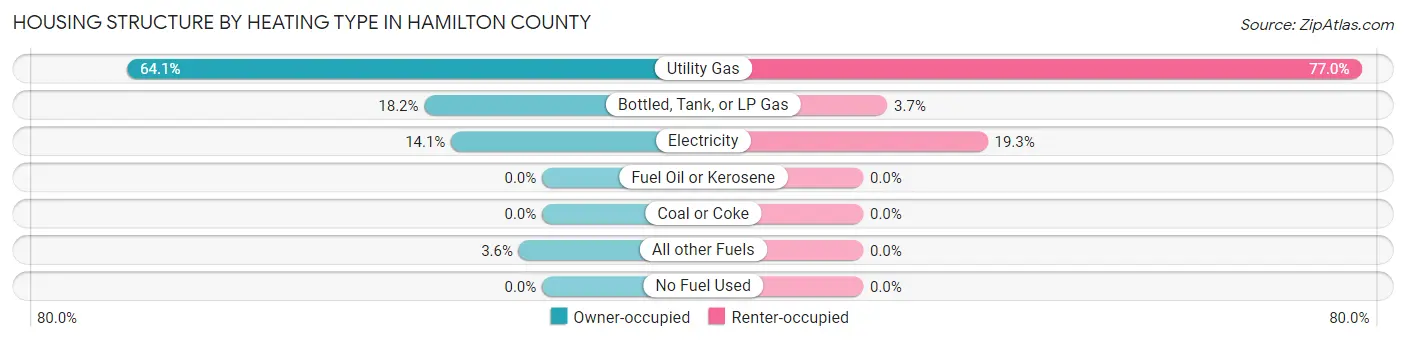
| Heating Type | Owner-occupied | Renter-occupied |
| Utility Gas | 356 (64.1%) | 124 (77.0%) |
| Bottled, Tank, or LP Gas | 101 (18.2%) | 6 (3.7%) |
| Electricity | 78 (14.1%) | 31 (19.3%) |
| Fuel Oil or Kerosene | 0 (0.0%) | 0 (0.0%) |
| Coal or Coke | 0 (0.0%) | 0 (0.0%) |
| All other Fuels | 20 (3.6%) | 0 (0.0%) |
| No Fuel Used | 0 (0.0%) | 0 (0.0%) |
| Total | 555 (100.0%) | 161 (100.0%) |
Household Vehicle Usage in Hamilton County
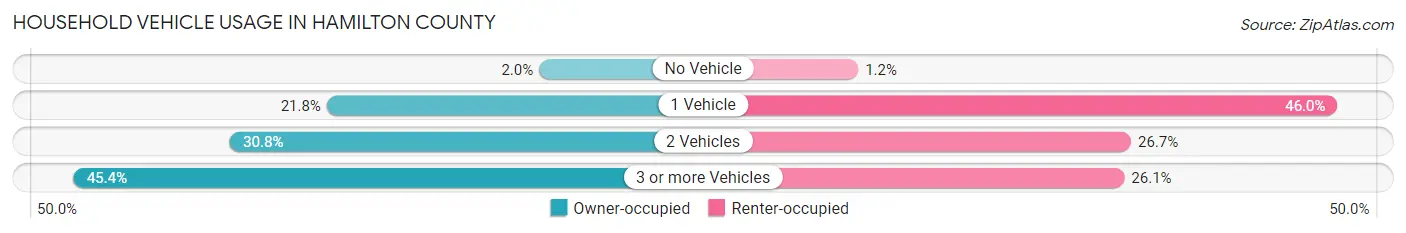
| Vehicles per Household | Owner-occupied | Renter-occupied |
| No Vehicle | 11 (2.0%) | 2 (1.2%) |
| 1 Vehicle | 121 (21.8%) | 74 (46.0%) |
| 2 Vehicles | 171 (30.8%) | 43 (26.7%) |
| 3 or more Vehicles | 252 (45.4%) | 42 (26.1%) |
| Total | 555 (100.0%) | 161 (100.0%) |
Real Estate & Mortgages in Hamilton County
Real Estate and Mortgage Overview in Hamilton County
| Characteristic | Without Mortgage | With Mortgage |
| Housing Units | 338 | 217 |
| Median Property Value | $117,500 | $115,600 |
| Median Household Income | $53,125 | $42 |
| Monthly Housing Costs | $561 | $0 |
| Real Estate Taxes | $2,047 | $0 |
Property Value by Mortgage Status in Hamilton County
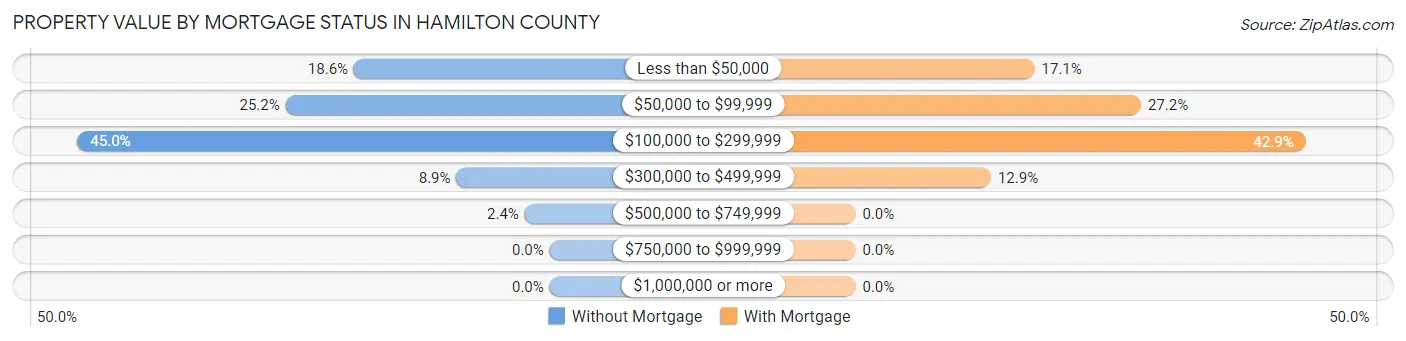
| Property Value | Without Mortgage | With Mortgage |
| Less than $50,000 | 63 (18.6%) | 37 (17.1%) |
| $50,000 to $99,999 | 85 (25.2%) | 59 (27.2%) |
| $100,000 to $299,999 | 152 (45.0%) | 93 (42.9%) |
| $300,000 to $499,999 | 30 (8.9%) | 28 (12.9%) |
| $500,000 to $749,999 | 8 (2.4%) | 0 (0.0%) |
| $750,000 to $999,999 | 0 (0.0%) | 0 (0.0%) |
| $1,000,000 or more | 0 (0.0%) | 0 (0.0%) |
| Total | 338 (100.0%) | 217 (100.0%) |
Household Income by Mortgage Status in Hamilton County
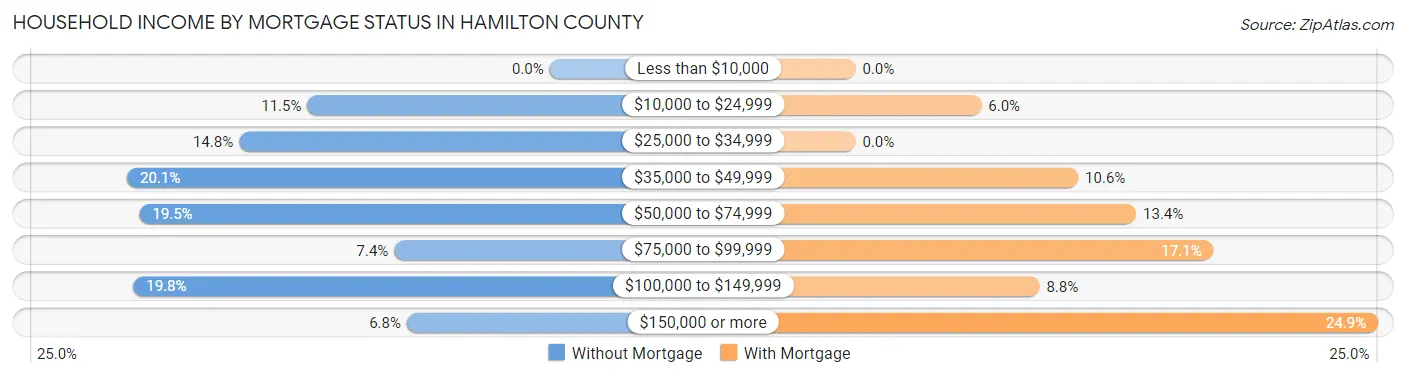
| Household Income | Without Mortgage | With Mortgage |
| Less than $10,000 | 0 (0.0%) | 0 (0.0%) |
| $10,000 to $24,999 | 39 (11.5%) | 13 (6.0%) |
| $25,000 to $34,999 | 50 (14.8%) | 0 (0.0%) |
| $35,000 to $49,999 | 68 (20.1%) | 23 (10.6%) |
| $50,000 to $74,999 | 66 (19.5%) | 29 (13.4%) |
| $75,000 to $99,999 | 25 (7.4%) | 37 (17.1%) |
| $100,000 to $149,999 | 67 (19.8%) | 19 (8.8%) |
| $150,000 or more | 23 (6.8%) | 54 (24.9%) |
| Total | 338 (100.0%) | 217 (100.0%) |
Property Value to Household Income Ratio in Hamilton County
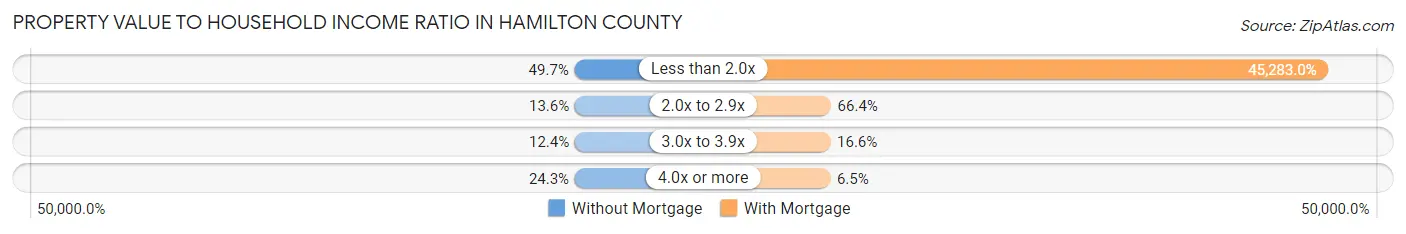
| Value-to-Income Ratio | Without Mortgage | With Mortgage |
| Less than 2.0x | 168 (49.7%) | 98,264 (45,282.9%) |
| 2.0x to 2.9x | 46 (13.6%) | 144 (66.4%) |
| 3.0x to 3.9x | 42 (12.4%) | 36 (16.6%) |
| 4.0x or more | 82 (24.3%) | 14 (6.5%) |
| Total | 338 (100.0%) | 217 (100.0%) |
Real Estate Taxes by Mortgage Status in Hamilton County
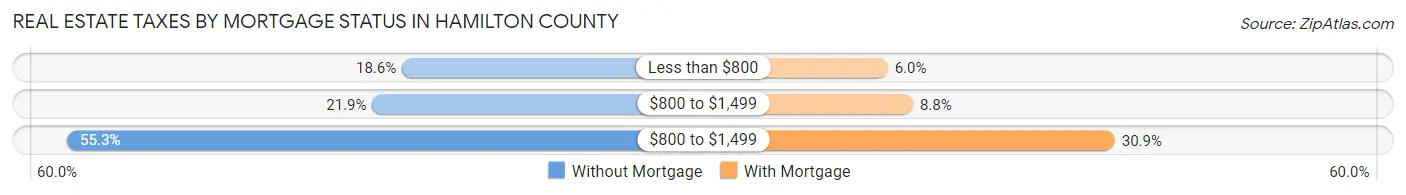
| Property Taxes | Without Mortgage | With Mortgage |
| Less than $800 | 63 (18.6%) | 13 (6.0%) |
| $800 to $1,499 | 74 (21.9%) | 19 (8.8%) |
| $800 to $1,499 | 187 (55.3%) | 67 (30.9%) |
| Total | 338 (100.0%) | 217 (100.0%) |
Health & Disability in Hamilton County
Health Insurance Coverage by Age in Hamilton County
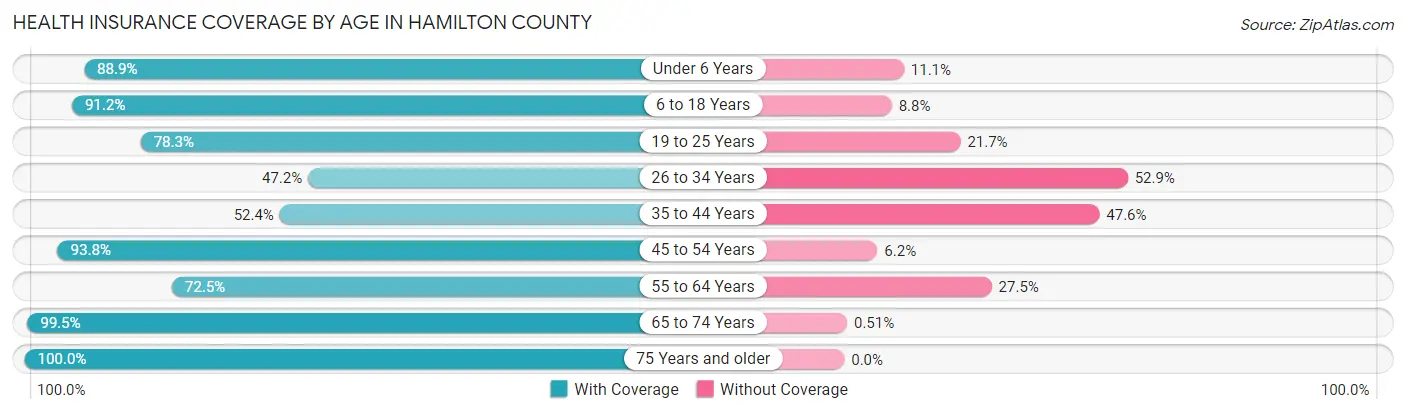
| Age Bracket | With Coverage | Without Coverage |
| Under 6 Years | 208 (88.9%) | 26 (11.1%) |
| 6 to 18 Years | 505 (91.2%) | 49 (8.8%) |
| 19 to 25 Years | 170 (78.3%) | 47 (21.7%) |
| 26 to 34 Years | 116 (47.1%) | 130 (52.8%) |
| 35 to 44 Years | 270 (52.4%) | 245 (47.6%) |
| 45 to 54 Years | 152 (93.8%) | 10 (6.2%) |
| 55 to 64 Years | 161 (72.5%) | 61 (27.5%) |
| 65 to 74 Years | 195 (99.5%) | 1 (0.5%) |
| 75 Years and older | 165 (100.0%) | 0 (0.0%) |
| Total | 1,942 (77.3%) | 569 (22.7%) |
Health Insurance Coverage by Citizenship Status in Hamilton County
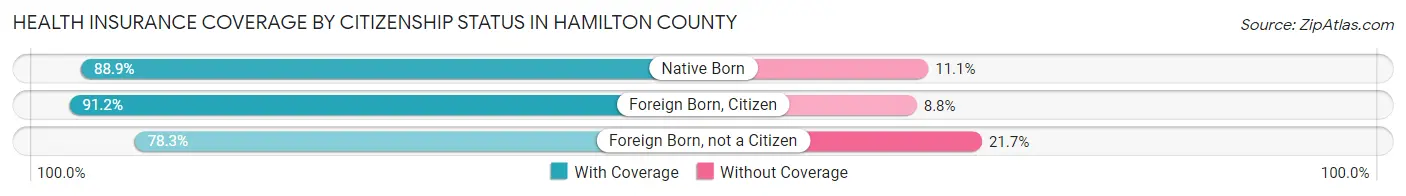
| Citizenship Status | With Coverage | Without Coverage |
| Native Born | 208 (88.9%) | 26 (11.1%) |
| Foreign Born, Citizen | 505 (91.2%) | 49 (8.8%) |
| Foreign Born, not a Citizen | 170 (78.3%) | 47 (21.7%) |
Health Insurance Coverage by Household Income in Hamilton County
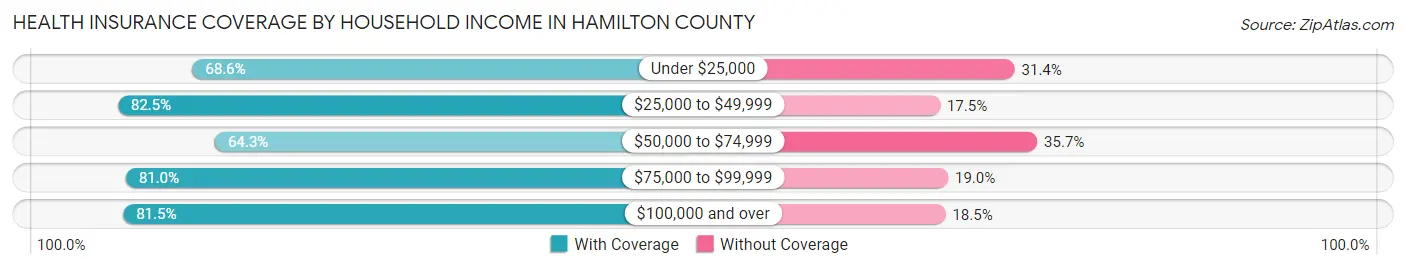
| Household Income | With Coverage | Without Coverage |
| Under $25,000 | 133 (68.6%) | 61 (31.4%) |
| $25,000 to $49,999 | 364 (82.5%) | 77 (17.5%) |
| $50,000 to $74,999 | 312 (64.3%) | 173 (35.7%) |
| $75,000 to $99,999 | 141 (81.0%) | 33 (19.0%) |
| $100,000 and over | 992 (81.5%) | 225 (18.5%) |
Public vs Private Health Insurance Coverage by Age in Hamilton County
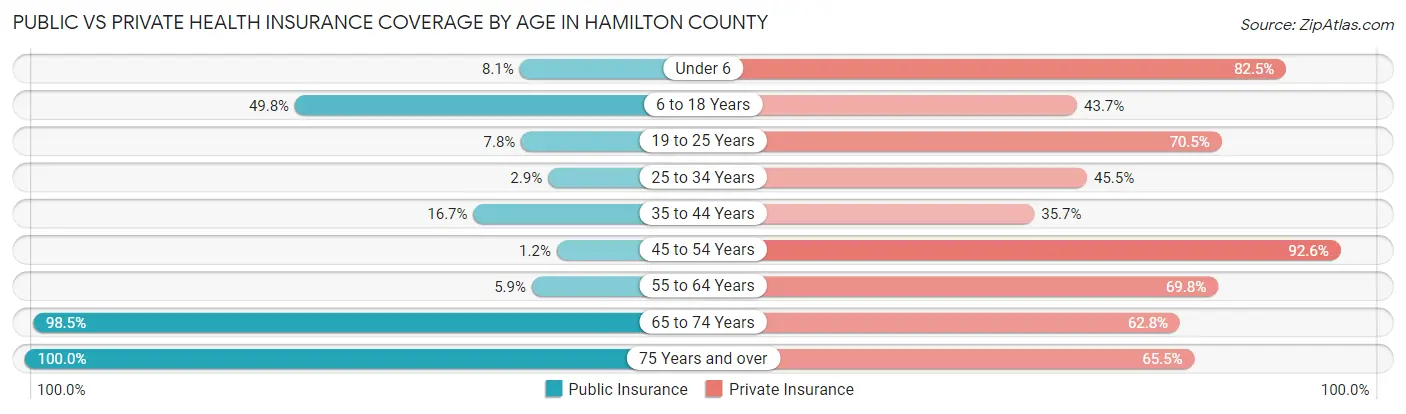
| Age Bracket | Public Insurance | Private Insurance |
| Under 6 | 19 (8.1%) | 193 (82.5%) |
| 6 to 18 Years | 276 (49.8%) | 242 (43.7%) |
| 19 to 25 Years | 17 (7.8%) | 153 (70.5%) |
| 25 to 34 Years | 7 (2.9%) | 112 (45.5%) |
| 35 to 44 Years | 86 (16.7%) | 184 (35.7%) |
| 45 to 54 Years | 2 (1.2%) | 150 (92.6%) |
| 55 to 64 Years | 13 (5.9%) | 155 (69.8%) |
| 65 to 74 Years | 193 (98.5%) | 123 (62.8%) |
| 75 Years and over | 165 (100.0%) | 108 (65.4%) |
| Total | 778 (31.0%) | 1,420 (56.6%) |
Disability Status by Sex by Age in Hamilton County
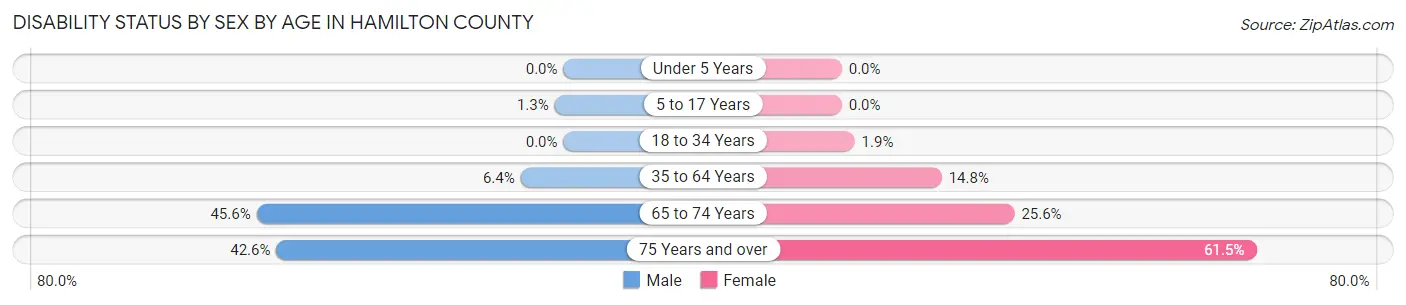
| Age Bracket | Male | Female |
| Under 5 Years | 0 (0.0%) | 0 (0.0%) |
| 5 to 17 Years | 4 (1.3%) | 0 (0.0%) |
| 18 to 34 Years | 0 (0.0%) | 4 (1.9%) |
| 35 to 64 Years | 31 (6.4%) | 61 (14.8%) |
| 65 to 74 Years | 36 (45.6%) | 30 (25.6%) |
| 75 Years and over | 26 (42.6%) | 64 (61.5%) |
Disability Class by Sex by Age in Hamilton County
Disability Class: Hearing Difficulty
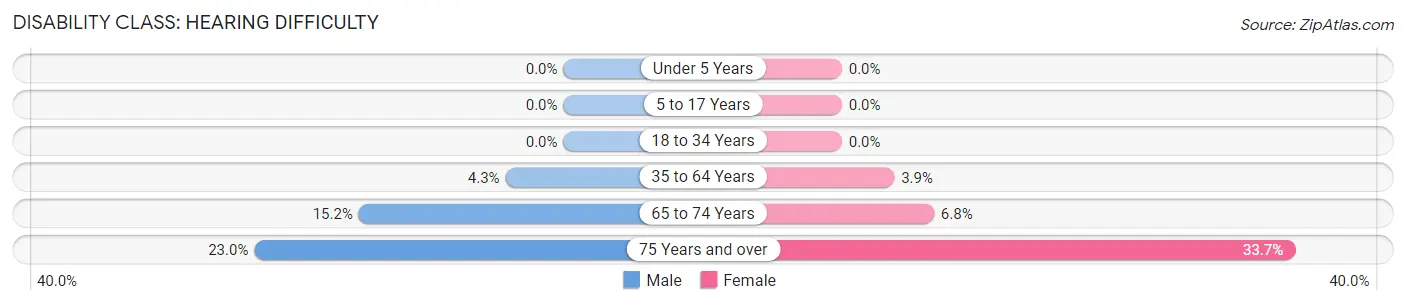
| Age Bracket | Male | Female |
| Under 5 Years | 0 (0.0%) | 0 (0.0%) |
| 5 to 17 Years | 0 (0.0%) | 0 (0.0%) |
| 18 to 34 Years | 0 (0.0%) | 0 (0.0%) |
| 35 to 64 Years | 21 (4.3%) | 16 (3.9%) |
| 65 to 74 Years | 12 (15.2%) | 8 (6.8%) |
| 75 Years and over | 14 (23.0%) | 35 (33.7%) |
Disability Class: Vision Difficulty
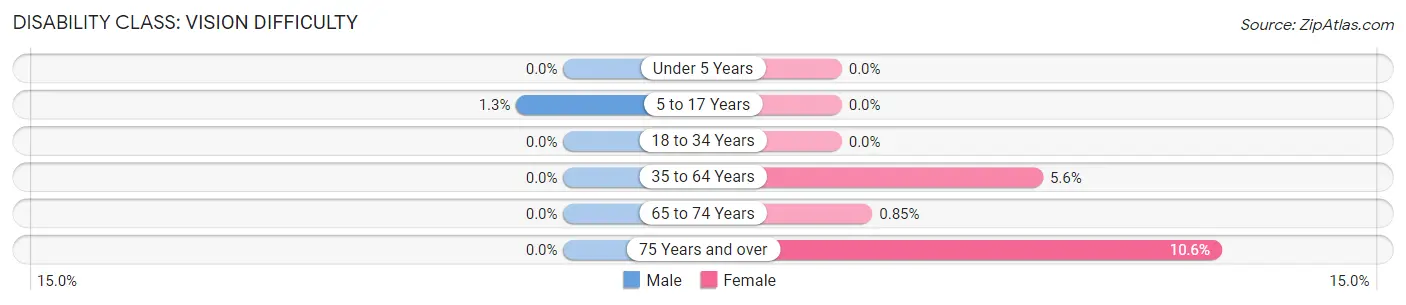
| Age Bracket | Male | Female |
| Under 5 Years | 0 (0.0%) | 0 (0.0%) |
| 5 to 17 Years | 4 (1.3%) | 0 (0.0%) |
| 18 to 34 Years | 0 (0.0%) | 0 (0.0%) |
| 35 to 64 Years | 0 (0.0%) | 23 (5.6%) |
| 65 to 74 Years | 0 (0.0%) | 1 (0.9%) |
| 75 Years and over | 0 (0.0%) | 11 (10.6%) |
Disability Class: Cognitive Difficulty
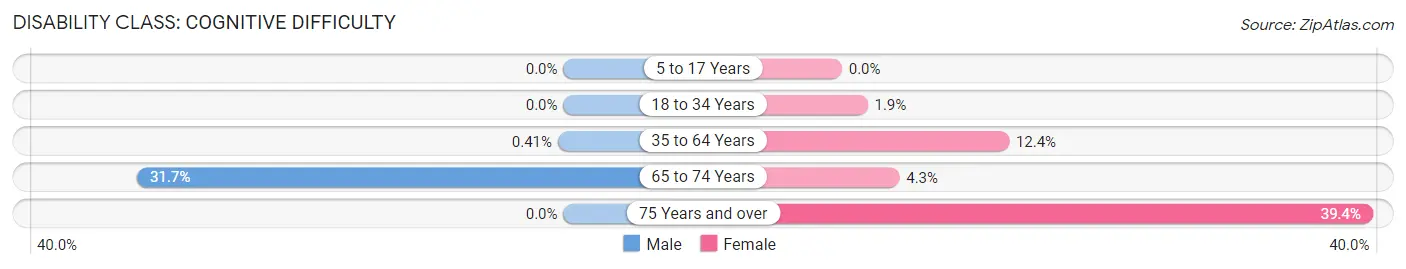
| Age Bracket | Male | Female |
| 5 to 17 Years | 0 (0.0%) | 0 (0.0%) |
| 18 to 34 Years | 0 (0.0%) | 4 (1.9%) |
| 35 to 64 Years | 2 (0.4%) | 51 (12.4%) |
| 65 to 74 Years | 25 (31.7%) | 5 (4.3%) |
| 75 Years and over | 0 (0.0%) | 41 (39.4%) |
Disability Class: Ambulatory Difficulty
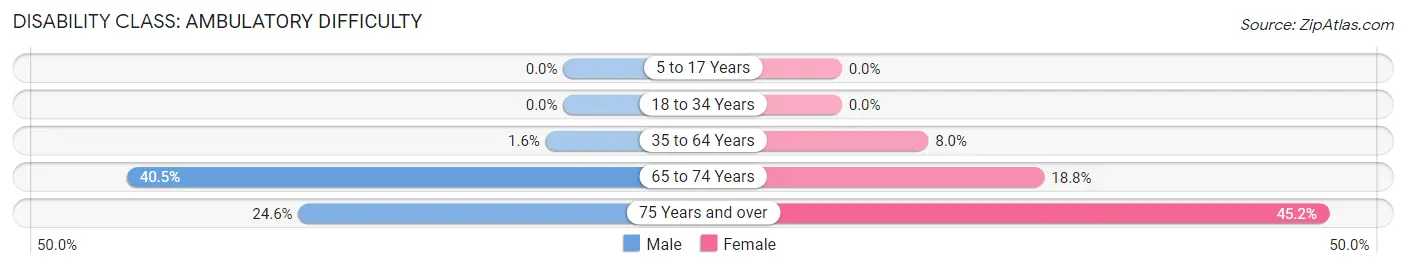
| Age Bracket | Male | Female |
| 5 to 17 Years | 0 (0.0%) | 0 (0.0%) |
| 18 to 34 Years | 0 (0.0%) | 0 (0.0%) |
| 35 to 64 Years | 8 (1.6%) | 33 (8.0%) |
| 65 to 74 Years | 32 (40.5%) | 22 (18.8%) |
| 75 Years and over | 15 (24.6%) | 47 (45.2%) |
Disability Class: Self-Care Difficulty
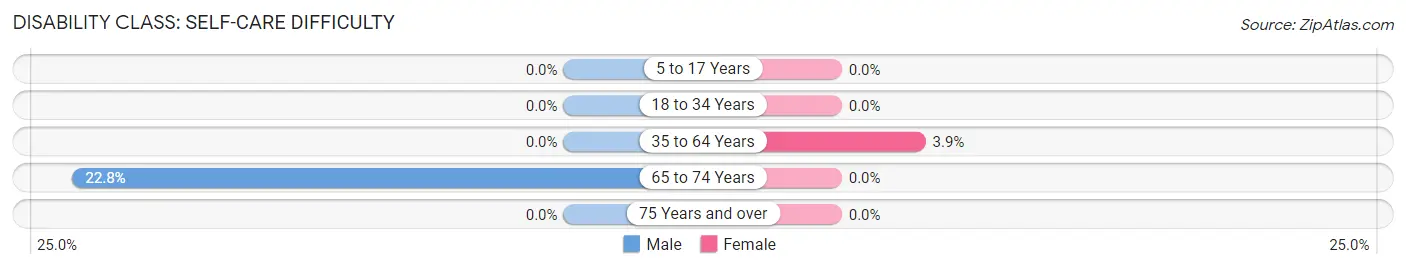
| Age Bracket | Male | Female |
| 5 to 17 Years | 0 (0.0%) | 0 (0.0%) |
| 18 to 34 Years | 0 (0.0%) | 0 (0.0%) |
| 35 to 64 Years | 0 (0.0%) | 16 (3.9%) |
| 65 to 74 Years | 18 (22.8%) | 0 (0.0%) |
| 75 Years and over | 0 (0.0%) | 0 (0.0%) |
Technology Access in Hamilton County
Computing Device Access in Hamilton County
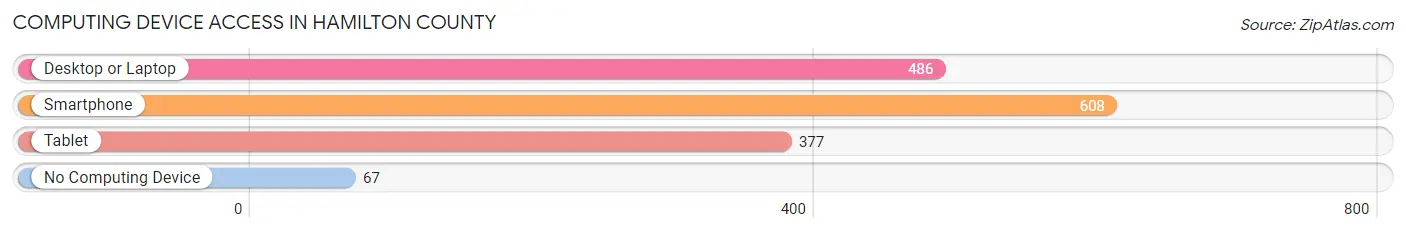
| Device Type | # Households | % Households |
| Desktop or Laptop | 486 | 67.9% |
| Smartphone | 608 | 84.9% |
| Tablet | 377 | 52.6% |
| No Computing Device | 67 | 9.4% |
| Total | 716 | 100.0% |
Internet Access in Hamilton County
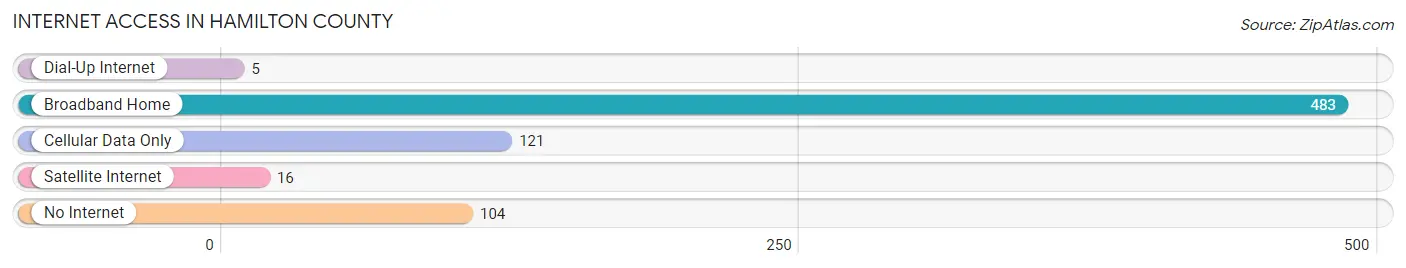
| Internet Type | # Households | % Households |
| Dial-Up Internet | 5 | 0.7% |
| Broadband Home | 483 | 67.5% |
| Cellular Data Only | 121 | 16.9% |
| Satellite Internet | 16 | 2.2% |
| No Internet | 104 | 14.5% |
| Total | 716 | 100.0% |
Hamilton County Summary
Hamilton County, Kansas is located in the south-central part of the state, and is bordered by Kearny, Finney, and Gray counties to the north, Stanton County to the east, Grant County to the south, and Kearny County to the west. The county seat is Syracuse, and the county was named after Alexander Hamilton, the first Secretary of the Treasury. The county has a total area of 876 square miles, and a population of 2,845 as of the 2010 census.
History
The area that is now Hamilton County was first settled by Native Americans, including the Apache, Comanche, and Kiowa tribes. The first white settlers arrived in the area in the late 1860s, and the county was officially organized in 1873. The county was named after Alexander Hamilton, the first Secretary of the Treasury.
The first town in the county was Syracuse, which was founded in 1873. The town was named after Syracuse, New York, and was chosen as the county seat. The first post office in the county was established in 1874.
The first railroad in the county was the Atchison, Topeka and Santa Fe Railway, which was built in 1887. This railroad connected Syracuse to other towns in the county, and helped to spur economic growth.
Geography
Hamilton County is located in the south-central part of Kansas, and is bordered by Kearny, Finney, and Gray counties to the north, Stanton County to the east, Grant County to the south, and Kearny County to the west. The county has a total area of 876 square miles, and is mostly flat, with some rolling hills in the western part of the county.
The county is home to several bodies of water, including the Arkansas River, which forms the western border of the county, and the Cimarron River, which flows through the county. The county also contains several small lakes, including Lake Scott State Park, which is located in the western part of the county.
Economy
The economy of Hamilton County is largely based on agriculture. The county is home to several large farms, and the main crops grown in the county are wheat, corn, and sorghum. The county also has a large cattle industry, and is home to several large feedlots.
The county also has a large oil and gas industry, and is home to several large oil and gas companies. The county also has a large manufacturing sector, and is home to several large factories.
Demographics
As of the 2010 census, there were 2,845 people, 1,093 households, and 790 families living in Hamilton County. The population density was 3.2 people per square mile. The racial makeup of the county was 95.3% White, 0.7% African American, 0.3% Native American, 0.2% Asian, 0.1% Pacific Islander, 1.7% from other races, and 1.9% from two or more races. Hispanic or Latino of any race were 4.2% of the population.
The median income for a household in the county was $41,944, and the median income for a family was $50,000. The per capita income for the county was $19,945. About 11.2% of families and 14.2% of the population were below the poverty line, including 19.2% of those under age 18 and 8.2% of those age 65 or over.
Common Questions
What is Per Capita Income in Hamilton County?
Per Capita income in Hamilton County is $28,145.
What is the Median Family Income in Hamilton County?
Median Family Income in Hamilton County is $73,350.
What is the Median Household income in Hamilton County?
Median Household Income in Hamilton County is $58,750.
What is Income or Wage Gap in Hamilton County?
Income or Wage Gap in Hamilton County is 40.8%.
Women in Hamilton County earn 59.2 cents for every dollar earned by a man.
What is Inequality or Gini Index in Hamilton County?
Inequality or Gini Index in Hamilton County is 0.39.
What is the Total Population of Hamilton County?
Total Population of Hamilton County is 2,520.
What is the Total Male Population of Hamilton County?
Total Male Population of Hamilton County is 1,287.
What is the Total Female Population of Hamilton County?
Total Female Population of Hamilton County is 1,233.
What is the Ratio of Males per 100 Females in Hamilton County?
There are 104.38 Males per 100 Females in Hamilton County.
What is the Ratio of Females per 100 Males in Hamilton County?
There are 95.80 Females per 100 Males in Hamilton County.
What is the Median Population Age in Hamilton County?
Median Population Age in Hamilton County is 35.4 Years.
What is the Average Family Size in Hamilton County
Average Family Size in Hamilton County is 4.5 People.
What is the Average Household Size in Hamilton County
Average Household Size in Hamilton County is 3.5 People.
How Large is the Labor Force in Hamilton County?
There are 1,174 People in the Labor Forcein in Hamilton County.
What is the Percentage of People in the Labor Force in Hamilton County?
64.1% of People are in the Labor Force in Hamilton County.