Grant County, KS Map & Demographics
Grant County Map
Grant County Overview
$36,280
PER CAPITA INCOME
$87,601
AVG FAMILY INCOME
$84,808
AVG HOUSEHOLD INCOME
45.4%
WAGE / INCOME GAP [ % ]
54.6¢/ $1
WAGE / INCOME GAP [ $ ]
0.39
INEQUALITY / GINI INDEX
7,336
TOTAL POPULATION
4,087
MALE POPULATION
3,249
FEMALE POPULATION
125.79
MALES / 100 FEMALES
79.50
FEMALES / 100 MALES
32.9
MEDIAN AGE
3.7
AVG FAMILY SIZE
3.0
AVG HOUSEHOLD SIZE
3,810
LABOR FORCE [ PEOPLE ]
72.2%
PERCENT IN LABOR FORCE
3.6%
UNEMPLOYMENT RATE
Grant County Area Codes
Income in Grant County
Income Overview in Grant County
Per Capita Income in Grant County is $36,280, while median incomes of families and households are $87,601 and $84,808 respectively.
| Characteristic | Number | Measure |
| Per Capita Income | 7,336 | $36,280 |
| Median Family Income | 1,779 | $87,601 |
| Mean Family Income | 1,779 | $102,214 |
| Median Household Income | 2,420 | $84,808 |
| Mean Household Income | 2,420 | $101,550 |
| Income Deficit | 1,779 | $0 |
| Wage / Income Gap (%) | 7,336 | 45.44% |
| Wage / Income Gap ($) | 7,336 | 54.56¢ per $1 |
| Gini / Inequality Index | 7,336 | 0.39 |
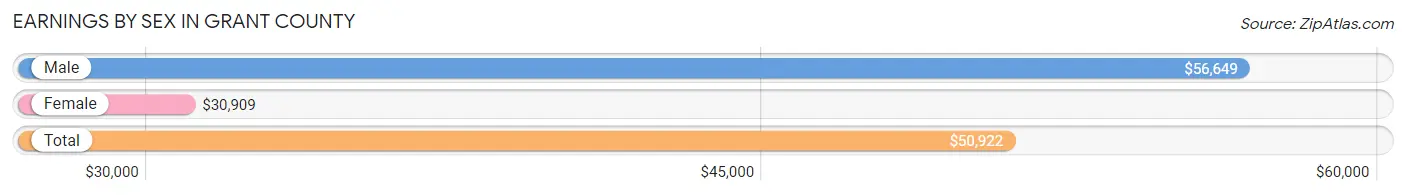
Earnings by Sex in Grant County
Average Earnings in Grant County are $50,922, $56,649 for men and $30,909 for women, a difference of 45.4%.
| Sex | Number | Average Earnings |
| Male | 2,222 (59.1%) | $56,649 |
| Female | 1,538 (40.9%) | $30,909 |
| Total | 3,760 (100.0%) | $50,922 |
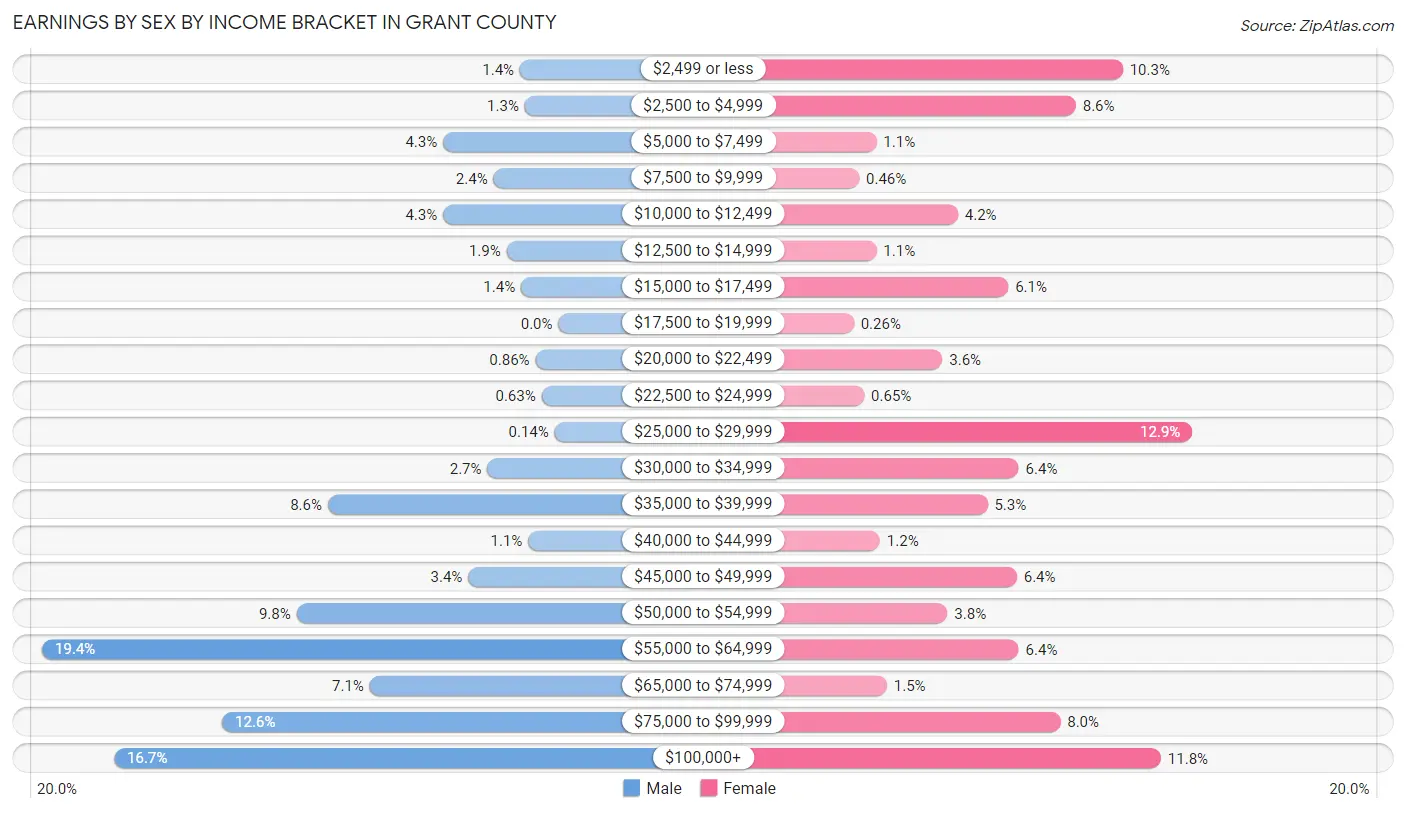
Earnings by Sex by Income Bracket in Grant County
The most common earnings brackets in Grant County are $55,000 to $64,999 for men (430 | 19.4%) and $25,000 to $29,999 for women (199 | 12.9%).
| Income | Male | Female |
| $2,499 or less | 32 (1.4%) | 159 (10.3%) |
| $2,500 to $4,999 | 28 (1.3%) | 132 (8.6%) |
| $5,000 to $7,499 | 96 (4.3%) | 17 (1.1%) |
| $7,500 to $9,999 | 54 (2.4%) | 7 (0.5%) |
| $10,000 to $12,499 | 96 (4.3%) | 64 (4.2%) |
| $12,500 to $14,999 | 43 (1.9%) | 17 (1.1%) |
| $15,000 to $17,499 | 31 (1.4%) | 93 (6.0%) |
| $17,500 to $19,999 | 0 (0.0%) | 4 (0.3%) |
| $20,000 to $22,499 | 19 (0.9%) | 55 (3.6%) |
| $22,500 to $24,999 | 14 (0.6%) | 10 (0.6%) |
| $25,000 to $29,999 | 3 (0.1%) | 199 (12.9%) |
| $30,000 to $34,999 | 59 (2.7%) | 99 (6.4%) |
| $35,000 to $39,999 | 192 (8.6%) | 81 (5.3%) |
| $40,000 to $44,999 | 25 (1.1%) | 19 (1.2%) |
| $45,000 to $49,999 | 75 (3.4%) | 98 (6.4%) |
| $50,000 to $54,999 | 218 (9.8%) | 58 (3.8%) |
| $55,000 to $64,999 | 430 (19.4%) | 99 (6.4%) |
| $65,000 to $74,999 | 157 (7.1%) | 23 (1.5%) |
| $75,000 to $99,999 | 280 (12.6%) | 123 (8.0%) |
| $100,000+ | 370 (16.7%) | 181 (11.8%) |
| Total | 2,222 (100.0%) | 1,538 (100.0%) |
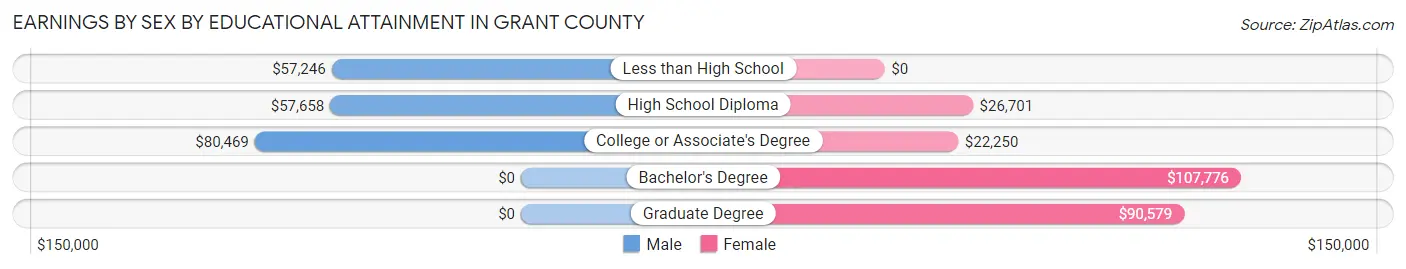
Earnings by Sex by Educational Attainment in Grant County
Average earnings in Grant County are $58,837 for men and $35,804 for women, a difference of 39.2%. Men with an educational attainment of college or associate's degree enjoy the highest average annual earnings of $80,469, while those with less than high school education earn the least with $57,246. Women with an educational attainment of bachelor's degree earn the most with the average annual earnings of $107,776, while those with college or associate's degree education have the smallest earnings of $22,250.
| Educational Attainment | Male Income | Female Income |
| Less than High School | $57,246 | $0 |
| High School Diploma | $57,658 | $26,701 |
| College or Associate's Degree | $80,469 | $22,250 |
| Bachelor's Degree | - | - |
| Graduate Degree | - | - |
| Total | $58,837 | $35,804 |
Family Income in Grant County
Family Income Brackets in Grant County
According to the Grant County family income data, there are 603 families falling into the $50,000 to $74,999 income range, which is the most common income bracket and makes up 33.9% of all families. Conversely, the less than $10,000 income bracket is the least frequent group with only 12 families (0.7%) belonging to this category.
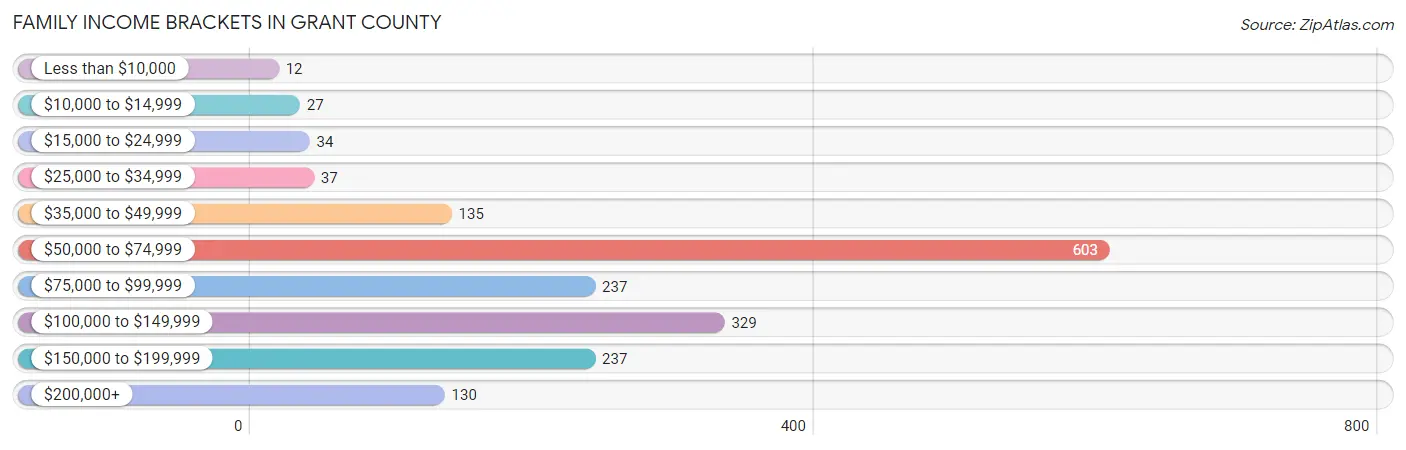
| Income Bracket | # Families | % Families |
| Less than $10,000 | 12 | 0.7% |
| $10,000 to $14,999 | 27 | 1.5% |
| $15,000 to $24,999 | 34 | 1.9% |
| $25,000 to $34,999 | 37 | 2.1% |
| $35,000 to $49,999 | 135 | 7.6% |
| $50,000 to $74,999 | 603 | 33.9% |
| $75,000 to $99,999 | 237 | 13.3% |
| $100,000 to $149,999 | 329 | 18.5% |
| $150,000 to $199,999 | 237 | 13.3% |
| $200,000+ | 130 | 7.3% |
Family Income by Famaliy Size in Grant County
6-person families (38 | 2.1%) account for the highest median family income in Grant County with $132,738 per family, while 2-person families (733 | 41.2%) have the highest median income of $62,605 per family member.
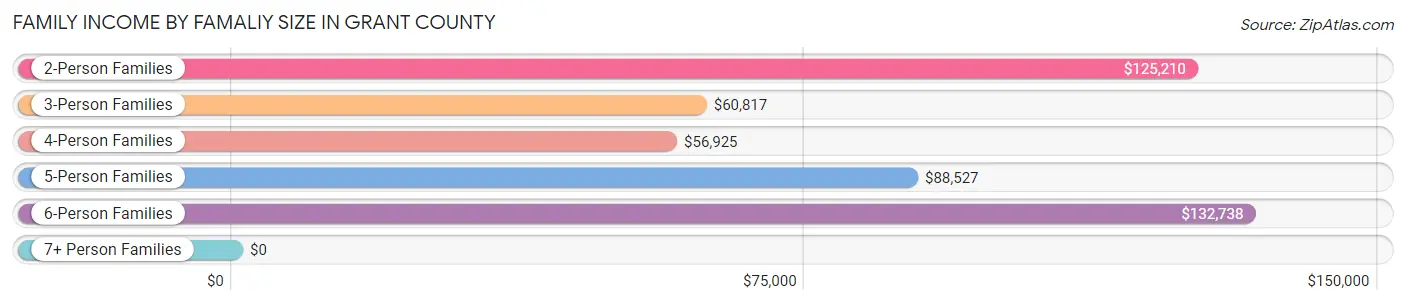
| Income Bracket | # Families | Median Income |
| 2-Person Families | 733 (41.2%) | $125,210 |
| 3-Person Families | 399 (22.4%) | $60,817 |
| 4-Person Families | 442 (24.8%) | $56,925 |
| 5-Person Families | 161 (9.0%) | $88,527 |
| 6-Person Families | 38 (2.1%) | $132,738 |
| 7+ Person Families | 6 (0.3%) | $0 |
| Total | 1,779 (100.0%) | $87,601 |
Family Income by Number of Earners in Grant County
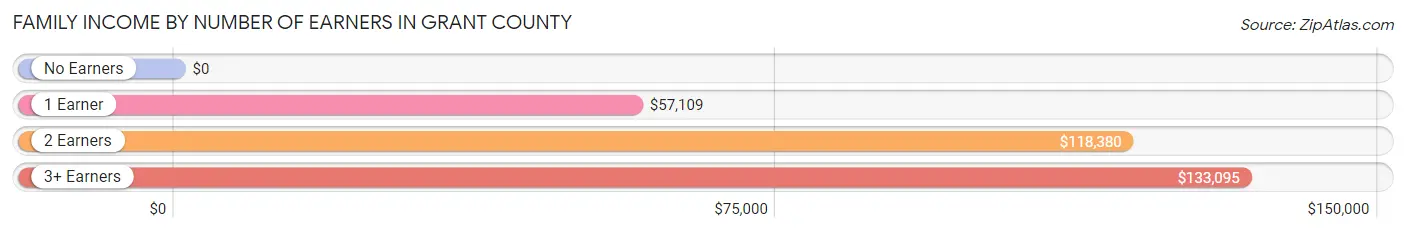
| Number of Earners | # Families | Median Income |
| No Earners | 95 (5.3%) | $0 |
| 1 Earner | 681 (38.3%) | $57,109 |
| 2 Earners | 913 (51.3%) | $118,380 |
| 3+ Earners | 90 (5.1%) | $133,095 |
| Total | 1,779 (100.0%) | $87,601 |
Household Income in Grant County
Household Income Brackets in Grant County
With 639 households falling in the category, the $50,000 to $74,999 income range is the most frequent in Grant County, accounting for 26.4% of all households. In contrast, only 34 households (1.4%) fall into the $10,000 to $14,999 income bracket, making it the least populous group.
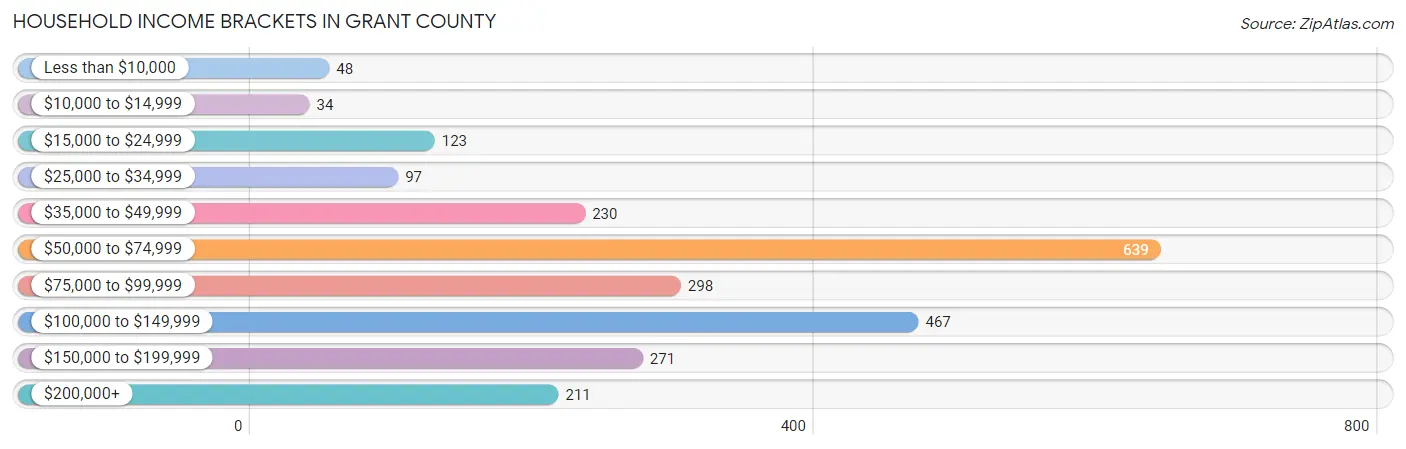
| Income Bracket | # Households | % Households |
| Less than $10,000 | 48 | 2.0% |
| $10,000 to $14,999 | 34 | 1.4% |
| $15,000 to $24,999 | 123 | 5.1% |
| $25,000 to $34,999 | 97 | 4.0% |
| $35,000 to $49,999 | 230 | 9.5% |
| $50,000 to $74,999 | 639 | 26.4% |
| $75,000 to $99,999 | 298 | 12.3% |
| $100,000 to $149,999 | 467 | 19.3% |
| $150,000 to $199,999 | 271 | 11.2% |
| $200,000+ | 211 | 8.7% |
Household Income by Householder Age in Grant County
The median household income in Grant County is $84,808, with the highest median household income of $101,250 found in the 45 to 64 years age bracket for the primary householder. A total of 869 households (35.9%) fall into this category. Meanwhile, the 15 to 24 years age bracket for the primary householder has the lowest median household income of $0, with 37 households (1.5%) in this group.
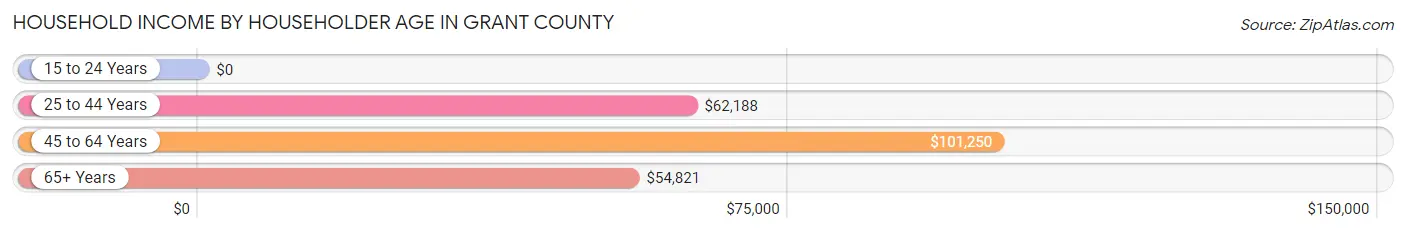
| Income Bracket | # Households | Median Income |
| 15 to 24 Years | 37 (1.5%) | $0 |
| 25 to 44 Years | 1,052 (43.5%) | $62,188 |
| 45 to 64 Years | 869 (35.9%) | $101,250 |
| 65+ Years | 462 (19.1%) | $54,821 |
| Total | 2,420 (100.0%) | $84,808 |
Poverty in Grant County
Income Below Poverty by Sex and Age in Grant County
With 4.4% poverty level for males and 6.6% for females among the residents of Grant County, under 5 year old males and 18 to 24 year old females are the most vulnerable to poverty, with 53 males (13.9%) and 62 females (29.9%) in their respective age groups living below the poverty level.
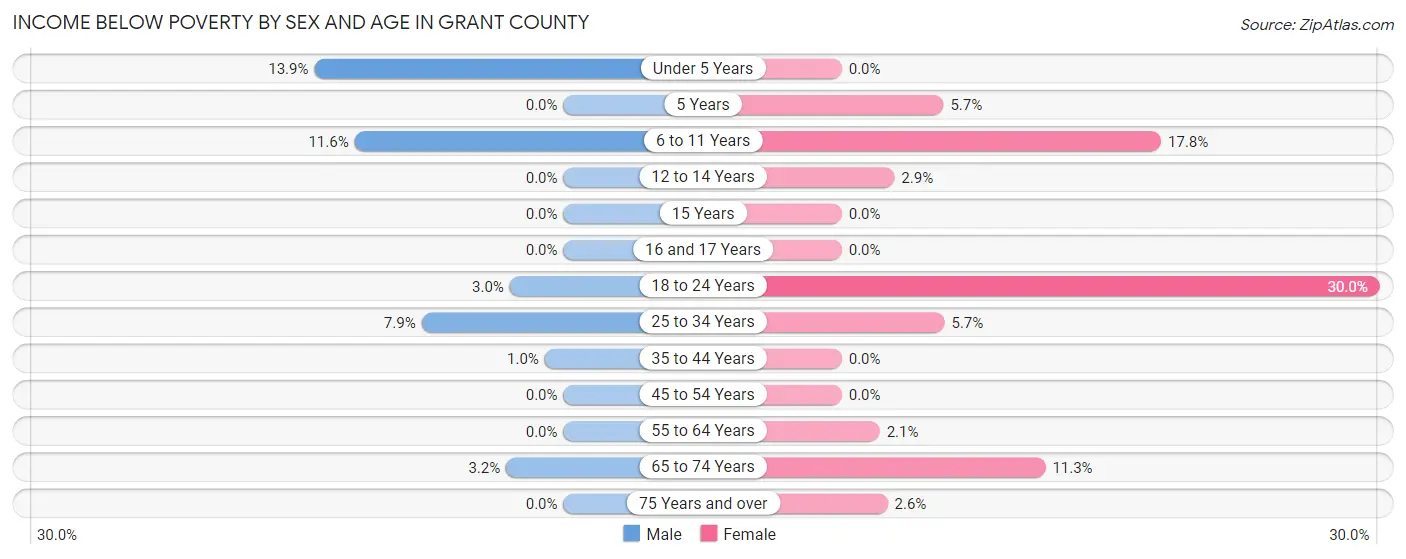
| Age Bracket | Male | Female |
| Under 5 Years | 53 (13.9%) | 0 (0.0%) |
| 5 Years | 0 (0.0%) | 6 (5.7%) |
| 6 to 11 Years | 55 (11.6%) | 61 (17.8%) |
| 12 to 14 Years | 0 (0.0%) | 6 (2.9%) |
| 15 Years | 0 (0.0%) | 0 (0.0%) |
| 16 and 17 Years | 0 (0.0%) | 0 (0.0%) |
| 18 to 24 Years | 11 (3.0%) | 62 (29.9%) |
| 25 to 34 Years | 43 (7.9%) | 29 (5.7%) |
| 35 to 44 Years | 4 (1.0%) | 0 (0.0%) |
| 45 to 54 Years | 0 (0.0%) | 0 (0.0%) |
| 55 to 64 Years | 0 (0.0%) | 8 (2.1%) |
| 65 to 74 Years | 12 (3.2%) | 33 (11.3%) |
| 75 Years and over | 0 (0.0%) | 4 (2.5%) |
| Total | 178 (4.4%) | 209 (6.6%) |
Income Above Poverty by Sex and Age in Grant County
According to the poverty statistics in Grant County, males aged 5 years and females aged under 5 years are the age groups that are most secure financially, with 100.0% of males and 100.0% of females in these age groups living above the poverty line.
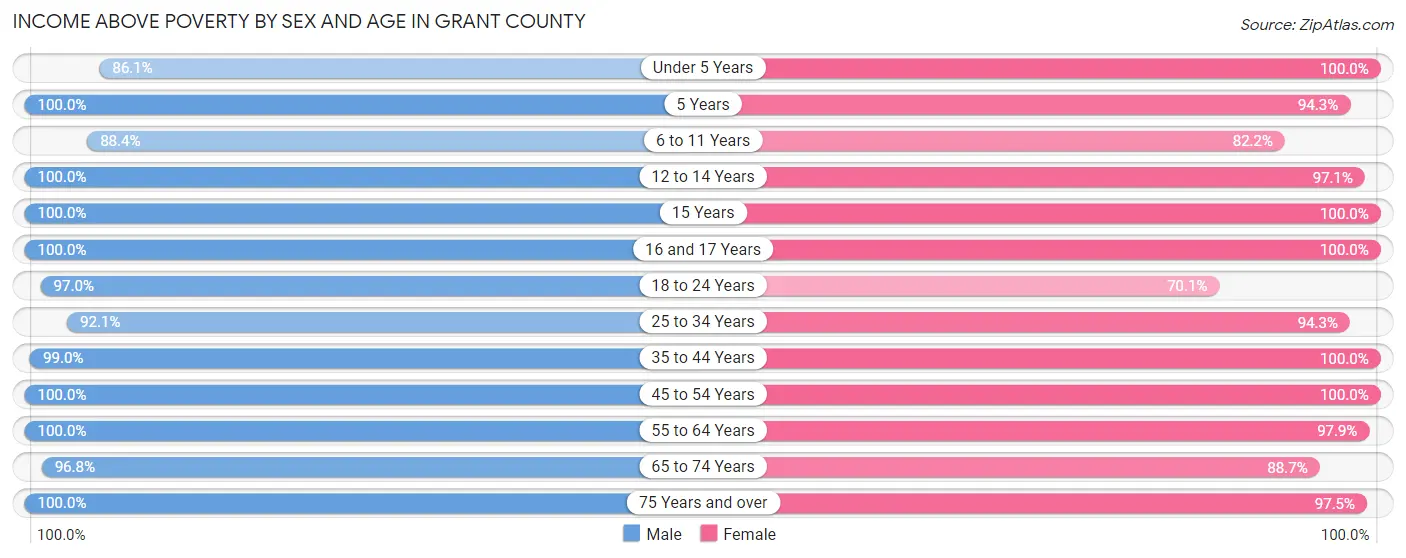
| Age Bracket | Male | Female |
| Under 5 Years | 329 (86.1%) | 126 (100.0%) |
| 5 Years | 46 (100.0%) | 100 (94.3%) |
| 6 to 11 Years | 418 (88.4%) | 282 (82.2%) |
| 12 to 14 Years | 320 (100.0%) | 199 (97.1%) |
| 15 Years | 29 (100.0%) | 6 (100.0%) |
| 16 and 17 Years | 176 (100.0%) | 48 (100.0%) |
| 18 to 24 Years | 357 (97.0%) | 145 (70.1%) |
| 25 to 34 Years | 501 (92.1%) | 478 (94.3%) |
| 35 to 44 Years | 379 (99.0%) | 351 (100.0%) |
| 45 to 54 Years | 348 (100.0%) | 457 (100.0%) |
| 55 to 64 Years | 553 (100.0%) | 372 (97.9%) |
| 65 to 74 Years | 364 (96.8%) | 258 (88.7%) |
| 75 Years and over | 68 (100.0%) | 153 (97.5%) |
| Total | 3,888 (95.6%) | 2,975 (93.4%) |
Income Below Poverty Among Married-Couple Families in Grant County
The poverty statistics for married-couple families in Grant County show that 0.3% or 4 of the total 1,612 families live below the poverty line. Families with 5 or more children have the highest poverty rate of 100.0%, comprising of 4 families. On the other hand, families with no children have the lowest poverty rate of 0.0%, which includes 0 families.
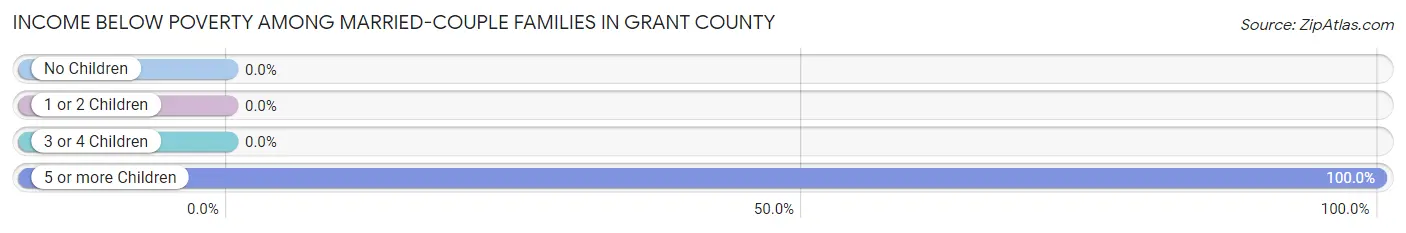
| Children | Above Poverty | Below Poverty |
| No Children | 693 (100.0%) | 0 (0.0%) |
| 1 or 2 Children | 733 (100.0%) | 0 (0.0%) |
| 3 or 4 Children | 182 (100.0%) | 0 (0.0%) |
| 5 or more Children | 0 (0.0%) | 4 (100.0%) |
| Total | 1,608 (99.8%) | 4 (0.3%) |
Income Below Poverty Among Single-Parent Households in Grant County
According to the poverty data in Grant County, 51.1% or 23 single-father households and 21.3% or 26 single-mother households are living below the poverty line. Among single-father households, those with 1 or 2 children have the highest poverty rate, with 23 households (69.7%) experiencing poverty. Likewise, among single-mother households, those with 1 or 2 children have the highest poverty rate, with 26 households (54.2%) falling below the poverty line.
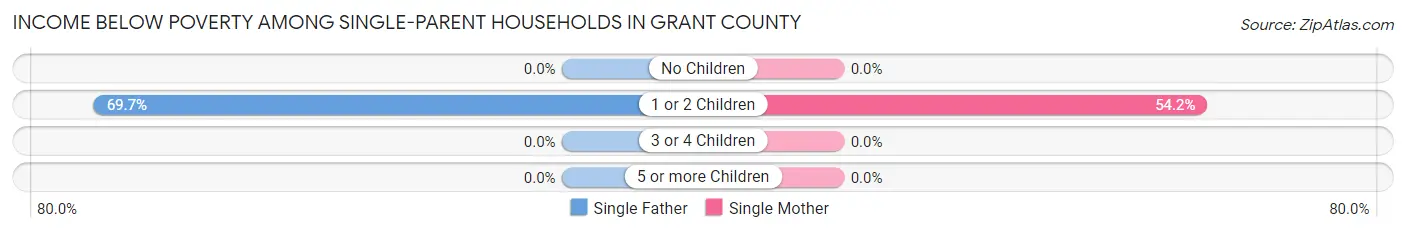
| Children | Single Father | Single Mother |
| No Children | 0 (0.0%) | 0 (0.0%) |
| 1 or 2 Children | 23 (69.7%) | 26 (54.2%) |
| 3 or 4 Children | 0 (0.0%) | 0 (0.0%) |
| 5 or more Children | 0 (0.0%) | 0 (0.0%) |
| Total | 23 (51.1%) | 26 (21.3%) |
Income Below Poverty Among Married-Couple vs Single-Parent Households in Grant County
The poverty data for Grant County shows that 4 of the married-couple family households (0.3%) and 49 of the single-parent households (29.3%) are living below the poverty level. Within the married-couple family households, those with 5 or more children have the highest poverty rate, with 4 households (100.0%) falling below the poverty line. Among the single-parent households, those with 1 or 2 children have the highest poverty rate, with 49 household (60.5%) living below poverty.
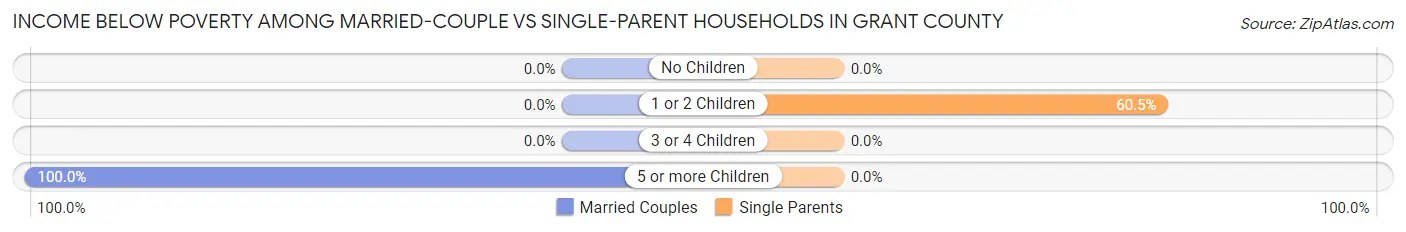
| Children | Married-Couple Families | Single-Parent Households |
| No Children | 0 (0.0%) | 0 (0.0%) |
| 1 or 2 Children | 0 (0.0%) | 49 (60.5%) |
| 3 or 4 Children | 0 (0.0%) | 0 (0.0%) |
| 5 or more Children | 4 (100.0%) | 0 (0.0%) |
| Total | 4 (0.3%) | 49 (29.3%) |
Race in Grant County
The most populous races in Grant County are White / Caucasian (5,634 | 76.8%), Hispanic or Latino (3,631 | 49.5%), and Two or more Races (1,368 | 18.6%).
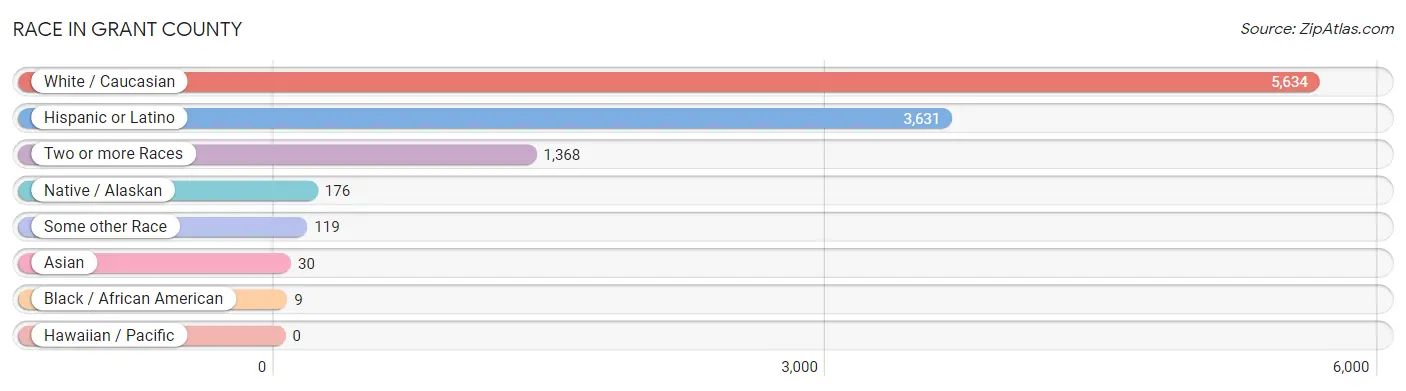
| Race | # Population | % Population |
| Asian | 30 | 0.4% |
| Black / African American | 9 | 0.1% |
| Hawaiian / Pacific | 0 | 0.0% |
| Hispanic or Latino | 3,631 | 49.5% |
| Native / Alaskan | 176 | 2.4% |
| White / Caucasian | 5,634 | 76.8% |
| Two or more Races | 1,368 | 18.6% |
| Some other Race | 119 | 1.6% |
| Total | 7,336 | 100.0% |
Ancestry in Grant County
The most populous ancestries reported in Grant County are Mexican (3,603 | 49.1%), German (1,248 | 17.0%), Irish (576 | 7.9%), English (354 | 4.8%), and Mexican American Indian (239 | 3.3%), together accounting for 82.1% of all Grant County residents.
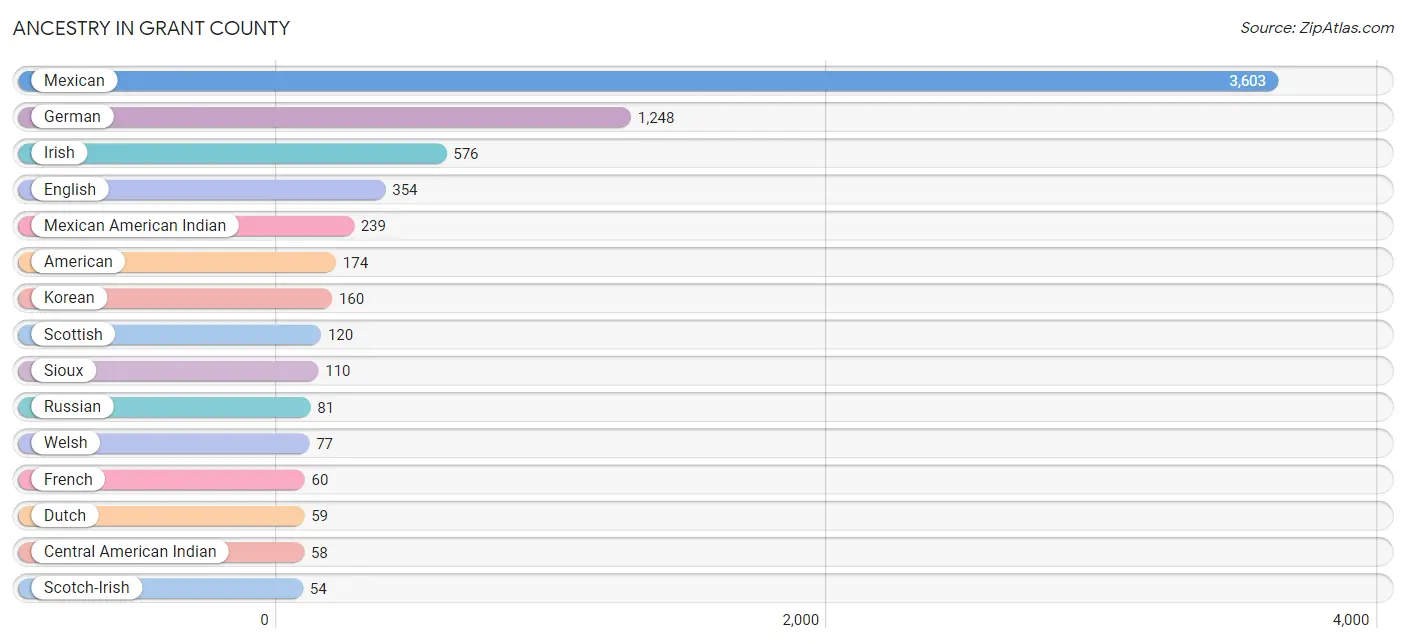
| Ancestry | # Population | % Population |
| American | 174 | 2.4% |
| Apache | 29 | 0.4% |
| Bangladeshi | 30 | 0.4% |
| Belgian | 41 | 0.6% |
| Cajun | 11 | 0.2% |
| Central American Indian | 58 | 0.8% |
| Cherokee | 24 | 0.3% |
| Choctaw | 2 | 0.0% |
| Cuban | 28 | 0.4% |
| Dutch | 59 | 0.8% |
| English | 354 | 4.8% |
| European | 4 | 0.1% |
| French | 60 | 0.8% |
| German | 1,248 | 17.0% |
| German Russian | 3 | 0.0% |
| Irish | 576 | 7.9% |
| Korean | 160 | 2.2% |
| Mexican | 3,603 | 49.1% |
| Mexican American Indian | 239 | 3.3% |
| Norwegian | 7 | 0.1% |
| Pennsylvania German | 33 | 0.4% |
| Polish | 1 | 0.0% |
| Potawatomi | 4 | 0.1% |
| Russian | 81 | 1.1% |
| Scotch-Irish | 54 | 0.7% |
| Scottish | 120 | 1.6% |
| Sioux | 110 | 1.5% |
| Swedish | 53 | 0.7% |
| Swiss | 40 | 0.5% |
| Welsh | 77 | 1.1% | View All 30 Rows |
Immigrants in Grant County
The most numerous immigrant groups reported in Grant County came from Central America (1,506 | 20.5%), Latin America (1,506 | 20.5%), Mexico (1,484 | 20.2%), Europe (96 | 1.3%), and Germany (96 | 1.3%), together accounting for 63.9% of all Grant County residents.
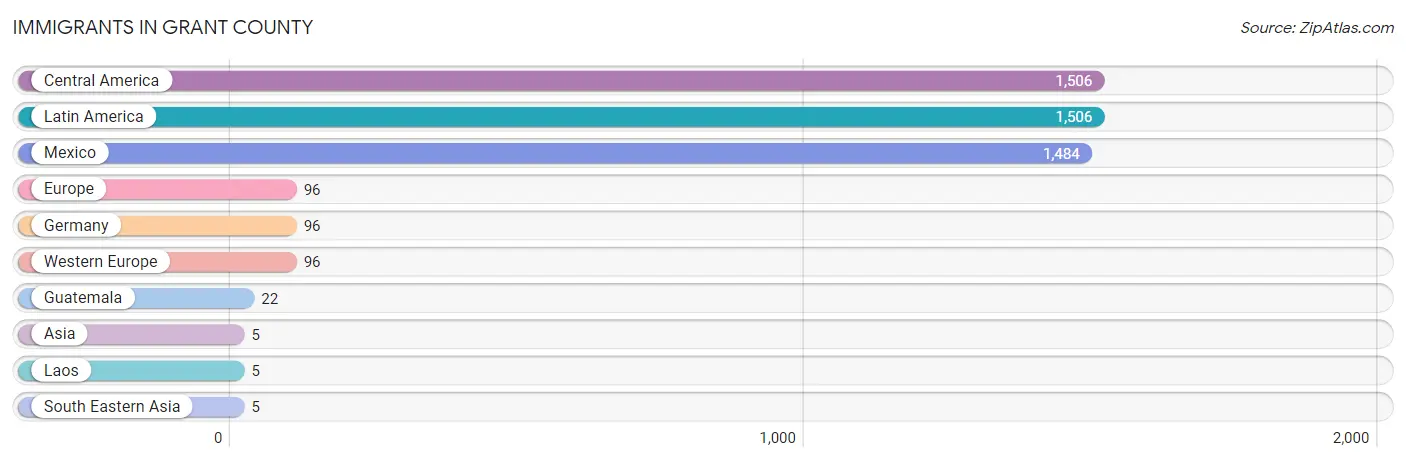
| Immigration Origin | # Population | % Population |
| Asia | 5 | 0.1% |
| Central America | 1,506 | 20.5% |
| Europe | 96 | 1.3% |
| Germany | 96 | 1.3% |
| Guatemala | 22 | 0.3% |
| Laos | 5 | 0.1% |
| Latin America | 1,506 | 20.5% |
| Mexico | 1,484 | 20.2% |
| South Eastern Asia | 5 | 0.1% |
| Western Europe | 96 | 1.3% | View All 10 Rows |
Sex and Age in Grant County
Sex and Age in Grant County
The most populous age groups in Grant County are 15 to 19 Years (518 | 12.7%) for men and 10 to 14 Years (381 | 11.7%) for women.
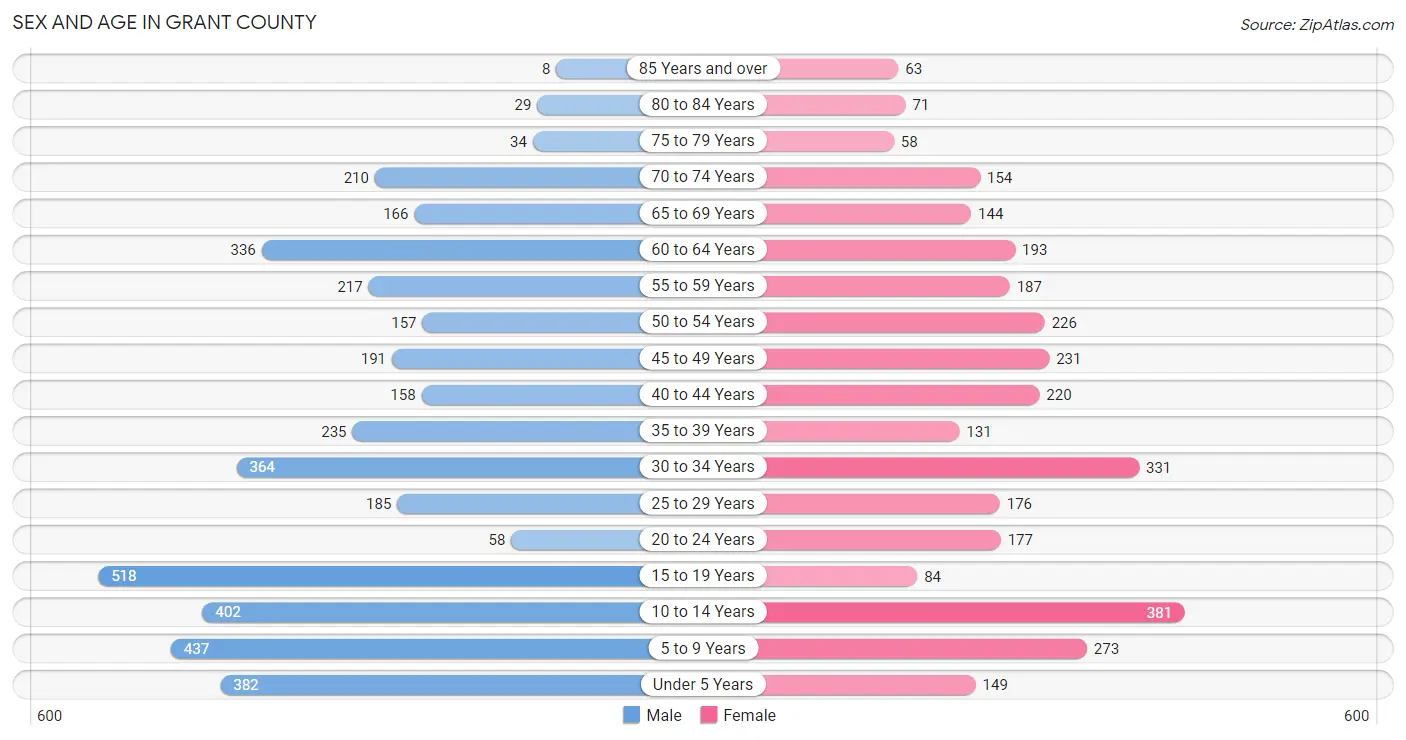
| Age Bracket | Male | Female |
| Under 5 Years | 382 (9.3%) | 149 (4.6%) |
| 5 to 9 Years | 437 (10.7%) | 273 (8.4%) |
| 10 to 14 Years | 402 (9.8%) | 381 (11.7%) |
| 15 to 19 Years | 518 (12.7%) | 84 (2.6%) |
| 20 to 24 Years | 58 (1.4%) | 177 (5.4%) |
| 25 to 29 Years | 185 (4.5%) | 176 (5.4%) |
| 30 to 34 Years | 364 (8.9%) | 331 (10.2%) |
| 35 to 39 Years | 235 (5.8%) | 131 (4.0%) |
| 40 to 44 Years | 158 (3.9%) | 220 (6.8%) |
| 45 to 49 Years | 191 (4.7%) | 231 (7.1%) |
| 50 to 54 Years | 157 (3.8%) | 226 (7.0%) |
| 55 to 59 Years | 217 (5.3%) | 187 (5.8%) |
| 60 to 64 Years | 336 (8.2%) | 193 (5.9%) |
| 65 to 69 Years | 166 (4.1%) | 144 (4.4%) |
| 70 to 74 Years | 210 (5.1%) | 154 (4.7%) |
| 75 to 79 Years | 34 (0.8%) | 58 (1.8%) |
| 80 to 84 Years | 29 (0.7%) | 71 (2.2%) |
| 85 Years and over | 8 (0.2%) | 63 (1.9%) |
| Total | 4,087 (100.0%) | 3,249 (100.0%) |
Families and Households in Grant County
Median Family Size in Grant County
The median family size in Grant County is 3.66 persons per family, with single female/mother families (122 | 6.9%) accounting for the largest median family size of 4.52 persons per family. On the other hand, single male/father families (45 | 2.5%) represent the smallest median family size with 2.82 persons per family.
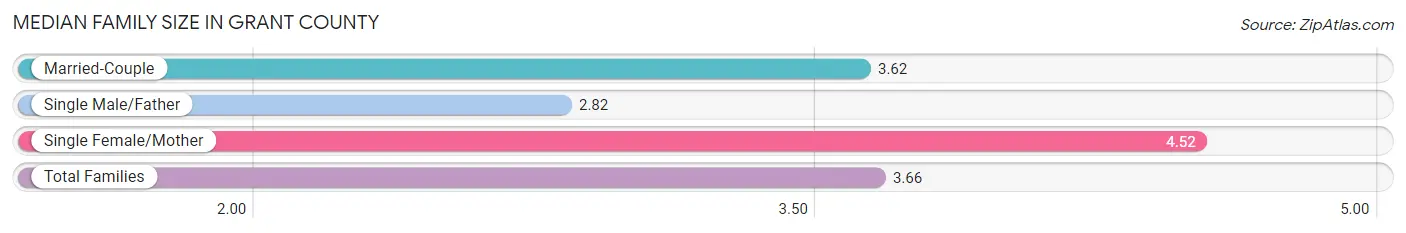
| Family Type | # Families | Family Size |
| Married-Couple | 1,612 (90.6%) | 3.62 |
| Single Male/Father | 45 (2.5%) | 2.82 |
| Single Female/Mother | 122 (6.9%) | 4.52 |
| Total Families | 1,779 (100.0%) | 3.66 |
Median Household Size in Grant County
The median household size in Grant County is 3.01 persons per household, with single female/mother households (122 | 5.0%) accounting for the largest median household size of 4.55 persons per household. non-family households (641 | 26.5%) represent the smallest median household size with 1.11 persons per household.
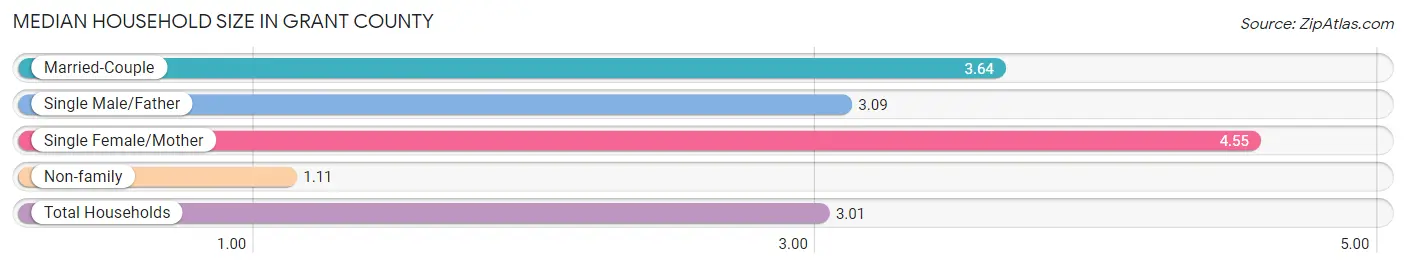
| Household Type | # Households | Household Size |
| Married-Couple | 1,612 (66.6%) | 3.64 |
| Single Male/Father | 45 (1.9%) | 3.09 |
| Single Female/Mother | 122 (5.0%) | 4.55 |
| Non-family | 641 (26.5%) | 1.11 |
| Total Households | 2,420 (100.0%) | 3.01 |
Household Size by Marriage Status in Grant County
Out of a total of 2,420 households in Grant County, 1,779 (73.5%) are family households, while 641 (26.5%) are nonfamily households. The most numerous type of family households are 2-person households, comprising 717, and the most common type of nonfamily households are 1-person households, comprising 579.
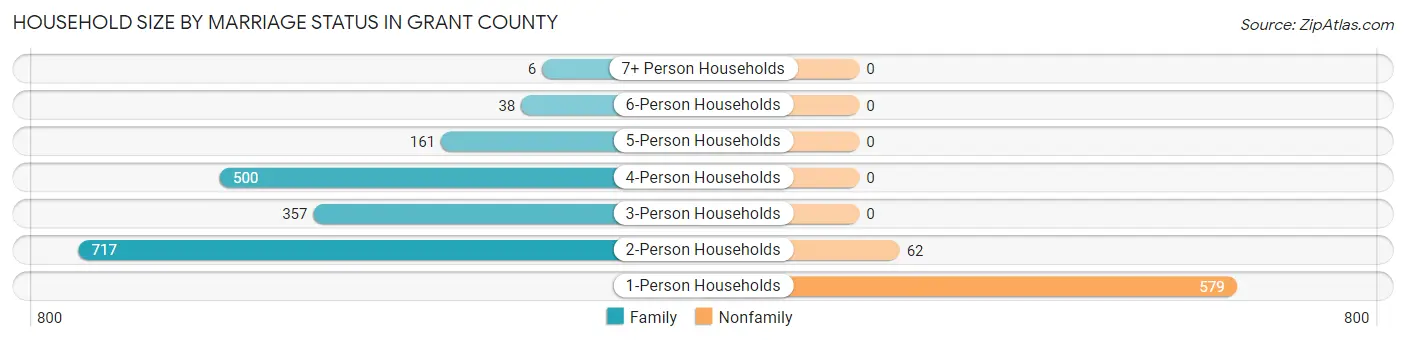
| Household Size | Family Households | Nonfamily Households |
| 1-Person Households | - | 579 (23.9%) |
| 2-Person Households | 717 (29.6%) | 62 (2.6%) |
| 3-Person Households | 357 (14.7%) | 0 (0.0%) |
| 4-Person Households | 500 (20.7%) | 0 (0.0%) |
| 5-Person Households | 161 (6.7%) | 0 (0.0%) |
| 6-Person Households | 38 (1.6%) | 0 (0.0%) |
| 7+ Person Households | 6 (0.3%) | 0 (0.0%) |
| Total | 1,779 (73.5%) | 641 (26.5%) |
Female Fertility in Grant County
Fertility by Age in Grant County
Average fertility rate in Grant County is 184.0 births per 1,000 women. Women in the age bracket of 20 to 34 years have the highest fertility rate with 380.0 births per 1,000 women. Women in the age bracket of 20 to 34 years acount for 100.0% of all women with births.
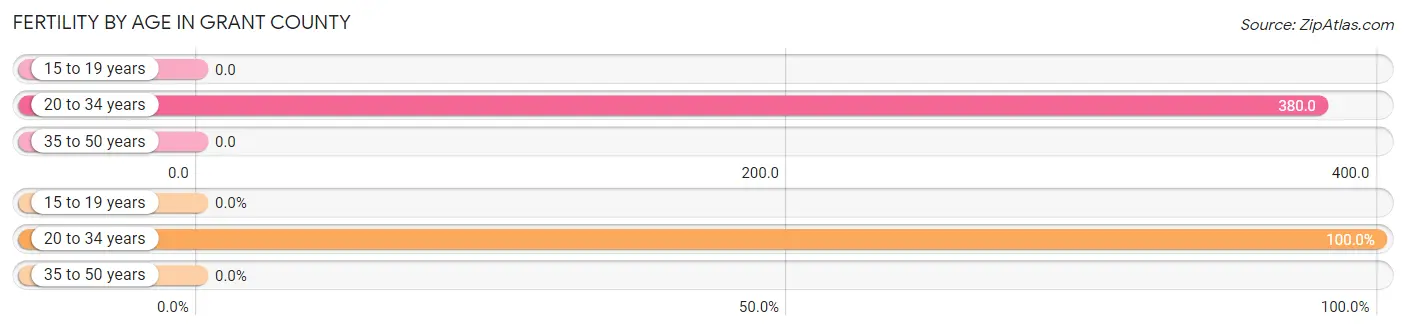
| Age Bracket | Women with Births | Births / 1,000 Women |
| 15 to 19 years | 0 (0.0%) | 0.0 |
| 20 to 34 years | 260 (100.0%) | 380.0 |
| 35 to 50 years | 0 (0.0%) | 0.0 |
| Total | 260 (100.0%) | 184.0 |
Fertility by Age by Marriage Status in Grant County
70.0% of women with births (260) in Grant County are married. The highest percentage of unmarried women with births falls into 20 to 34 years age bracket with 30.0% of them unmarried at the time of birth, while the lowest percentage of unmarried women with births belong to 20 to 34 years age bracket with 30.0% of them unmarried.
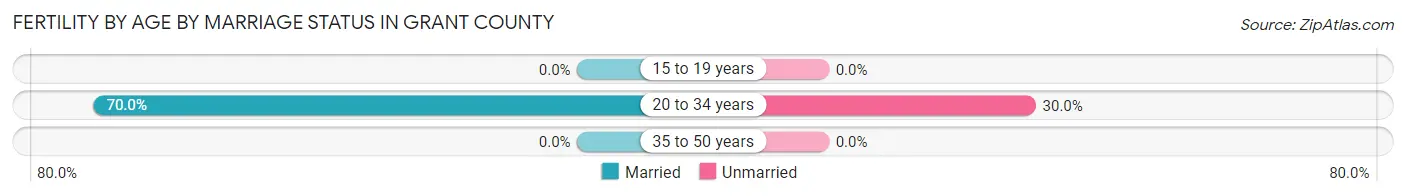
| Age Bracket | Married | Unmarried |
| 15 to 19 years | 0 (0.0%) | 0 (0.0%) |
| 20 to 34 years | 182 (70.0%) | 78 (30.0%) |
| 35 to 50 years | 0 (0.0%) | 0 (0.0%) |
| Total | 182 (70.0%) | 78 (30.0%) |
Fertility by Education in Grant County
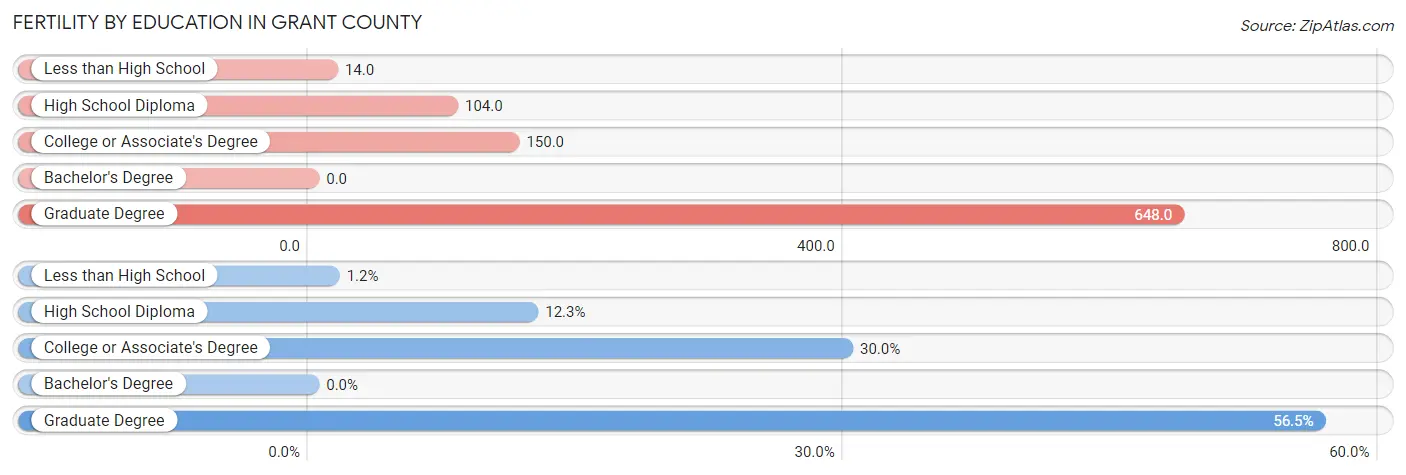
| Educational Attainment | Women with Births | Births / 1,000 Women |
| Less than High School | 3 (1.1%) | 14.0 |
| High School Diploma | 32 (12.3%) | 104.0 |
| College or Associate's Degree | 78 (30.0%) | 150.0 |
| Bachelor's Degree | 0 (0.0%) | 0.0 |
| Graduate Degree | 147 (56.5%) | 648.0 |
| Total | 260 (100.0%) | 184.0 |
Fertility by Education by Marriage Status in Grant County
30.0% of women with births in Grant County are unmarried. Women with the educational attainment of less than high school are most likely to be married with 100.0% of them married at childbirth, while women with the educational attainment of college or associate's degree are least likely to be married with 100.0% of them unmarried at childbirth.
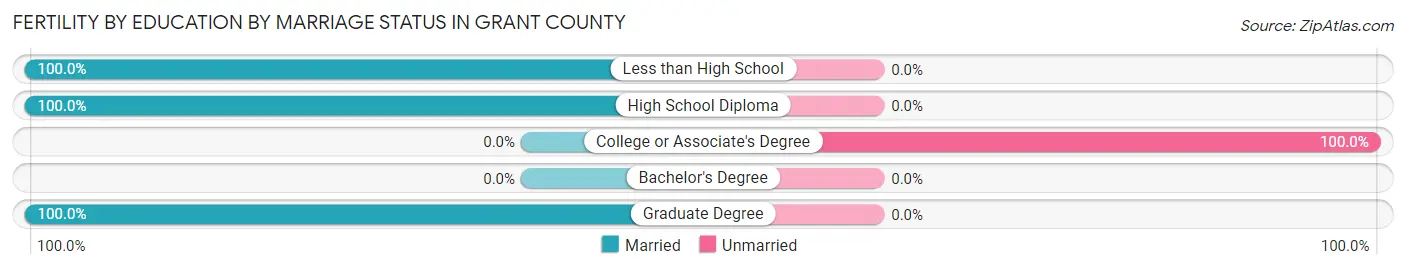
| Educational Attainment | Married | Unmarried |
| Less than High School | 3 (100.0%) | 0 (0.0%) |
| High School Diploma | 32 (100.0%) | 0 (0.0%) |
| College or Associate's Degree | 0 (0.0%) | 78 (100.0%) |
| Bachelor's Degree | 0 (0.0%) | 0 (0.0%) |
| Graduate Degree | 147 (100.0%) | 0 (0.0%) |
| Total | 182 (70.0%) | 78 (30.0%) |
Employment Characteristics in Grant County
Employment by Class of Employer in Grant County
Among the 3,587 employed individuals in Grant County, private company employees (2,742 | 76.4%), local government employees (189 | 5.3%), and self-employed (not incorporated) (169 | 4.7%) make up the most common classes of employment.
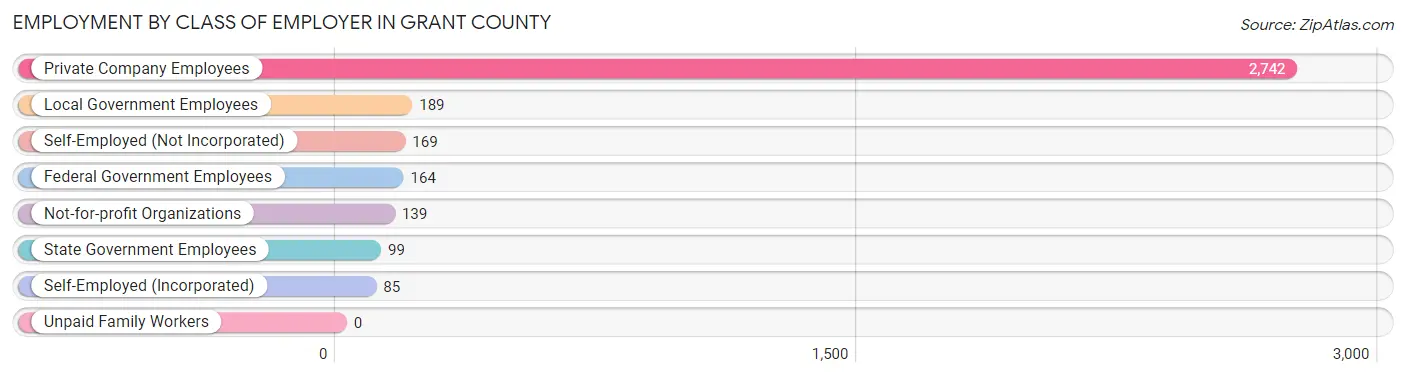
| Employer Class | # Employees | % Employees |
| Private Company Employees | 2,742 | 76.4% |
| Self-Employed (Incorporated) | 85 | 2.4% |
| Self-Employed (Not Incorporated) | 169 | 4.7% |
| Not-for-profit Organizations | 139 | 3.9% |
| Local Government Employees | 189 | 5.3% |
| State Government Employees | 99 | 2.8% |
| Federal Government Employees | 164 | 4.6% |
| Unpaid Family Workers | 0 | 0.0% |
| Total | 3,587 | 100.0% |
Employment Status by Age in Grant County
According to the labor force statistics for Grant County, out of the total population over 16 years of age (5,277), 72.2% or 3,810 individuals are in the labor force, with 3.6% or 137 of them unemployed. The age group with the highest labor force participation rate is 55 to 59 years, with 100.0% or 404 individuals in the labor force. Within the labor force, the 16 to 19 years age range has the highest percentage of unemployed individuals, with 19.1% or 75 of them being unemployed.
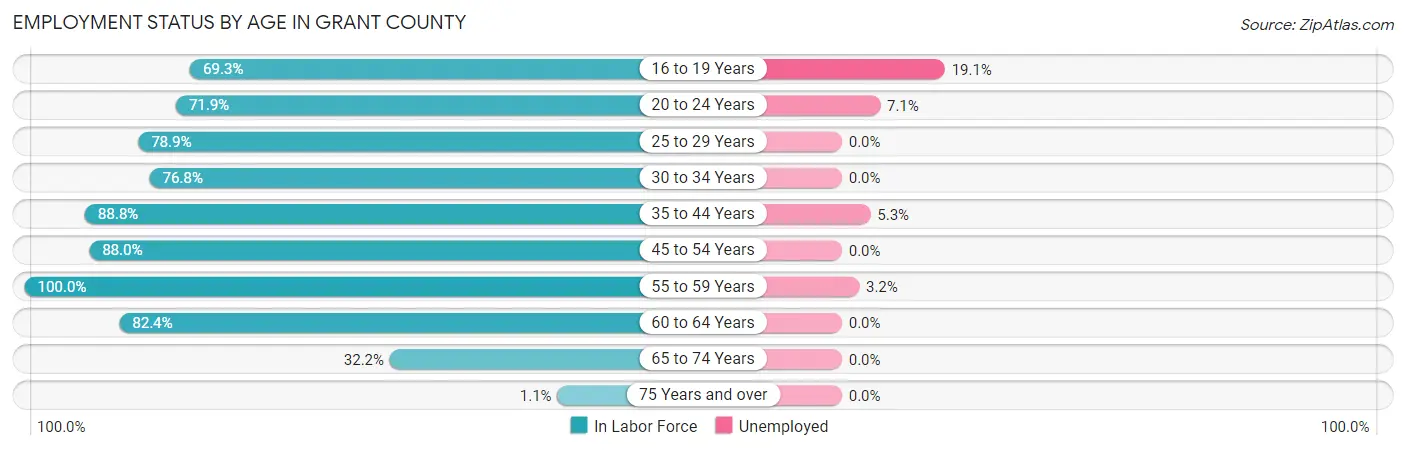
| Age Bracket | In Labor Force | Unemployed |
| 16 to 19 Years | 393 (69.3%) | 75 (19.1%) |
| 20 to 24 Years | 169 (71.9%) | 12 (7.1%) |
| 25 to 29 Years | 285 (78.9%) | 0 (0.0%) |
| 30 to 34 Years | 534 (76.8%) | 0 (0.0%) |
| 35 to 44 Years | 661 (88.8%) | 35 (5.3%) |
| 45 to 54 Years | 708 (88.0%) | 0 (0.0%) |
| 55 to 59 Years | 404 (100.0%) | 13 (3.2%) |
| 60 to 64 Years | 436 (82.4%) | 0 (0.0%) |
| 65 to 74 Years | 217 (32.2%) | 0 (0.0%) |
| 75 Years and over | 3 (1.1%) | 0 (0.0%) |
| Total | 3,810 (72.2%) | 137 (3.6%) |
Employment Status by Educational Attainment in Grant County
According to labor force statistics for Grant County, 85.6% of individuals (3,029) out of the total population between 25 and 64 years of age (3,538) are in the labor force, with 1.6% or 48 of them being unemployed. The group with the highest labor force participation rate are those with the educational attainment of college / associate degree, with 90.3% or 1,084 individuals in the labor force. Within the labor force, individuals with college / associate degree education have the highest percentage of unemployment, with 4.2% or 46 of them being unemployed.
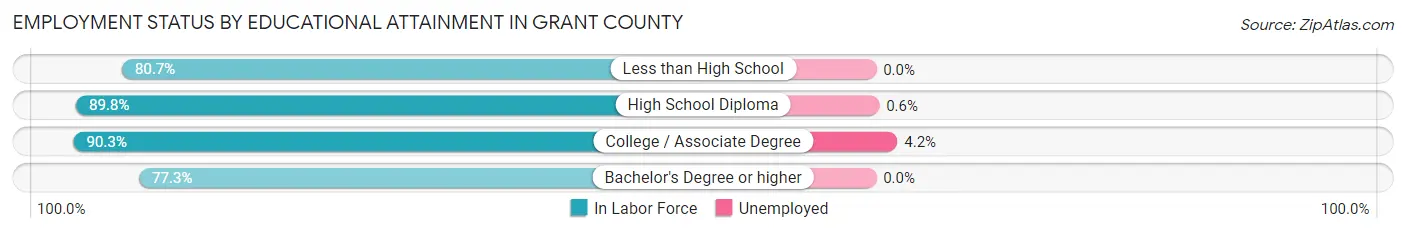
| Educational Attainment | In Labor Force | Unemployed |
| Less than High School | 643 (80.7%) | 0 (0.0%) |
| High School Diploma | 795 (89.8%) | 5 (0.6%) |
| College / Associate Degree | 1,084 (90.3%) | 50 (4.2%) |
| Bachelor's Degree or higher | 507 (77.3%) | 0 (0.0%) |
| Total | 3,029 (85.6%) | 57 (1.6%) |
Employment Occupations by Sex in Grant County
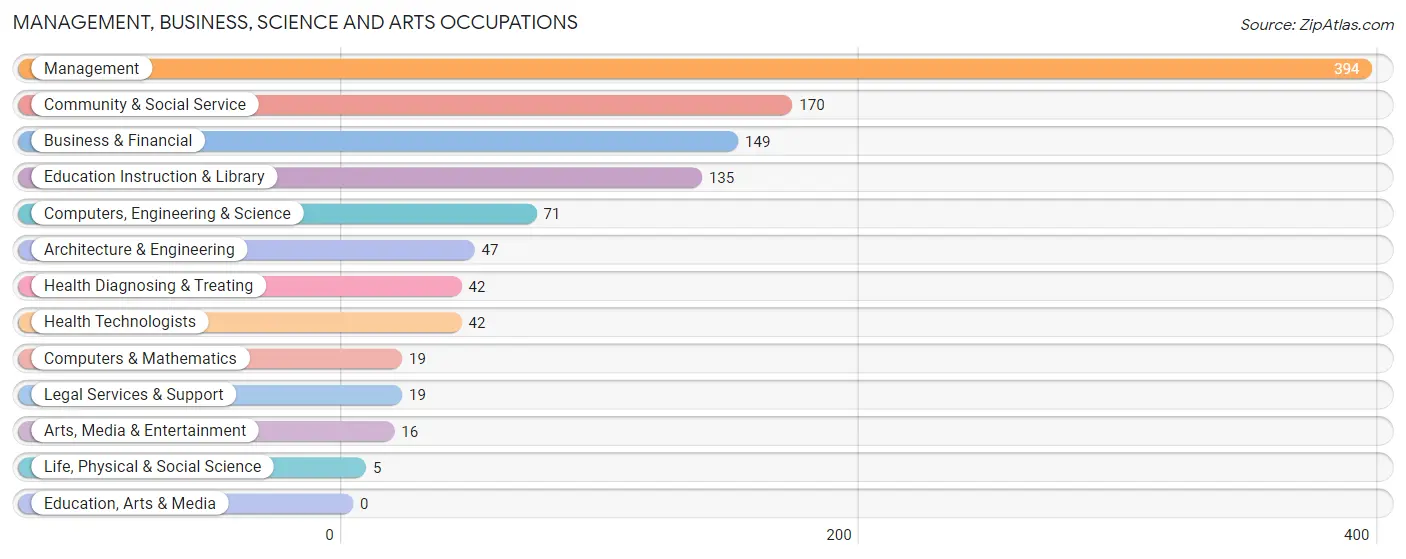
Management, Business, Science and Arts Occupations
The most common Management, Business, Science and Arts occupations in Grant County are Management (394 | 10.9%), Community & Social Service (170 | 4.7%), Business & Financial (149 | 4.1%), Education Instruction & Library (135 | 3.7%), and Computers, Engineering & Science (71 | 2.0%).
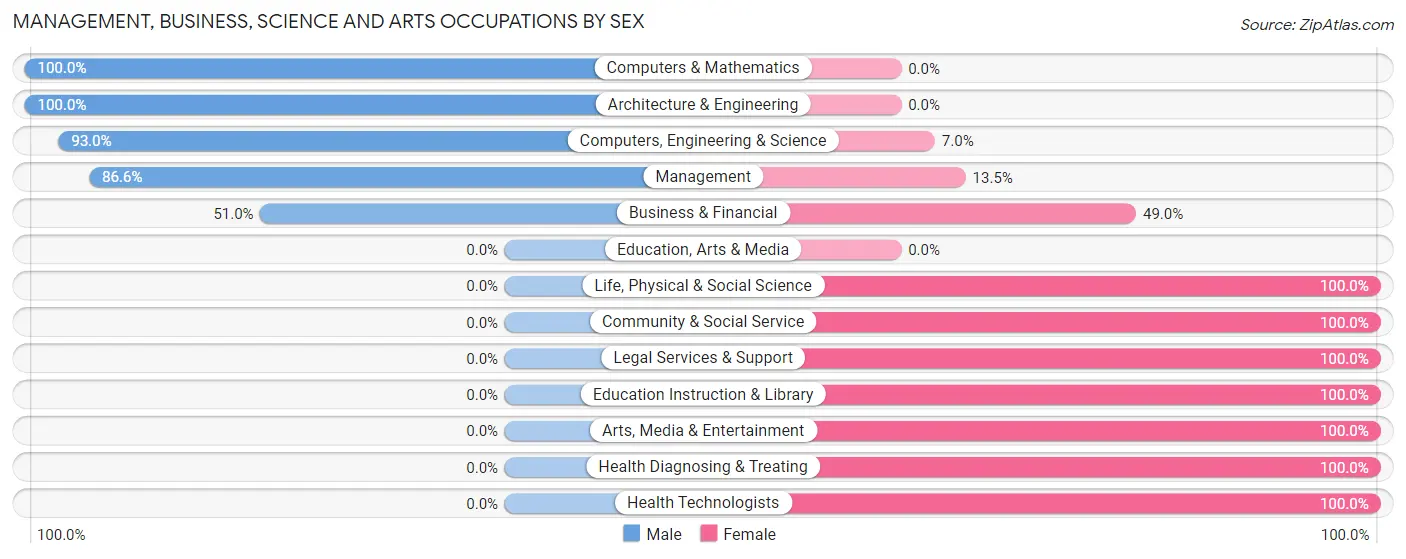
Management, Business, Science and Arts Occupations by Sex
Within the Management, Business, Science and Arts occupations in Grant County, the most male-oriented occupations are Computers & Mathematics (100.0%), Architecture & Engineering (100.0%), and Computers, Engineering & Science (93.0%), while the most female-oriented occupations are Life, Physical & Social Science (100.0%), Community & Social Service (100.0%), and Legal Services & Support (100.0%).
| Occupation | Male | Female |
| Management | 341 (86.6%) | 53 (13.5%) |
| Business & Financial | 76 (51.0%) | 73 (49.0%) |
| Computers, Engineering & Science | 66 (93.0%) | 5 (7.0%) |
| Computers & Mathematics | 19 (100.0%) | 0 (0.0%) |
| Architecture & Engineering | 47 (100.0%) | 0 (0.0%) |
| Life, Physical & Social Science | 0 (0.0%) | 5 (100.0%) |
| Community & Social Service | 0 (0.0%) | 170 (100.0%) |
| Education, Arts & Media | 0 (0.0%) | 0 (0.0%) |
| Legal Services & Support | 0 (0.0%) | 19 (100.0%) |
| Education Instruction & Library | 0 (0.0%) | 135 (100.0%) |
| Arts, Media & Entertainment | 0 (0.0%) | 16 (100.0%) |
| Health Diagnosing & Treating | 0 (0.0%) | 42 (100.0%) |
| Health Technologists | 0 (0.0%) | 42 (100.0%) |
| Total (Category) | 483 (58.5%) | 343 (41.5%) |
| Total (Overall) | 2,129 (58.9%) | 1,486 (41.1%) |
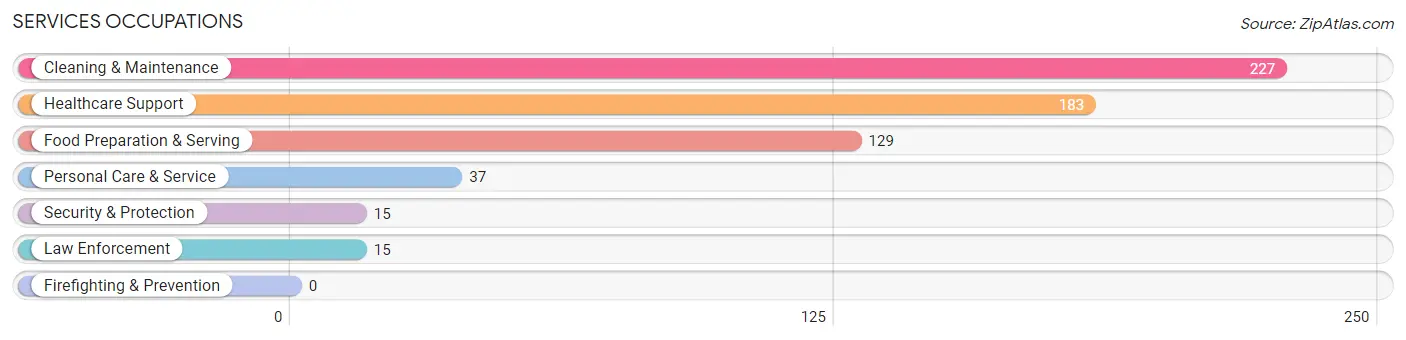
Services Occupations
The most common Services occupations in Grant County are Cleaning & Maintenance (227 | 6.3%), Healthcare Support (183 | 5.1%), Food Preparation & Serving (129 | 3.6%), Personal Care & Service (37 | 1.0%), and Security & Protection (15 | 0.4%).
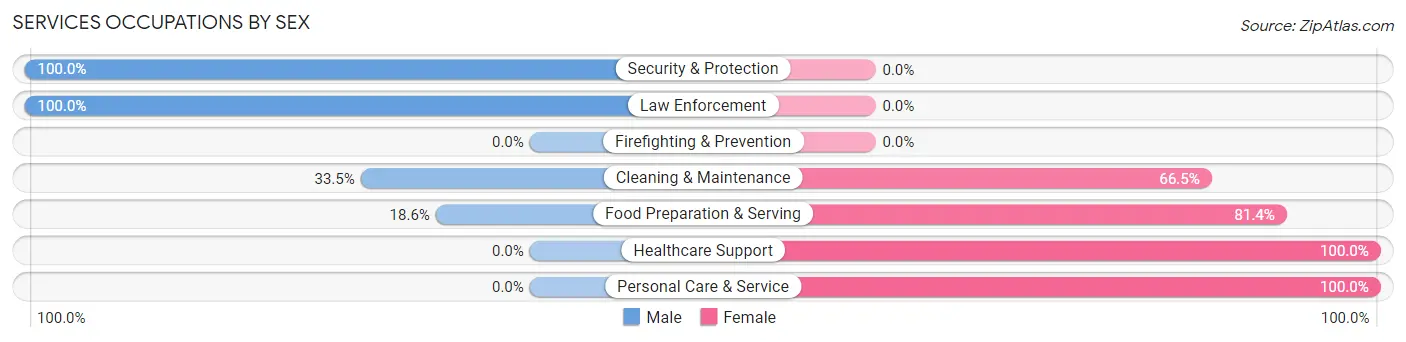
Services Occupations by Sex
Within the Services occupations in Grant County, the most male-oriented occupations are Security & Protection (100.0%), Law Enforcement (100.0%), and Cleaning & Maintenance (33.5%), while the most female-oriented occupations are Healthcare Support (100.0%), Personal Care & Service (100.0%), and Food Preparation & Serving (81.4%).
| Occupation | Male | Female |
| Healthcare Support | 0 (0.0%) | 183 (100.0%) |
| Security & Protection | 15 (100.0%) | 0 (0.0%) |
| Firefighting & Prevention | 0 (0.0%) | 0 (0.0%) |
| Law Enforcement | 15 (100.0%) | 0 (0.0%) |
| Food Preparation & Serving | 24 (18.6%) | 105 (81.4%) |
| Cleaning & Maintenance | 76 (33.5%) | 151 (66.5%) |
| Personal Care & Service | 0 (0.0%) | 37 (100.0%) |
| Total (Category) | 115 (19.5%) | 476 (80.5%) |
| Total (Overall) | 2,129 (58.9%) | 1,486 (41.1%) |
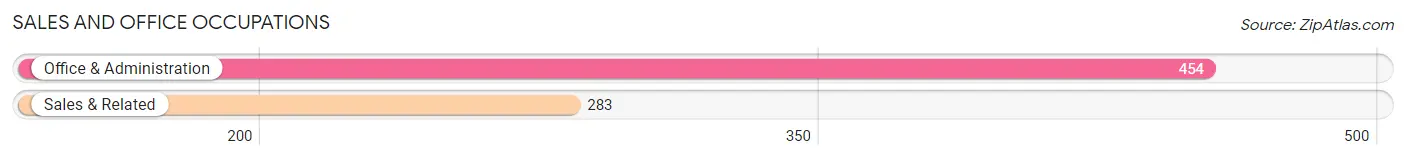
Sales and Office Occupations
The most common Sales and Office occupations in Grant County are Office & Administration (454 | 12.6%), and Sales & Related (283 | 7.8%).
Sales and Office Occupations by Sex
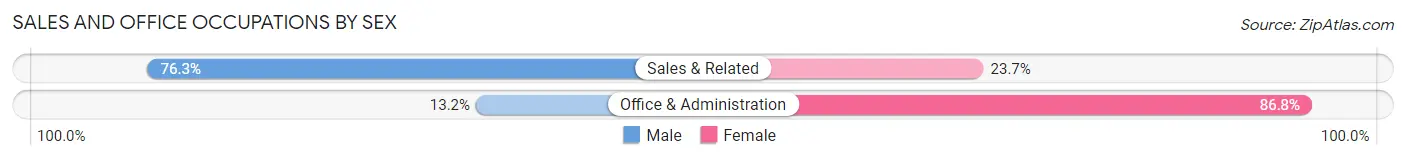
| Occupation | Male | Female |
| Sales & Related | 216 (76.3%) | 67 (23.7%) |
| Office & Administration | 60 (13.2%) | 394 (86.8%) |
| Total (Category) | 276 (37.4%) | 461 (62.5%) |
| Total (Overall) | 2,129 (58.9%) | 1,486 (41.1%) |
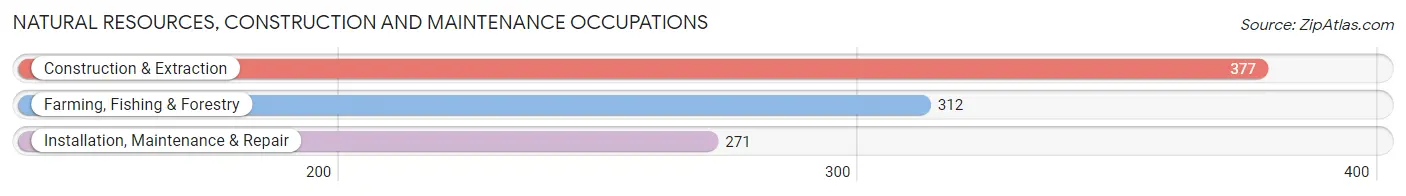
Natural Resources, Construction and Maintenance Occupations
The most common Natural Resources, Construction and Maintenance occupations in Grant County are Construction & Extraction (377 | 10.4%), Farming, Fishing & Forestry (312 | 8.6%), and Installation, Maintenance & Repair (271 | 7.5%).
Natural Resources, Construction and Maintenance Occupations by Sex
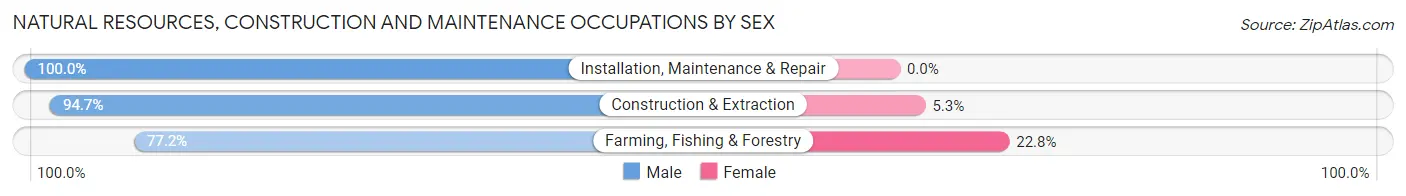
| Occupation | Male | Female |
| Farming, Fishing & Forestry | 241 (77.2%) | 71 (22.8%) |
| Construction & Extraction | 357 (94.7%) | 20 (5.3%) |
| Installation, Maintenance & Repair | 271 (100.0%) | 0 (0.0%) |
| Total (Category) | 869 (90.5%) | 91 (9.5%) |
| Total (Overall) | 2,129 (58.9%) | 1,486 (41.1%) |
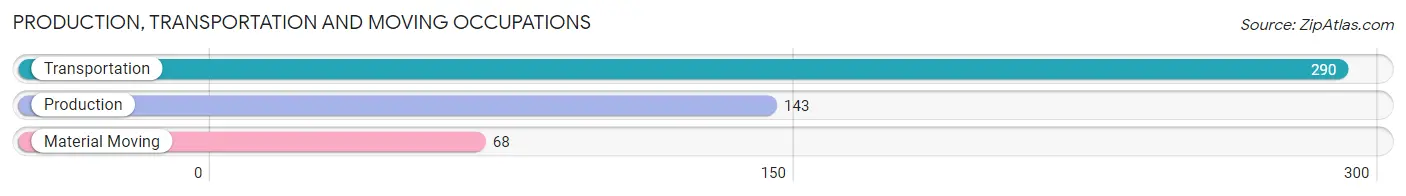
Production, Transportation and Moving Occupations
The most common Production, Transportation and Moving occupations in Grant County are Transportation (290 | 8.0%), Production (143 | 4.0%), and Material Moving (68 | 1.9%).
Production, Transportation and Moving Occupations by Sex
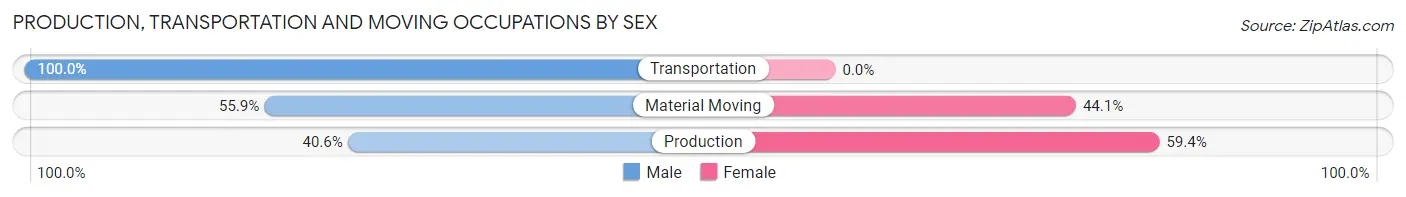
| Occupation | Male | Female |
| Production | 58 (40.6%) | 85 (59.4%) |
| Transportation | 290 (100.0%) | 0 (0.0%) |
| Material Moving | 38 (55.9%) | 30 (44.1%) |
| Total (Category) | 386 (77.0%) | 115 (23.0%) |
| Total (Overall) | 2,129 (58.9%) | 1,486 (41.1%) |
Employment Industries by Sex in Grant County
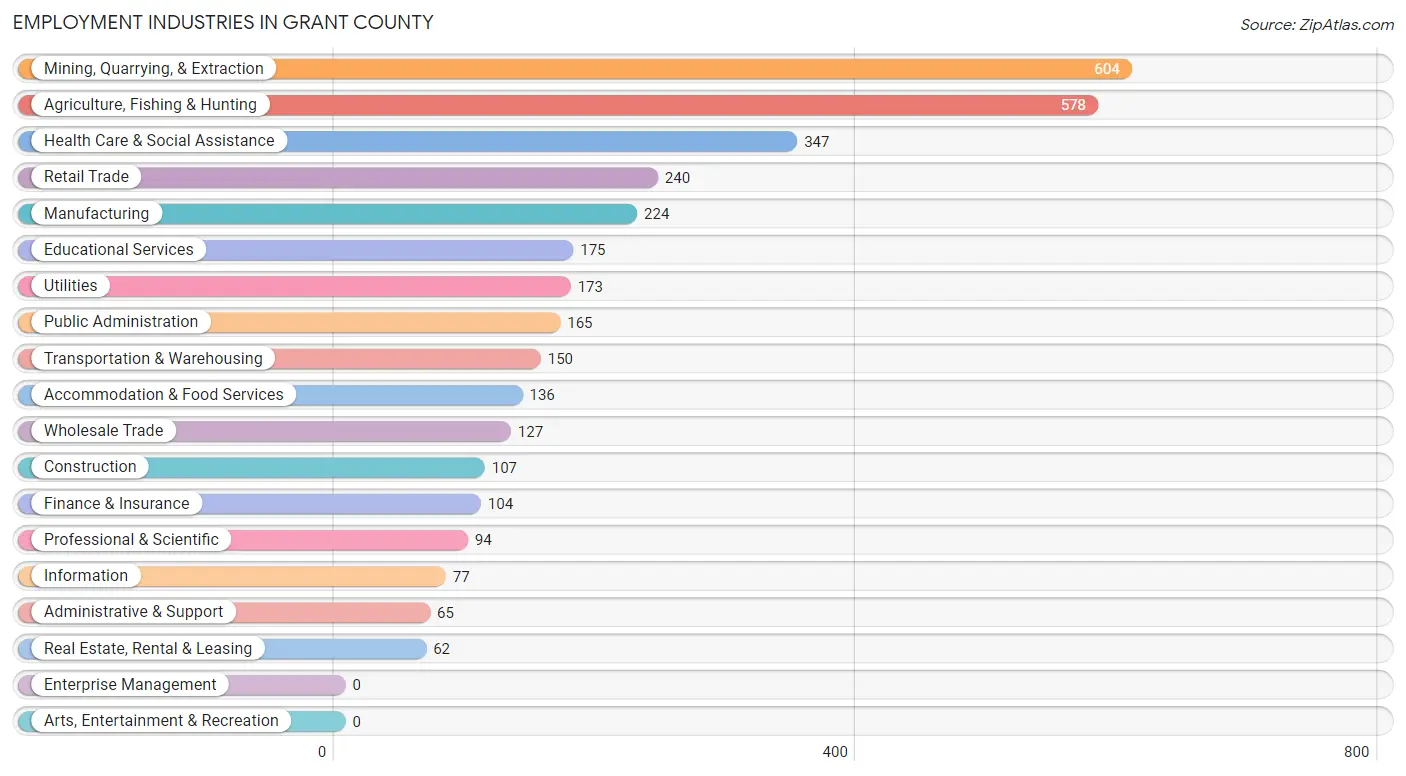
Employment Industries in Grant County
The major employment industries in Grant County include Mining, Quarrying, & Extraction (604 | 16.7%), Agriculture, Fishing & Hunting (578 | 16.0%), Health Care & Social Assistance (347 | 9.6%), Retail Trade (240 | 6.6%), and Manufacturing (224 | 6.2%).
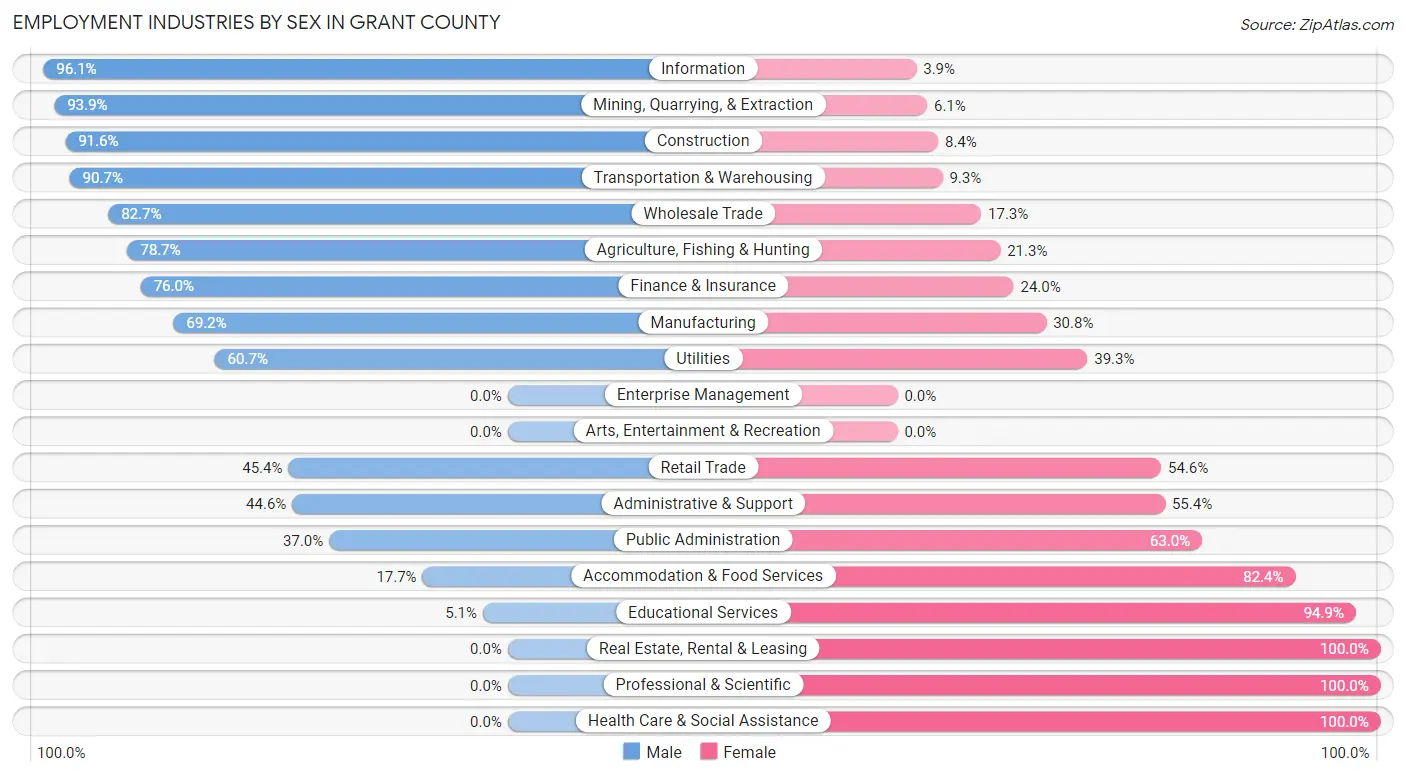
Employment Industries by Sex in Grant County
The Grant County industries that see more men than women are Information (96.1%), Mining, Quarrying, & Extraction (93.9%), and Construction (91.6%), whereas the industries that tend to have a higher number of women are Real Estate, Rental & Leasing (100.0%), Professional & Scientific (100.0%), and Health Care & Social Assistance (100.0%).
| Industry | Male | Female |
| Agriculture, Fishing & Hunting | 455 (78.7%) | 123 (21.3%) |
| Mining, Quarrying, & Extraction | 567 (93.9%) | 37 (6.1%) |
| Construction | 98 (91.6%) | 9 (8.4%) |
| Manufacturing | 155 (69.2%) | 69 (30.8%) |
| Wholesale Trade | 105 (82.7%) | 22 (17.3%) |
| Retail Trade | 109 (45.4%) | 131 (54.6%) |
| Transportation & Warehousing | 136 (90.7%) | 14 (9.3%) |
| Utilities | 105 (60.7%) | 68 (39.3%) |
| Information | 74 (96.1%) | 3 (3.9%) |
| Finance & Insurance | 79 (76.0%) | 25 (24.0%) |
| Real Estate, Rental & Leasing | 0 (0.0%) | 62 (100.0%) |
| Professional & Scientific | 0 (0.0%) | 94 (100.0%) |
| Enterprise Management | 0 (0.0%) | 0 (0.0%) |
| Administrative & Support | 29 (44.6%) | 36 (55.4%) |
| Educational Services | 9 (5.1%) | 166 (94.9%) |
| Health Care & Social Assistance | 0 (0.0%) | 347 (100.0%) |
| Arts, Entertainment & Recreation | 0 (0.0%) | 0 (0.0%) |
| Accommodation & Food Services | 24 (17.6%) | 112 (82.4%) |
| Public Administration | 61 (37.0%) | 104 (63.0%) |
| Total | 2,129 (58.9%) | 1,486 (41.1%) |
Education in Grant County
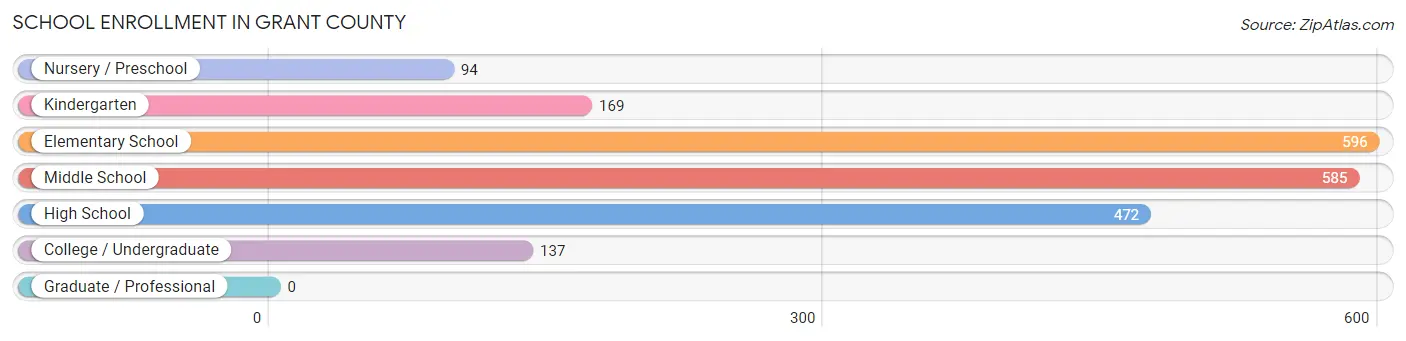
School Enrollment in Grant County
The most common levels of schooling among the 2,053 students in Grant County are elementary school (596 | 29.0%), middle school (585 | 28.5%), and high school (472 | 23.0%).
| School Level | # Students | % Students |
| Nursery / Preschool | 94 | 4.6% |
| Kindergarten | 169 | 8.2% |
| Elementary School | 596 | 29.0% |
| Middle School | 585 | 28.5% |
| High School | 472 | 23.0% |
| College / Undergraduate | 137 | 6.7% |
| Graduate / Professional | 0 | 0.0% |
| Total | 2,053 | 100.0% |
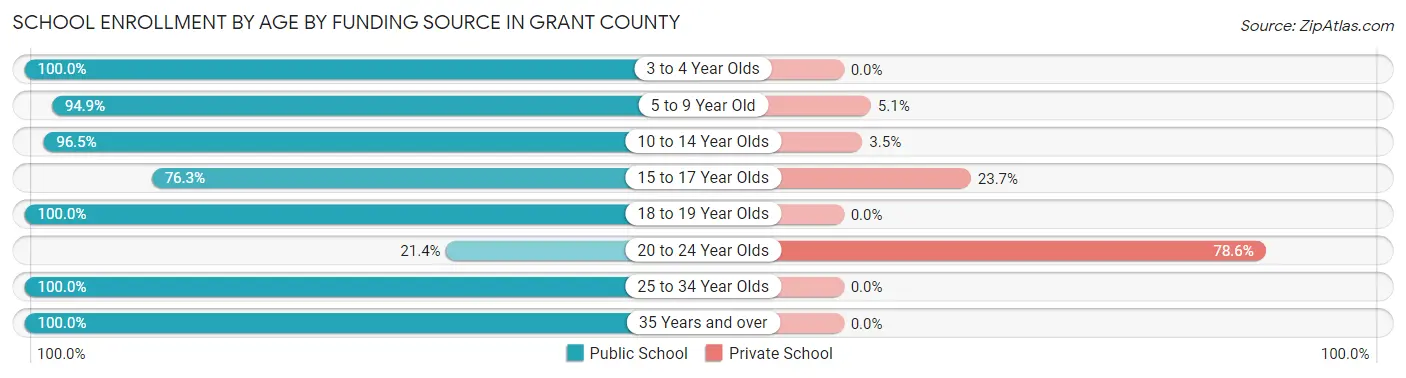
School Enrollment by Age by Funding Source in Grant County
Out of a total of 2,053 students who are enrolled in schools in Grant County, 166 (8.1%) attend a private institution, while the remaining 1,887 (91.9%) are enrolled in public schools. The age group of 20 to 24 year olds has the highest likelihood of being enrolled in private schools, with 44 (78.6% in the age bracket) enrolled. Conversely, the age group of 3 to 4 year olds has the lowest likelihood of being enrolled in a private school, with 72 (100.0% in the age bracket) attending a public institution.
| Age Bracket | Public School | Private School |
| 3 to 4 Year Olds | 72 (100.0%) | 0 (0.0%) |
| 5 to 9 Year Old | 674 (94.9%) | 36 (5.1%) |
| 10 to 14 Year Olds | 746 (96.5%) | 27 (3.5%) |
| 15 to 17 Year Olds | 190 (76.3%) | 59 (23.7%) |
| 18 to 19 Year Olds | 112 (100.0%) | 0 (0.0%) |
| 20 to 24 Year Olds | 12 (21.4%) | 44 (78.6%) |
| 25 to 34 Year Olds | 68 (100.0%) | 0 (0.0%) |
| 35 Years and over | 13 (100.0%) | 0 (0.0%) |
| Total | 1,887 (91.9%) | 166 (8.1%) |
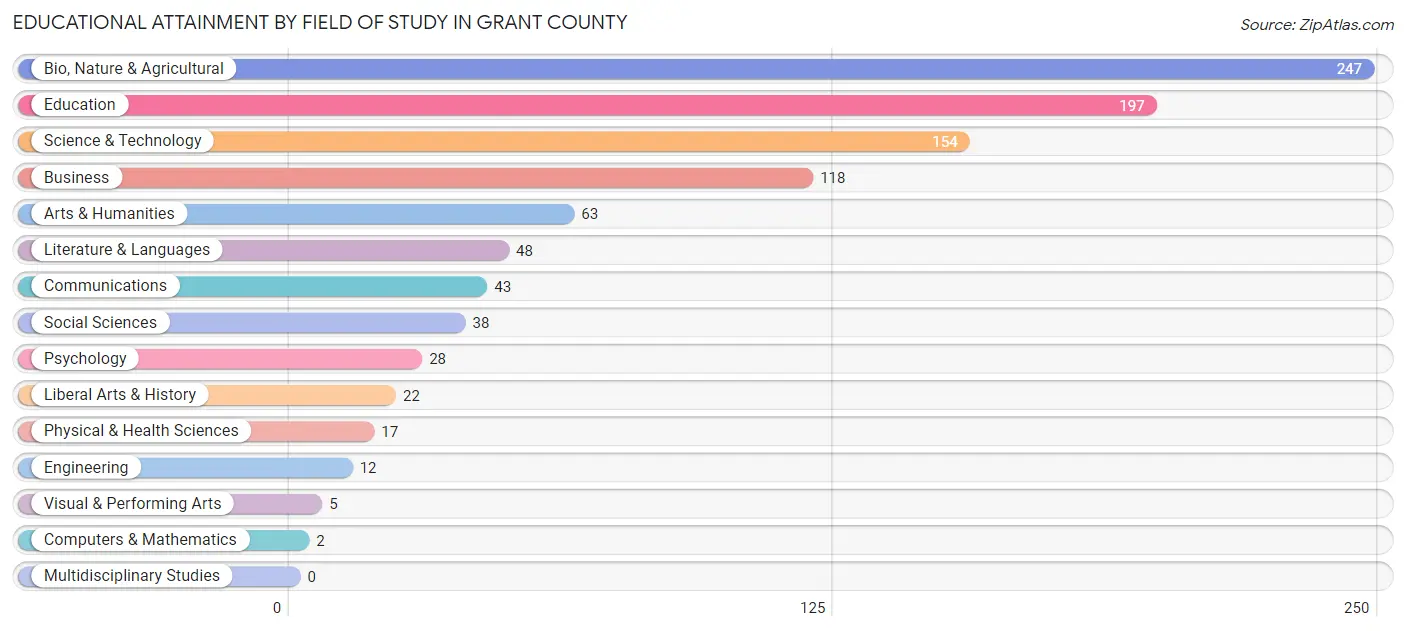
Educational Attainment by Field of Study in Grant County
Bio, nature & agricultural (247 | 24.8%), education (197 | 19.8%), science & technology (154 | 15.5%), business (118 | 11.9%), and arts & humanities (63 | 6.3%) are the most common fields of study among 994 individuals in Grant County who have obtained a bachelor's degree or higher.
| Field of Study | # Graduates | % Graduates |
| Computers & Mathematics | 2 | 0.2% |
| Bio, Nature & Agricultural | 247 | 24.8% |
| Physical & Health Sciences | 17 | 1.7% |
| Psychology | 28 | 2.8% |
| Social Sciences | 38 | 3.8% |
| Engineering | 12 | 1.2% |
| Multidisciplinary Studies | 0 | 0.0% |
| Science & Technology | 154 | 15.5% |
| Business | 118 | 11.9% |
| Education | 197 | 19.8% |
| Literature & Languages | 48 | 4.8% |
| Liberal Arts & History | 22 | 2.2% |
| Visual & Performing Arts | 5 | 0.5% |
| Communications | 43 | 4.3% |
| Arts & Humanities | 63 | 6.3% |
| Total | 994 | 100.0% |
Transportation & Commute in Grant County
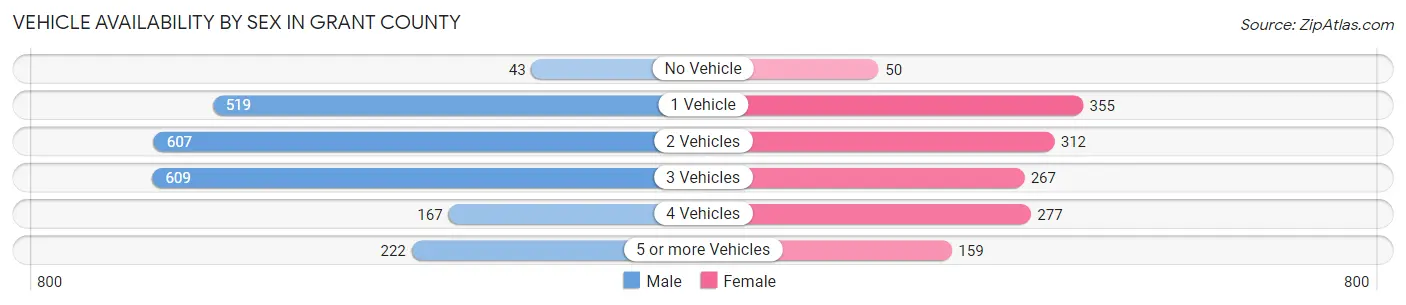
Vehicle Availability by Sex in Grant County
The most prevalent vehicle ownership categories in Grant County are males with 3 vehicles (609, accounting for 28.1%) and females with 3 vehicles (267, making up 42.9%).
| Vehicles Available | Male | Female |
| No Vehicle | 43 (2.0%) | 50 (3.5%) |
| 1 Vehicle | 519 (23.9%) | 355 (25.0%) |
| 2 Vehicles | 607 (28.0%) | 312 (22.0%) |
| 3 Vehicles | 609 (28.1%) | 267 (18.8%) |
| 4 Vehicles | 167 (7.7%) | 277 (19.5%) |
| 5 or more Vehicles | 222 (10.2%) | 159 (11.2%) |
| Total | 2,167 (100.0%) | 1,420 (100.0%) |
Commute Time in Grant County
The most frequently occuring commute durations in Grant County are 5 to 9 minutes (1,292 commuters, 38.1%), 10 to 14 minutes (676 commuters, 20.0%), and less than 5 minutes (403 commuters, 11.9%).
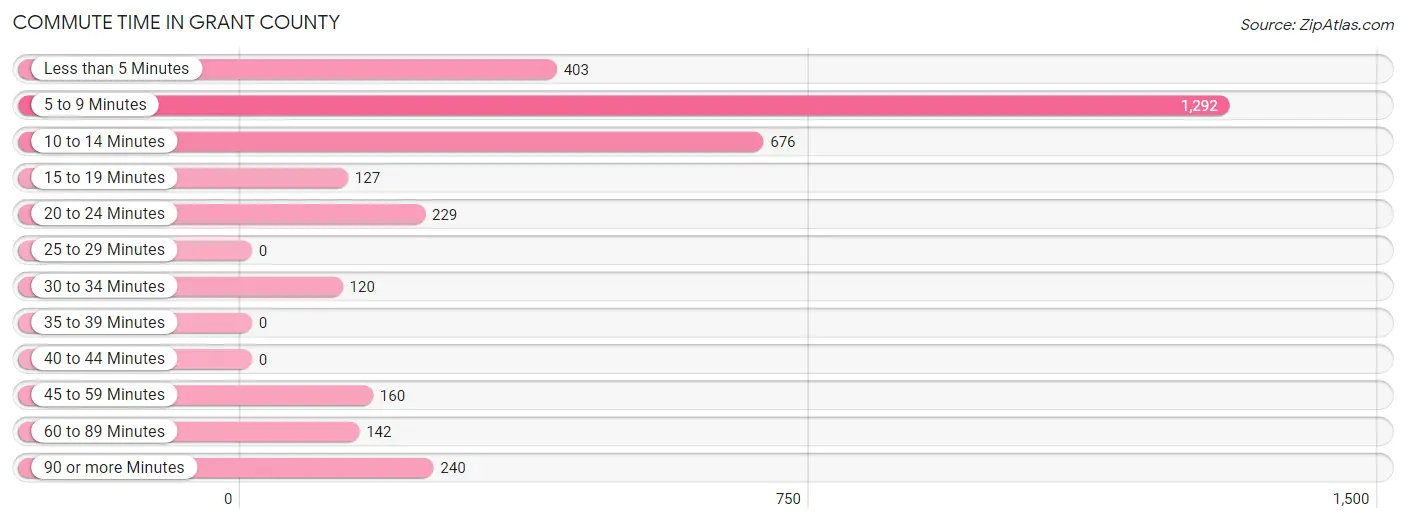
| Commute Time | # Commuters | % Commuters |
| Less than 5 Minutes | 403 | 11.9% |
| 5 to 9 Minutes | 1,292 | 38.1% |
| 10 to 14 Minutes | 676 | 20.0% |
| 15 to 19 Minutes | 127 | 3.7% |
| 20 to 24 Minutes | 229 | 6.8% |
| 25 to 29 Minutes | 0 | 0.0% |
| 30 to 34 Minutes | 120 | 3.5% |
| 35 to 39 Minutes | 0 | 0.0% |
| 40 to 44 Minutes | 0 | 0.0% |
| 45 to 59 Minutes | 160 | 4.7% |
| 60 to 89 Minutes | 142 | 4.2% |
| 90 or more Minutes | 240 | 7.1% |
Commute Time by Sex in Grant County
The most common commute times in Grant County are 5 to 9 minutes (576 commuters, 27.5%) for males and 5 to 9 minutes (716 commuters, 55.3%) for females.
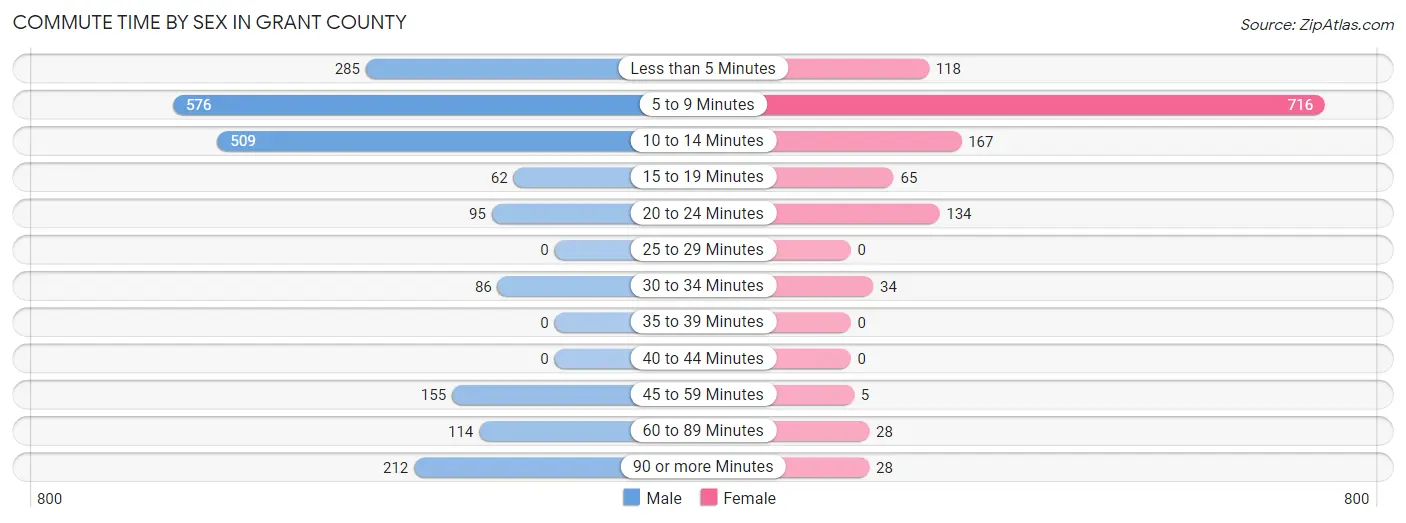
| Commute Time | Male | Female |
| Less than 5 Minutes | 285 (13.6%) | 118 (9.1%) |
| 5 to 9 Minutes | 576 (27.5%) | 716 (55.3%) |
| 10 to 14 Minutes | 509 (24.3%) | 167 (12.9%) |
| 15 to 19 Minutes | 62 (3.0%) | 65 (5.0%) |
| 20 to 24 Minutes | 95 (4.5%) | 134 (10.3%) |
| 25 to 29 Minutes | 0 (0.0%) | 0 (0.0%) |
| 30 to 34 Minutes | 86 (4.1%) | 34 (2.6%) |
| 35 to 39 Minutes | 0 (0.0%) | 0 (0.0%) |
| 40 to 44 Minutes | 0 (0.0%) | 0 (0.0%) |
| 45 to 59 Minutes | 155 (7.4%) | 5 (0.4%) |
| 60 to 89 Minutes | 114 (5.4%) | 28 (2.2%) |
| 90 or more Minutes | 212 (10.1%) | 28 (2.2%) |
Time of Departure to Work by Sex in Grant County
The most frequent times of departure to work in Grant County are 7:00 AM to 7:29 AM (357, 17.1%) for males and 7:00 AM to 7:29 AM (265, 20.5%) for females.
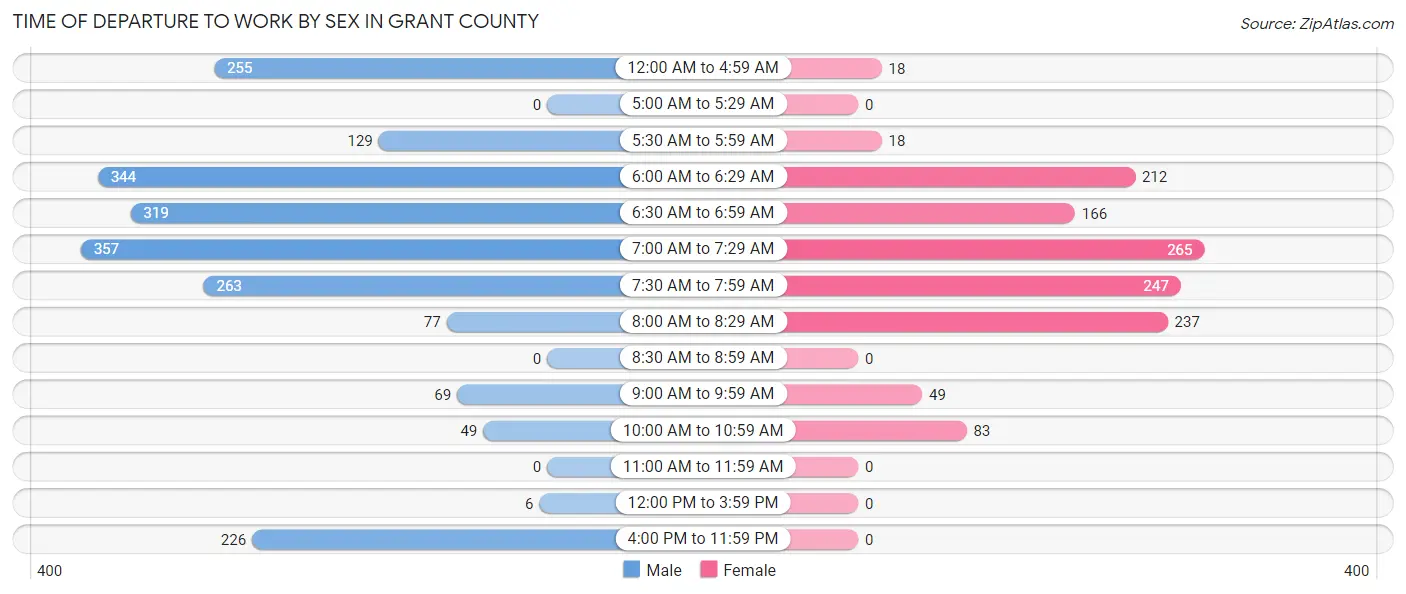
| Time of Departure | Male | Female |
| 12:00 AM to 4:59 AM | 255 (12.2%) | 18 (1.4%) |
| 5:00 AM to 5:29 AM | 0 (0.0%) | 0 (0.0%) |
| 5:30 AM to 5:59 AM | 129 (6.2%) | 18 (1.4%) |
| 6:00 AM to 6:29 AM | 344 (16.4%) | 212 (16.4%) |
| 6:30 AM to 6:59 AM | 319 (15.2%) | 166 (12.8%) |
| 7:00 AM to 7:29 AM | 357 (17.1%) | 265 (20.5%) |
| 7:30 AM to 7:59 AM | 263 (12.6%) | 247 (19.1%) |
| 8:00 AM to 8:29 AM | 77 (3.7%) | 237 (18.3%) |
| 8:30 AM to 8:59 AM | 0 (0.0%) | 0 (0.0%) |
| 9:00 AM to 9:59 AM | 69 (3.3%) | 49 (3.8%) |
| 10:00 AM to 10:59 AM | 49 (2.3%) | 83 (6.4%) |
| 11:00 AM to 11:59 AM | 0 (0.0%) | 0 (0.0%) |
| 12:00 PM to 3:59 PM | 6 (0.3%) | 0 (0.0%) |
| 4:00 PM to 11:59 PM | 226 (10.8%) | 0 (0.0%) |
| Total | 2,094 (100.0%) | 1,295 (100.0%) |
Housing Occupancy in Grant County
Occupancy by Ownership in Grant County
Of the total 2,420 dwellings in Grant County, owner-occupied units account for 1,846 (76.3%), while renter-occupied units make up 574 (23.7%).
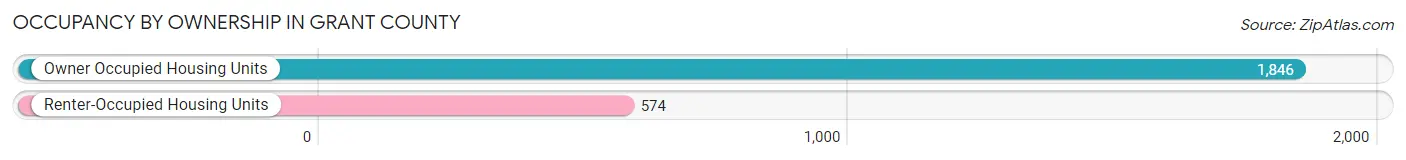
| Occupancy | # Housing Units | % Housing Units |
| Owner Occupied Housing Units | 1,846 | 76.3% |
| Renter-Occupied Housing Units | 574 | 23.7% |
| Total Occupied Housing Units | 2,420 | 100.0% |
Occupancy by Household Size in Grant County
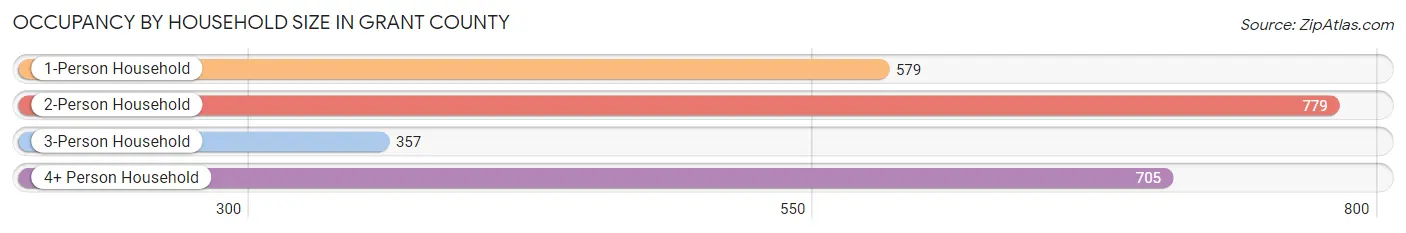
| Household Size | # Housing Units | % Housing Units |
| 1-Person Household | 579 | 23.9% |
| 2-Person Household | 779 | 32.2% |
| 3-Person Household | 357 | 14.7% |
| 4+ Person Household | 705 | 29.1% |
| Total Housing Units | 2,420 | 100.0% |
Occupancy by Ownership by Household Size in Grant County
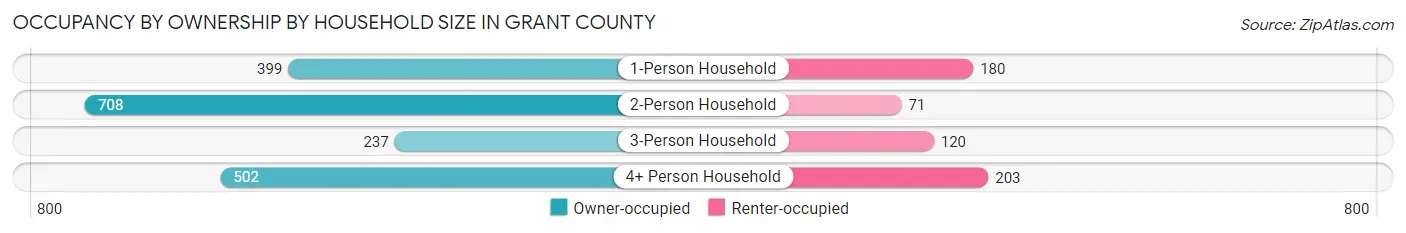
| Household Size | Owner-occupied | Renter-occupied |
| 1-Person Household | 399 (68.9%) | 180 (31.1%) |
| 2-Person Household | 708 (90.9%) | 71 (9.1%) |
| 3-Person Household | 237 (66.4%) | 120 (33.6%) |
| 4+ Person Household | 502 (71.2%) | 203 (28.8%) |
| Total Housing Units | 1,846 (76.3%) | 574 (23.7%) |
Occupancy by Educational Attainment in Grant County
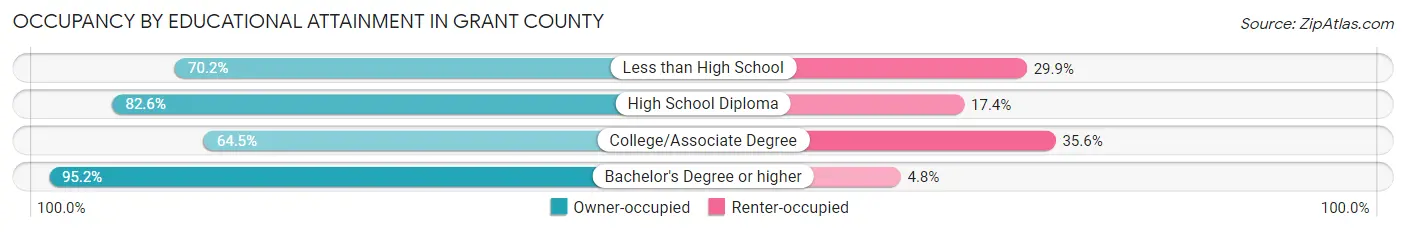
| Household Size | Owner-occupied | Renter-occupied |
| Less than High School | 503 (70.2%) | 214 (29.8%) |
| High School Diploma | 336 (82.6%) | 71 (17.4%) |
| College/Associate Degree | 475 (64.4%) | 262 (35.5%) |
| Bachelor's Degree or higher | 532 (95.2%) | 27 (4.8%) |
Occupancy by Age of Householder in Grant County
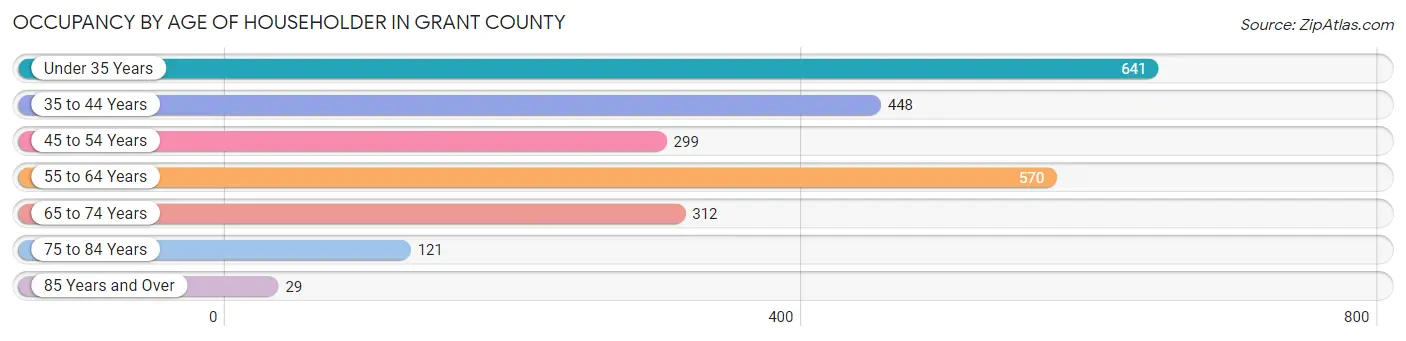
| Age Bracket | # Households | % Households |
| Under 35 Years | 641 | 26.5% |
| 35 to 44 Years | 448 | 18.5% |
| 45 to 54 Years | 299 | 12.4% |
| 55 to 64 Years | 570 | 23.5% |
| 65 to 74 Years | 312 | 12.9% |
| 75 to 84 Years | 121 | 5.0% |
| 85 Years and Over | 29 | 1.2% |
| Total | 2,420 | 100.0% |
Housing Finances in Grant County
Median Income by Occupancy in Grant County
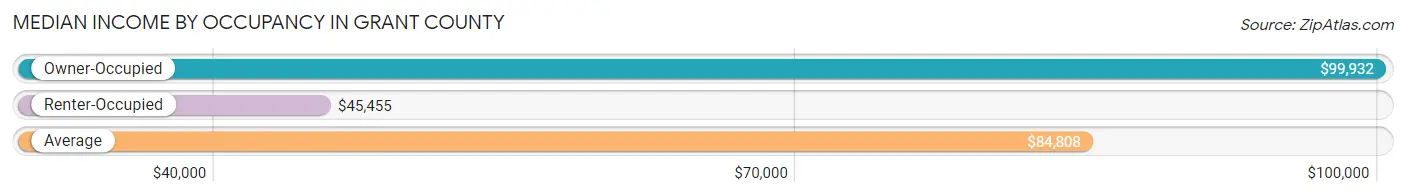
| Occupancy Type | # Households | Median Income |
| Owner-Occupied | 1,846 (76.3%) | $99,932 |
| Renter-Occupied | 574 (23.7%) | $45,455 |
| Average | 2,420 (100.0%) | $84,808 |
Occupancy by Householder Income Bracket in Grant County
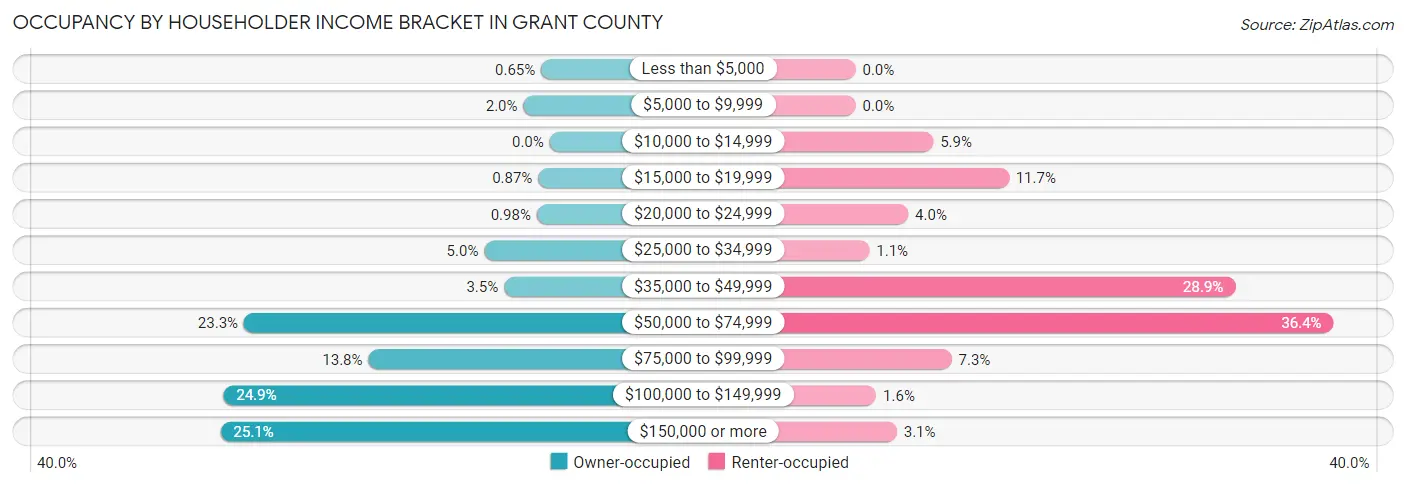
| Income Bracket | Owner-occupied | Renter-occupied |
| Less than $5,000 | 12 (0.6%) | 0 (0.0%) |
| $5,000 to $9,999 | 37 (2.0%) | 0 (0.0%) |
| $10,000 to $14,999 | 0 (0.0%) | 34 (5.9%) |
| $15,000 to $19,999 | 16 (0.9%) | 67 (11.7%) |
| $20,000 to $24,999 | 18 (1.0%) | 23 (4.0%) |
| $25,000 to $34,999 | 92 (5.0%) | 6 (1.1%) |
| $35,000 to $49,999 | 64 (3.5%) | 166 (28.9%) |
| $50,000 to $74,999 | 430 (23.3%) | 209 (36.4%) |
| $75,000 to $99,999 | 255 (13.8%) | 42 (7.3%) |
| $100,000 to $149,999 | 459 (24.9%) | 9 (1.6%) |
| $150,000 or more | 463 (25.1%) | 18 (3.1%) |
| Total | 1,846 (100.0%) | 574 (100.0%) |
Monthly Housing Cost Tiers in Grant County
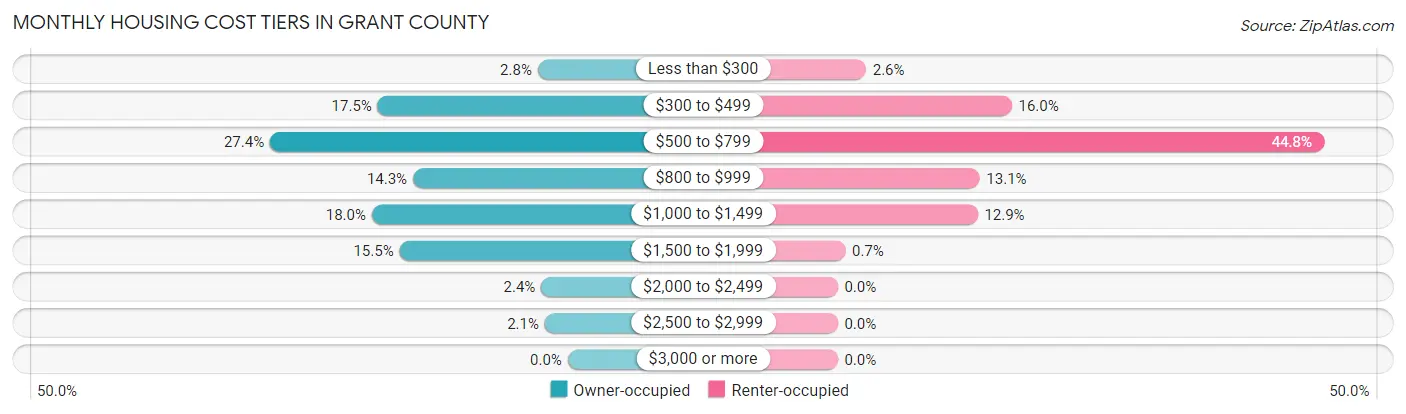
| Monthly Cost | Owner-occupied | Renter-occupied |
| Less than $300 | 51 (2.8%) | 15 (2.6%) |
| $300 to $499 | 323 (17.5%) | 92 (16.0%) |
| $500 to $799 | 506 (27.4%) | 257 (44.8%) |
| $800 to $999 | 263 (14.2%) | 75 (13.1%) |
| $1,000 to $1,499 | 333 (18.0%) | 74 (12.9%) |
| $1,500 to $1,999 | 286 (15.5%) | 4 (0.7%) |
| $2,000 to $2,499 | 45 (2.4%) | 0 (0.0%) |
| $2,500 to $2,999 | 39 (2.1%) | 0 (0.0%) |
| $3,000 or more | 0 (0.0%) | 0 (0.0%) |
| Total | 1,846 (100.0%) | 574 (100.0%) |
Physical Housing Characteristics in Grant County
Housing Structures in Grant County
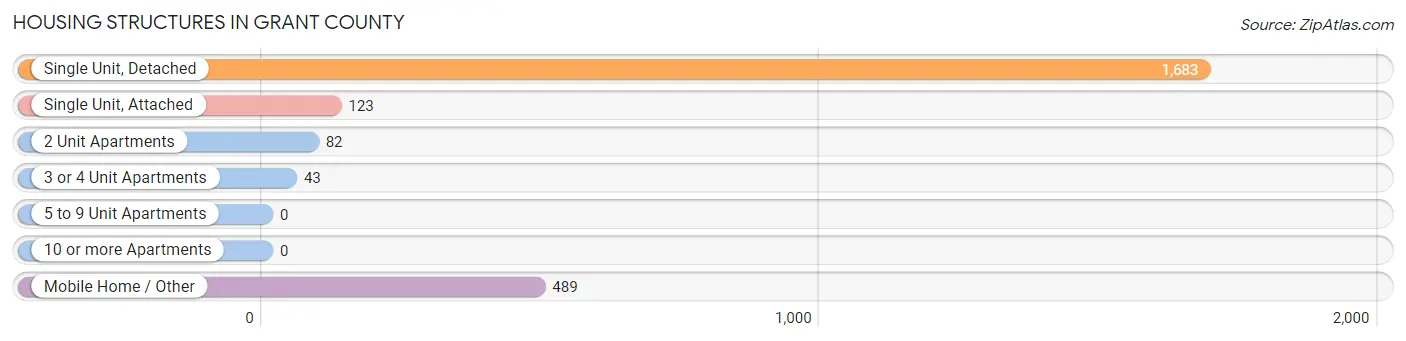
| Structure Type | # Housing Units | % Housing Units |
| Single Unit, Detached | 1,683 | 69.6% |
| Single Unit, Attached | 123 | 5.1% |
| 2 Unit Apartments | 82 | 3.4% |
| 3 or 4 Unit Apartments | 43 | 1.8% |
| 5 to 9 Unit Apartments | 0 | 0.0% |
| 10 or more Apartments | 0 | 0.0% |
| Mobile Home / Other | 489 | 20.2% |
| Total | 2,420 | 100.0% |
Housing Structures by Occupancy in Grant County
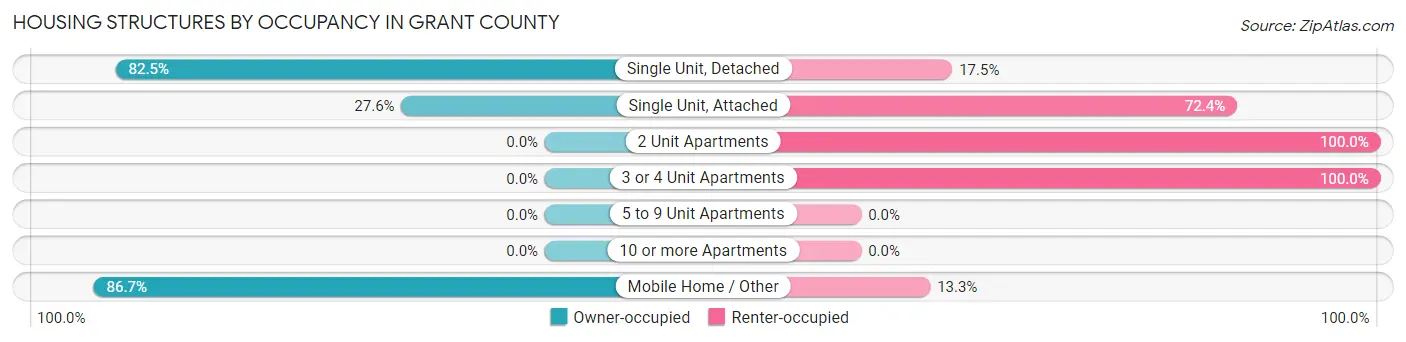
| Structure Type | Owner-occupied | Renter-occupied |
| Single Unit, Detached | 1,388 (82.5%) | 295 (17.5%) |
| Single Unit, Attached | 34 (27.6%) | 89 (72.4%) |
| 2 Unit Apartments | 0 (0.0%) | 82 (100.0%) |
| 3 or 4 Unit Apartments | 0 (0.0%) | 43 (100.0%) |
| 5 to 9 Unit Apartments | 0 (0.0%) | 0 (0.0%) |
| 10 or more Apartments | 0 (0.0%) | 0 (0.0%) |
| Mobile Home / Other | 424 (86.7%) | 65 (13.3%) |
| Total | 1,846 (76.3%) | 574 (23.7%) |
Housing Structures by Number of Rooms in Grant County
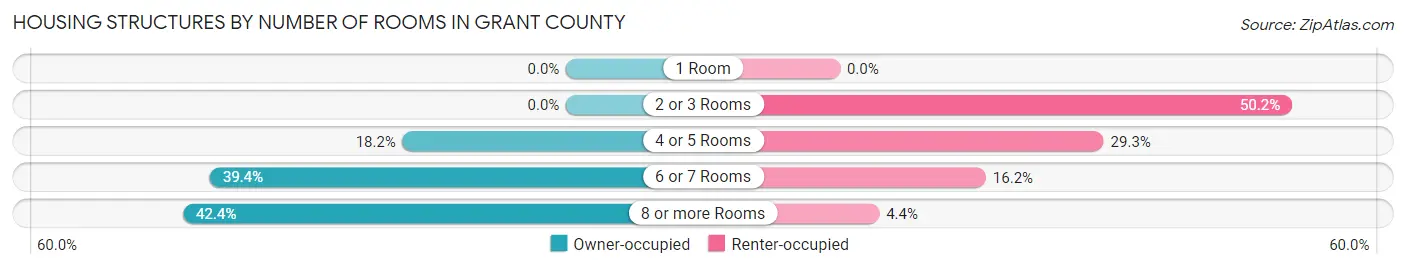
| Number of Rooms | Owner-occupied | Renter-occupied |
| 1 Room | 0 (0.0%) | 0 (0.0%) |
| 2 or 3 Rooms | 0 (0.0%) | 288 (50.2%) |
| 4 or 5 Rooms | 335 (18.1%) | 168 (29.3%) |
| 6 or 7 Rooms | 728 (39.4%) | 93 (16.2%) |
| 8 or more Rooms | 783 (42.4%) | 25 (4.4%) |
| Total | 1,846 (100.0%) | 574 (100.0%) |
Housing Structure by Heating Type in Grant County
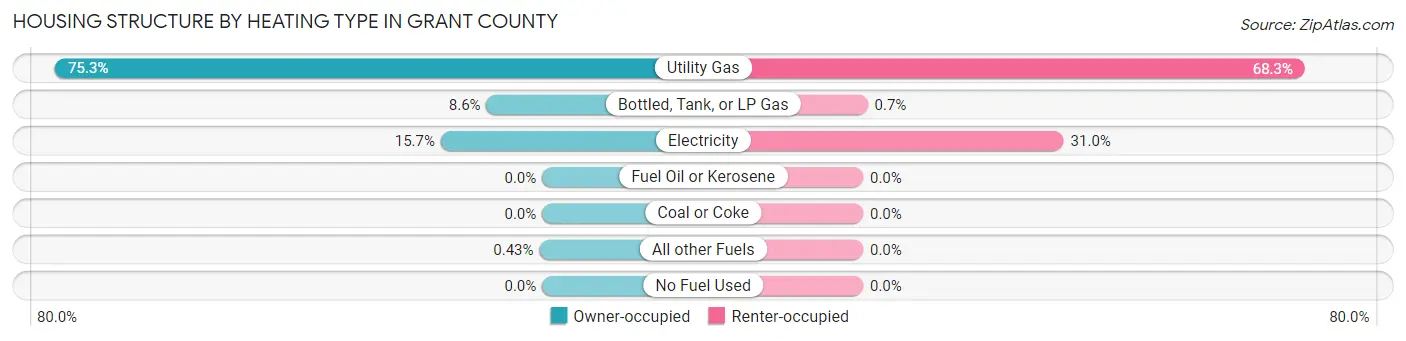
| Heating Type | Owner-occupied | Renter-occupied |
| Utility Gas | 1,390 (75.3%) | 392 (68.3%) |
| Bottled, Tank, or LP Gas | 159 (8.6%) | 4 (0.7%) |
| Electricity | 289 (15.7%) | 178 (31.0%) |
| Fuel Oil or Kerosene | 0 (0.0%) | 0 (0.0%) |
| Coal or Coke | 0 (0.0%) | 0 (0.0%) |
| All other Fuels | 8 (0.4%) | 0 (0.0%) |
| No Fuel Used | 0 (0.0%) | 0 (0.0%) |
| Total | 1,846 (100.0%) | 574 (100.0%) |
Household Vehicle Usage in Grant County
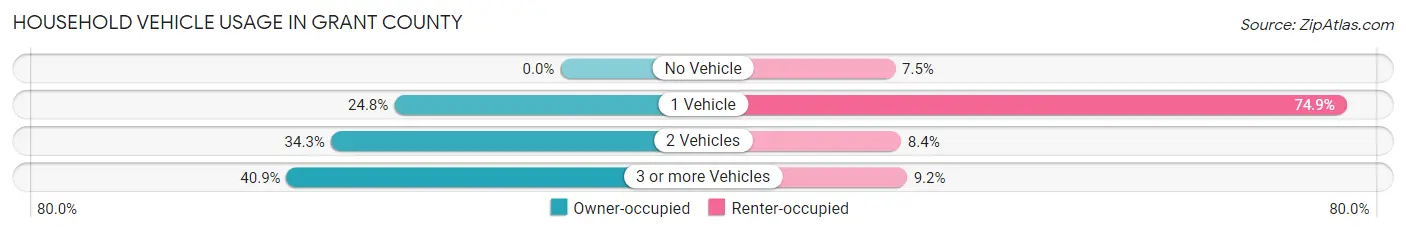
| Vehicles per Household | Owner-occupied | Renter-occupied |
| No Vehicle | 0 (0.0%) | 43 (7.5%) |
| 1 Vehicle | 458 (24.8%) | 430 (74.9%) |
| 2 Vehicles | 633 (34.3%) | 48 (8.4%) |
| 3 or more Vehicles | 755 (40.9%) | 53 (9.2%) |
| Total | 1,846 (100.0%) | 574 (100.0%) |
Real Estate & Mortgages in Grant County
Real Estate and Mortgage Overview in Grant County
| Characteristic | Without Mortgage | With Mortgage |
| Housing Units | 929 | 917 |
| Median Property Value | $161,300 | $137,900 |
| Median Household Income | $91,393 | $334 |
| Monthly Housing Costs | $552 | $0 |
| Real Estate Taxes | $1,801 | $5 |
Property Value by Mortgage Status in Grant County
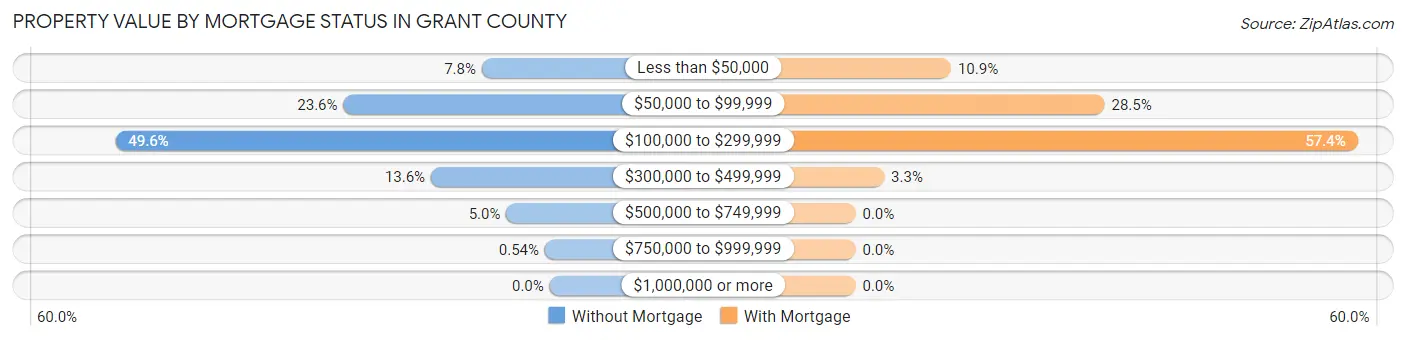
| Property Value | Without Mortgage | With Mortgage |
| Less than $50,000 | 72 (7.7%) | 100 (10.9%) |
| $50,000 to $99,999 | 219 (23.6%) | 261 (28.5%) |
| $100,000 to $299,999 | 461 (49.6%) | 526 (57.4%) |
| $300,000 to $499,999 | 126 (13.6%) | 30 (3.3%) |
| $500,000 to $749,999 | 46 (5.0%) | 0 (0.0%) |
| $750,000 to $999,999 | 5 (0.5%) | 0 (0.0%) |
| $1,000,000 or more | 0 (0.0%) | 0 (0.0%) |
| Total | 929 (100.0%) | 917 (100.0%) |
Household Income by Mortgage Status in Grant County
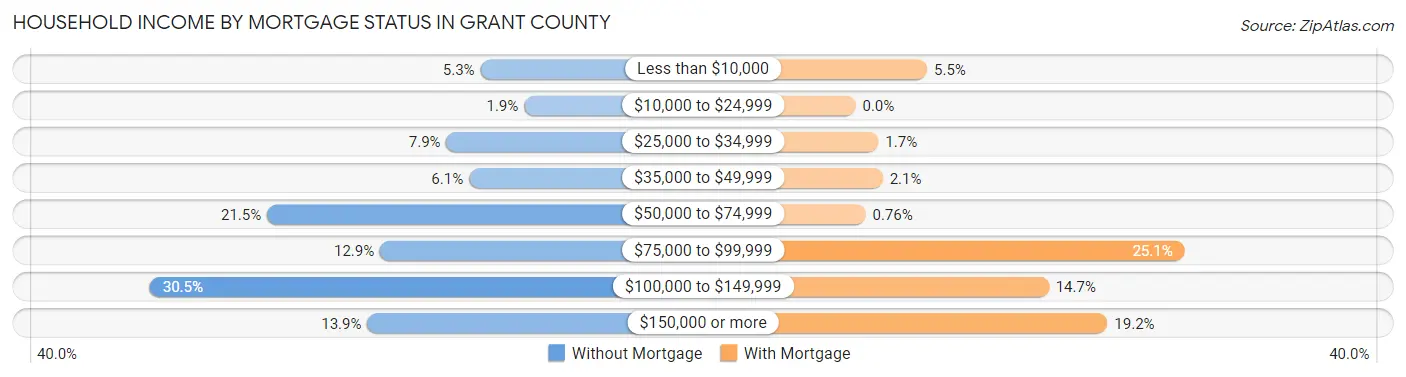
| Household Income | Without Mortgage | With Mortgage |
| Less than $10,000 | 49 (5.3%) | 50 (5.4%) |
| $10,000 to $24,999 | 18 (1.9%) | 0 (0.0%) |
| $25,000 to $34,999 | 73 (7.9%) | 16 (1.7%) |
| $35,000 to $49,999 | 57 (6.1%) | 19 (2.1%) |
| $50,000 to $74,999 | 200 (21.5%) | 7 (0.8%) |
| $75,000 to $99,999 | 120 (12.9%) | 230 (25.1%) |
| $100,000 to $149,999 | 283 (30.5%) | 135 (14.7%) |
| $150,000 or more | 129 (13.9%) | 176 (19.2%) |
| Total | 929 (100.0%) | 917 (100.0%) |
Property Value to Household Income Ratio in Grant County
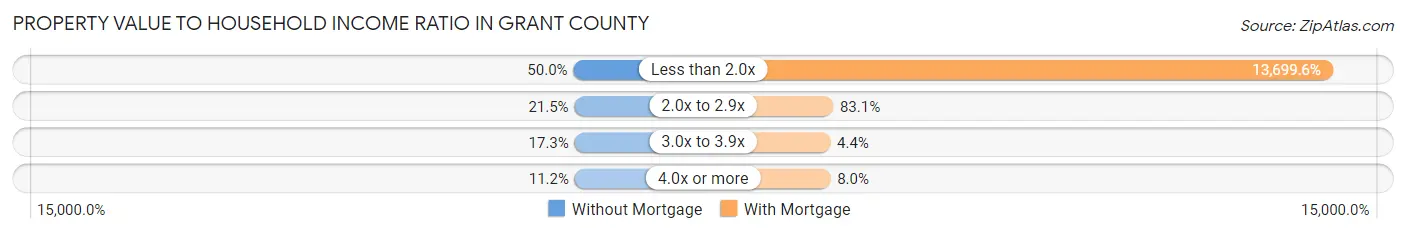
| Value-to-Income Ratio | Without Mortgage | With Mortgage |
| Less than 2.0x | 464 (49.9%) | 125,625 (13,699.6%) |
| 2.0x to 2.9x | 200 (21.5%) | 762 (83.1%) |
| 3.0x to 3.9x | 161 (17.3%) | 40 (4.4%) |
| 4.0x or more | 104 (11.2%) | 73 (8.0%) |
| Total | 929 (100.0%) | 917 (100.0%) |
Real Estate Taxes by Mortgage Status in Grant County
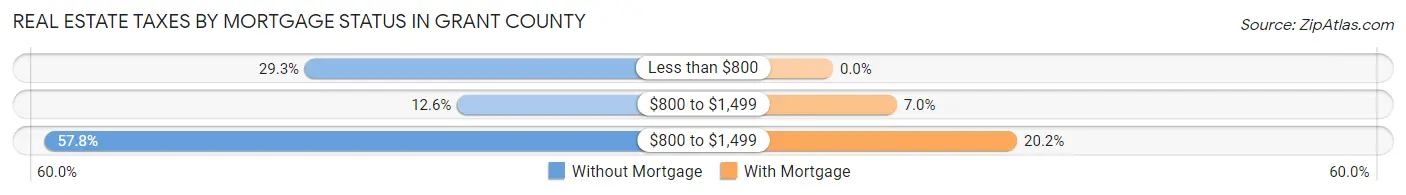
| Property Taxes | Without Mortgage | With Mortgage |
| Less than $800 | 272 (29.3%) | 0 (0.0%) |
| $800 to $1,499 | 117 (12.6%) | 64 (7.0%) |
| $800 to $1,499 | 537 (57.8%) | 185 (20.2%) |
| Total | 929 (100.0%) | 917 (100.0%) |
Health & Disability in Grant County
Health Insurance Coverage by Age in Grant County
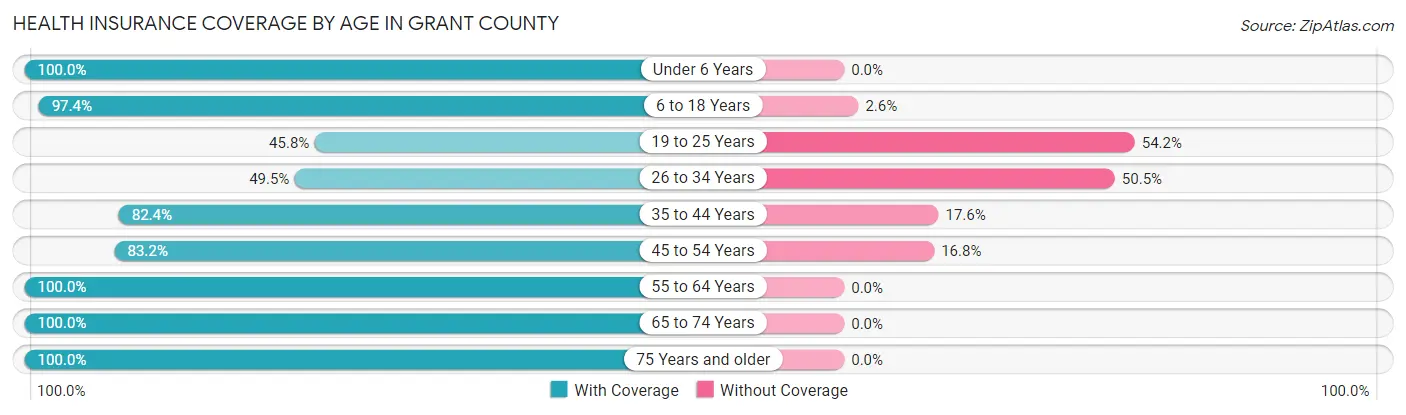
| Age Bracket | With Coverage | Without Coverage |
| Under 6 Years | 683 (100.0%) | 0 (0.0%) |
| 6 to 18 Years | 1,696 (97.4%) | 46 (2.6%) |
| 19 to 25 Years | 203 (45.8%) | 240 (54.2%) |
| 26 to 34 Years | 486 (49.5%) | 495 (50.5%) |
| 35 to 44 Years | 605 (82.4%) | 129 (17.6%) |
| 45 to 54 Years | 670 (83.2%) | 135 (16.8%) |
| 55 to 64 Years | 933 (100.0%) | 0 (0.0%) |
| 65 to 74 Years | 667 (100.0%) | 0 (0.0%) |
| 75 Years and older | 225 (100.0%) | 0 (0.0%) |
| Total | 6,168 (85.5%) | 1,045 (14.5%) |
Health Insurance Coverage by Citizenship Status in Grant County
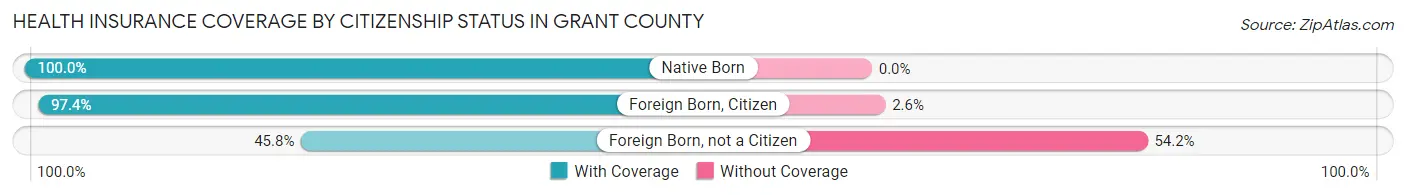
| Citizenship Status | With Coverage | Without Coverage |
| Native Born | 683 (100.0%) | 0 (0.0%) |
| Foreign Born, Citizen | 1,696 (97.4%) | 46 (2.6%) |
| Foreign Born, not a Citizen | 203 (45.8%) | 240 (54.2%) |
Health Insurance Coverage by Household Income in Grant County
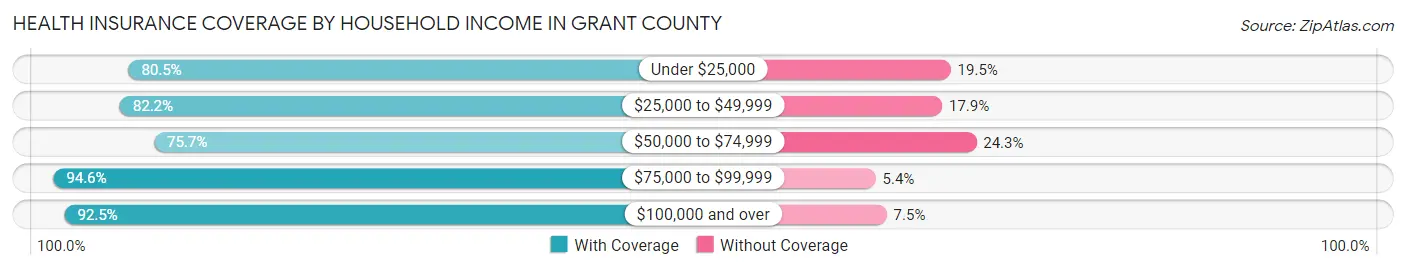
| Household Income | With Coverage | Without Coverage |
| Under $25,000 | 385 (80.5%) | 93 (19.5%) |
| $25,000 to $49,999 | 755 (82.2%) | 164 (17.8%) |
| $50,000 to $74,999 | 1,698 (75.7%) | 544 (24.3%) |
| $75,000 to $99,999 | 1,052 (94.6%) | 60 (5.4%) |
| $100,000 and over | 2,278 (92.5%) | 184 (7.5%) |
Public vs Private Health Insurance Coverage by Age in Grant County
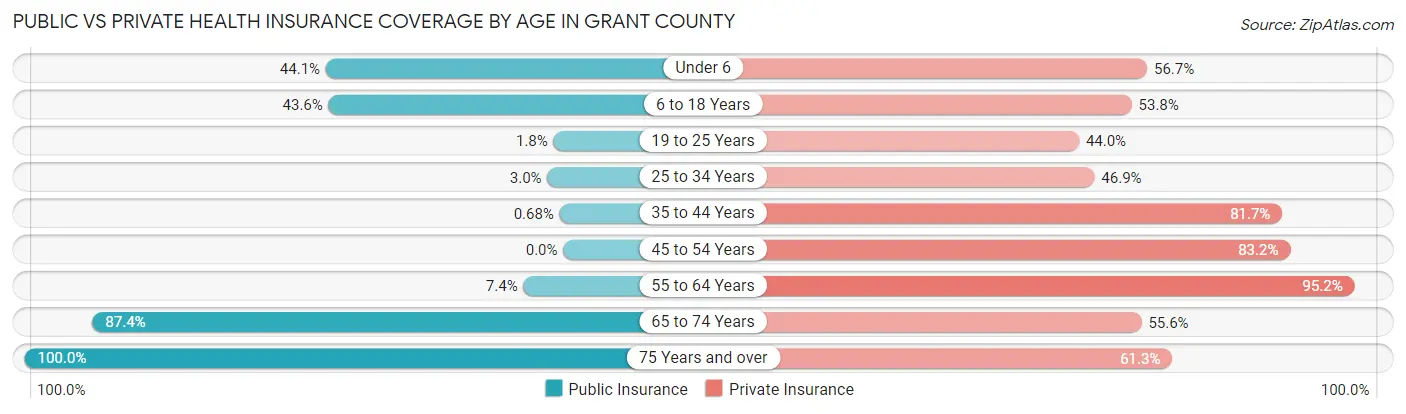
| Age Bracket | Public Insurance | Private Insurance |
| Under 6 | 301 (44.1%) | 387 (56.7%) |
| 6 to 18 Years | 759 (43.6%) | 937 (53.8%) |
| 19 to 25 Years | 8 (1.8%) | 195 (44.0%) |
| 25 to 34 Years | 29 (3.0%) | 460 (46.9%) |
| 35 to 44 Years | 5 (0.7%) | 600 (81.7%) |
| 45 to 54 Years | 0 (0.0%) | 670 (83.2%) |
| 55 to 64 Years | 69 (7.4%) | 888 (95.2%) |
| 65 to 74 Years | 583 (87.4%) | 371 (55.6%) |
| 75 Years and over | 225 (100.0%) | 138 (61.3%) |
| Total | 1,979 (27.4%) | 4,646 (64.4%) |
Disability Status by Sex by Age in Grant County
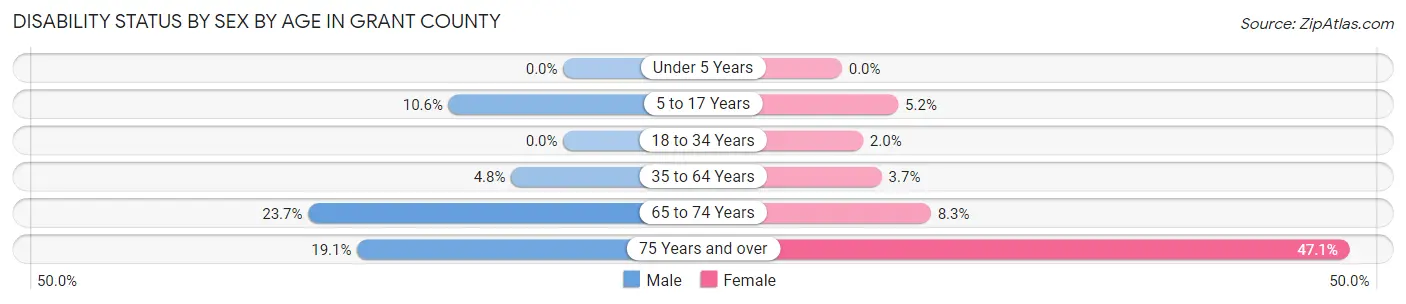
| Age Bracket | Male | Female |
| Under 5 Years | 0 (0.0%) | 0 (0.0%) |
| 5 to 17 Years | 111 (10.6%) | 37 (5.2%) |
| 18 to 34 Years | 0 (0.0%) | 14 (2.0%) |
| 35 to 64 Years | 62 (4.8%) | 44 (3.7%) |
| 65 to 74 Years | 89 (23.7%) | 24 (8.3%) |
| 75 Years and over | 13 (19.1%) | 74 (47.1%) |
Disability Class by Sex by Age in Grant County
Disability Class: Hearing Difficulty
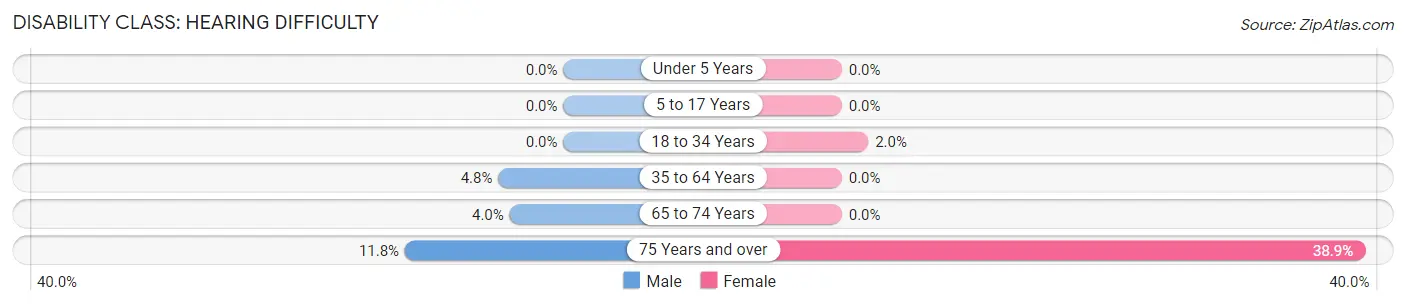
| Age Bracket | Male | Female |
| Under 5 Years | 0 (0.0%) | 0 (0.0%) |
| 5 to 17 Years | 0 (0.0%) | 0 (0.0%) |
| 18 to 34 Years | 0 (0.0%) | 14 (2.0%) |
| 35 to 64 Years | 62 (4.8%) | 0 (0.0%) |
| 65 to 74 Years | 15 (4.0%) | 0 (0.0%) |
| 75 Years and over | 8 (11.8%) | 61 (38.9%) |
Disability Class: Vision Difficulty
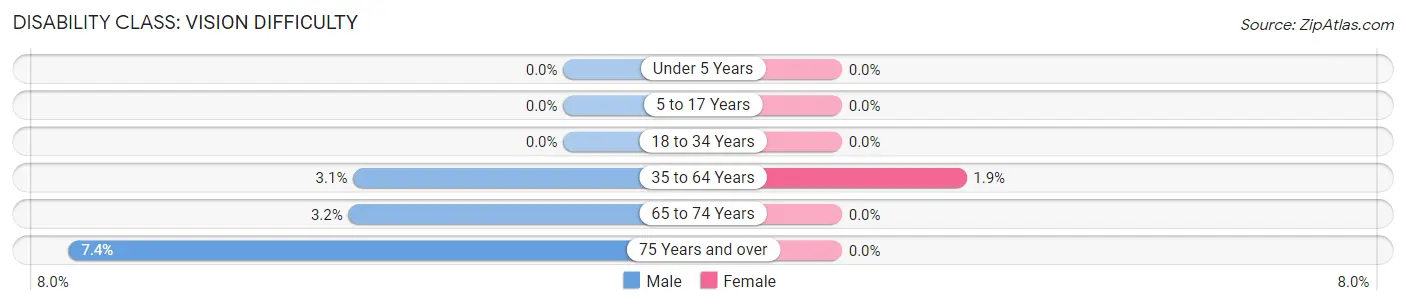
| Age Bracket | Male | Female |
| Under 5 Years | 0 (0.0%) | 0 (0.0%) |
| 5 to 17 Years | 0 (0.0%) | 0 (0.0%) |
| 18 to 34 Years | 0 (0.0%) | 0 (0.0%) |
| 35 to 64 Years | 40 (3.1%) | 22 (1.8%) |
| 65 to 74 Years | 12 (3.2%) | 0 (0.0%) |
| 75 Years and over | 5 (7.3%) | 0 (0.0%) |
Disability Class: Cognitive Difficulty
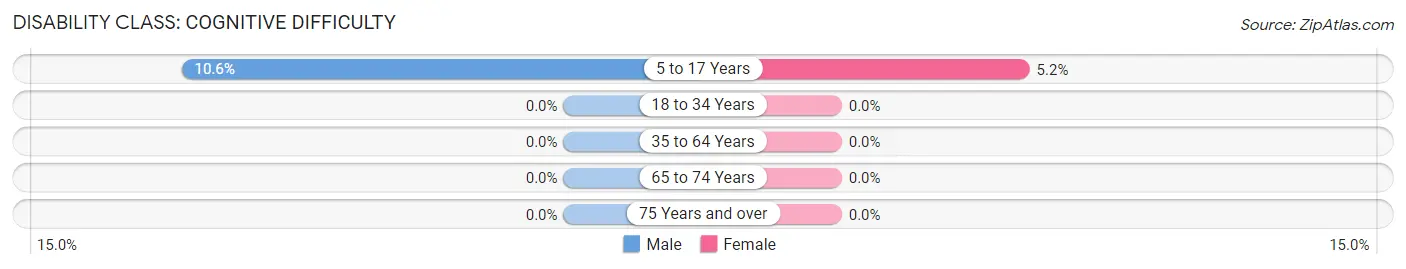
| Age Bracket | Male | Female |
| 5 to 17 Years | 111 (10.6%) | 37 (5.2%) |
| 18 to 34 Years | 0 (0.0%) | 0 (0.0%) |
| 35 to 64 Years | 0 (0.0%) | 0 (0.0%) |
| 65 to 74 Years | 0 (0.0%) | 0 (0.0%) |
| 75 Years and over | 0 (0.0%) | 0 (0.0%) |
Disability Class: Ambulatory Difficulty
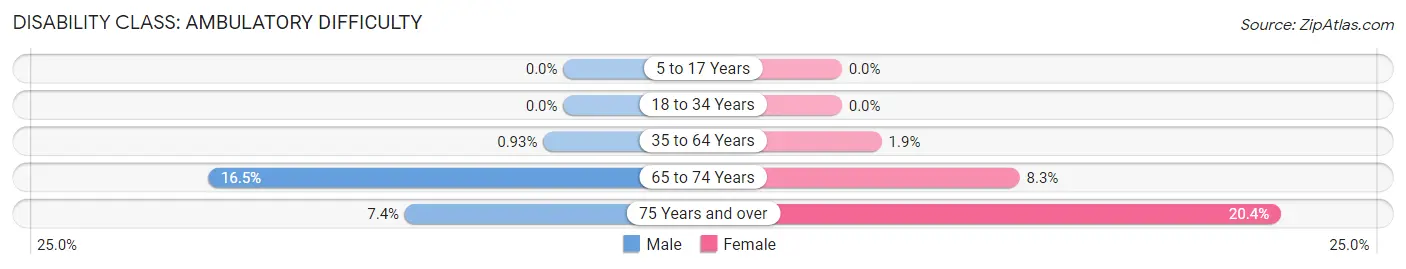
| Age Bracket | Male | Female |
| 5 to 17 Years | 0 (0.0%) | 0 (0.0%) |
| 18 to 34 Years | 0 (0.0%) | 0 (0.0%) |
| 35 to 64 Years | 12 (0.9%) | 22 (1.8%) |
| 65 to 74 Years | 62 (16.5%) | 24 (8.3%) |
| 75 Years and over | 5 (7.3%) | 32 (20.4%) |
Disability Class: Self-Care Difficulty
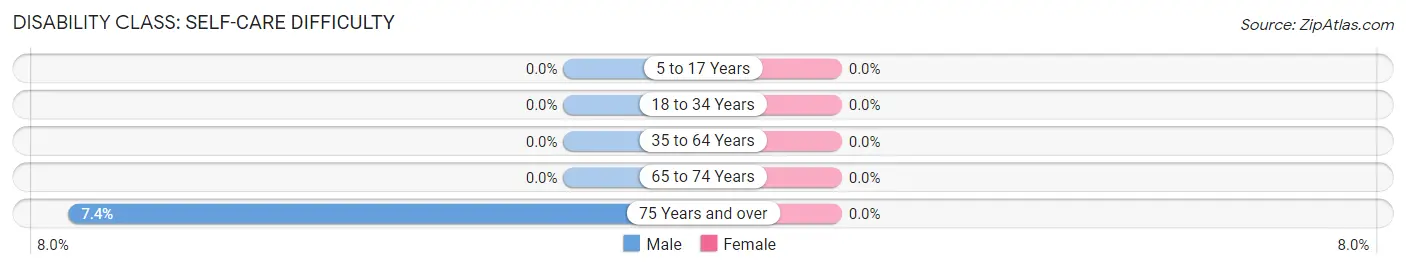
| Age Bracket | Male | Female |
| 5 to 17 Years | 0 (0.0%) | 0 (0.0%) |
| 18 to 34 Years | 0 (0.0%) | 0 (0.0%) |
| 35 to 64 Years | 0 (0.0%) | 0 (0.0%) |
| 65 to 74 Years | 0 (0.0%) | 0 (0.0%) |
| 75 Years and over | 5 (7.3%) | 0 (0.0%) |
Technology Access in Grant County
Computing Device Access in Grant County
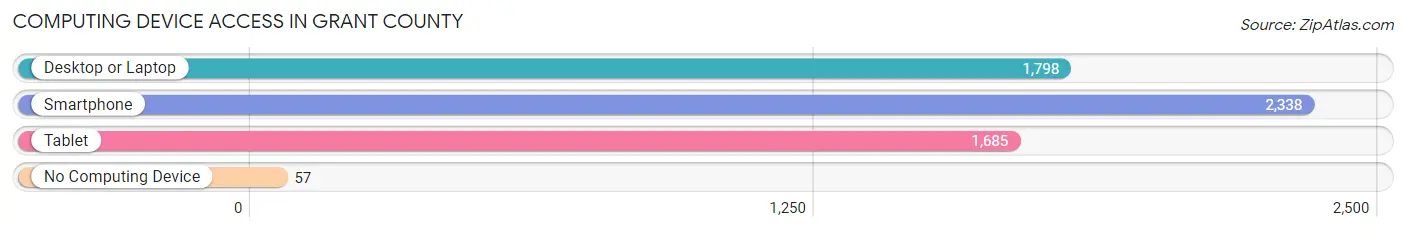
| Device Type | # Households | % Households |
| Desktop or Laptop | 1,798 | 74.3% |
| Smartphone | 2,338 | 96.6% |
| Tablet | 1,685 | 69.6% |
| No Computing Device | 57 | 2.4% |
| Total | 2,420 | 100.0% |
Internet Access in Grant County
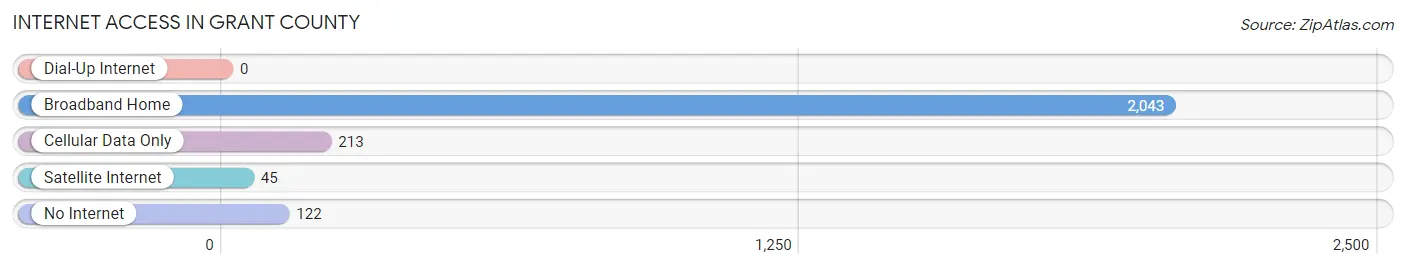
| Internet Type | # Households | % Households |
| Dial-Up Internet | 0 | 0.0% |
| Broadband Home | 2,043 | 84.4% |
| Cellular Data Only | 213 | 8.8% |
| Satellite Internet | 45 | 1.9% |
| No Internet | 122 | 5.0% |
| Total | 2,420 | 100.0% |
Grant County Summary
County History
Grant County, Kansas is located in the southwestern corner of the state and is bordered by Oklahoma to the south and Colorado to the west. The county was established in 1887 and was named after Ulysses S. Grant, the 18th President of the United States. The county was originally part of the Cherokee Outlet, which was opened to settlement in 1893.
The first settlers in Grant County were mostly farmers and ranchers, who were attracted to the area by its fertile soil and abundant water resources. The county was also home to several Native American tribes, including the Cheyenne, Arapaho, Kiowa, and Comanche.
The county seat is Ulysses, which was founded in 1887 and named after President Grant. The city was originally a stop on the Santa Fe Trail and was an important trading post for the area.
The county has a rich agricultural history, with wheat, corn, and sorghum being the primary crops. Cattle ranching was also an important industry in the county, and the area was home to several large ranches.
The county has also been home to several notable people, including former Kansas Governor John W. Carlin, who was born in Ulysses in 1936.
Geography
Grant County is located in the southwestern corner of Kansas and is bordered by Oklahoma to the south and Colorado to the west. The county covers an area of 1,072 square miles and is the fifth largest county in the state.
The county is mostly flat, with some rolling hills in the western part of the county. The Arkansas River runs through the county, and there are several small lakes and reservoirs in the area.
The climate in Grant County is semi-arid, with hot summers and cold winters. The average annual precipitation is about 18 inches.
Economy
The economy of Grant County is largely based on agriculture. Wheat, corn, and sorghum are the primary crops, and cattle ranching is also an important industry.
The county is also home to several manufacturing companies, including a plastics plant and a food processing plant.
The county has a low unemployment rate and a median household income of 45 000
Demographics
As of the 2010 census, Grant County had a population of 6,717. The population is mostly white (94.3%), with small percentages of African American (2.2%), Native American (1.2%), and Hispanic (1.1%) residents.
The median age in the county is 38.7 years, and the median household income is $45,000. The poverty rate is 11.3%.
Conclusion
Grant County, Kansas is a rural county located in the southwestern corner of the state. The county has a rich agricultural history and is home to several Native American tribes. The economy is largely based on agriculture, and the county has a low unemployment rate and a median household income of $45,000. The population is mostly white, with small percentages of African American, Native American, and Hispanic residents.
Common Questions
What is Per Capita Income in Grant County?
Per Capita income in Grant County is $36,280.
What is the Median Family Income in Grant County?
Median Family Income in Grant County is $87,601.
What is the Median Household income in Grant County?
Median Household Income in Grant County is $84,808.
What is Income or Wage Gap in Grant County?
Income or Wage Gap in Grant County is 45.4%.
Women in Grant County earn 54.6 cents for every dollar earned by a man.
What is Inequality or Gini Index in Grant County?
Inequality or Gini Index in Grant County is 0.39.
What is the Total Population of Grant County?
Total Population of Grant County is 7,336.
What is the Total Male Population of Grant County?
Total Male Population of Grant County is 4,087.
What is the Total Female Population of Grant County?
Total Female Population of Grant County is 3,249.
What is the Ratio of Males per 100 Females in Grant County?
There are 125.79 Males per 100 Females in Grant County.
What is the Ratio of Females per 100 Males in Grant County?
There are 79.50 Females per 100 Males in Grant County.
What is the Median Population Age in Grant County?
Median Population Age in Grant County is 32.9 Years.
What is the Average Family Size in Grant County
Average Family Size in Grant County is 3.7 People.
What is the Average Household Size in Grant County
Average Household Size in Grant County is 3.0 People.
How Large is the Labor Force in Grant County?
There are 3,810 People in the Labor Forcein in Grant County.
What is the Percentage of People in the Labor Force in Grant County?
72.2% of People are in the Labor Force in Grant County.
What is the Unemployment Rate in Grant County?
Unemployment Rate in Grant County is 3.6%.