Graham County, KS Map & Demographics
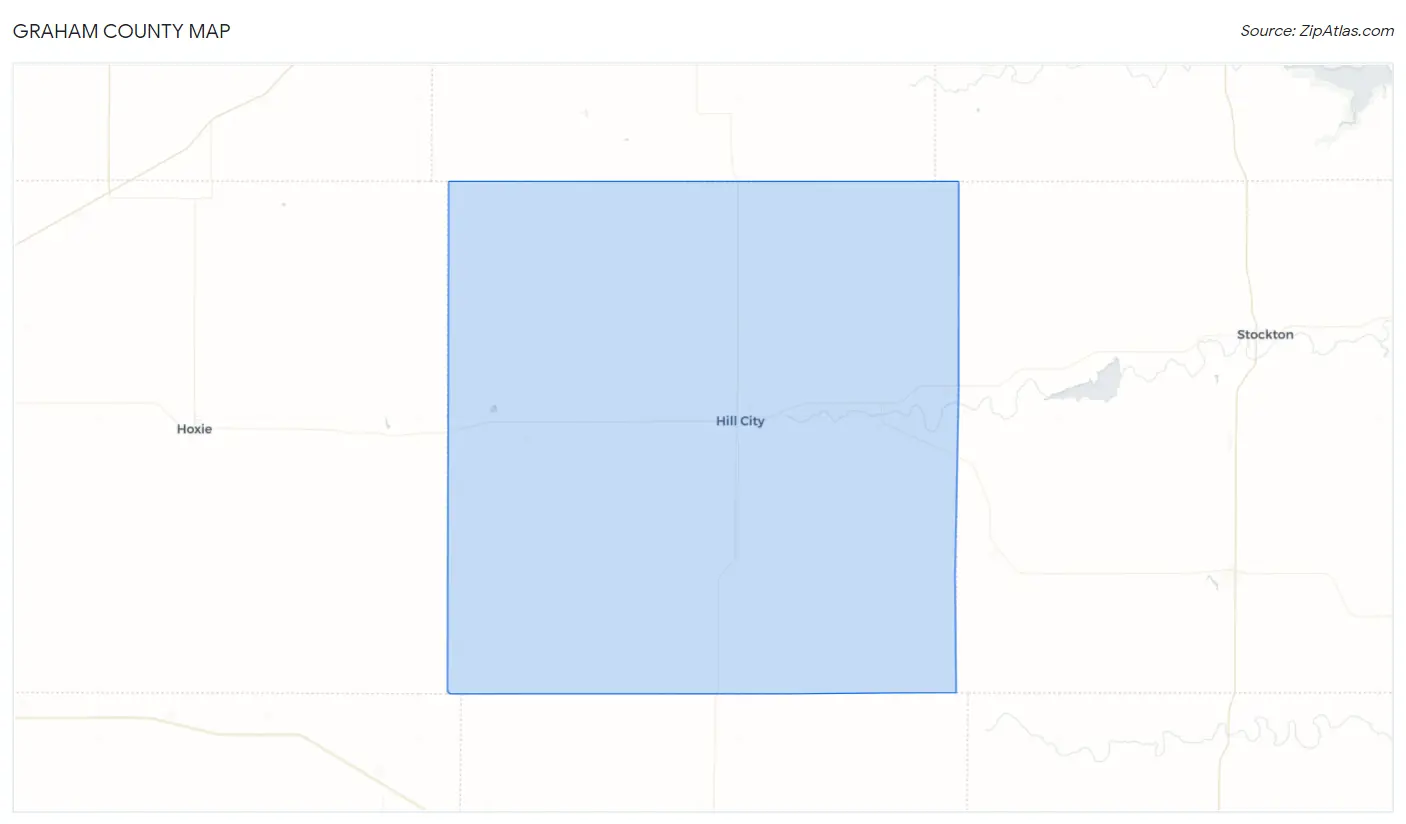
Graham County Map
Graham County Overview
$30,222
PER CAPITA INCOME
$55,556
AVG FAMILY INCOME
$47,071
AVG HOUSEHOLD INCOME
22.6%
WAGE / INCOME GAP [ % ]
77.4¢/ $1
WAGE / INCOME GAP [ $ ]
0.38
INEQUALITY / GINI INDEX
2,430
TOTAL POPULATION
1,203
MALE POPULATION
1,227
FEMALE POPULATION
98.04
MALES / 100 FEMALES
102.00
FEMALES / 100 MALES
47.2
MEDIAN AGE
2.5
AVG FAMILY SIZE
2.0
AVG HOUSEHOLD SIZE
1,247
LABOR FORCE [ PEOPLE ]
62.8%
PERCENT IN LABOR FORCE
6.1%
UNEMPLOYMENT RATE
Graham County Area Codes
Income in Graham County
Income Overview in Graham County
Per Capita Income in Graham County is $30,222, while median incomes of families and households are $55,556 and $47,071 respectively.
| Characteristic | Number | Measure |
| Per Capita Income | 2,430 | $30,222 |
| Median Family Income | 740 | $55,556 |
| Mean Family Income | 740 | $70,439 |
| Median Household Income | 1,200 | $47,071 |
| Mean Household Income | 1,200 | $60,647 |
| Income Deficit | 740 | $0 |
| Wage / Income Gap (%) | 2,430 | 22.59% |
| Wage / Income Gap ($) | 2,430 | 77.41¢ per $1 |
| Gini / Inequality Index | 2,430 | 0.38 |
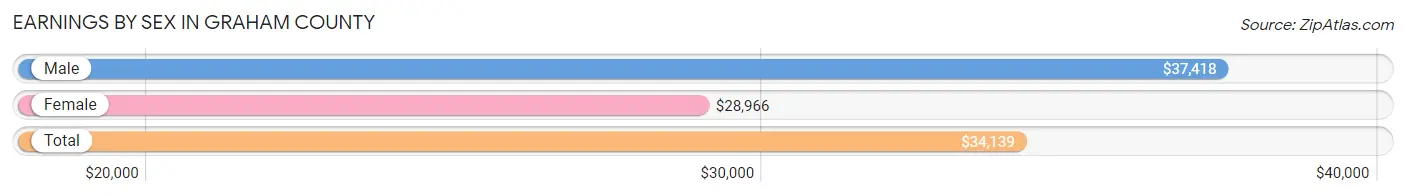
Earnings by Sex in Graham County
Average Earnings in Graham County are $34,139, $37,418 for men and $28,966 for women, a difference of 22.6%.
| Sex | Number | Average Earnings |
| Male | 670 (51.7%) | $37,418 |
| Female | 627 (48.3%) | $28,966 |
| Total | 1,297 (100.0%) | $34,139 |
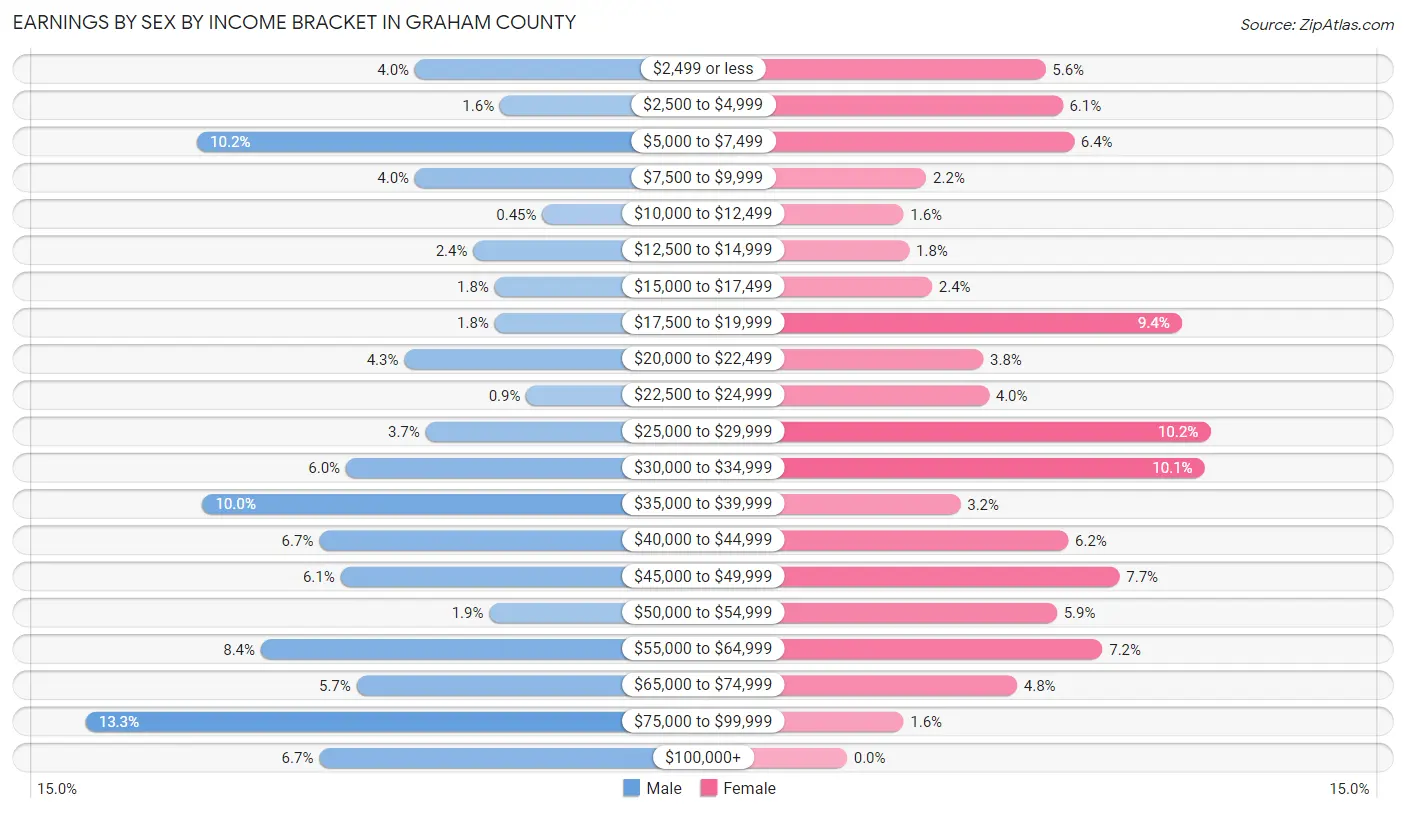
Earnings by Sex by Income Bracket in Graham County
The most common earnings brackets in Graham County are $75,000 to $99,999 for men (89 | 13.3%) and $25,000 to $29,999 for women (64 | 10.2%).
| Income | Male | Female |
| $2,499 or less | 27 (4.0%) | 35 (5.6%) |
| $2,500 to $4,999 | 11 (1.6%) | 38 (6.1%) |
| $5,000 to $7,499 | 68 (10.2%) | 40 (6.4%) |
| $7,500 to $9,999 | 27 (4.0%) | 14 (2.2%) |
| $10,000 to $12,499 | 3 (0.4%) | 10 (1.6%) |
| $12,500 to $14,999 | 16 (2.4%) | 11 (1.8%) |
| $15,000 to $17,499 | 12 (1.8%) | 15 (2.4%) |
| $17,500 to $19,999 | 12 (1.8%) | 59 (9.4%) |
| $20,000 to $22,499 | 29 (4.3%) | 24 (3.8%) |
| $22,500 to $24,999 | 6 (0.9%) | 25 (4.0%) |
| $25,000 to $29,999 | 25 (3.7%) | 64 (10.2%) |
| $30,000 to $34,999 | 40 (6.0%) | 63 (10.1%) |
| $35,000 to $39,999 | 67 (10.0%) | 20 (3.2%) |
| $40,000 to $44,999 | 45 (6.7%) | 39 (6.2%) |
| $45,000 to $49,999 | 41 (6.1%) | 48 (7.7%) |
| $50,000 to $54,999 | 13 (1.9%) | 37 (5.9%) |
| $55,000 to $64,999 | 56 (8.4%) | 45 (7.2%) |
| $65,000 to $74,999 | 38 (5.7%) | 30 (4.8%) |
| $75,000 to $99,999 | 89 (13.3%) | 10 (1.6%) |
| $100,000+ | 45 (6.7%) | 0 (0.0%) |
| Total | 670 (100.0%) | 627 (100.0%) |
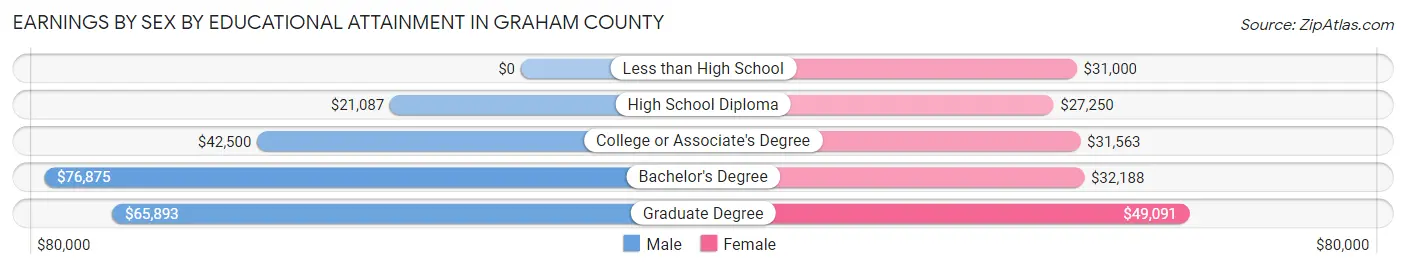
Earnings by Sex by Educational Attainment in Graham County
Average earnings in Graham County are $40,985 for men and $30,682 for women, a difference of 25.1%. Men with an educational attainment of bachelor's degree enjoy the highest average annual earnings of $76,875, while those with high school diploma education earn the least with $21,087. Women with an educational attainment of graduate degree earn the most with the average annual earnings of $49,091, while those with high school diploma education have the smallest earnings of $27,250.
| Educational Attainment | Male Income | Female Income |
| Less than High School | - | - |
| High School Diploma | $21,087 | $27,250 |
| College or Associate's Degree | $42,500 | $31,563 |
| Bachelor's Degree | $76,875 | $32,188 |
| Graduate Degree | $65,893 | $49,091 |
| Total | $40,985 | $30,682 |
Family Income in Graham County
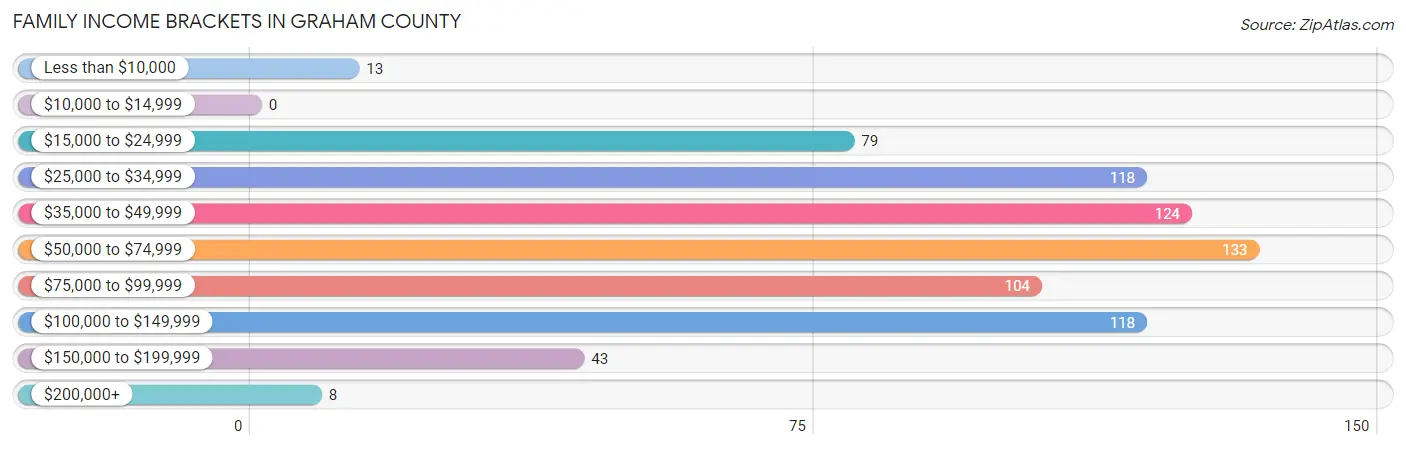
Family Income Brackets in Graham County
According to the Graham County family income data, there are 133 families falling into the $50,000 to $74,999 income range, which is the most common income bracket and makes up 18.0% of all families.
| Income Bracket | # Families | % Families |
| Less than $10,000 | 13 | 1.8% |
| $10,000 to $14,999 | 0 | 0.0% |
| $15,000 to $24,999 | 79 | 10.7% |
| $25,000 to $34,999 | 118 | 15.9% |
| $35,000 to $49,999 | 124 | 16.8% |
| $50,000 to $74,999 | 133 | 18.0% |
| $75,000 to $99,999 | 104 | 14.1% |
| $100,000 to $149,999 | 118 | 15.9% |
| $150,000 to $199,999 | 43 | 5.8% |
| $200,000+ | 8 | 1.1% |
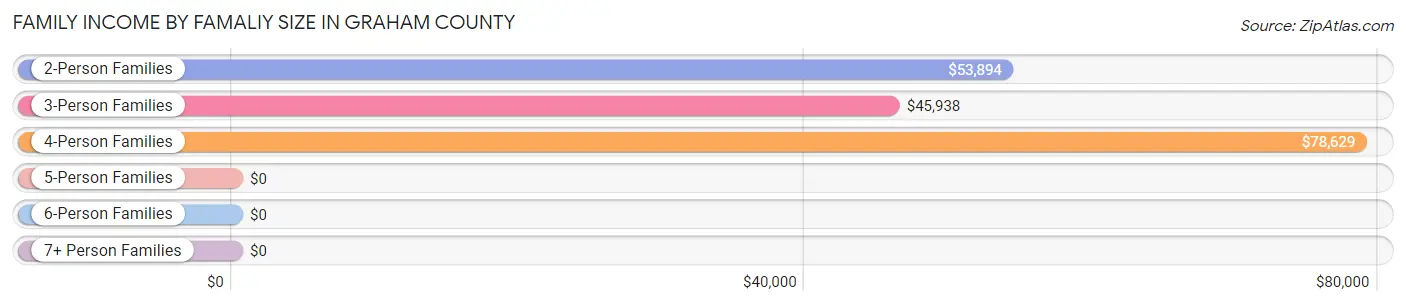
Family Income by Famaliy Size in Graham County
4-person families (72 | 9.7%) account for the highest median family income in Graham County with $78,629 per family, while 2-person families (413 | 55.8%) have the highest median income of $26,947 per family member.
| Income Bracket | # Families | Median Income |
| 2-Person Families | 413 (55.8%) | $53,894 |
| 3-Person Families | 156 (21.1%) | $45,938 |
| 4-Person Families | 72 (9.7%) | $78,629 |
| 5-Person Families | 80 (10.8%) | $0 |
| 6-Person Families | 12 (1.6%) | $0 |
| 7+ Person Families | 7 (0.9%) | $0 |
| Total | 740 (100.0%) | $55,556 |
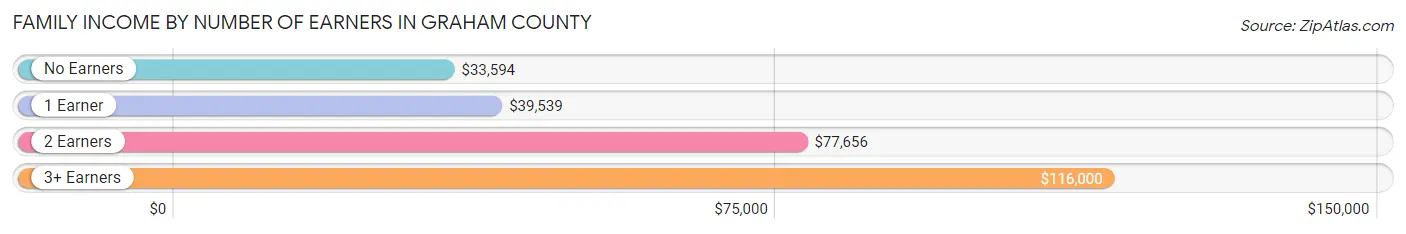
Family Income by Number of Earners in Graham County
The median family income in Graham County is $55,556, with families comprising 3+ earners (38) having the highest median family income of $116,000, while families with no earners (93) have the lowest median family income of $33,594, accounting for 5.1% and 12.6% of families, respectively.
| Number of Earners | # Families | Median Income |
| No Earners | 93 (12.6%) | $33,594 |
| 1 Earner | 251 (33.9%) | $39,539 |
| 2 Earners | 358 (48.4%) | $77,656 |
| 3+ Earners | 38 (5.1%) | $116,000 |
| Total | 740 (100.0%) | $55,556 |
Household Income in Graham County
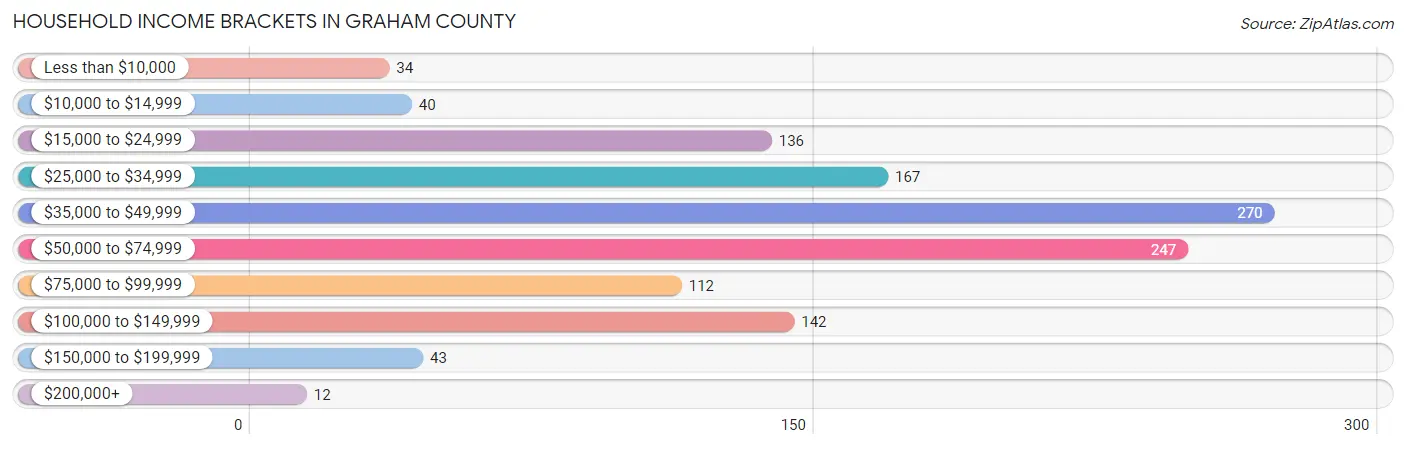
Household Income Brackets in Graham County
With 270 households falling in the category, the $35,000 to $49,999 income range is the most frequent in Graham County, accounting for 22.5% of all households. In contrast, only 12 households (1.0%) fall into the $200,000+ income bracket, making it the least populous group.
| Income Bracket | # Households | % Households |
| Less than $10,000 | 34 | 2.8% |
| $10,000 to $14,999 | 40 | 3.3% |
| $15,000 to $24,999 | 136 | 11.3% |
| $25,000 to $34,999 | 167 | 13.9% |
| $35,000 to $49,999 | 270 | 22.5% |
| $50,000 to $74,999 | 247 | 20.6% |
| $75,000 to $99,999 | 112 | 9.3% |
| $100,000 to $149,999 | 142 | 11.8% |
| $150,000 to $199,999 | 43 | 3.6% |
| $200,000+ | 12 | 1.0% |
Household Income by Householder Age in Graham County
The median household income in Graham County is $47,071, with the highest median household income of $58,938 found in the 45 to 64 years age bracket for the primary householder. A total of 355 households (29.6%) fall into this category. Meanwhile, the 15 to 24 years age bracket for the primary householder has the lowest median household income of $19,566, with 111 households (9.2%) in this group.
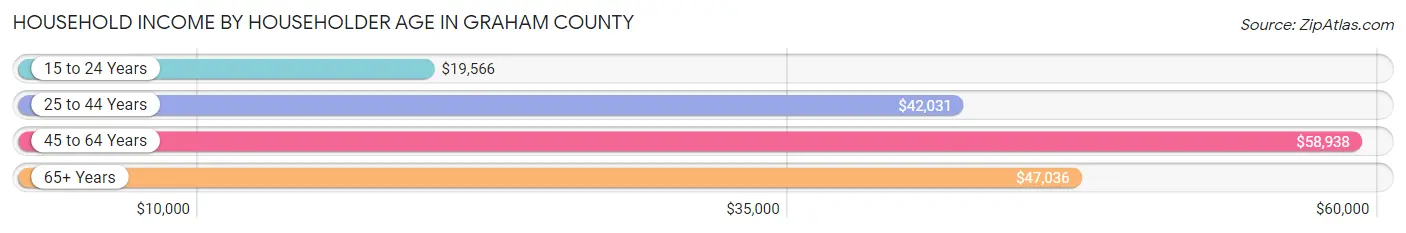
| Income Bracket | # Households | Median Income |
| 15 to 24 Years | 111 (9.2%) | $19,566 |
| 25 to 44 Years | 289 (24.1%) | $42,031 |
| 45 to 64 Years | 355 (29.6%) | $58,938 |
| 65+ Years | 445 (37.1%) | $47,036 |
| Total | 1,200 (100.0%) | $47,071 |
Poverty in Graham County
Income Below Poverty by Sex and Age in Graham County
With 7.6% poverty level for males and 12.2% for females among the residents of Graham County, 15 year old males and 18 to 24 year old females are the most vulnerable to poverty, with 18 males (64.3%) and 70 females (60.3%) in their respective age groups living below the poverty level.
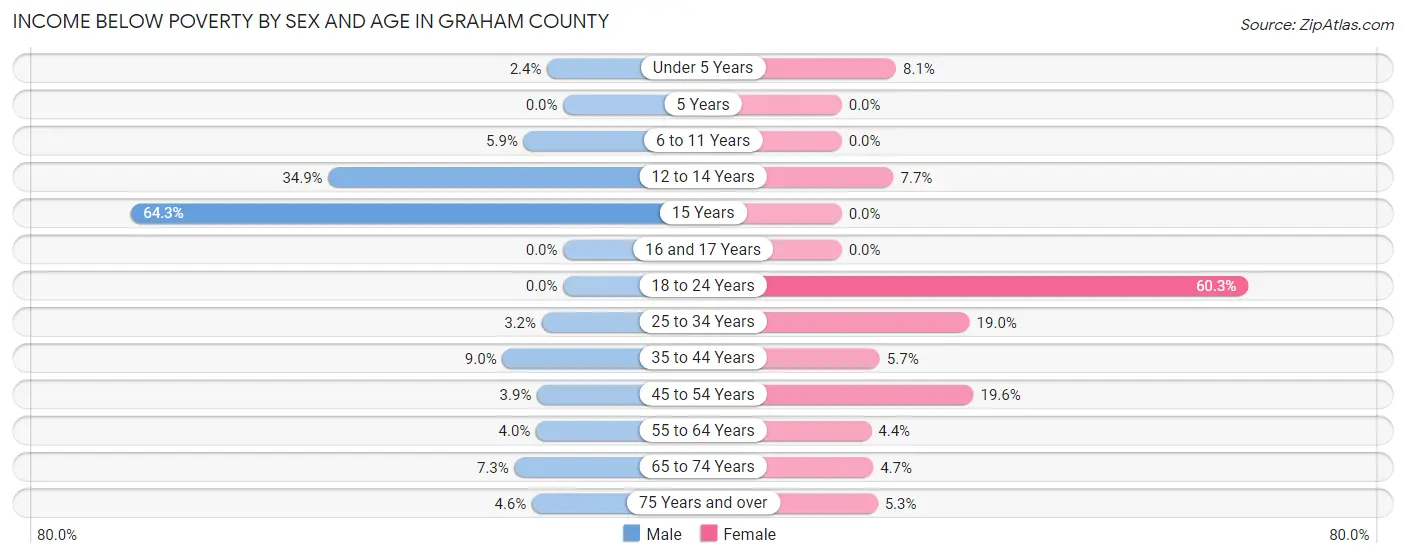
| Age Bracket | Male | Female |
| Under 5 Years | 1 (2.4%) | 5 (8.1%) |
| 5 Years | 0 (0.0%) | 0 (0.0%) |
| 6 to 11 Years | 7 (5.9%) | 0 (0.0%) |
| 12 to 14 Years | 15 (34.9%) | 5 (7.7%) |
| 15 Years | 18 (64.3%) | 0 (0.0%) |
| 16 and 17 Years | 0 (0.0%) | 0 (0.0%) |
| 18 to 24 Years | 0 (0.0%) | 70 (60.3%) |
| 25 to 34 Years | 3 (3.2%) | 15 (19.0%) |
| 35 to 44 Years | 17 (9.0%) | 9 (5.7%) |
| 45 to 54 Years | 5 (3.9%) | 18 (19.6%) |
| 55 to 64 Years | 8 (4.0%) | 9 (4.4%) |
| 65 to 74 Years | 10 (7.2%) | 7 (4.7%) |
| 75 Years and over | 7 (4.6%) | 9 (5.3%) |
| Total | 91 (7.6%) | 147 (12.2%) |
Income Above Poverty by Sex and Age in Graham County
According to the poverty statistics in Graham County, males aged 5 years and females aged 5 years are the age groups that are most secure financially, with 100.0% of males and 100.0% of females in these age groups living above the poverty line.
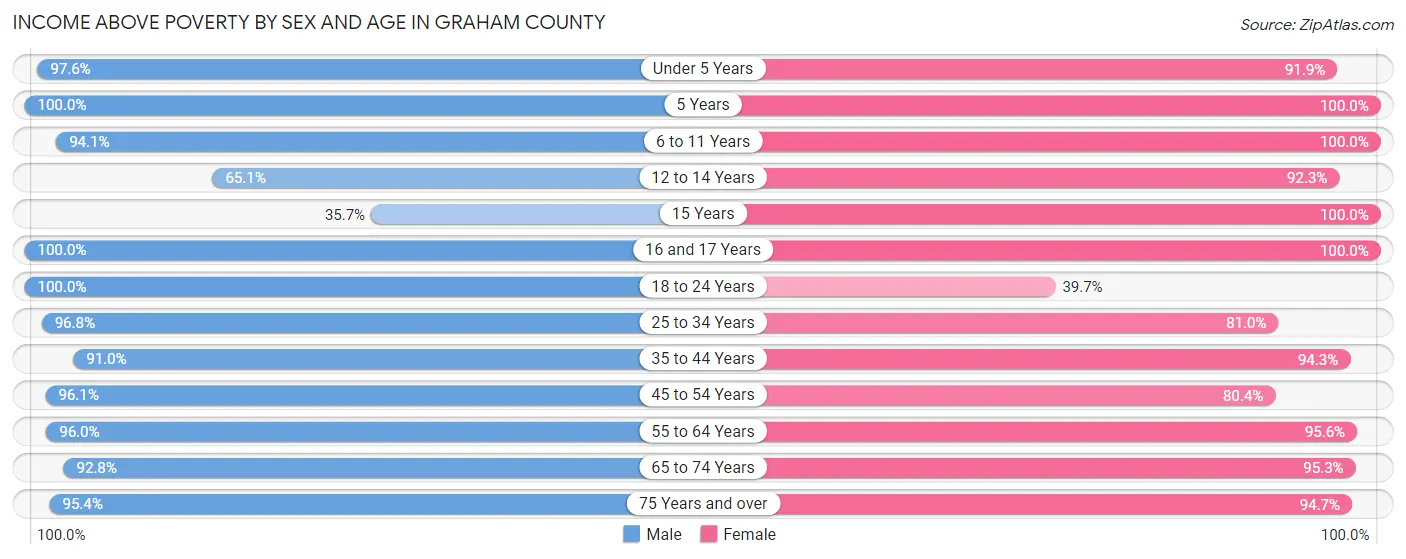
| Age Bracket | Male | Female |
| Under 5 Years | 41 (97.6%) | 57 (91.9%) |
| 5 Years | 1 (100.0%) | 15 (100.0%) |
| 6 to 11 Years | 112 (94.1%) | 58 (100.0%) |
| 12 to 14 Years | 28 (65.1%) | 60 (92.3%) |
| 15 Years | 10 (35.7%) | 7 (100.0%) |
| 16 and 17 Years | 31 (100.0%) | 25 (100.0%) |
| 18 to 24 Years | 32 (100.0%) | 46 (39.7%) |
| 25 to 34 Years | 91 (96.8%) | 64 (81.0%) |
| 35 to 44 Years | 171 (91.0%) | 150 (94.3%) |
| 45 to 54 Years | 124 (96.1%) | 74 (80.4%) |
| 55 to 64 Years | 190 (96.0%) | 196 (95.6%) |
| 65 to 74 Years | 128 (92.7%) | 143 (95.3%) |
| 75 Years and over | 144 (95.4%) | 160 (94.7%) |
| Total | 1,103 (92.4%) | 1,055 (87.8%) |
Income Below Poverty Among Married-Couple Families in Graham County
The poverty statistics for married-couple families in Graham County show that 0.7% or 4 of the total 577 families live below the poverty line. Families with no children have the highest poverty rate of 1.0%, comprising of 3 families. On the other hand, families with 3 or 4 children have the lowest poverty rate of 0.0%, which includes 0 families.
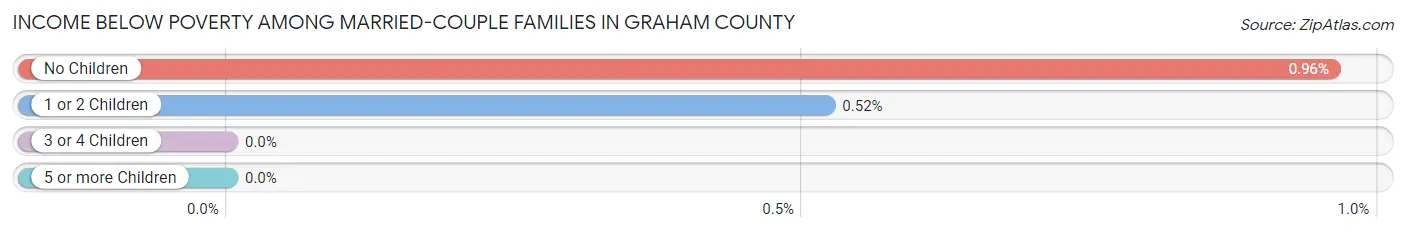
| Children | Above Poverty | Below Poverty |
| No Children | 311 (99.0%) | 3 (1.0%) |
| 1 or 2 Children | 190 (99.5%) | 1 (0.5%) |
| 3 or 4 Children | 72 (100.0%) | 0 (0.0%) |
| 5 or more Children | 0 (0.0%) | 0 (0.0%) |
| Total | 573 (99.3%) | 4 (0.7%) |
Income Below Poverty Among Single-Parent Households in Graham County
According to the poverty data in Graham County, 40.0% or 16 single-father households and 52.0% or 64 single-mother households are living below the poverty line. Among single-father households, those with 1 or 2 children have the highest poverty rate, with 16 households (84.2%) experiencing poverty. Likewise, among single-mother households, those with 3 or 4 children have the highest poverty rate, with 11 households (100.0%) falling below the poverty line.
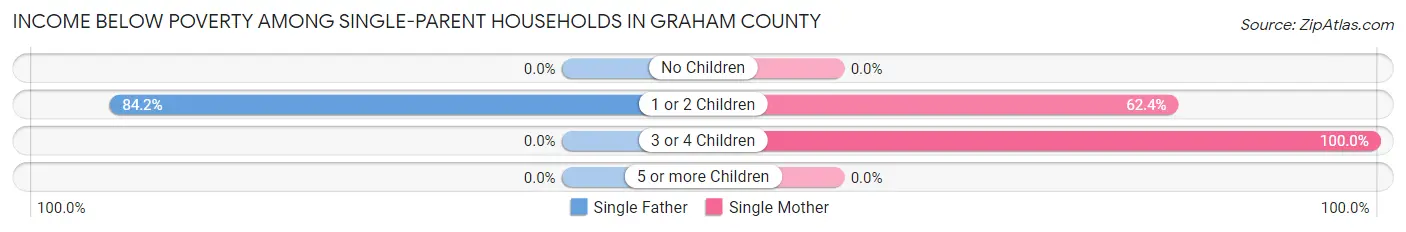
| Children | Single Father | Single Mother |
| No Children | 0 (0.0%) | 0 (0.0%) |
| 1 or 2 Children | 16 (84.2%) | 53 (62.4%) |
| 3 or 4 Children | 0 (0.0%) | 11 (100.0%) |
| 5 or more Children | 0 (0.0%) | 0 (0.0%) |
| Total | 16 (40.0%) | 64 (52.0%) |
Income Below Poverty Among Married-Couple vs Single-Parent Households in Graham County
The poverty data for Graham County shows that 4 of the married-couple family households (0.7%) and 80 of the single-parent households (49.1%) are living below the poverty level. Within the married-couple family households, those with no children have the highest poverty rate, with 3 households (1.0%) falling below the poverty line. Among the single-parent households, those with 1 or 2 children have the highest poverty rate, with 69 household (66.3%) living below poverty.
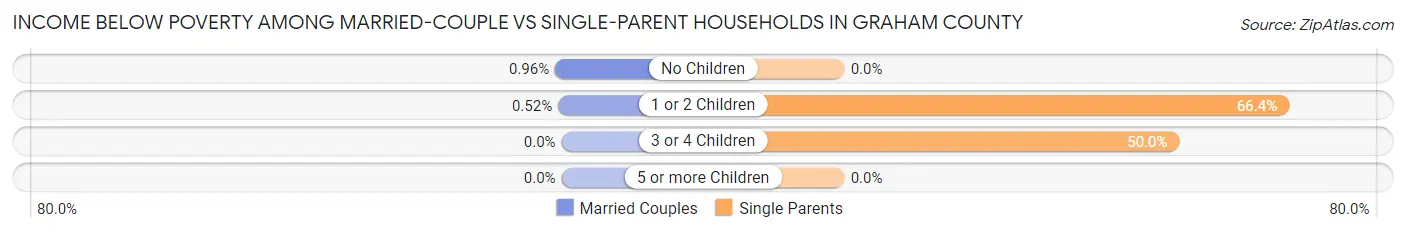
| Children | Married-Couple Families | Single-Parent Households |
| No Children | 3 (1.0%) | 0 (0.0%) |
| 1 or 2 Children | 1 (0.5%) | 69 (66.3%) |
| 3 or 4 Children | 0 (0.0%) | 11 (50.0%) |
| 5 or more Children | 0 (0.0%) | 0 (0.0%) |
| Total | 4 (0.7%) | 80 (49.1%) |
Race in Graham County
The most populous races in Graham County are White / Caucasian (2,207 | 90.8%), Black / African American (103 | 4.2%), and Hispanic or Latino (100 | 4.1%).
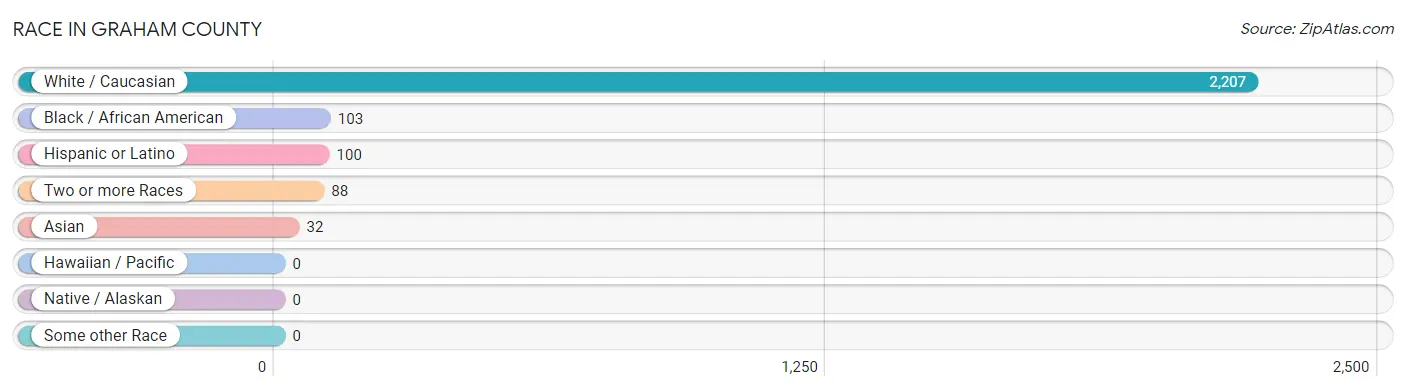
| Race | # Population | % Population |
| Asian | 32 | 1.3% |
| Black / African American | 103 | 4.2% |
| Hawaiian / Pacific | 0 | 0.0% |
| Hispanic or Latino | 100 | 4.1% |
| Native / Alaskan | 0 | 0.0% |
| White / Caucasian | 2,207 | 90.8% |
| Two or more Races | 88 | 3.6% |
| Some other Race | 0 | 0.0% |
| Total | 2,430 | 100.0% |
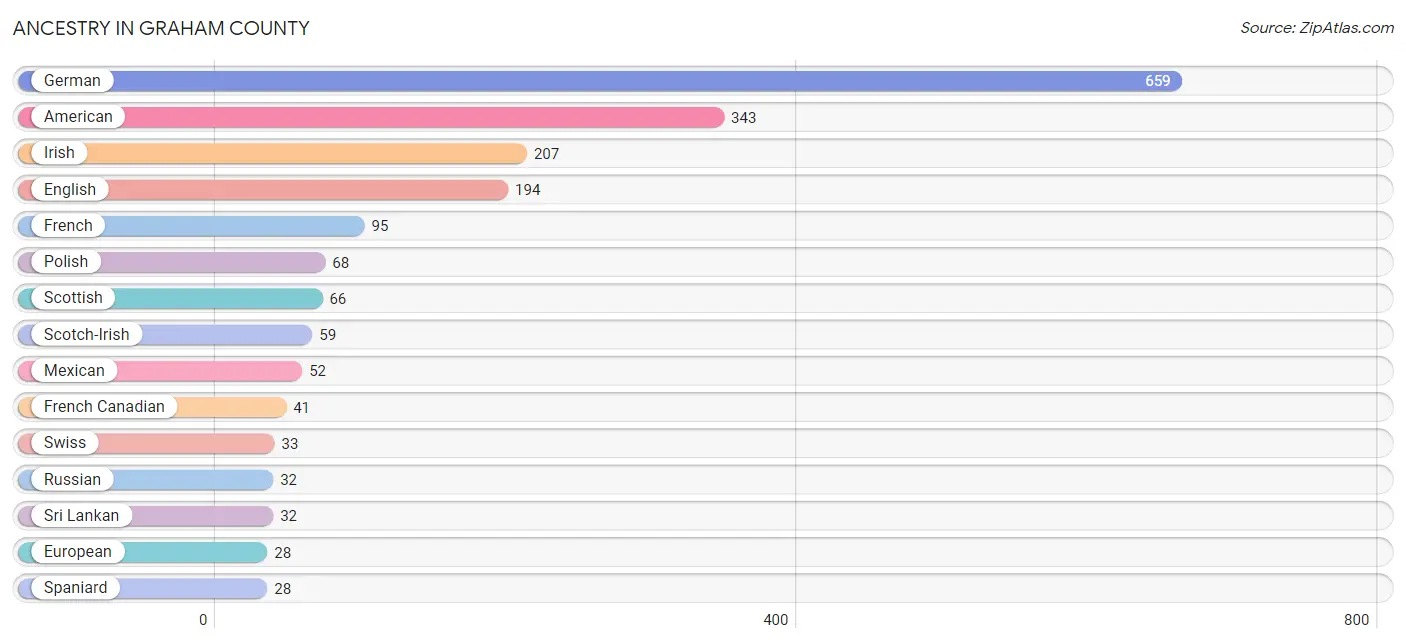
Ancestry in Graham County
The most populous ancestries reported in Graham County are German (659 | 27.1%), American (343 | 14.1%), Irish (207 | 8.5%), English (194 | 8.0%), and French (95 | 3.9%), together accounting for 61.7% of all Graham County residents.
| Ancestry | # Population | % Population |
| American | 343 | 14.1% |
| Arab | 3 | 0.1% |
| Argentinean | 2 | 0.1% |
| Austrian | 2 | 0.1% |
| Blackfeet | 7 | 0.3% |
| Brazilian | 5 | 0.2% |
| Cherokee | 18 | 0.7% |
| Colombian | 8 | 0.3% |
| Danish | 23 | 0.9% |
| Dutch | 17 | 0.7% |
| English | 194 | 8.0% |
| European | 28 | 1.1% |
| French | 95 | 3.9% |
| French Canadian | 41 | 1.7% |
| German | 659 | 27.1% |
| German Russian | 5 | 0.2% |
| Hungarian | 3 | 0.1% |
| Irish | 207 | 8.5% |
| Italian | 4 | 0.2% |
| Mexican | 52 | 2.1% |
| Navajo | 5 | 0.2% |
| Northern European | 6 | 0.3% |
| Norwegian | 19 | 0.8% |
| Pennsylvania German | 6 | 0.3% |
| Polish | 68 | 2.8% |
| Puerto Rican | 2 | 0.1% |
| Russian | 32 | 1.3% |
| Scandinavian | 5 | 0.2% |
| Scotch-Irish | 59 | 2.4% |
| Scottish | 66 | 2.7% |
| South American | 10 | 0.4% |
| Spaniard | 28 | 1.1% |
| Spanish | 7 | 0.3% |
| Sri Lankan | 32 | 1.3% |
| Swedish | 15 | 0.6% |
| Swiss | 33 | 1.4% |
| Welsh | 26 | 1.1% | View All 37 Rows |
Immigrants in Graham County
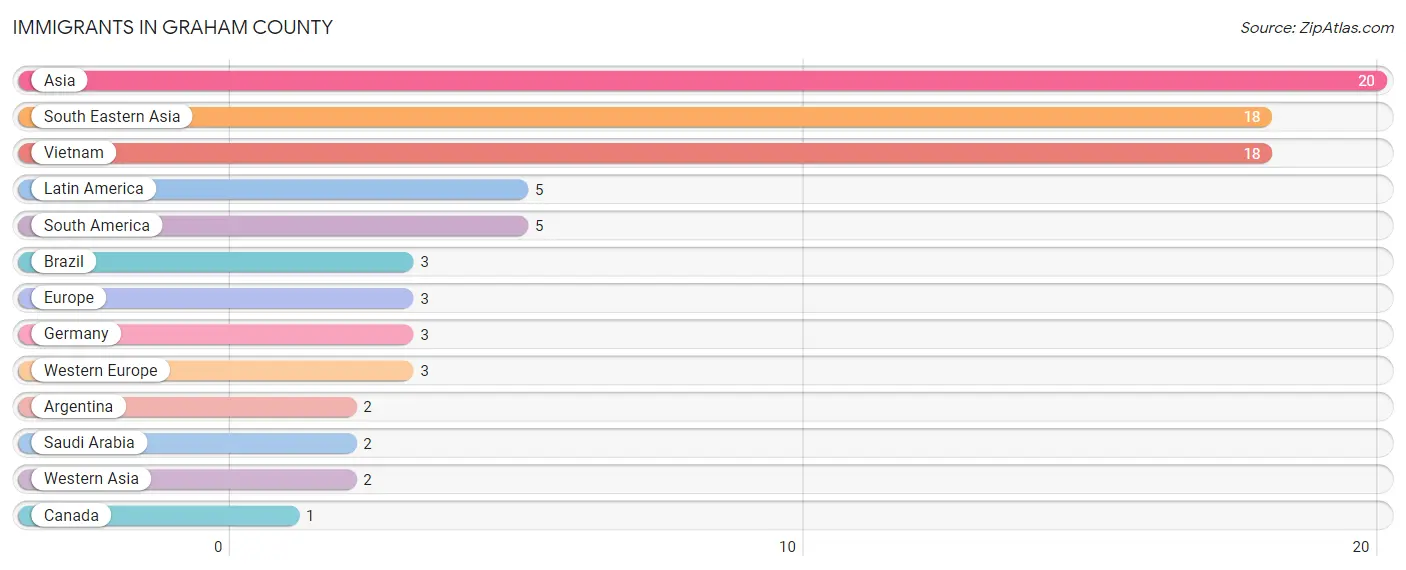
The most numerous immigrant groups reported in Graham County came from Asia (20 | 0.8%), South Eastern Asia (18 | 0.7%), Vietnam (18 | 0.7%), Latin America (5 | 0.2%), and South America (5 | 0.2%), together accounting for 2.7% of all Graham County residents.
| Immigration Origin | # Population | % Population |
| Argentina | 2 | 0.1% |
| Asia | 20 | 0.8% |
| Brazil | 3 | 0.1% |
| Canada | 1 | 0.0% |
| Europe | 3 | 0.1% |
| Germany | 3 | 0.1% |
| Latin America | 5 | 0.2% |
| Saudi Arabia | 2 | 0.1% |
| South America | 5 | 0.2% |
| South Eastern Asia | 18 | 0.7% |
| Vietnam | 18 | 0.7% |
| Western Asia | 2 | 0.1% |
| Western Europe | 3 | 0.1% | View All 13 Rows |
Sex and Age in Graham County
Sex and Age in Graham County
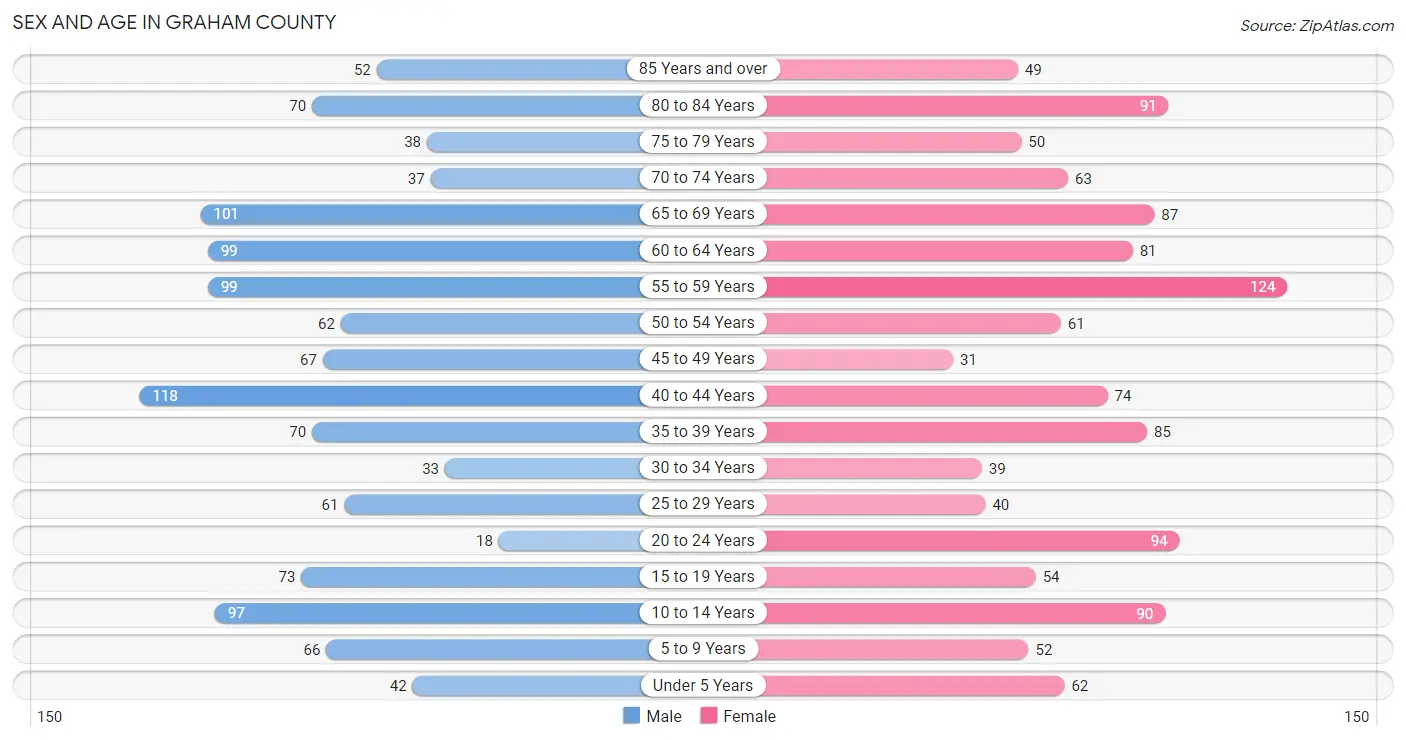
The most populous age groups in Graham County are 40 to 44 Years (118 | 9.8%) for men and 55 to 59 Years (124 | 10.1%) for women.
| Age Bracket | Male | Female |
| Under 5 Years | 42 (3.5%) | 62 (5.1%) |
| 5 to 9 Years | 66 (5.5%) | 52 (4.2%) |
| 10 to 14 Years | 97 (8.1%) | 90 (7.3%) |
| 15 to 19 Years | 73 (6.1%) | 54 (4.4%) |
| 20 to 24 Years | 18 (1.5%) | 94 (7.7%) |
| 25 to 29 Years | 61 (5.1%) | 40 (3.3%) |
| 30 to 34 Years | 33 (2.7%) | 39 (3.2%) |
| 35 to 39 Years | 70 (5.8%) | 85 (6.9%) |
| 40 to 44 Years | 118 (9.8%) | 74 (6.0%) |
| 45 to 49 Years | 67 (5.6%) | 31 (2.5%) |
| 50 to 54 Years | 62 (5.1%) | 61 (5.0%) |
| 55 to 59 Years | 99 (8.2%) | 124 (10.1%) |
| 60 to 64 Years | 99 (8.2%) | 81 (6.6%) |
| 65 to 69 Years | 101 (8.4%) | 87 (7.1%) |
| 70 to 74 Years | 37 (3.1%) | 63 (5.1%) |
| 75 to 79 Years | 38 (3.2%) | 50 (4.1%) |
| 80 to 84 Years | 70 (5.8%) | 91 (7.4%) |
| 85 Years and over | 52 (4.3%) | 49 (4.0%) |
| Total | 1,203 (100.0%) | 1,227 (100.0%) |
Families and Households in Graham County
Median Family Size in Graham County
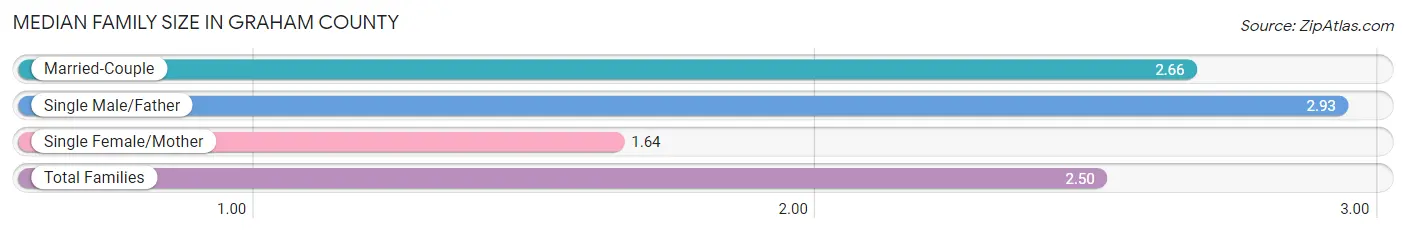
The median family size in Graham County is 2.50 persons per family, with single male/father families (40 | 5.4%) accounting for the largest median family size of 2.93 persons per family. On the other hand, single female/mother families (123 | 16.6%) represent the smallest median family size with 1.64 persons per family.
| Family Type | # Families | Family Size |
| Married-Couple | 577 (78.0%) | 2.66 |
| Single Male/Father | 40 (5.4%) | 2.93 |
| Single Female/Mother | 123 (16.6%) | 1.64 |
| Total Families | 740 (100.0%) | 2.50 |
Median Household Size in Graham County
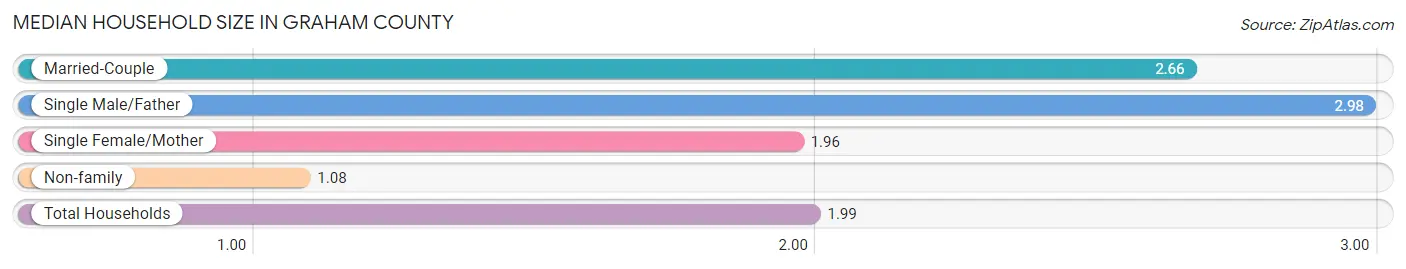
The median household size in Graham County is 1.99 persons per household, with single male/father households (40 | 3.3%) accounting for the largest median household size of 2.98 persons per household. non-family households (460 | 38.3%) represent the smallest median household size with 1.08 persons per household.
| Household Type | # Households | Household Size |
| Married-Couple | 577 (48.1%) | 2.66 |
| Single Male/Father | 40 (3.3%) | 2.98 |
| Single Female/Mother | 123 (10.2%) | 1.96 |
| Non-family | 460 (38.3%) | 1.08 |
| Total Households | 1,200 (100.0%) | 1.99 |
Household Size by Marriage Status in Graham County
Out of a total of 1,200 households in Graham County, 740 (61.7%) are family households, while 460 (38.3%) are nonfamily households. The most numerous type of family households are 2-person households, comprising 385, and the most common type of nonfamily households are 1-person households, comprising 428.
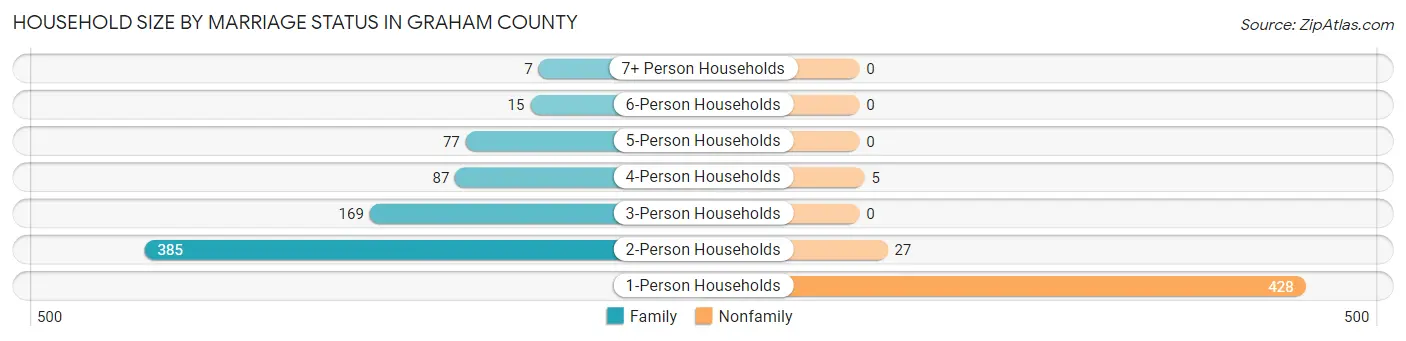
| Household Size | Family Households | Nonfamily Households |
| 1-Person Households | - | 428 (35.7%) |
| 2-Person Households | 385 (32.1%) | 27 (2.2%) |
| 3-Person Households | 169 (14.1%) | 0 (0.0%) |
| 4-Person Households | 87 (7.2%) | 5 (0.4%) |
| 5-Person Households | 77 (6.4%) | 0 (0.0%) |
| 6-Person Households | 15 (1.3%) | 0 (0.0%) |
| 7+ Person Households | 7 (0.6%) | 0 (0.0%) |
| Total | 740 (61.7%) | 460 (38.3%) |
Female Fertility in Graham County
Fertility by Age in Graham County
Average fertility rate in Graham County is 25.0 births per 1,000 women. Women in the age bracket of 20 to 34 years have the highest fertility rate with 64.0 births per 1,000 women. Women in the age bracket of 20 to 34 years acount for 100.0% of all women with births.
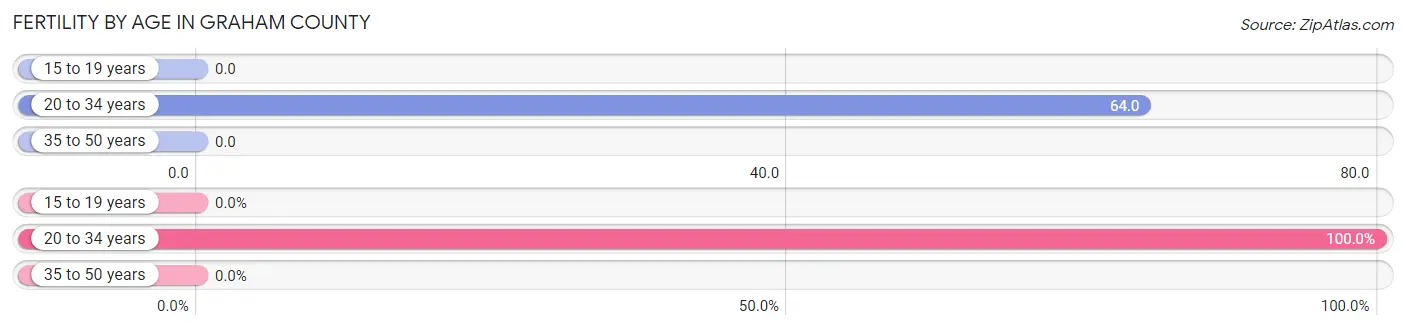
| Age Bracket | Women with Births | Births / 1,000 Women |
| 15 to 19 years | 0 (0.0%) | 0.0 |
| 20 to 34 years | 11 (100.0%) | 64.0 |
| 35 to 50 years | 0 (0.0%) | 0.0 |
| Total | 11 (100.0%) | 25.0 |
Fertility by Age by Marriage Status in Graham County
63.6% of women with births (11) in Graham County are married. The highest percentage of unmarried women with births falls into 20 to 34 years age bracket with 36.4% of them unmarried at the time of birth, while the lowest percentage of unmarried women with births belong to 20 to 34 years age bracket with 36.4% of them unmarried.
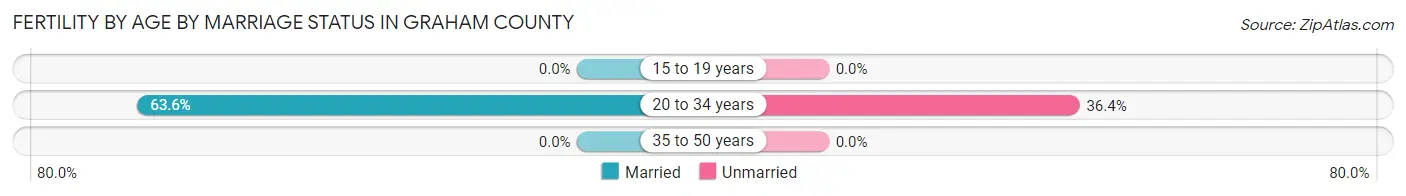
| Age Bracket | Married | Unmarried |
| 15 to 19 years | 0 (0.0%) | 0 (0.0%) |
| 20 to 34 years | 7 (63.6%) | 4 (36.4%) |
| 35 to 50 years | 0 (0.0%) | 0 (0.0%) |
| Total | 7 (63.6%) | 4 (36.4%) |
Fertility by Education in Graham County
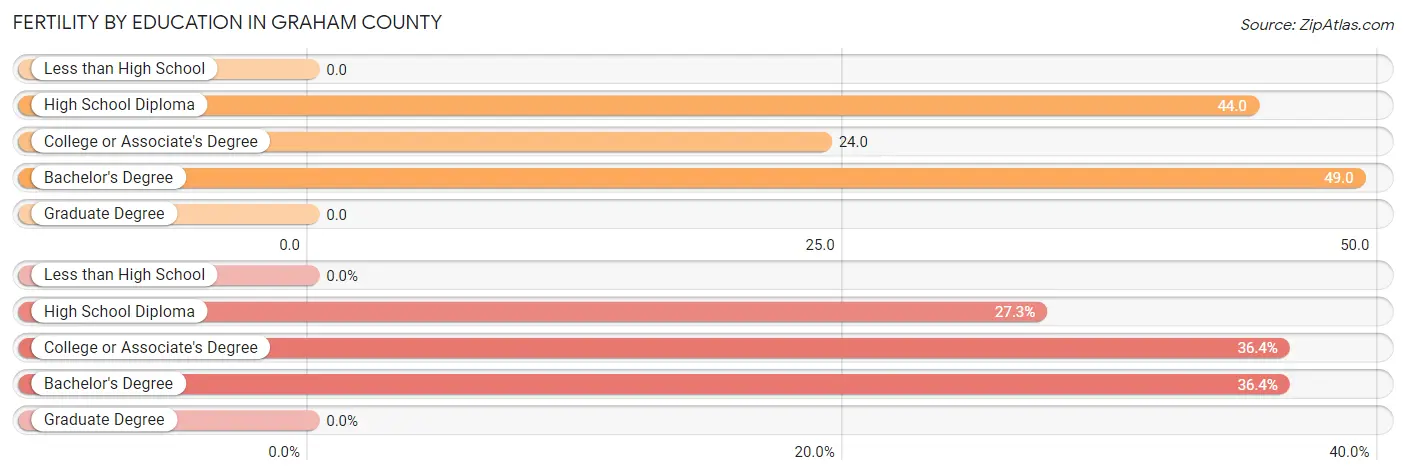
| Educational Attainment | Women with Births | Births / 1,000 Women |
| Less than High School | 0 (0.0%) | 0.0 |
| High School Diploma | 3 (27.3%) | 44.0 |
| College or Associate's Degree | 4 (36.4%) | 24.0 |
| Bachelor's Degree | 4 (36.4%) | 49.0 |
| Graduate Degree | 0 (0.0%) | 0.0 |
| Total | 11 (100.0%) | 25.0 |
Fertility by Education by Marriage Status in Graham County
36.4% of women with births in Graham County are unmarried. Women with the educational attainment of bachelor's degree are most likely to be married with 100.0% of them married at childbirth, while women with the educational attainment of high school diploma are least likely to be married with 100.0% of them unmarried at childbirth.
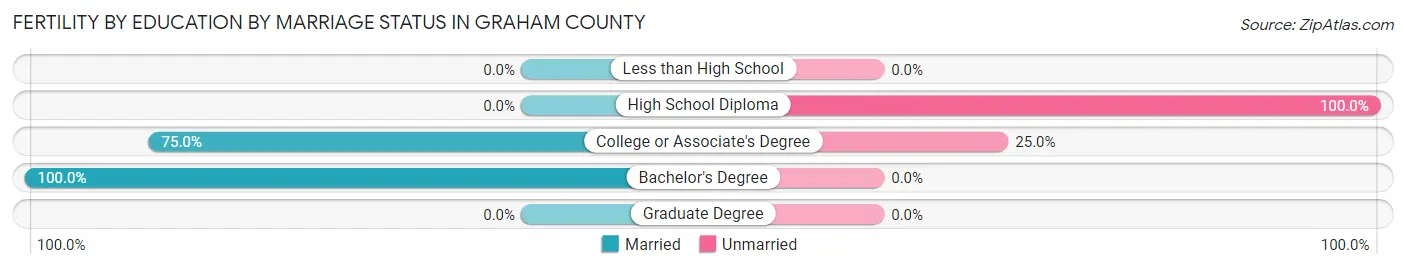
| Educational Attainment | Married | Unmarried |
| Less than High School | 0 (0.0%) | 0 (0.0%) |
| High School Diploma | 0 (0.0%) | 3 (100.0%) |
| College or Associate's Degree | 3 (75.0%) | 1 (25.0%) |
| Bachelor's Degree | 4 (100.0%) | 0 (0.0%) |
| Graduate Degree | 0 (0.0%) | 0 (0.0%) |
| Total | 7 (63.6%) | 4 (36.4%) |
Employment Characteristics in Graham County
Employment by Class of Employer in Graham County
Among the 1,132 employed individuals in Graham County, private company employees (528 | 46.6%), local government employees (186 | 16.4%), and self-employed (not incorporated) (156 | 13.8%) make up the most common classes of employment.
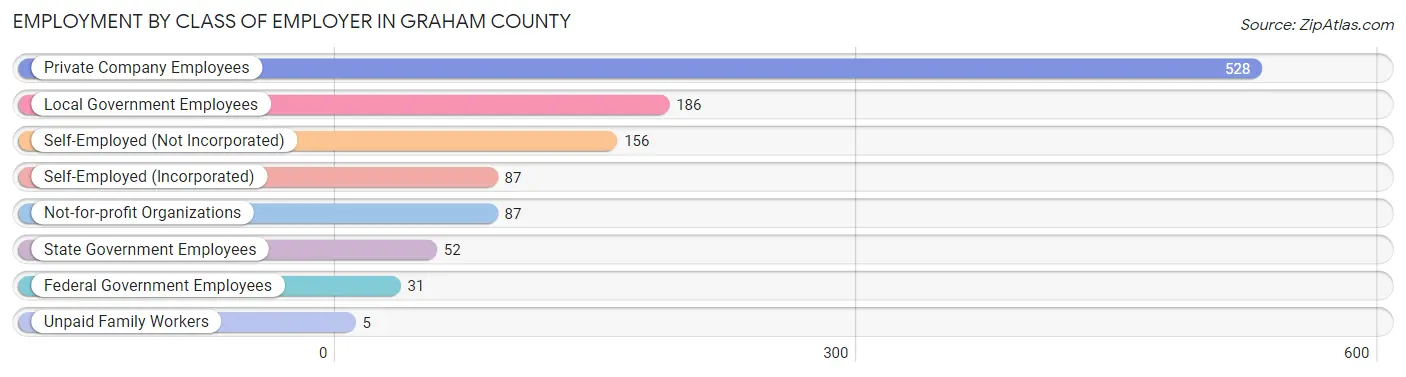
| Employer Class | # Employees | % Employees |
| Private Company Employees | 528 | 46.6% |
| Self-Employed (Incorporated) | 87 | 7.7% |
| Self-Employed (Not Incorporated) | 156 | 13.8% |
| Not-for-profit Organizations | 87 | 7.7% |
| Local Government Employees | 186 | 16.4% |
| State Government Employees | 52 | 4.6% |
| Federal Government Employees | 31 | 2.7% |
| Unpaid Family Workers | 5 | 0.4% |
| Total | 1,132 | 100.0% |
Employment Status by Age in Graham County
According to the labor force statistics for Graham County, out of the total population over 16 years of age (1,986), 62.8% or 1,247 individuals are in the labor force, with 6.1% or 76 of them unemployed. The age group with the highest labor force participation rate is 35 to 44 years, with 90.5% or 314 individuals in the labor force. Within the labor force, the 16 to 19 years age range has the highest percentage of unemployed individuals, with 26.2% or 16 of them being unemployed.
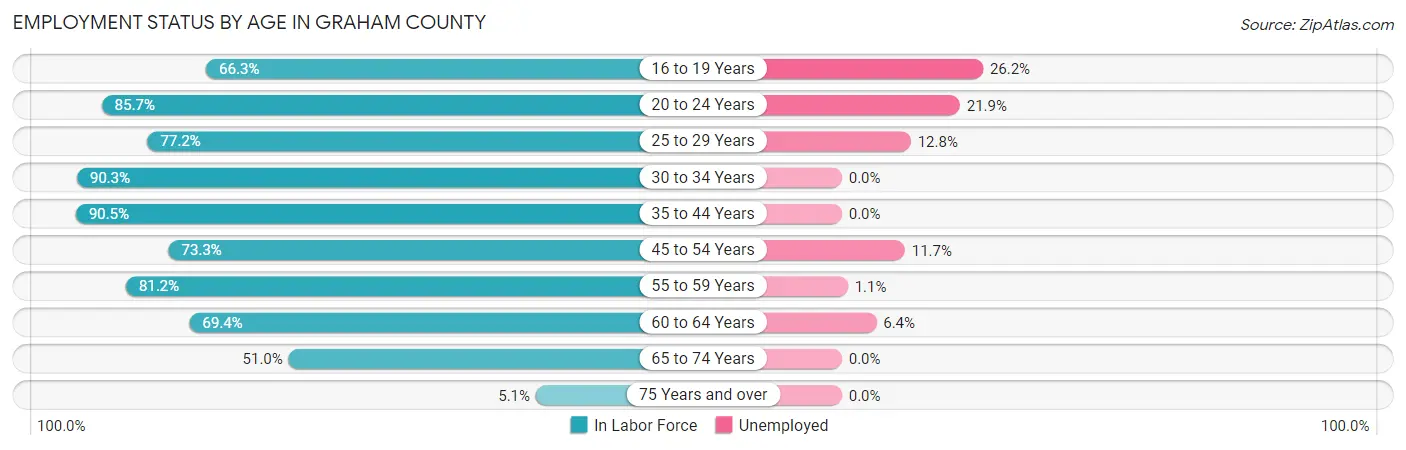
| Age Bracket | In Labor Force | Unemployed |
| 16 to 19 Years | 61 (66.3%) | 16 (26.2%) |
| 20 to 24 Years | 96 (85.7%) | 21 (21.9%) |
| 25 to 29 Years | 78 (77.2%) | 10 (12.8%) |
| 30 to 34 Years | 65 (90.3%) | 0 (0.0%) |
| 35 to 44 Years | 314 (90.5%) | 0 (0.0%) |
| 45 to 54 Years | 162 (73.3%) | 19 (11.7%) |
| 55 to 59 Years | 181 (81.2%) | 2 (1.1%) |
| 60 to 64 Years | 125 (69.4%) | 8 (6.4%) |
| 65 to 74 Years | 147 (51.0%) | 0 (0.0%) |
| 75 Years and over | 18 (5.1%) | 0 (0.0%) |
| Total | 1,247 (62.8%) | 76 (6.1%) |
Employment Status by Educational Attainment in Graham County
According to labor force statistics for Graham County, 80.9% of individuals (925) out of the total population between 25 and 64 years of age (1,144) are in the labor force, with 4.2% or 39 of them being unemployed. The group with the highest labor force participation rate are those with the educational attainment of bachelor's degree or higher, with 89.9% or 266 individuals in the labor force. Within the labor force, individuals with high school diploma education have the highest percentage of unemployment, with 10.5% or 29 of them being unemployed.
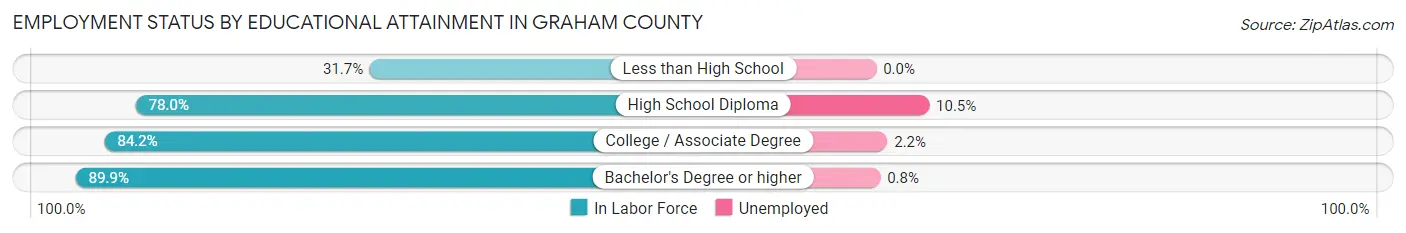
| Educational Attainment | In Labor Force | Unemployed |
| Less than High School | 20 (31.7%) | 0 (0.0%) |
| High School Diploma | 276 (78.0%) | 37 (10.5%) |
| College / Associate Degree | 363 (84.2%) | 9 (2.2%) |
| Bachelor's Degree or higher | 266 (89.9%) | 2 (0.8%) |
| Total | 925 (80.9%) | 48 (4.2%) |
Employment Occupations by Sex in Graham County
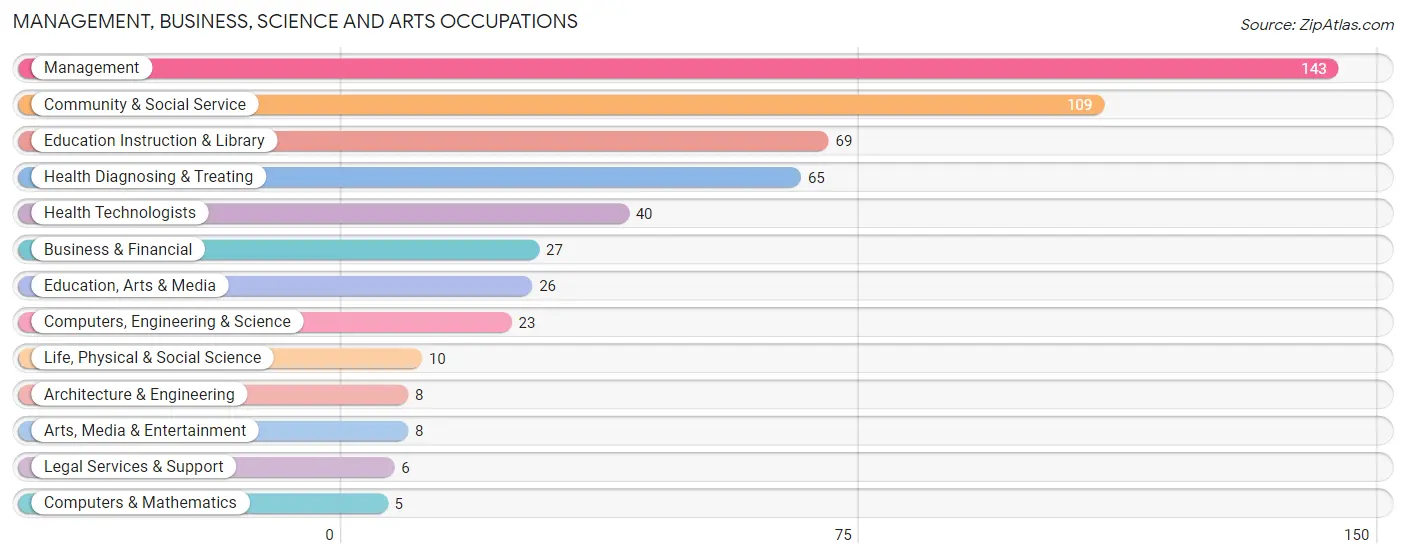
Management, Business, Science and Arts Occupations
The most common Management, Business, Science and Arts occupations in Graham County are Management (143 | 12.2%), Community & Social Service (109 | 9.3%), Education Instruction & Library (69 | 5.9%), Health Diagnosing & Treating (65 | 5.6%), and Health Technologists (40 | 3.4%).
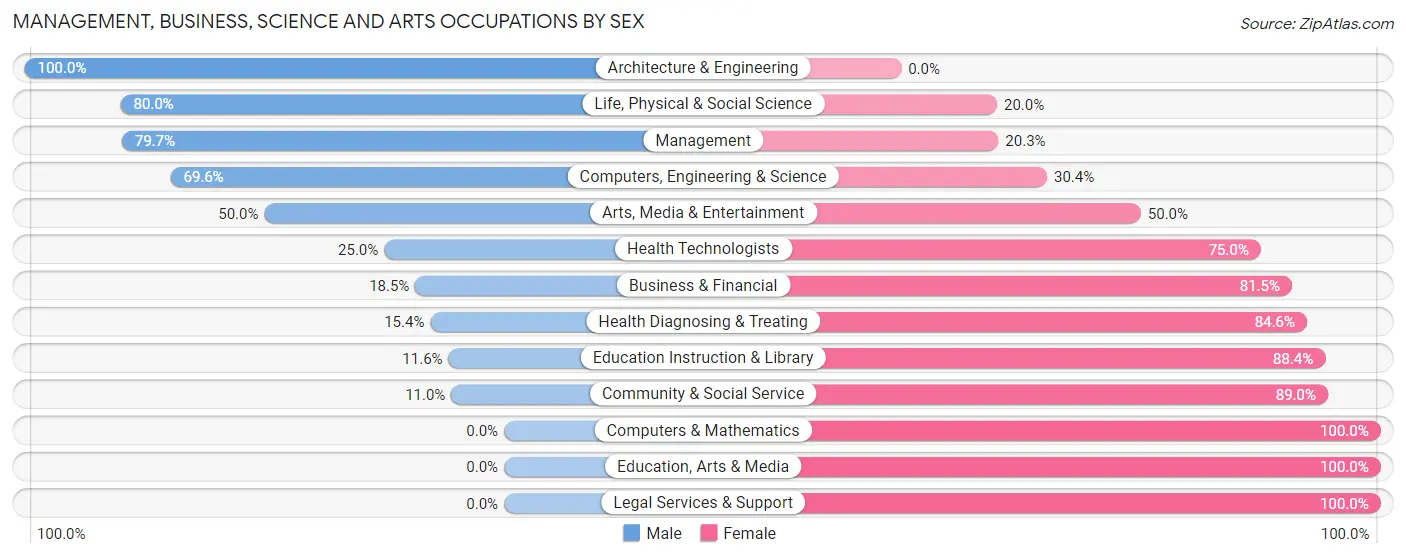
Management, Business, Science and Arts Occupations by Sex
Within the Management, Business, Science and Arts occupations in Graham County, the most male-oriented occupations are Architecture & Engineering (100.0%), Life, Physical & Social Science (80.0%), and Management (79.7%), while the most female-oriented occupations are Computers & Mathematics (100.0%), Education, Arts & Media (100.0%), and Legal Services & Support (100.0%).
| Occupation | Male | Female |
| Management | 114 (79.7%) | 29 (20.3%) |
| Business & Financial | 5 (18.5%) | 22 (81.5%) |
| Computers, Engineering & Science | 16 (69.6%) | 7 (30.4%) |
| Computers & Mathematics | 0 (0.0%) | 5 (100.0%) |
| Architecture & Engineering | 8 (100.0%) | 0 (0.0%) |
| Life, Physical & Social Science | 8 (80.0%) | 2 (20.0%) |
| Community & Social Service | 12 (11.0%) | 97 (89.0%) |
| Education, Arts & Media | 0 (0.0%) | 26 (100.0%) |
| Legal Services & Support | 0 (0.0%) | 6 (100.0%) |
| Education Instruction & Library | 8 (11.6%) | 61 (88.4%) |
| Arts, Media & Entertainment | 4 (50.0%) | 4 (50.0%) |
| Health Diagnosing & Treating | 10 (15.4%) | 55 (84.6%) |
| Health Technologists | 10 (25.0%) | 30 (75.0%) |
| Total (Category) | 157 (42.8%) | 210 (57.2%) |
| Total (Overall) | 609 (52.0%) | 562 (48.0%) |
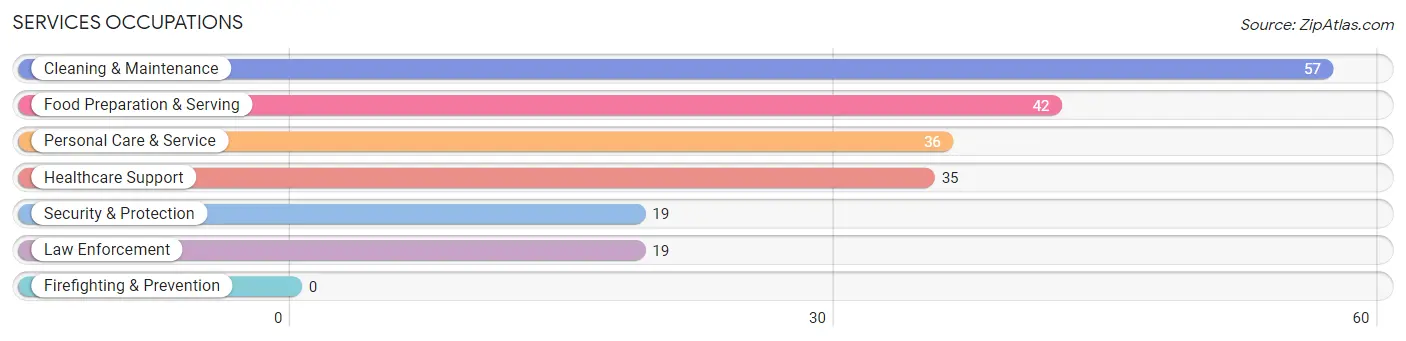
Services Occupations
The most common Services occupations in Graham County are Cleaning & Maintenance (57 | 4.9%), Food Preparation & Serving (42 | 3.6%), Personal Care & Service (36 | 3.1%), Healthcare Support (35 | 3.0%), and Security & Protection (19 | 1.6%).
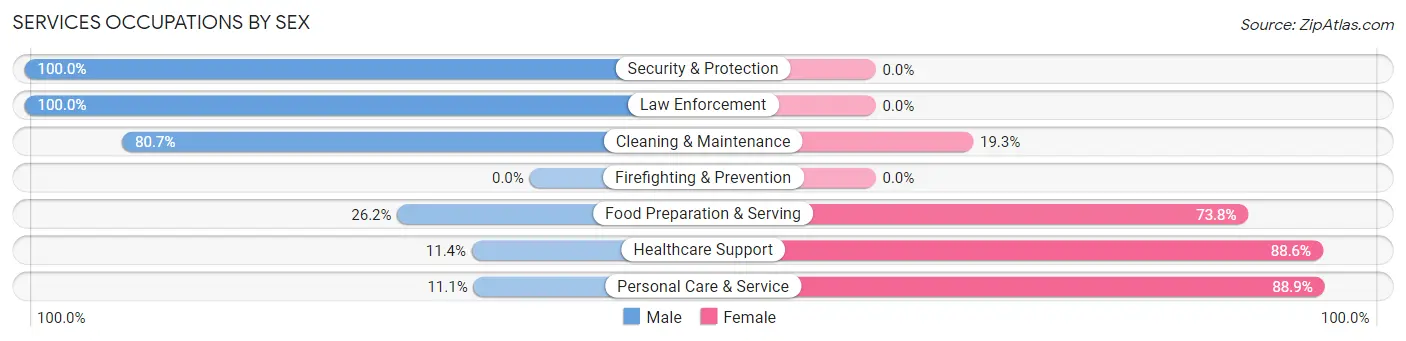
Services Occupations by Sex
Within the Services occupations in Graham County, the most male-oriented occupations are Security & Protection (100.0%), Law Enforcement (100.0%), and Cleaning & Maintenance (80.7%), while the most female-oriented occupations are Personal Care & Service (88.9%), Healthcare Support (88.6%), and Food Preparation & Serving (73.8%).
| Occupation | Male | Female |
| Healthcare Support | 4 (11.4%) | 31 (88.6%) |
| Security & Protection | 19 (100.0%) | 0 (0.0%) |
| Firefighting & Prevention | 0 (0.0%) | 0 (0.0%) |
| Law Enforcement | 19 (100.0%) | 0 (0.0%) |
| Food Preparation & Serving | 11 (26.2%) | 31 (73.8%) |
| Cleaning & Maintenance | 46 (80.7%) | 11 (19.3%) |
| Personal Care & Service | 4 (11.1%) | 32 (88.9%) |
| Total (Category) | 84 (44.4%) | 105 (55.6%) |
| Total (Overall) | 609 (52.0%) | 562 (48.0%) |
Sales and Office Occupations
The most common Sales and Office occupations in Graham County are Office & Administration (139 | 11.9%), and Sales & Related (121 | 10.3%).
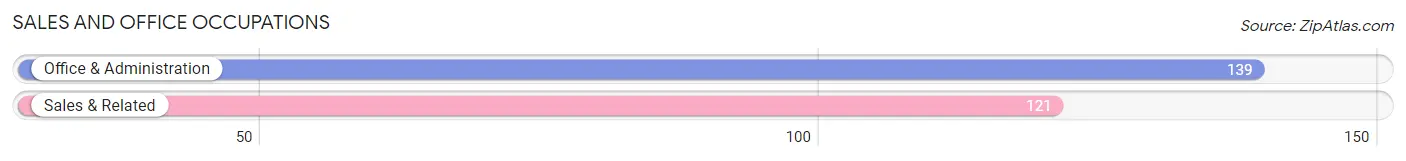
Sales and Office Occupations by Sex
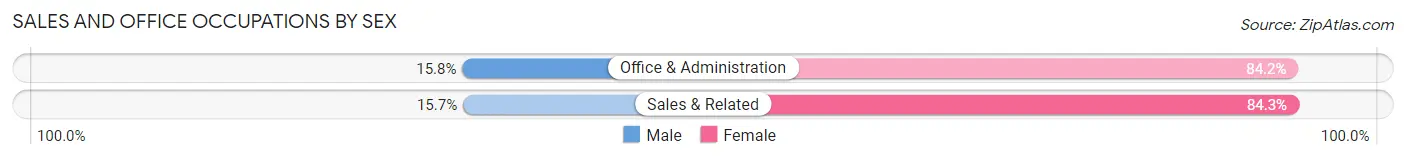
| Occupation | Male | Female |
| Sales & Related | 19 (15.7%) | 102 (84.3%) |
| Office & Administration | 22 (15.8%) | 117 (84.2%) |
| Total (Category) | 41 (15.8%) | 219 (84.2%) |
| Total (Overall) | 609 (52.0%) | 562 (48.0%) |
Natural Resources, Construction and Maintenance Occupations
The most common Natural Resources, Construction and Maintenance occupations in Graham County are Construction & Extraction (118 | 10.1%), Installation, Maintenance & Repair (54 | 4.6%), and Farming, Fishing & Forestry (16 | 1.4%).
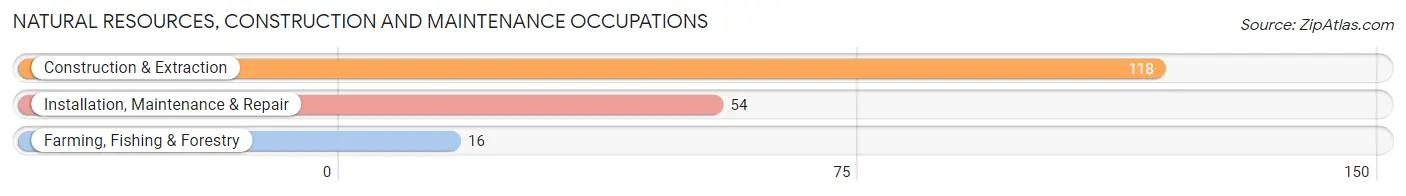
Natural Resources, Construction and Maintenance Occupations by Sex
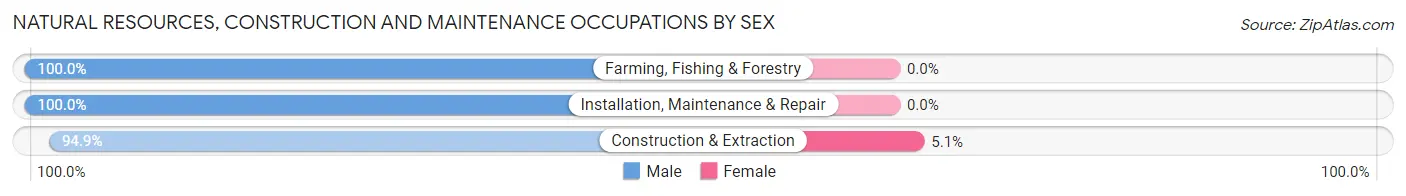
| Occupation | Male | Female |
| Farming, Fishing & Forestry | 16 (100.0%) | 0 (0.0%) |
| Construction & Extraction | 112 (94.9%) | 6 (5.1%) |
| Installation, Maintenance & Repair | 54 (100.0%) | 0 (0.0%) |
| Total (Category) | 182 (96.8%) | 6 (3.2%) |
| Total (Overall) | 609 (52.0%) | 562 (48.0%) |
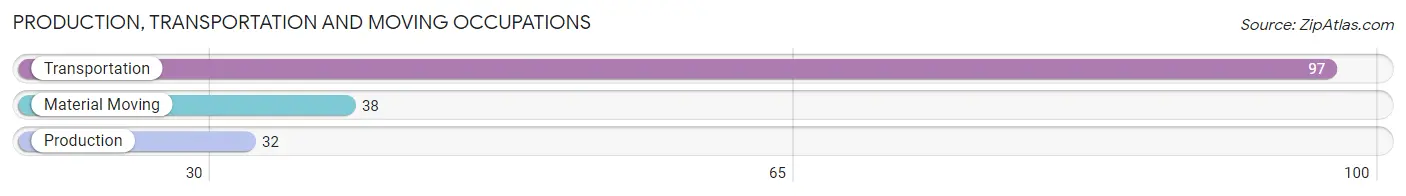
Production, Transportation and Moving Occupations
The most common Production, Transportation and Moving occupations in Graham County are Transportation (97 | 8.3%), Material Moving (38 | 3.3%), and Production (32 | 2.7%).
Production, Transportation and Moving Occupations by Sex
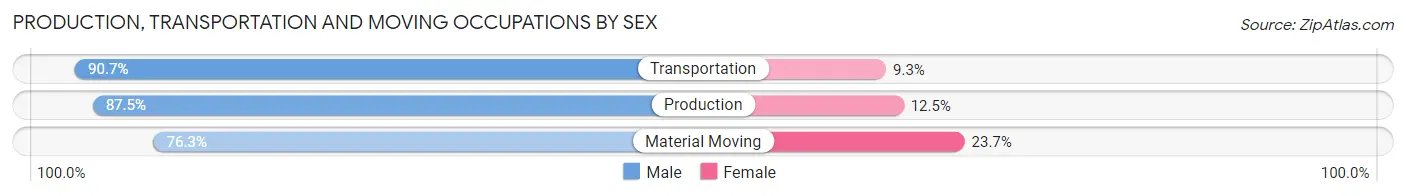
| Occupation | Male | Female |
| Production | 28 (87.5%) | 4 (12.5%) |
| Transportation | 88 (90.7%) | 9 (9.3%) |
| Material Moving | 29 (76.3%) | 9 (23.7%) |
| Total (Category) | 145 (86.8%) | 22 (13.2%) |
| Total (Overall) | 609 (52.0%) | 562 (48.0%) |
Employment Industries by Sex in Graham County
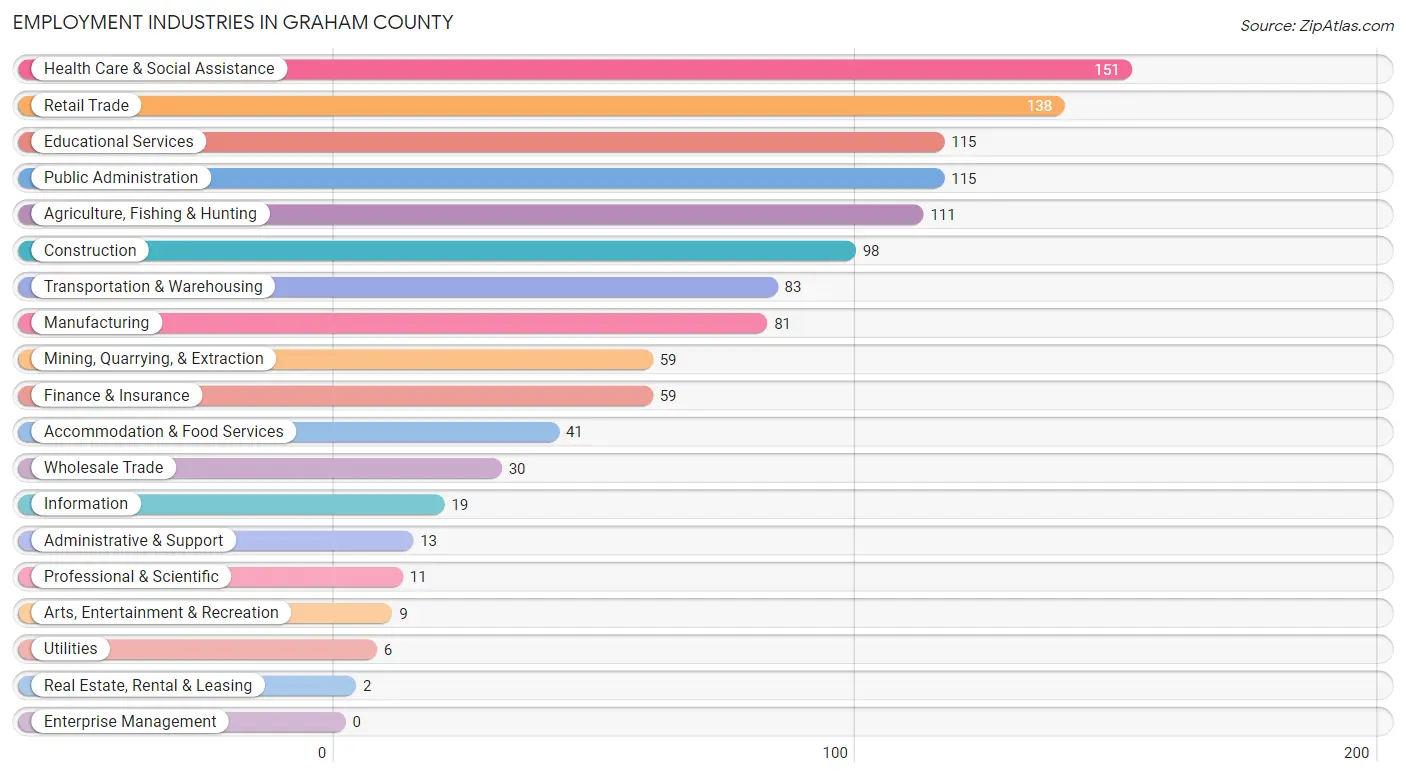
Employment Industries in Graham County
The major employment industries in Graham County include Health Care & Social Assistance (151 | 12.9%), Retail Trade (138 | 11.8%), Educational Services (115 | 9.8%), Public Administration (115 | 9.8%), and Agriculture, Fishing & Hunting (111 | 9.5%).
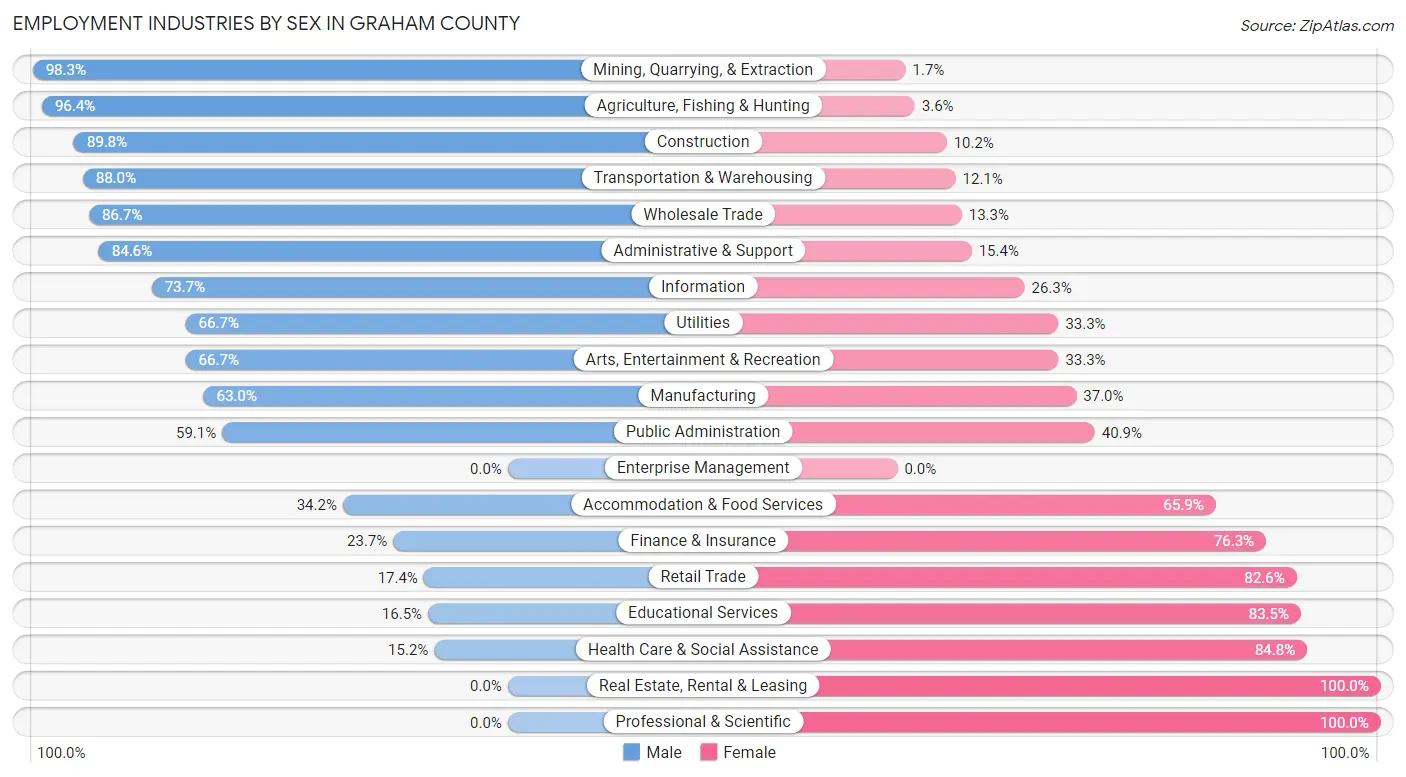
Employment Industries by Sex in Graham County
The Graham County industries that see more men than women are Mining, Quarrying, & Extraction (98.3%), Agriculture, Fishing & Hunting (96.4%), and Construction (89.8%), whereas the industries that tend to have a higher number of women are Real Estate, Rental & Leasing (100.0%), Professional & Scientific (100.0%), and Health Care & Social Assistance (84.8%).
| Industry | Male | Female |
| Agriculture, Fishing & Hunting | 107 (96.4%) | 4 (3.6%) |
| Mining, Quarrying, & Extraction | 58 (98.3%) | 1 (1.7%) |
| Construction | 88 (89.8%) | 10 (10.2%) |
| Manufacturing | 51 (63.0%) | 30 (37.0%) |
| Wholesale Trade | 26 (86.7%) | 4 (13.3%) |
| Retail Trade | 24 (17.4%) | 114 (82.6%) |
| Transportation & Warehousing | 73 (87.9%) | 10 (12.0%) |
| Utilities | 4 (66.7%) | 2 (33.3%) |
| Information | 14 (73.7%) | 5 (26.3%) |
| Finance & Insurance | 14 (23.7%) | 45 (76.3%) |
| Real Estate, Rental & Leasing | 0 (0.0%) | 2 (100.0%) |
| Professional & Scientific | 0 (0.0%) | 11 (100.0%) |
| Enterprise Management | 0 (0.0%) | 0 (0.0%) |
| Administrative & Support | 11 (84.6%) | 2 (15.4%) |
| Educational Services | 19 (16.5%) | 96 (83.5%) |
| Health Care & Social Assistance | 23 (15.2%) | 128 (84.8%) |
| Arts, Entertainment & Recreation | 6 (66.7%) | 3 (33.3%) |
| Accommodation & Food Services | 14 (34.2%) | 27 (65.8%) |
| Public Administration | 68 (59.1%) | 47 (40.9%) |
| Total | 609 (52.0%) | 562 (48.0%) |
Education in Graham County
School Enrollment in Graham County
The most common levels of schooling among the 518 students in Graham County are middle school (151 | 29.1%), high school (123 | 23.7%), and elementary school (94 | 18.1%).
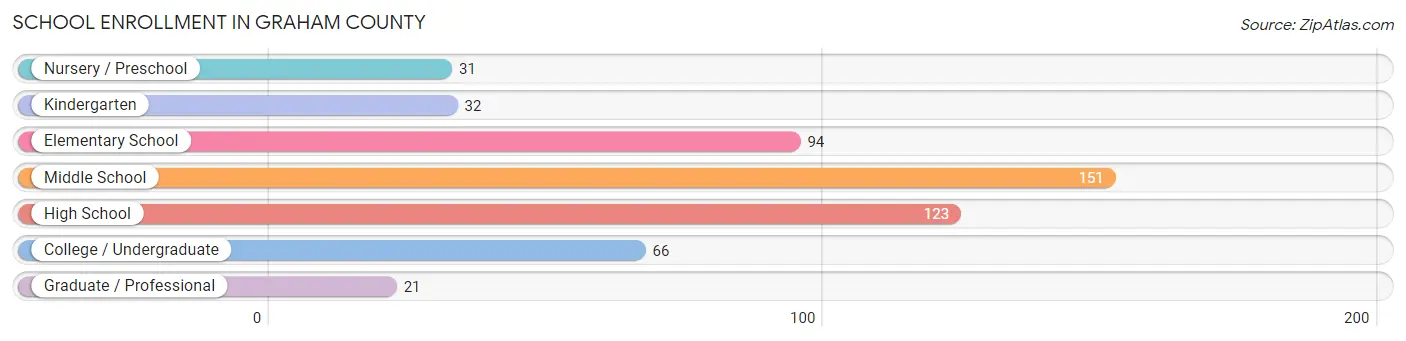
| School Level | # Students | % Students |
| Nursery / Preschool | 31 | 6.0% |
| Kindergarten | 32 | 6.2% |
| Elementary School | 94 | 18.1% |
| Middle School | 151 | 29.1% |
| High School | 123 | 23.7% |
| College / Undergraduate | 66 | 12.7% |
| Graduate / Professional | 21 | 4.1% |
| Total | 518 | 100.0% |
School Enrollment by Age by Funding Source in Graham County
Out of a total of 518 students who are enrolled in schools in Graham County, 61 (11.8%) attend a private institution, while the remaining 457 (88.2%) are enrolled in public schools. The age group of 35 years and over has the highest likelihood of being enrolled in private schools, with 10 (31.2% in the age bracket) enrolled. Conversely, the age group of 3 to 4 year olds has the lowest likelihood of being enrolled in a private school, with 22 (100.0% in the age bracket) attending a public institution.
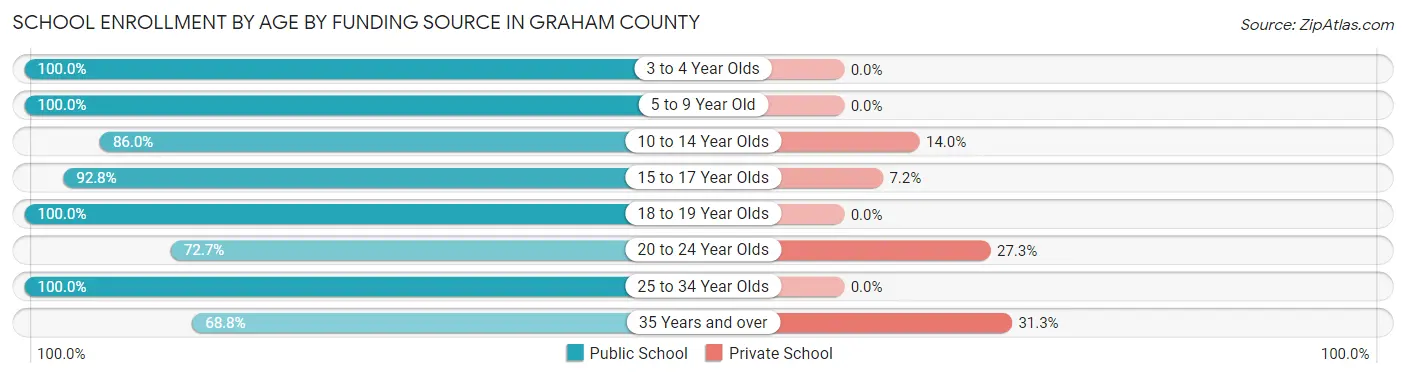
| Age Bracket | Public School | Private School |
| 3 to 4 Year Olds | 22 (100.0%) | 0 (0.0%) |
| 5 to 9 Year Old | 117 (100.0%) | 0 (0.0%) |
| 10 to 14 Year Olds | 147 (86.0%) | 24 (14.0%) |
| 15 to 17 Year Olds | 77 (92.8%) | 6 (7.2%) |
| 18 to 19 Year Olds | 12 (100.0%) | 0 (0.0%) |
| 20 to 24 Year Olds | 56 (72.7%) | 21 (27.3%) |
| 25 to 34 Year Olds | 4 (100.0%) | 0 (0.0%) |
| 35 Years and over | 22 (68.8%) | 10 (31.2%) |
| Total | 457 (88.2%) | 61 (11.8%) |
Educational Attainment by Field of Study in Graham County
Education (139 | 29.7%), bio, nature & agricultural (119 | 25.4%), science & technology (41 | 8.8%), business (35 | 7.5%), and social sciences (30 | 6.4%) are the most common fields of study among 468 individuals in Graham County who have obtained a bachelor's degree or higher.
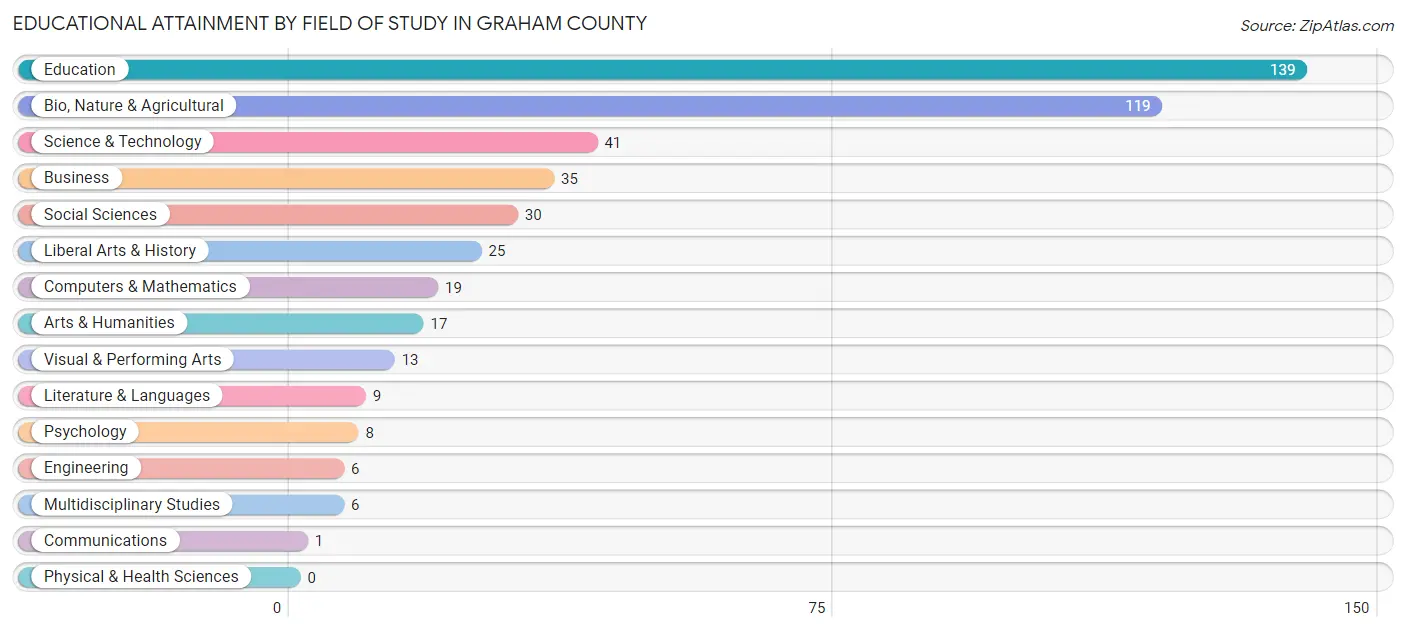
| Field of Study | # Graduates | % Graduates |
| Computers & Mathematics | 19 | 4.1% |
| Bio, Nature & Agricultural | 119 | 25.4% |
| Physical & Health Sciences | 0 | 0.0% |
| Psychology | 8 | 1.7% |
| Social Sciences | 30 | 6.4% |
| Engineering | 6 | 1.3% |
| Multidisciplinary Studies | 6 | 1.3% |
| Science & Technology | 41 | 8.8% |
| Business | 35 | 7.5% |
| Education | 139 | 29.7% |
| Literature & Languages | 9 | 1.9% |
| Liberal Arts & History | 25 | 5.3% |
| Visual & Performing Arts | 13 | 2.8% |
| Communications | 1 | 0.2% |
| Arts & Humanities | 17 | 3.6% |
| Total | 468 | 100.0% |
Transportation & Commute in Graham County
Vehicle Availability by Sex in Graham County
The most prevalent vehicle ownership categories in Graham County are males with 2 vehicles (203, accounting for 34.9%) and females with 2 vehicles (178, making up 37.1%).
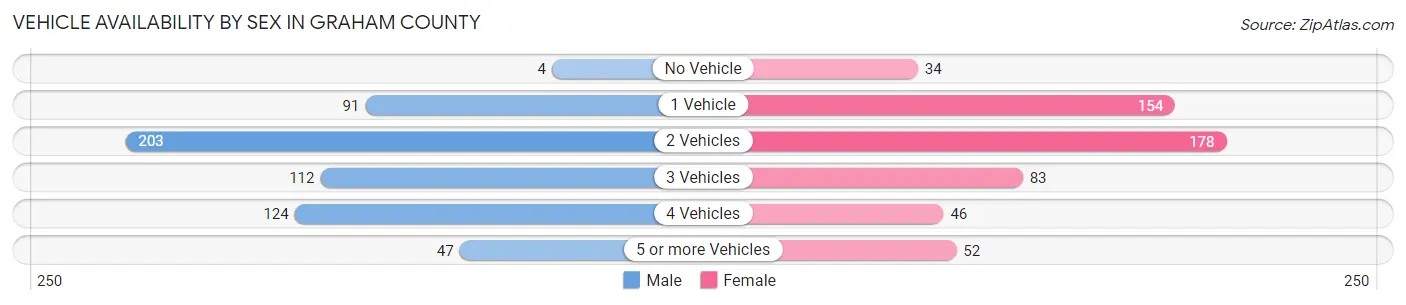
| Vehicles Available | Male | Female |
| No Vehicle | 4 (0.7%) | 34 (6.2%) |
| 1 Vehicle | 91 (15.7%) | 154 (28.1%) |
| 2 Vehicles | 203 (34.9%) | 178 (32.5%) |
| 3 Vehicles | 112 (19.3%) | 83 (15.2%) |
| 4 Vehicles | 124 (21.3%) | 46 (8.4%) |
| 5 or more Vehicles | 47 (8.1%) | 52 (9.5%) |
| Total | 581 (100.0%) | 547 (100.0%) |
Commute Time in Graham County
The most frequently occuring commute durations in Graham County are less than 5 minutes (371 commuters, 35.4%), 5 to 9 minutes (331 commuters, 31.6%), and 15 to 19 minutes (93 commuters, 8.9%).
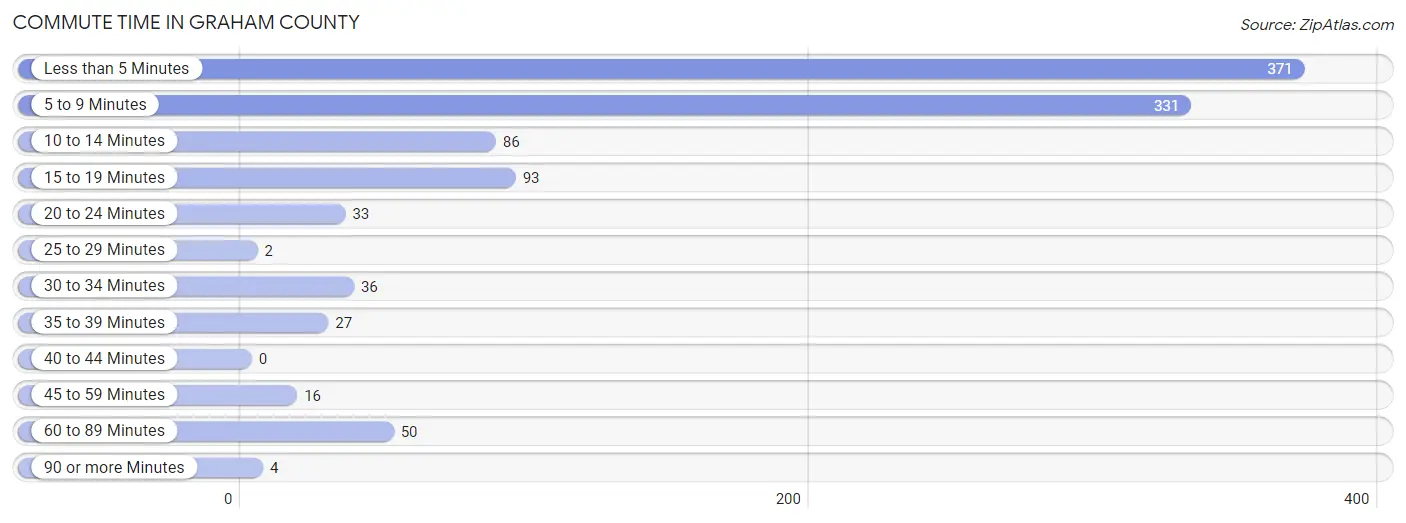
| Commute Time | # Commuters | % Commuters |
| Less than 5 Minutes | 371 | 35.4% |
| 5 to 9 Minutes | 331 | 31.6% |
| 10 to 14 Minutes | 86 | 8.2% |
| 15 to 19 Minutes | 93 | 8.9% |
| 20 to 24 Minutes | 33 | 3.2% |
| 25 to 29 Minutes | 2 | 0.2% |
| 30 to 34 Minutes | 36 | 3.4% |
| 35 to 39 Minutes | 27 | 2.6% |
| 40 to 44 Minutes | 0 | 0.0% |
| 45 to 59 Minutes | 16 | 1.5% |
| 60 to 89 Minutes | 50 | 4.8% |
| 90 or more Minutes | 4 | 0.4% |
Commute Time by Sex in Graham County
The most common commute times in Graham County are less than 5 minutes (188 commuters, 34.4%) for males and less than 5 minutes (183 commuters, 36.4%) for females.
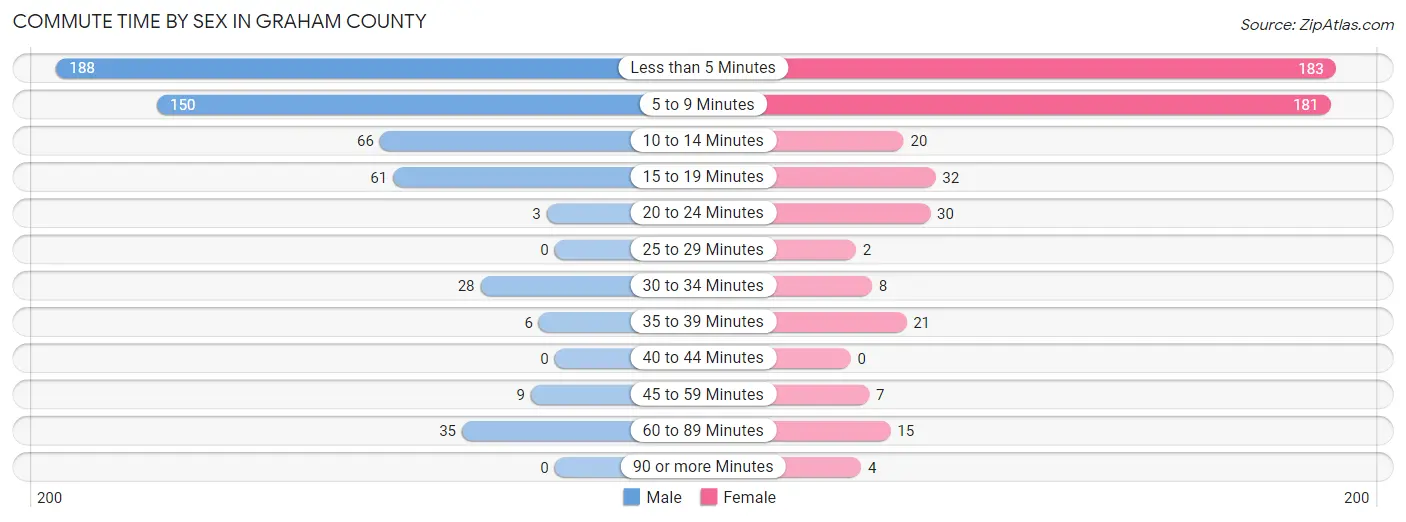
| Commute Time | Male | Female |
| Less than 5 Minutes | 188 (34.4%) | 183 (36.4%) |
| 5 to 9 Minutes | 150 (27.5%) | 181 (36.0%) |
| 10 to 14 Minutes | 66 (12.1%) | 20 (4.0%) |
| 15 to 19 Minutes | 61 (11.2%) | 32 (6.4%) |
| 20 to 24 Minutes | 3 (0.5%) | 30 (6.0%) |
| 25 to 29 Minutes | 0 (0.0%) | 2 (0.4%) |
| 30 to 34 Minutes | 28 (5.1%) | 8 (1.6%) |
| 35 to 39 Minutes | 6 (1.1%) | 21 (4.2%) |
| 40 to 44 Minutes | 0 (0.0%) | 0 (0.0%) |
| 45 to 59 Minutes | 9 (1.7%) | 7 (1.4%) |
| 60 to 89 Minutes | 35 (6.4%) | 15 (3.0%) |
| 90 or more Minutes | 0 (0.0%) | 4 (0.8%) |
Time of Departure to Work by Sex in Graham County
The most frequent times of departure to work in Graham County are 7:30 AM to 7:59 AM (196, 35.9%) for males and 7:30 AM to 7:59 AM (142, 28.2%) for females.
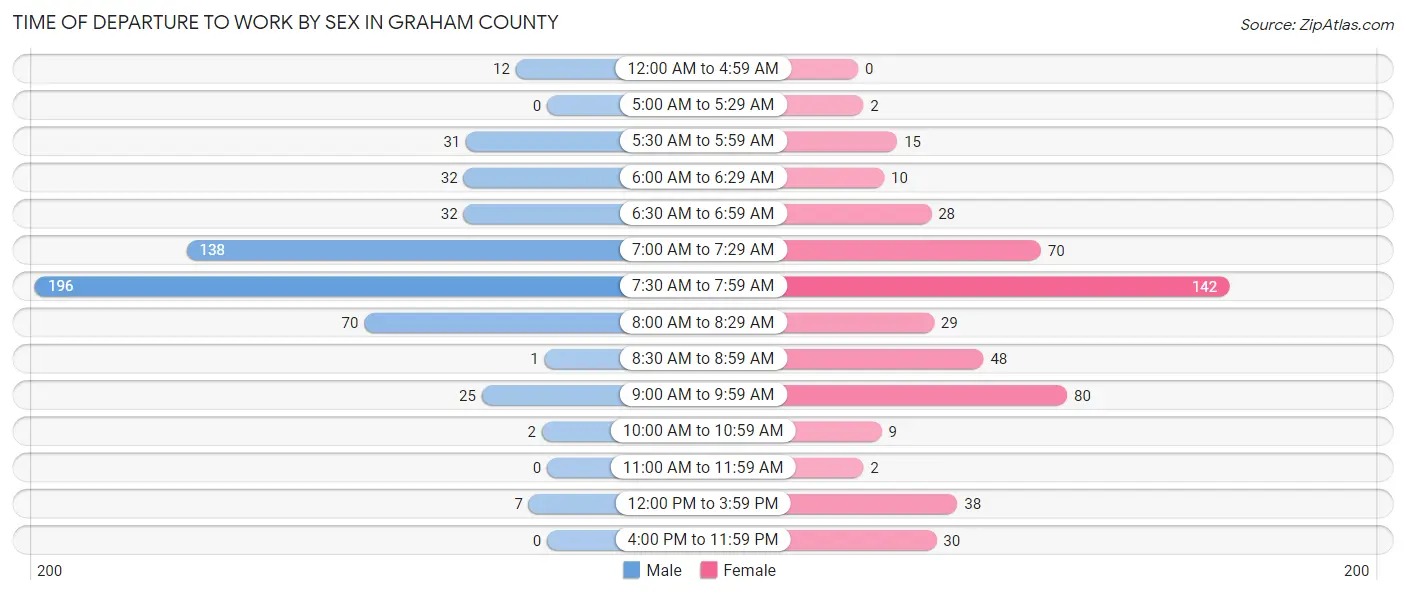
| Time of Departure | Male | Female |
| 12:00 AM to 4:59 AM | 12 (2.2%) | 0 (0.0%) |
| 5:00 AM to 5:29 AM | 0 (0.0%) | 2 (0.4%) |
| 5:30 AM to 5:59 AM | 31 (5.7%) | 15 (3.0%) |
| 6:00 AM to 6:29 AM | 32 (5.9%) | 10 (2.0%) |
| 6:30 AM to 6:59 AM | 32 (5.9%) | 28 (5.6%) |
| 7:00 AM to 7:29 AM | 138 (25.3%) | 70 (13.9%) |
| 7:30 AM to 7:59 AM | 196 (35.9%) | 142 (28.2%) |
| 8:00 AM to 8:29 AM | 70 (12.8%) | 29 (5.8%) |
| 8:30 AM to 8:59 AM | 1 (0.2%) | 48 (9.5%) |
| 9:00 AM to 9:59 AM | 25 (4.6%) | 80 (15.9%) |
| 10:00 AM to 10:59 AM | 2 (0.4%) | 9 (1.8%) |
| 11:00 AM to 11:59 AM | 0 (0.0%) | 2 (0.4%) |
| 12:00 PM to 3:59 PM | 7 (1.3%) | 38 (7.5%) |
| 4:00 PM to 11:59 PM | 0 (0.0%) | 30 (6.0%) |
| Total | 546 (100.0%) | 503 (100.0%) |
Housing Occupancy in Graham County
Occupancy by Ownership in Graham County
Of the total 1,200 dwellings in Graham County, owner-occupied units account for 977 (81.4%), while renter-occupied units make up 223 (18.6%).
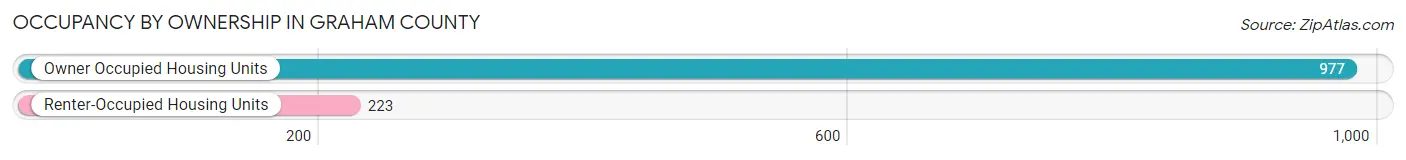
| Occupancy | # Housing Units | % Housing Units |
| Owner Occupied Housing Units | 977 | 81.4% |
| Renter-Occupied Housing Units | 223 | 18.6% |
| Total Occupied Housing Units | 1,200 | 100.0% |
Occupancy by Household Size in Graham County
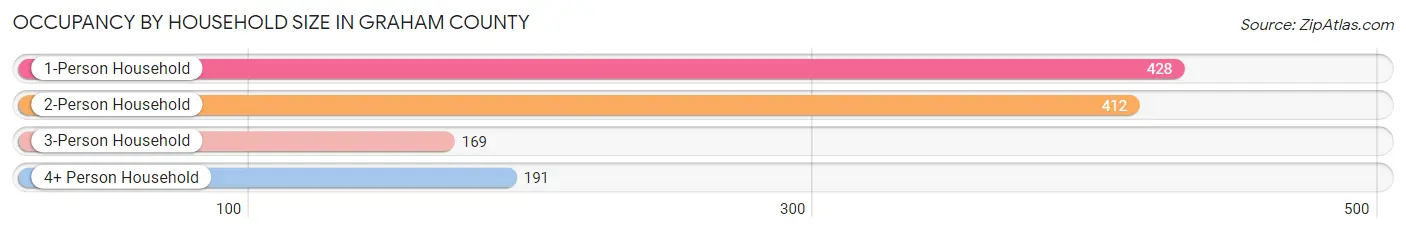
| Household Size | # Housing Units | % Housing Units |
| 1-Person Household | 428 | 35.7% |
| 2-Person Household | 412 | 34.3% |
| 3-Person Household | 169 | 14.1% |
| 4+ Person Household | 191 | 15.9% |
| Total Housing Units | 1,200 | 100.0% |
Occupancy by Ownership by Household Size in Graham County
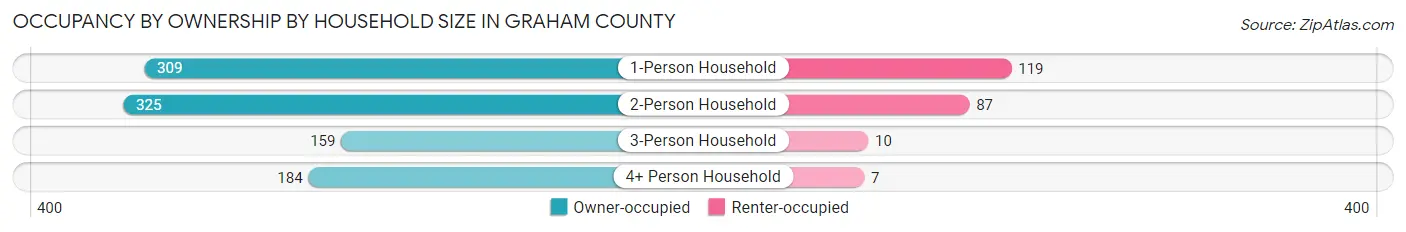
| Household Size | Owner-occupied | Renter-occupied |
| 1-Person Household | 309 (72.2%) | 119 (27.8%) |
| 2-Person Household | 325 (78.9%) | 87 (21.1%) |
| 3-Person Household | 159 (94.1%) | 10 (5.9%) |
| 4+ Person Household | 184 (96.3%) | 7 (3.7%) |
| Total Housing Units | 977 (81.4%) | 223 (18.6%) |
Occupancy by Educational Attainment in Graham County
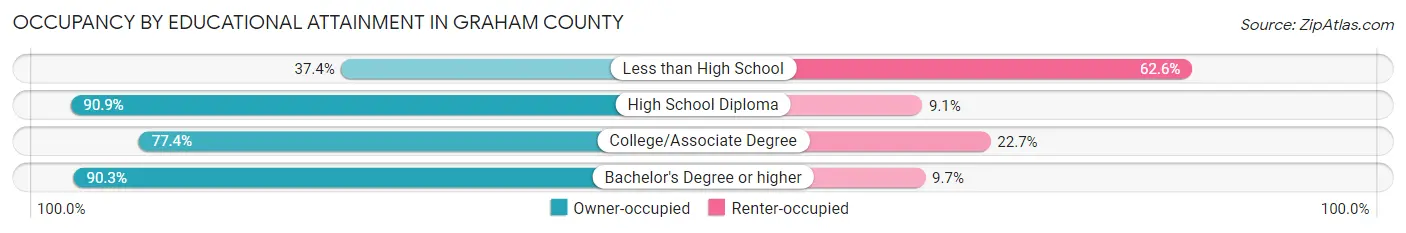
| Household Size | Owner-occupied | Renter-occupied |
| Less than High School | 34 (37.4%) | 57 (62.6%) |
| High School Diploma | 330 (90.9%) | 33 (9.1%) |
| College/Associate Degree | 362 (77.3%) | 106 (22.7%) |
| Bachelor's Degree or higher | 251 (90.3%) | 27 (9.7%) |
Occupancy by Age of Householder in Graham County
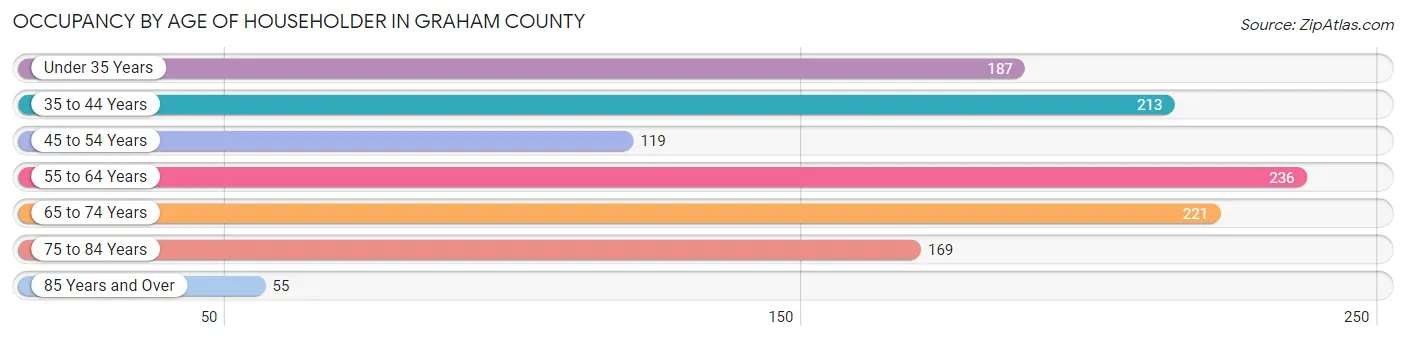
| Age Bracket | # Households | % Households |
| Under 35 Years | 187 | 15.6% |
| 35 to 44 Years | 213 | 17.7% |
| 45 to 54 Years | 119 | 9.9% |
| 55 to 64 Years | 236 | 19.7% |
| 65 to 74 Years | 221 | 18.4% |
| 75 to 84 Years | 169 | 14.1% |
| 85 Years and Over | 55 | 4.6% |
| Total | 1,200 | 100.0% |
Housing Finances in Graham County
Median Income by Occupancy in Graham County
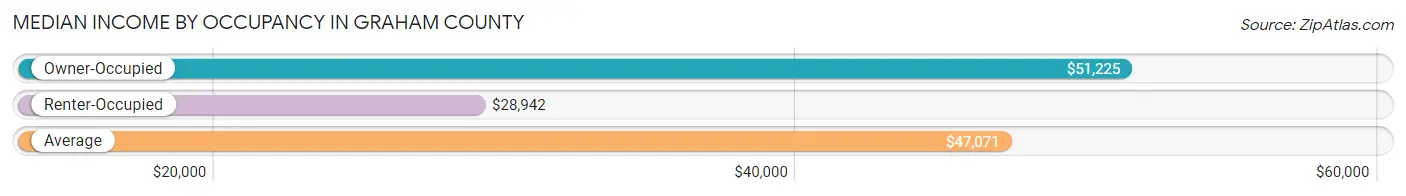
| Occupancy Type | # Households | Median Income |
| Owner-Occupied | 977 (81.4%) | $51,225 |
| Renter-Occupied | 223 (18.6%) | $28,942 |
| Average | 1,200 (100.0%) | $47,071 |
Occupancy by Householder Income Bracket in Graham County
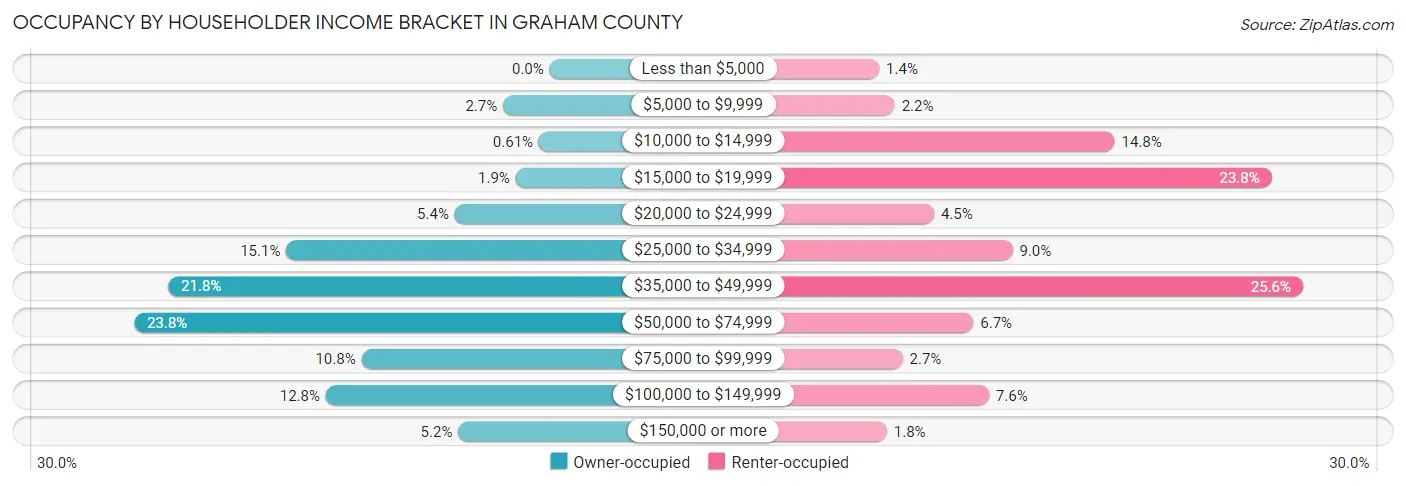
| Income Bracket | Owner-occupied | Renter-occupied |
| Less than $5,000 | 0 (0.0%) | 3 (1.3%) |
| $5,000 to $9,999 | 26 (2.7%) | 5 (2.2%) |
| $10,000 to $14,999 | 6 (0.6%) | 33 (14.8%) |
| $15,000 to $19,999 | 19 (1.9%) | 53 (23.8%) |
| $20,000 to $24,999 | 53 (5.4%) | 10 (4.5%) |
| $25,000 to $34,999 | 147 (15.0%) | 20 (9.0%) |
| $35,000 to $49,999 | 213 (21.8%) | 57 (25.6%) |
| $50,000 to $74,999 | 232 (23.7%) | 15 (6.7%) |
| $75,000 to $99,999 | 105 (10.7%) | 6 (2.7%) |
| $100,000 to $149,999 | 125 (12.8%) | 17 (7.6%) |
| $150,000 or more | 51 (5.2%) | 4 (1.8%) |
| Total | 977 (100.0%) | 223 (100.0%) |
Monthly Housing Cost Tiers in Graham County
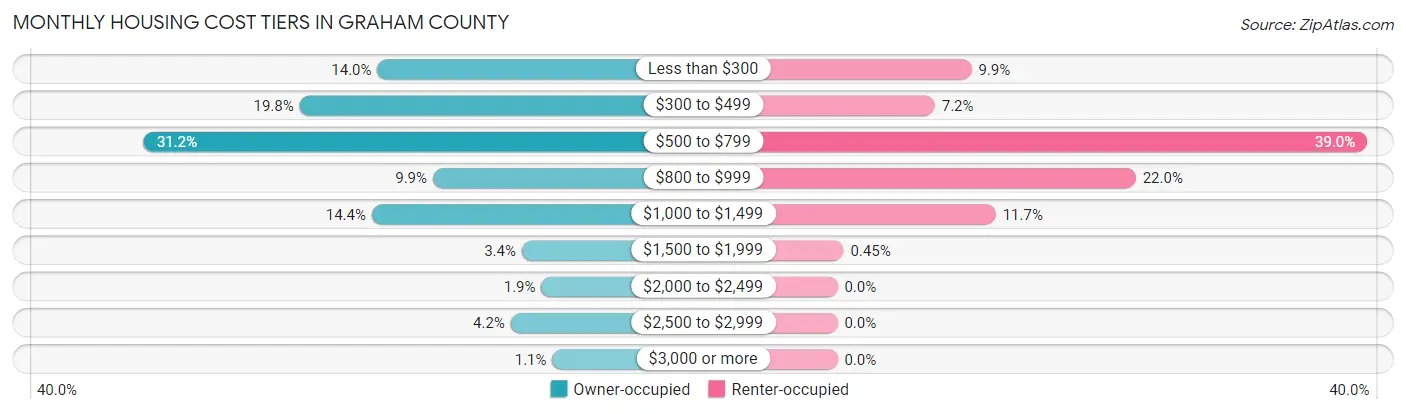
| Monthly Cost | Owner-occupied | Renter-occupied |
| Less than $300 | 137 (14.0%) | 22 (9.9%) |
| $300 to $499 | 193 (19.8%) | 16 (7.2%) |
| $500 to $799 | 305 (31.2%) | 87 (39.0%) |
| $800 to $999 | 97 (9.9%) | 49 (22.0%) |
| $1,000 to $1,499 | 141 (14.4%) | 26 (11.7%) |
| $1,500 to $1,999 | 33 (3.4%) | 1 (0.4%) |
| $2,000 to $2,499 | 19 (1.9%) | 0 (0.0%) |
| $2,500 to $2,999 | 41 (4.2%) | 0 (0.0%) |
| $3,000 or more | 11 (1.1%) | 0 (0.0%) |
| Total | 977 (100.0%) | 223 (100.0%) |
Physical Housing Characteristics in Graham County
Housing Structures in Graham County
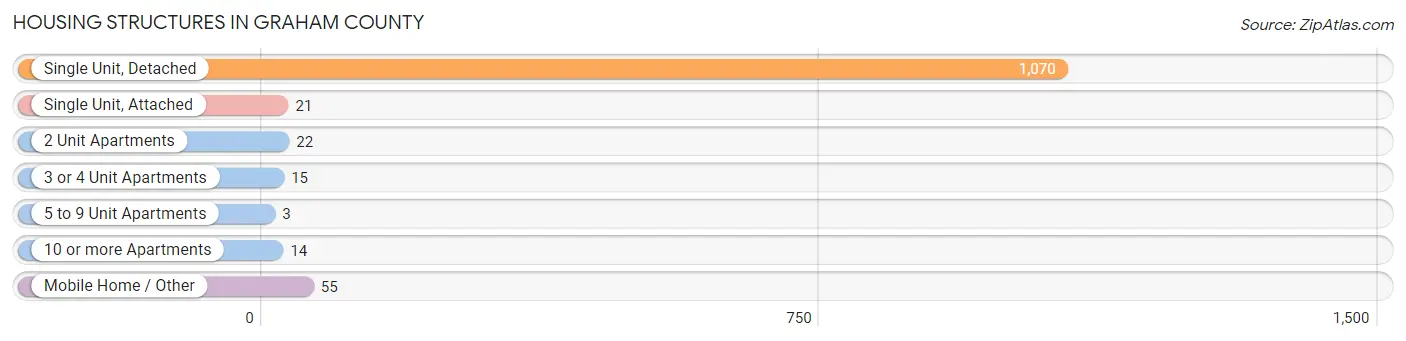
| Structure Type | # Housing Units | % Housing Units |
| Single Unit, Detached | 1,070 | 89.2% |
| Single Unit, Attached | 21 | 1.8% |
| 2 Unit Apartments | 22 | 1.8% |
| 3 or 4 Unit Apartments | 15 | 1.3% |
| 5 to 9 Unit Apartments | 3 | 0.3% |
| 10 or more Apartments | 14 | 1.2% |
| Mobile Home / Other | 55 | 4.6% |
| Total | 1,200 | 100.0% |
Housing Structures by Occupancy in Graham County
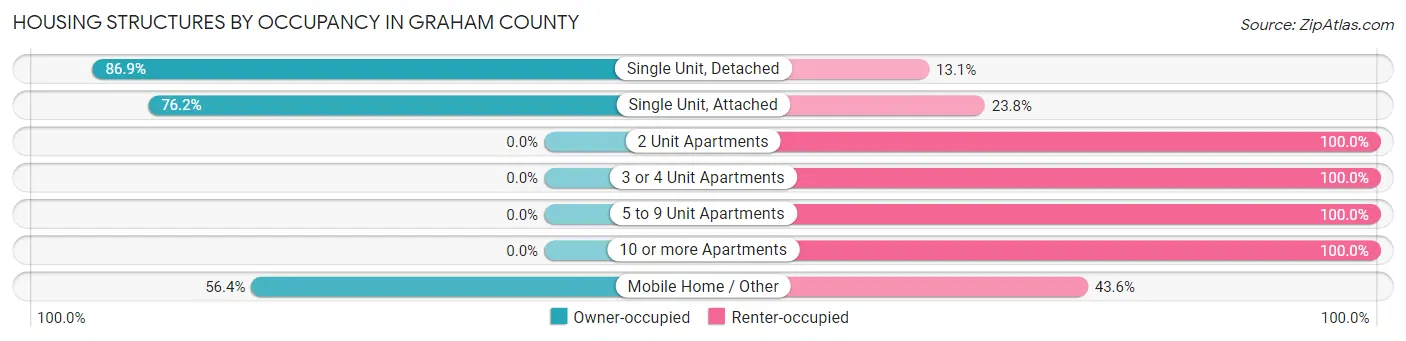
| Structure Type | Owner-occupied | Renter-occupied |
| Single Unit, Detached | 930 (86.9%) | 140 (13.1%) |
| Single Unit, Attached | 16 (76.2%) | 5 (23.8%) |
| 2 Unit Apartments | 0 (0.0%) | 22 (100.0%) |
| 3 or 4 Unit Apartments | 0 (0.0%) | 15 (100.0%) |
| 5 to 9 Unit Apartments | 0 (0.0%) | 3 (100.0%) |
| 10 or more Apartments | 0 (0.0%) | 14 (100.0%) |
| Mobile Home / Other | 31 (56.4%) | 24 (43.6%) |
| Total | 977 (81.4%) | 223 (18.6%) |
Housing Structures by Number of Rooms in Graham County
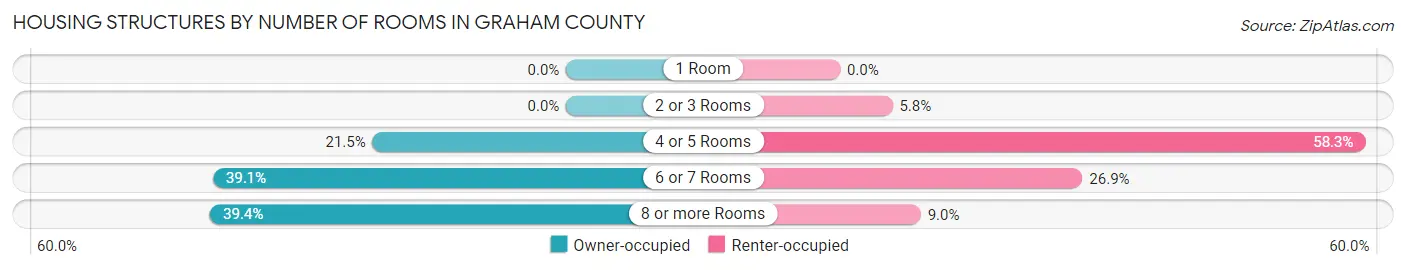
| Number of Rooms | Owner-occupied | Renter-occupied |
| 1 Room | 0 (0.0%) | 0 (0.0%) |
| 2 or 3 Rooms | 0 (0.0%) | 13 (5.8%) |
| 4 or 5 Rooms | 210 (21.5%) | 130 (58.3%) |
| 6 or 7 Rooms | 382 (39.1%) | 60 (26.9%) |
| 8 or more Rooms | 385 (39.4%) | 20 (9.0%) |
| Total | 977 (100.0%) | 223 (100.0%) |
Housing Structure by Heating Type in Graham County
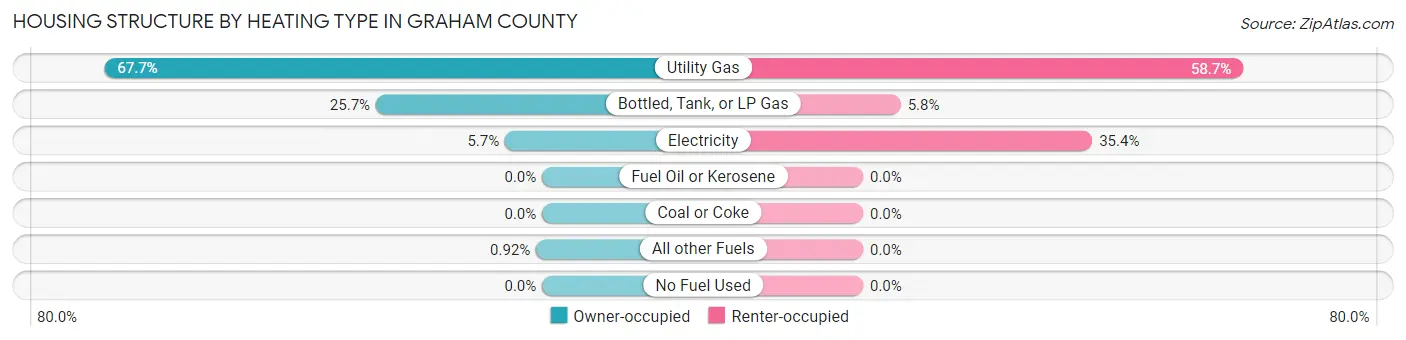
| Heating Type | Owner-occupied | Renter-occupied |
| Utility Gas | 661 (67.7%) | 131 (58.7%) |
| Bottled, Tank, or LP Gas | 251 (25.7%) | 13 (5.8%) |
| Electricity | 56 (5.7%) | 79 (35.4%) |
| Fuel Oil or Kerosene | 0 (0.0%) | 0 (0.0%) |
| Coal or Coke | 0 (0.0%) | 0 (0.0%) |
| All other Fuels | 9 (0.9%) | 0 (0.0%) |
| No Fuel Used | 0 (0.0%) | 0 (0.0%) |
| Total | 977 (100.0%) | 223 (100.0%) |
Household Vehicle Usage in Graham County
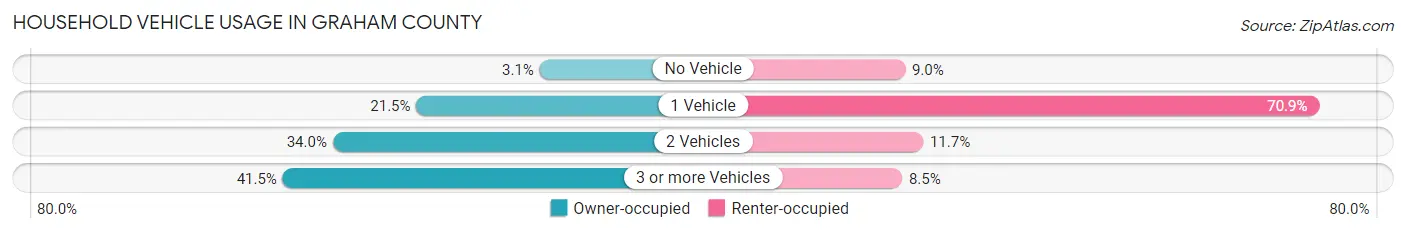
| Vehicles per Household | Owner-occupied | Renter-occupied |
| No Vehicle | 30 (3.1%) | 20 (9.0%) |
| 1 Vehicle | 210 (21.5%) | 158 (70.9%) |
| 2 Vehicles | 332 (34.0%) | 26 (11.7%) |
| 3 or more Vehicles | 405 (41.4%) | 19 (8.5%) |
| Total | 977 (100.0%) | 223 (100.0%) |
Real Estate & Mortgages in Graham County
Real Estate and Mortgage Overview in Graham County
| Characteristic | Without Mortgage | With Mortgage |
| Housing Units | 666 | 311 |
| Median Property Value | $69,300 | $100,400 |
| Median Household Income | $50,000 | $15 |
| Monthly Housing Costs | $508 | $11 |
| Real Estate Taxes | $1,218 | $0 |
Property Value by Mortgage Status in Graham County
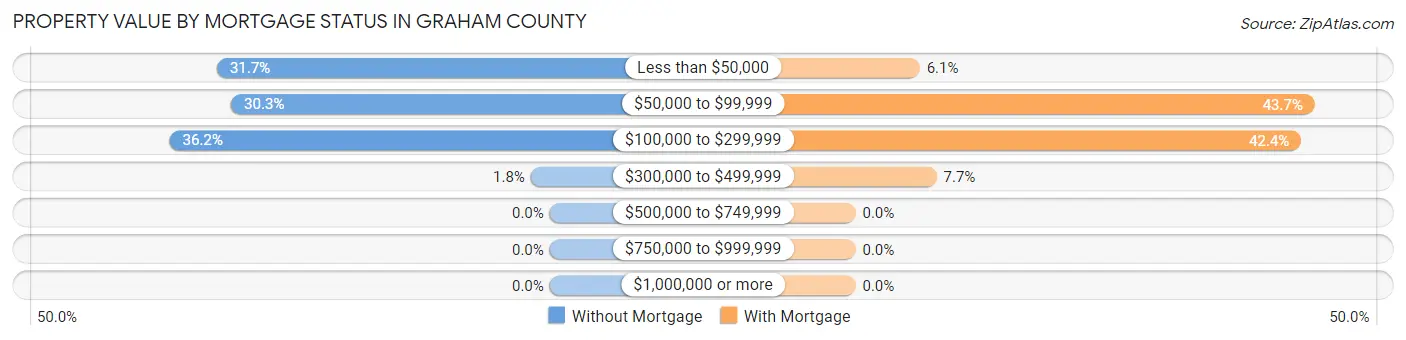
| Property Value | Without Mortgage | With Mortgage |
| Less than $50,000 | 211 (31.7%) | 19 (6.1%) |
| $50,000 to $99,999 | 202 (30.3%) | 136 (43.7%) |
| $100,000 to $299,999 | 241 (36.2%) | 132 (42.4%) |
| $300,000 to $499,999 | 12 (1.8%) | 24 (7.7%) |
| $500,000 to $749,999 | 0 (0.0%) | 0 (0.0%) |
| $750,000 to $999,999 | 0 (0.0%) | 0 (0.0%) |
| $1,000,000 or more | 0 (0.0%) | 0 (0.0%) |
| Total | 666 (100.0%) | 311 (100.0%) |
Household Income by Mortgage Status in Graham County
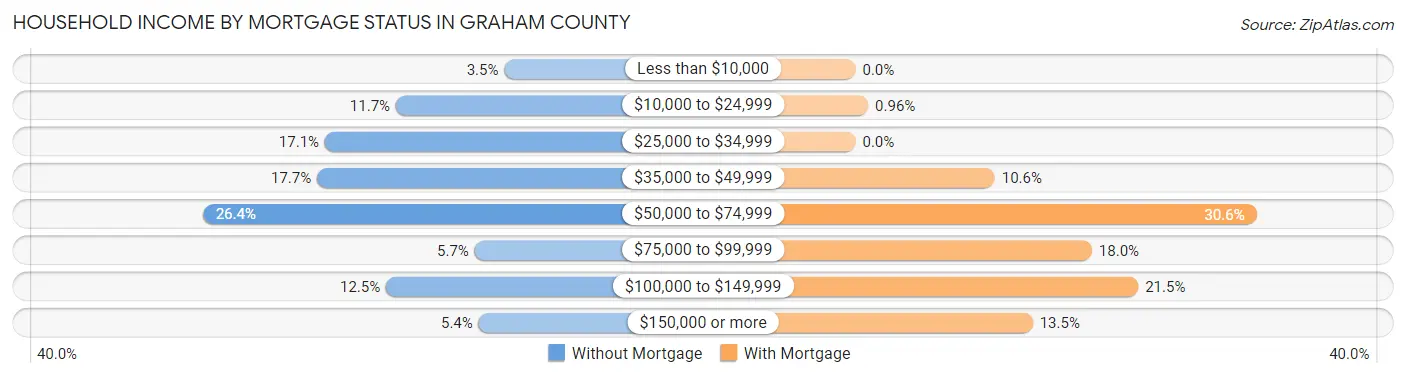
| Household Income | Without Mortgage | With Mortgage |
| Less than $10,000 | 23 (3.5%) | 0 (0.0%) |
| $10,000 to $24,999 | 78 (11.7%) | 3 (1.0%) |
| $25,000 to $34,999 | 114 (17.1%) | 0 (0.0%) |
| $35,000 to $49,999 | 118 (17.7%) | 33 (10.6%) |
| $50,000 to $74,999 | 176 (26.4%) | 95 (30.5%) |
| $75,000 to $99,999 | 38 (5.7%) | 56 (18.0%) |
| $100,000 to $149,999 | 83 (12.5%) | 67 (21.5%) |
| $150,000 or more | 36 (5.4%) | 42 (13.5%) |
| Total | 666 (100.0%) | 311 (100.0%) |
Property Value to Household Income Ratio in Graham County
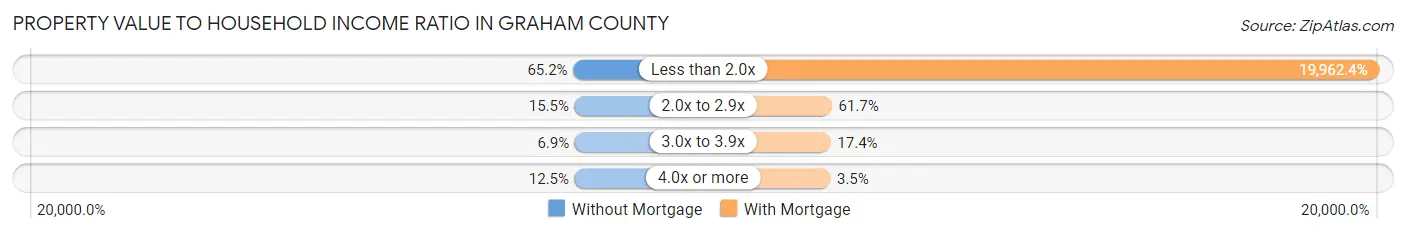
| Value-to-Income Ratio | Without Mortgage | With Mortgage |
| Less than 2.0x | 434 (65.2%) | 62,083 (19,962.4%) |
| 2.0x to 2.9x | 103 (15.5%) | 192 (61.7%) |
| 3.0x to 3.9x | 46 (6.9%) | 54 (17.4%) |
| 4.0x or more | 83 (12.5%) | 11 (3.5%) |
| Total | 666 (100.0%) | 311 (100.0%) |
Real Estate Taxes by Mortgage Status in Graham County
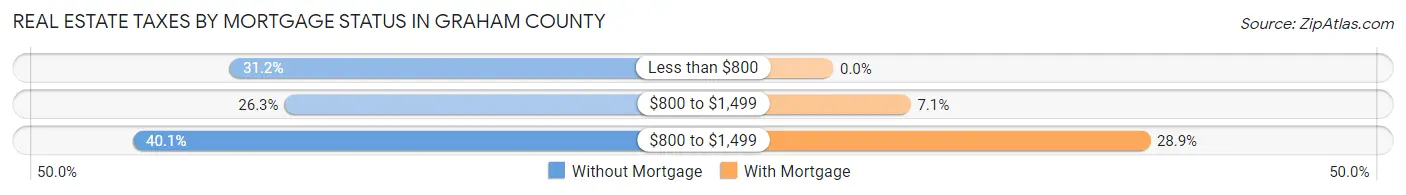
| Property Taxes | Without Mortgage | With Mortgage |
| Less than $800 | 208 (31.2%) | 0 (0.0%) |
| $800 to $1,499 | 175 (26.3%) | 22 (7.1%) |
| $800 to $1,499 | 267 (40.1%) | 90 (28.9%) |
| Total | 666 (100.0%) | 311 (100.0%) |
Health & Disability in Graham County
Health Insurance Coverage by Age in Graham County
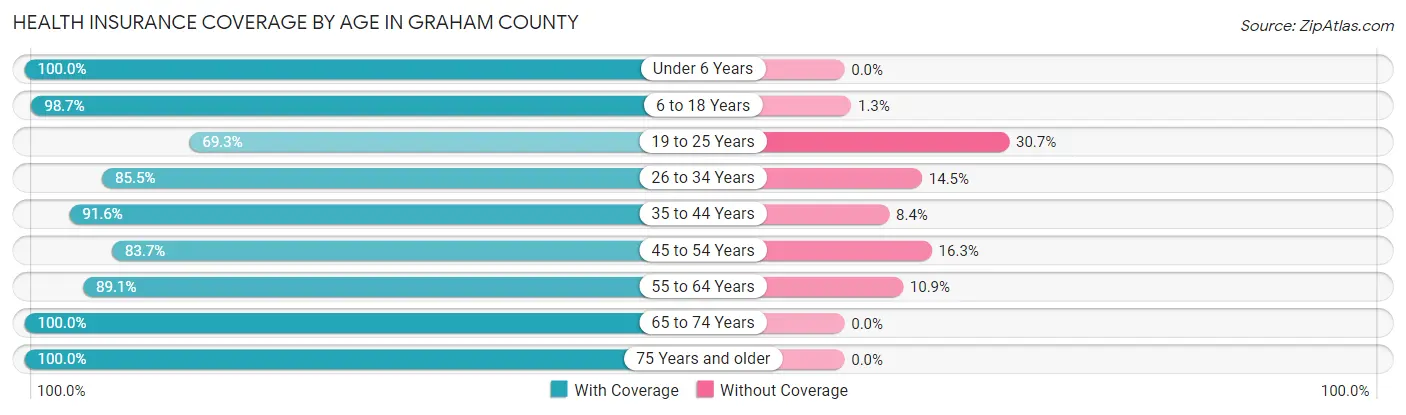
| Age Bracket | With Coverage | Without Coverage |
| Under 6 Years | 120 (100.0%) | 0 (0.0%) |
| 6 to 18 Years | 391 (98.7%) | 5 (1.3%) |
| 19 to 25 Years | 106 (69.3%) | 47 (30.7%) |
| 26 to 34 Years | 130 (85.5%) | 22 (14.5%) |
| 35 to 44 Years | 318 (91.6%) | 29 (8.4%) |
| 45 to 54 Years | 185 (83.7%) | 36 (16.3%) |
| 55 to 64 Years | 359 (89.1%) | 44 (10.9%) |
| 65 to 74 Years | 288 (100.0%) | 0 (0.0%) |
| 75 Years and older | 320 (100.0%) | 0 (0.0%) |
| Total | 2,217 (92.4%) | 183 (7.6%) |
Health Insurance Coverage by Citizenship Status in Graham County
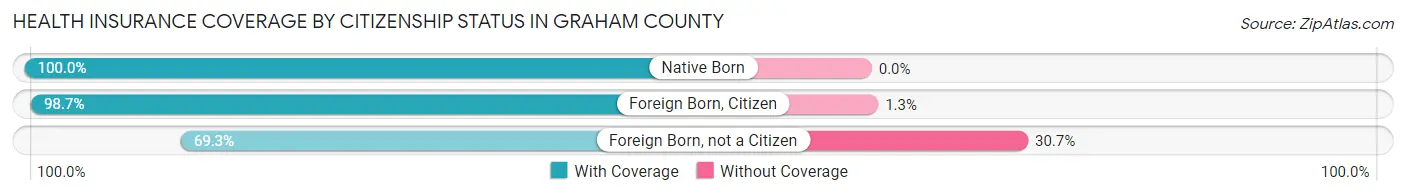
| Citizenship Status | With Coverage | Without Coverage |
| Native Born | 120 (100.0%) | 0 (0.0%) |
| Foreign Born, Citizen | 391 (98.7%) | 5 (1.3%) |
| Foreign Born, not a Citizen | 106 (69.3%) | 47 (30.7%) |
Health Insurance Coverage by Household Income in Graham County
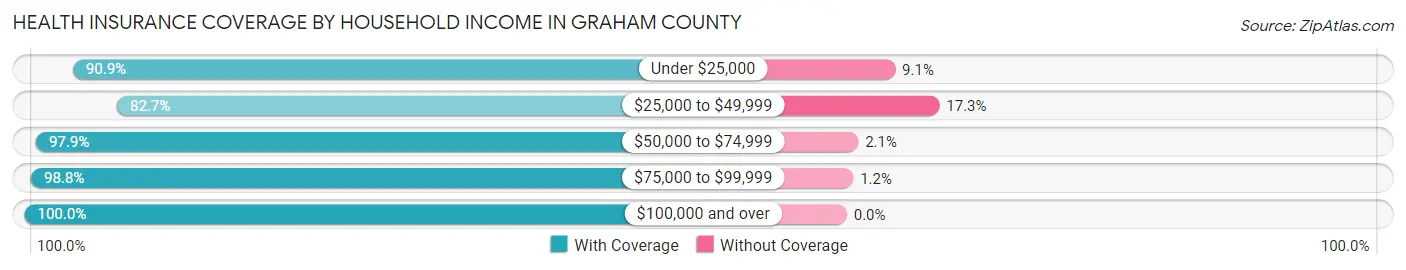
| Household Income | With Coverage | Without Coverage |
| Under $25,000 | 241 (90.9%) | 24 (9.1%) |
| $25,000 to $49,999 | 696 (82.7%) | 146 (17.3%) |
| $50,000 to $74,999 | 411 (97.9%) | 9 (2.1%) |
| $75,000 to $99,999 | 326 (98.8%) | 4 (1.2%) |
| $100,000 and over | 533 (100.0%) | 0 (0.0%) |
Public vs Private Health Insurance Coverage by Age in Graham County
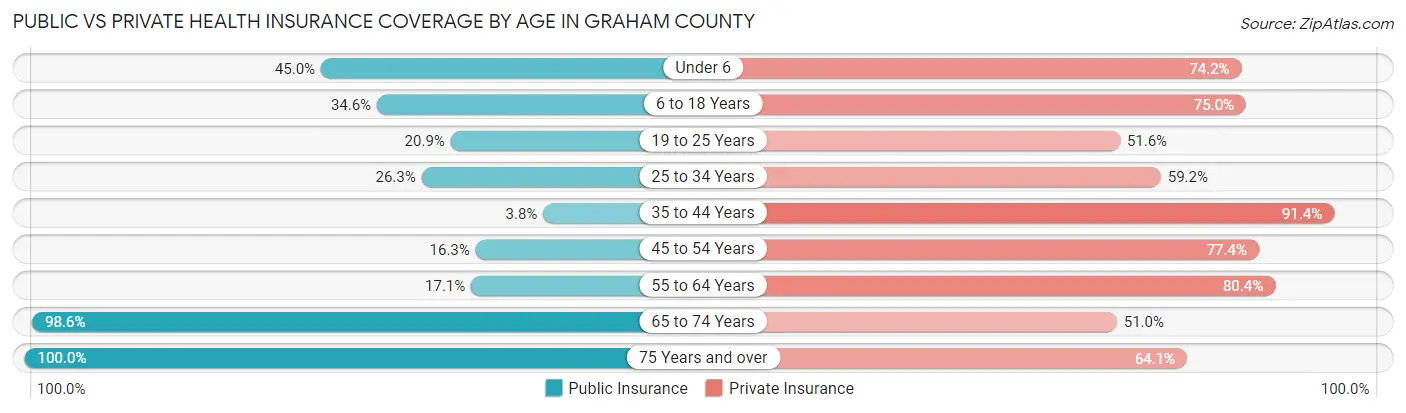
| Age Bracket | Public Insurance | Private Insurance |
| Under 6 | 54 (45.0%) | 89 (74.2%) |
| 6 to 18 Years | 137 (34.6%) | 297 (75.0%) |
| 19 to 25 Years | 32 (20.9%) | 79 (51.6%) |
| 25 to 34 Years | 40 (26.3%) | 90 (59.2%) |
| 35 to 44 Years | 13 (3.7%) | 317 (91.3%) |
| 45 to 54 Years | 36 (16.3%) | 171 (77.4%) |
| 55 to 64 Years | 69 (17.1%) | 324 (80.4%) |
| 65 to 74 Years | 284 (98.6%) | 147 (51.0%) |
| 75 Years and over | 320 (100.0%) | 205 (64.1%) |
| Total | 985 (41.0%) | 1,719 (71.6%) |
Disability Status by Sex by Age in Graham County
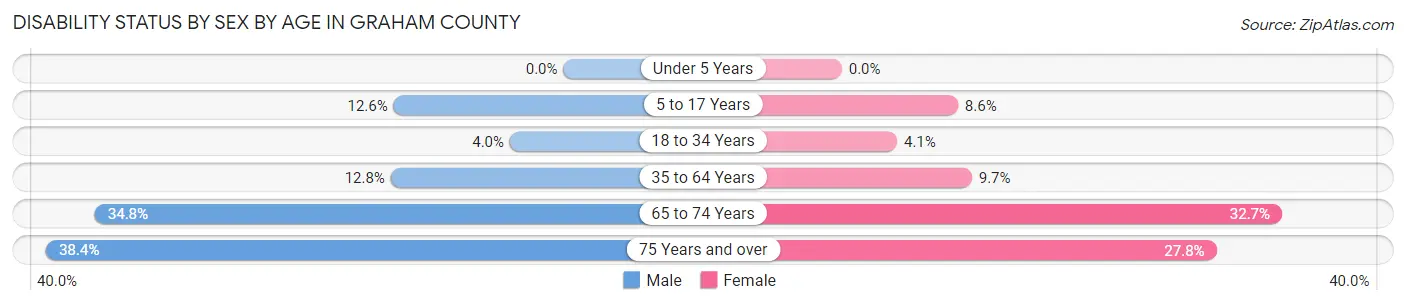
| Age Bracket | Male | Female |
| Under 5 Years | 0 (0.0%) | 0 (0.0%) |
| 5 to 17 Years | 28 (12.6%) | 15 (8.6%) |
| 18 to 34 Years | 5 (4.0%) | 8 (4.1%) |
| 35 to 64 Years | 66 (12.8%) | 44 (9.7%) |
| 65 to 74 Years | 48 (34.8%) | 49 (32.7%) |
| 75 Years and over | 58 (38.4%) | 47 (27.8%) |
Disability Class by Sex by Age in Graham County
Disability Class: Hearing Difficulty
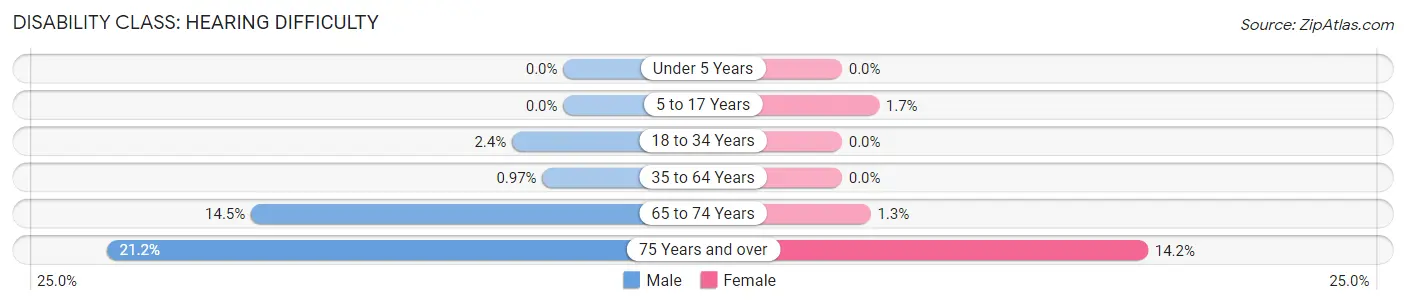
| Age Bracket | Male | Female |
| Under 5 Years | 0 (0.0%) | 0 (0.0%) |
| 5 to 17 Years | 0 (0.0%) | 3 (1.7%) |
| 18 to 34 Years | 3 (2.4%) | 0 (0.0%) |
| 35 to 64 Years | 5 (1.0%) | 0 (0.0%) |
| 65 to 74 Years | 20 (14.5%) | 2 (1.3%) |
| 75 Years and over | 32 (21.2%) | 24 (14.2%) |
Disability Class: Vision Difficulty
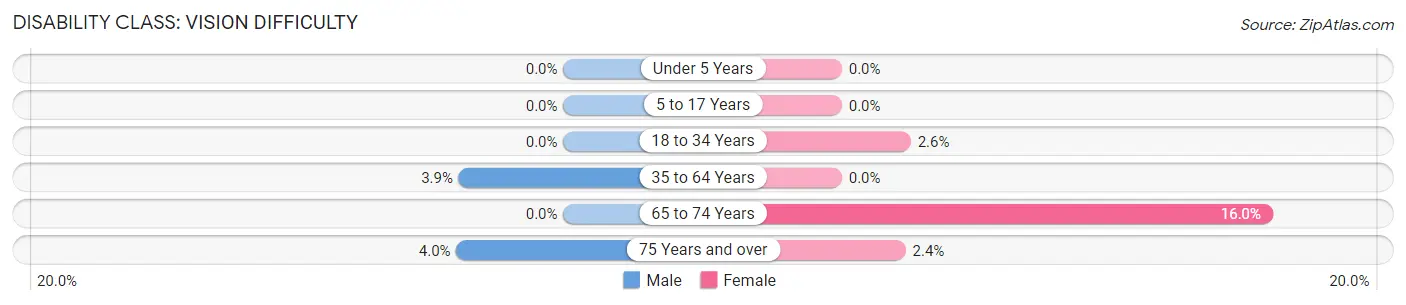
| Age Bracket | Male | Female |
| Under 5 Years | 0 (0.0%) | 0 (0.0%) |
| 5 to 17 Years | 0 (0.0%) | 0 (0.0%) |
| 18 to 34 Years | 0 (0.0%) | 5 (2.6%) |
| 35 to 64 Years | 20 (3.9%) | 0 (0.0%) |
| 65 to 74 Years | 0 (0.0%) | 24 (16.0%) |
| 75 Years and over | 6 (4.0%) | 4 (2.4%) |
Disability Class: Cognitive Difficulty
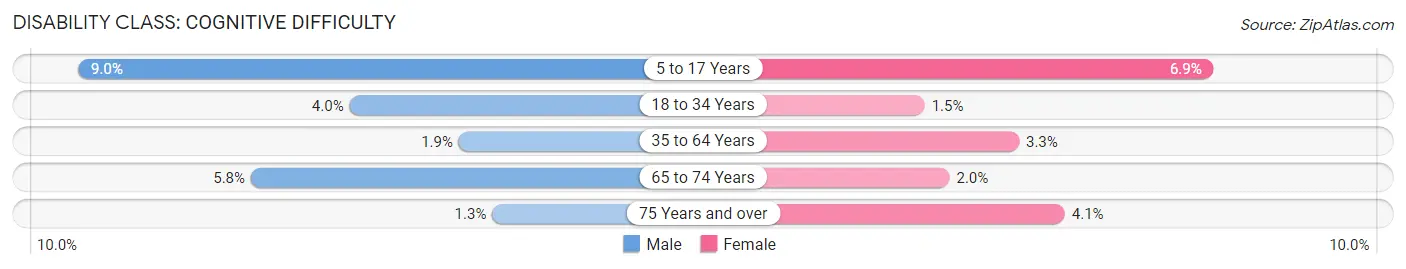
| Age Bracket | Male | Female |
| 5 to 17 Years | 20 (9.0%) | 12 (6.9%) |
| 18 to 34 Years | 5 (4.0%) | 3 (1.5%) |
| 35 to 64 Years | 10 (1.9%) | 15 (3.3%) |
| 65 to 74 Years | 8 (5.8%) | 3 (2.0%) |
| 75 Years and over | 2 (1.3%) | 7 (4.1%) |
Disability Class: Ambulatory Difficulty
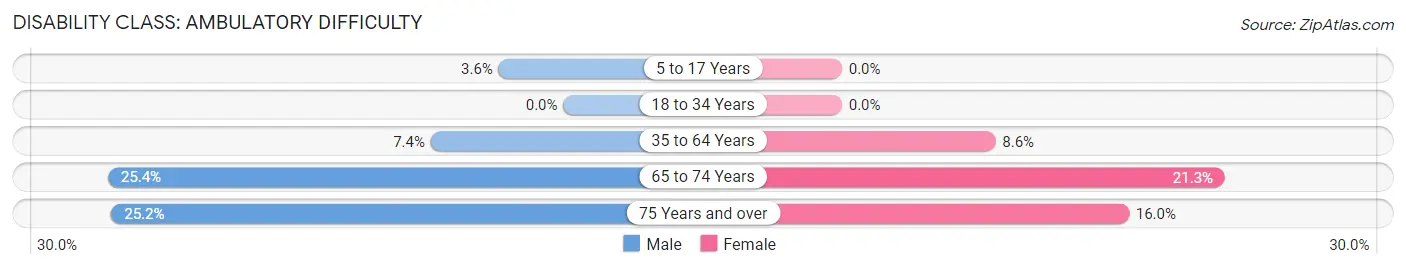
| Age Bracket | Male | Female |
| 5 to 17 Years | 8 (3.6%) | 0 (0.0%) |
| 18 to 34 Years | 0 (0.0%) | 0 (0.0%) |
| 35 to 64 Years | 38 (7.4%) | 39 (8.6%) |
| 65 to 74 Years | 35 (25.4%) | 32 (21.3%) |
| 75 Years and over | 38 (25.2%) | 27 (16.0%) |
Disability Class: Self-Care Difficulty
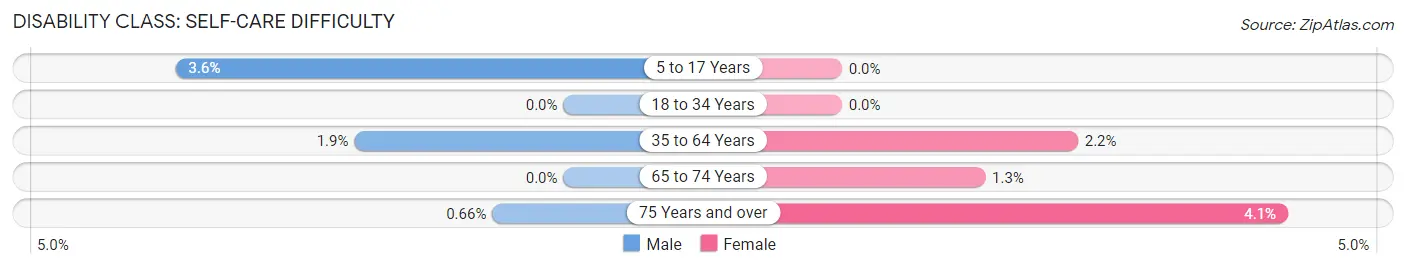
| Age Bracket | Male | Female |
| 5 to 17 Years | 8 (3.6%) | 0 (0.0%) |
| 18 to 34 Years | 0 (0.0%) | 0 (0.0%) |
| 35 to 64 Years | 10 (1.9%) | 10 (2.2%) |
| 65 to 74 Years | 0 (0.0%) | 2 (1.3%) |
| 75 Years and over | 1 (0.7%) | 7 (4.1%) |
Technology Access in Graham County
Computing Device Access in Graham County
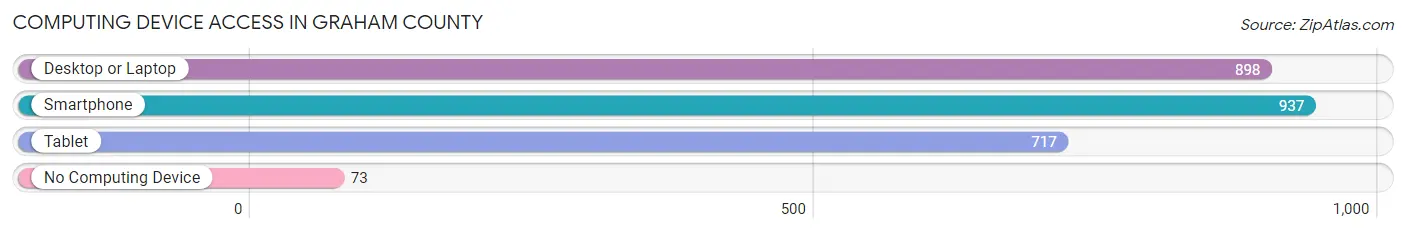
| Device Type | # Households | % Households |
| Desktop or Laptop | 898 | 74.8% |
| Smartphone | 937 | 78.1% |
| Tablet | 717 | 59.8% |
| No Computing Device | 73 | 6.1% |
| Total | 1,200 | 100.0% |
Internet Access in Graham County
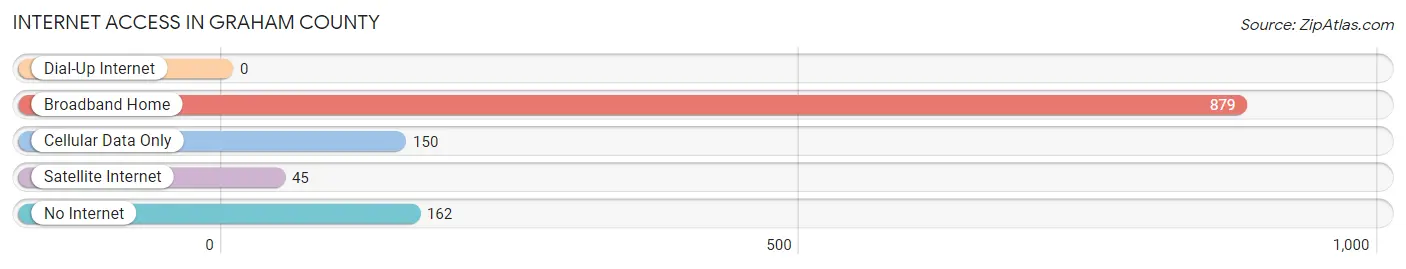
| Internet Type | # Households | % Households |
| Dial-Up Internet | 0 | 0.0% |
| Broadband Home | 879 | 73.3% |
| Cellular Data Only | 150 | 12.5% |
| Satellite Internet | 45 | 3.7% |
| No Internet | 162 | 13.5% |
| Total | 1,200 | 100.0% |
Graham County Summary
Graham County is located in the western part of the state of Kansas, and is part of the High Plains region. It is bordered by Sheridan County to the north, Wallace County to the east, Ness County to the south, and Greeley County to the west. The county seat is Hill City, and the largest city is Penokee. The county has a total area of 890 square miles, of which 889 square miles is land and 1 square mile is water.
History
Graham County was established in 1887 and named after John L. Graham, a Civil War veteran and former Kansas state senator. The county was originally part of Sheridan County, but was split off in 1887. The first settlers arrived in the area in the late 1870s, and the county was officially organized in 1887.
The county was largely agricultural in its early years, with wheat, corn, and other grains being the main crops. Cattle ranching was also an important industry in the county. In the early 1900s, oil and gas were discovered in the county, and this led to an economic boom. The county also experienced a population boom during this time, as people moved to the area to take advantage of the new economic opportunities.
Geography
Graham County is located in the High Plains region of Kansas. The county is mostly flat, with some rolling hills in the eastern part of the county. The county is drained by the Smoky Hill River, which flows through the county from north to south. The county is mostly covered in grassland, with some areas of cropland.
The county has a total area of 890 square miles, of which 889 square miles is land and 1 square mile is water. The county is bordered by Sheridan County to the north, Wallace County to the east, Ness County to the south, and Greeley County to the west.
Economy
Agriculture is the main economic driver in Graham County. The county is home to a variety of crops, including wheat, corn, sorghum, soybeans, and sunflowers. Cattle ranching is also an important industry in the county.
Oil and gas are also important to the economy of Graham County. The county is home to several oil and gas fields, and these provide jobs and revenue for the county.
The county also has a growing tourism industry. The county is home to several state parks and recreational areas, and these attract visitors from all over the state.
Demographics
As of the 2010 census, the population of Graham County was 2,945. The racial makeup of the county was 95.3% White, 0.3% African American, 0.7% Native American, 0.2% Asian, 0.1% Pacific Islander, 1.7% from other races, and 1.9% from two or more races. Hispanic or Latino of any race were 4.2% of the population.
The median income for a household in the county was $37,917, and the median income for a family was $45,000. The per capita income for the county was $18,945. About 11.2% of families and 14.2% of the population were below the poverty line, including 17.2% of those under age 18 and 8.2% of those age 65 or over.
Common Questions
What is Per Capita Income in Graham County?
Per Capita income in Graham County is $30,222.
What is the Median Family Income in Graham County?
Median Family Income in Graham County is $55,556.
What is the Median Household income in Graham County?
Median Household Income in Graham County is $47,071.
What is Income or Wage Gap in Graham County?
Income or Wage Gap in Graham County is 22.6%.
Women in Graham County earn 77.4 cents for every dollar earned by a man.
What is Inequality or Gini Index in Graham County?
Inequality or Gini Index in Graham County is 0.38.
What is the Total Population of Graham County?
Total Population of Graham County is 2,430.
What is the Total Male Population of Graham County?
Total Male Population of Graham County is 1,203.
What is the Total Female Population of Graham County?
Total Female Population of Graham County is 1,227.
What is the Ratio of Males per 100 Females in Graham County?
There are 98.04 Males per 100 Females in Graham County.
What is the Ratio of Females per 100 Males in Graham County?
There are 102.00 Females per 100 Males in Graham County.
What is the Median Population Age in Graham County?
Median Population Age in Graham County is 47.2 Years.
What is the Average Family Size in Graham County
Average Family Size in Graham County is 2.5 People.
What is the Average Household Size in Graham County
Average Household Size in Graham County is 2.0 People.
How Large is the Labor Force in Graham County?
There are 1,247 People in the Labor Forcein in Graham County.
What is the Percentage of People in the Labor Force in Graham County?
62.8% of People are in the Labor Force in Graham County.
What is the Unemployment Rate in Graham County?
Unemployment Rate in Graham County is 6.1%.