Ellsworth County, KS Map & Demographics
Ellsworth County Map
Ellsworth County Overview
$29,968
PER CAPITA INCOME
$78,833
AVG FAMILY INCOME
$59,844
AVG HOUSEHOLD INCOME
5.9%
WAGE / INCOME GAP [ % ]
94.1¢/ $1
WAGE / INCOME GAP [ $ ]
$9,205
FAMILY INCOME DEFICIT
0.40
INEQUALITY / GINI INDEX
6,374
TOTAL POPULATION
3,578
MALE POPULATION
2,796
FEMALE POPULATION
127.97
MALES / 100 FEMALES
78.14
FEMALES / 100 MALES
43.1
MEDIAN AGE
2.9
AVG FAMILY SIZE
2.3
AVG HOUSEHOLD SIZE
2,741
LABOR FORCE [ PEOPLE ]
51.2%
PERCENT IN LABOR FORCE
3.5%
UNEMPLOYMENT RATE
Ellsworth County Area Codes
Income in Ellsworth County
Income Overview in Ellsworth County
Per Capita Income in Ellsworth County is $29,968, while median incomes of families and households are $78,833 and $59,844 respectively.
| Characteristic | Number | Measure |
| Per Capita Income | 6,374 | $29,968 |
| Median Family Income | 1,494 | $78,833 |
| Mean Family Income | 1,494 | $92,979 |
| Median Household Income | 2,305 | $59,844 |
| Mean Household Income | 2,305 | $75,676 |
| Income Deficit | 1,494 | $9,205 |
| Wage / Income Gap (%) | 6,374 | 5.91% |
| Wage / Income Gap ($) | 6,374 | 94.09¢ per $1 |
| Gini / Inequality Index | 6,374 | 0.40 |
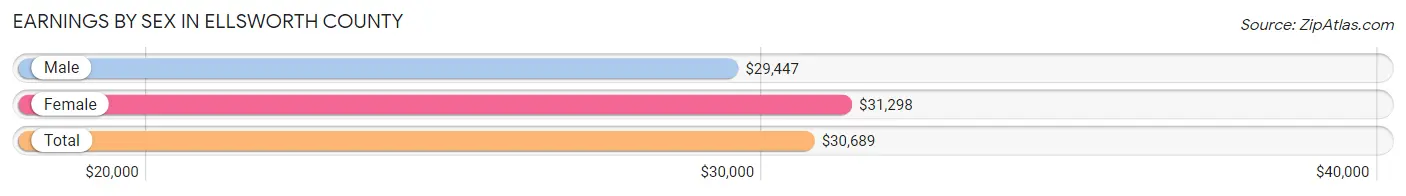
Earnings by Sex in Ellsworth County
Average Earnings in Ellsworth County are $30,689, $29,447 for men and $31,298 for women, a difference of 5.9%.
| Sex | Number | Average Earnings |
| Male | 2,201 (61.5%) | $29,447 |
| Female | 1,377 (38.5%) | $31,298 |
| Total | 3,578 (100.0%) | $30,689 |
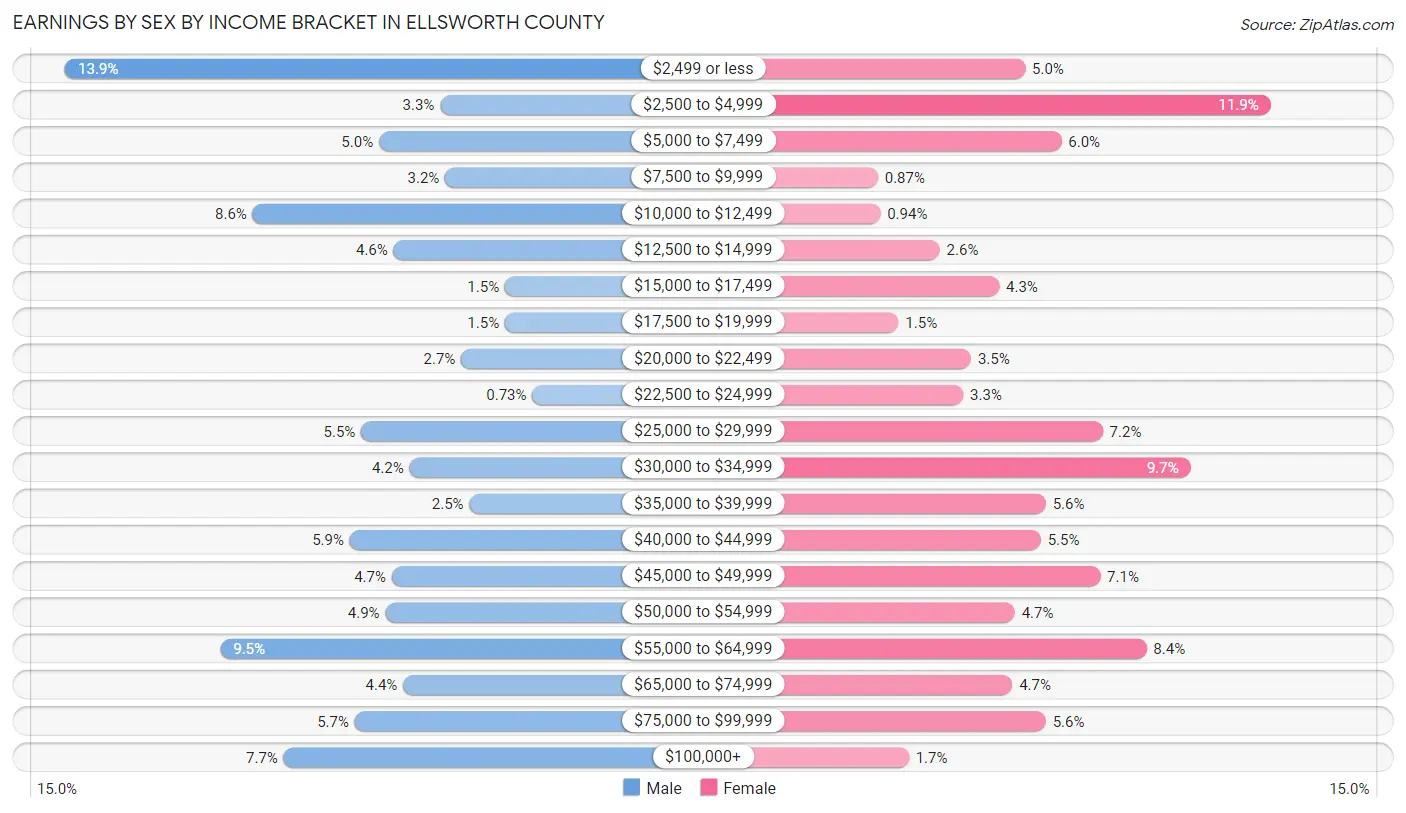
Earnings by Sex by Income Bracket in Ellsworth County
The most common earnings brackets in Ellsworth County are $2,499 or less for men (305 | 13.9%) and $2,500 to $4,999 for women (164 | 11.9%).
| Income | Male | Female |
| $2,499 or less | 305 (13.9%) | 69 (5.0%) |
| $2,500 to $4,999 | 73 (3.3%) | 164 (11.9%) |
| $5,000 to $7,499 | 111 (5.0%) | 83 (6.0%) |
| $7,500 to $9,999 | 70 (3.2%) | 12 (0.9%) |
| $10,000 to $12,499 | 189 (8.6%) | 13 (0.9%) |
| $12,500 to $14,999 | 102 (4.6%) | 36 (2.6%) |
| $15,000 to $17,499 | 33 (1.5%) | 59 (4.3%) |
| $17,500 to $19,999 | 33 (1.5%) | 20 (1.5%) |
| $20,000 to $22,499 | 60 (2.7%) | 48 (3.5%) |
| $22,500 to $24,999 | 16 (0.7%) | 45 (3.3%) |
| $25,000 to $29,999 | 122 (5.5%) | 99 (7.2%) |
| $30,000 to $34,999 | 92 (4.2%) | 133 (9.7%) |
| $35,000 to $39,999 | 55 (2.5%) | 77 (5.6%) |
| $40,000 to $44,999 | 129 (5.9%) | 75 (5.4%) |
| $45,000 to $49,999 | 103 (4.7%) | 98 (7.1%) |
| $50,000 to $54,999 | 107 (4.9%) | 65 (4.7%) |
| $55,000 to $64,999 | 209 (9.5%) | 116 (8.4%) |
| $65,000 to $74,999 | 96 (4.4%) | 64 (4.6%) |
| $75,000 to $99,999 | 126 (5.7%) | 77 (5.6%) |
| $100,000+ | 170 (7.7%) | 24 (1.7%) |
| Total | 2,201 (100.0%) | 1,377 (100.0%) |
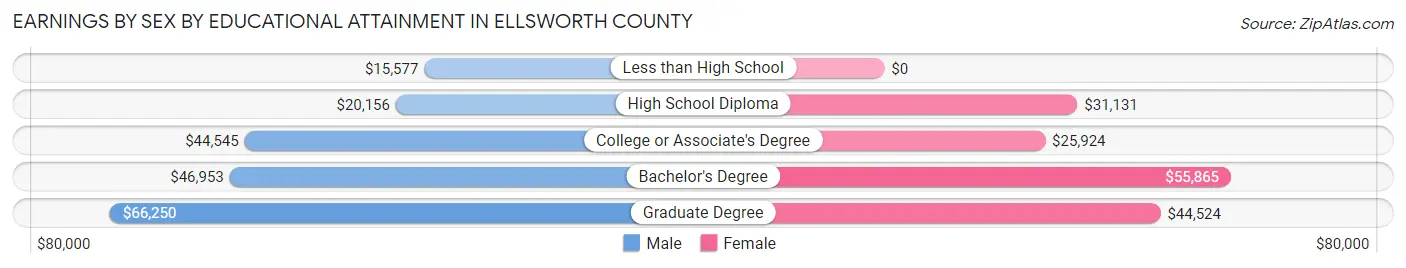
Earnings by Sex by Educational Attainment in Ellsworth County
Average earnings in Ellsworth County are $34,462 for men and $32,683 for women, a difference of 5.2%. Men with an educational attainment of graduate degree enjoy the highest average annual earnings of $66,250, while those with less than high school education earn the least with $15,577. Women with an educational attainment of bachelor's degree earn the most with the average annual earnings of $55,865, while those with college or associate's degree education have the smallest earnings of $25,924.
| Educational Attainment | Male Income | Female Income |
| Less than High School | $15,577 | $0 |
| High School Diploma | $20,156 | $31,131 |
| College or Associate's Degree | $44,545 | $25,924 |
| Bachelor's Degree | $46,953 | $55,865 |
| Graduate Degree | $66,250 | $44,524 |
| Total | $34,462 | $32,683 |
Family Income in Ellsworth County
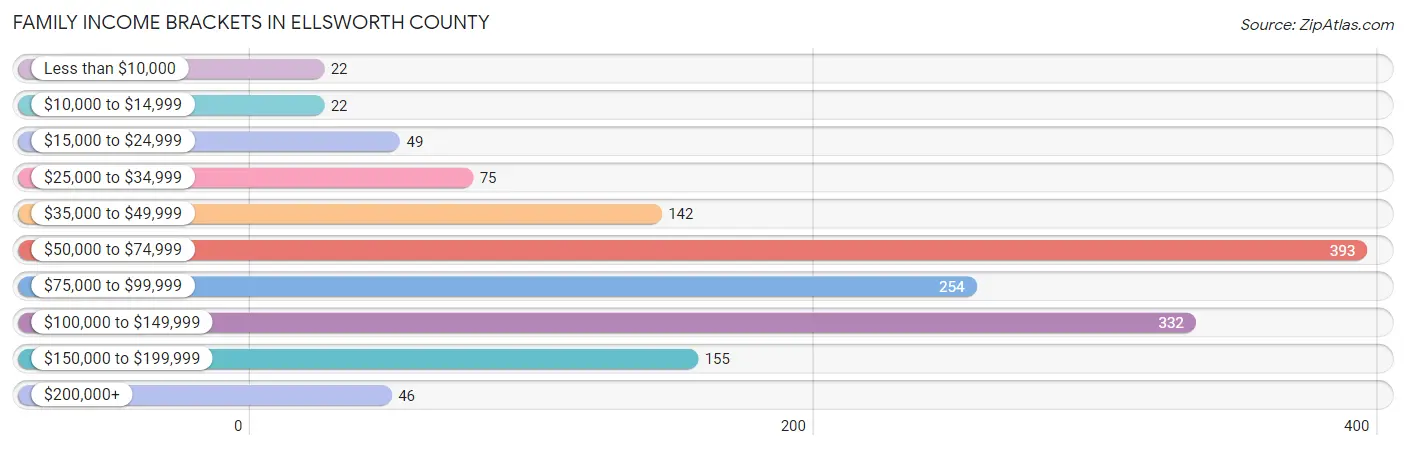
Family Income Brackets in Ellsworth County
According to the Ellsworth County family income data, there are 393 families falling into the $50,000 to $74,999 income range, which is the most common income bracket and makes up 26.3% of all families. Conversely, the less than $10,000 income bracket is the least frequent group with only 22 families (1.5%) belonging to this category.
| Income Bracket | # Families | % Families |
| Less than $10,000 | 22 | 1.5% |
| $10,000 to $14,999 | 22 | 1.5% |
| $15,000 to $24,999 | 49 | 3.3% |
| $25,000 to $34,999 | 75 | 5.0% |
| $35,000 to $49,999 | 142 | 9.5% |
| $50,000 to $74,999 | 393 | 26.3% |
| $75,000 to $99,999 | 254 | 17.0% |
| $100,000 to $149,999 | 332 | 22.2% |
| $150,000 to $199,999 | 155 | 10.4% |
| $200,000+ | 46 | 3.1% |
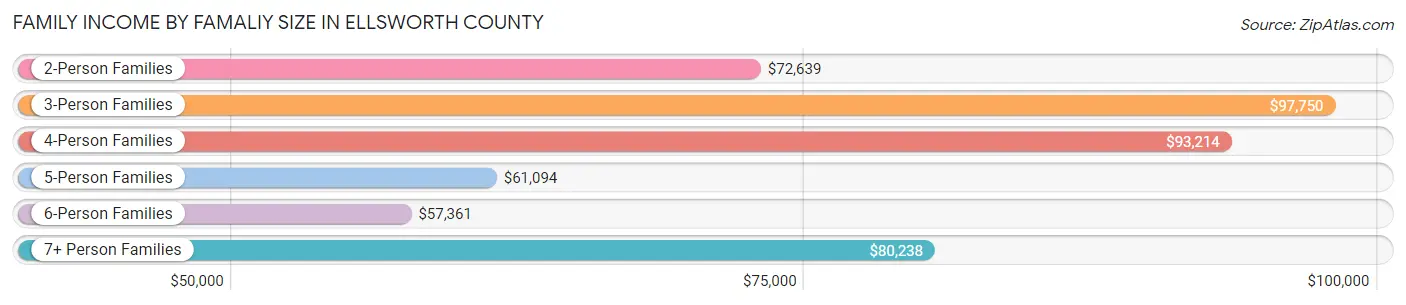
Family Income by Famaliy Size in Ellsworth County
3-person families (216 | 14.5%) account for the highest median family income in Ellsworth County with $97,750 per family, while 2-person families (935 | 62.6%) have the highest median income of $36,320 per family member.
| Income Bracket | # Families | Median Income |
| 2-Person Families | 935 (62.6%) | $72,639 |
| 3-Person Families | 216 (14.5%) | $97,750 |
| 4-Person Families | 198 (13.3%) | $93,214 |
| 5-Person Families | 71 (4.8%) | $61,094 |
| 6-Person Families | 36 (2.4%) | $57,361 |
| 7+ Person Families | 38 (2.5%) | $80,238 |
| Total | 1,494 (100.0%) | $78,833 |
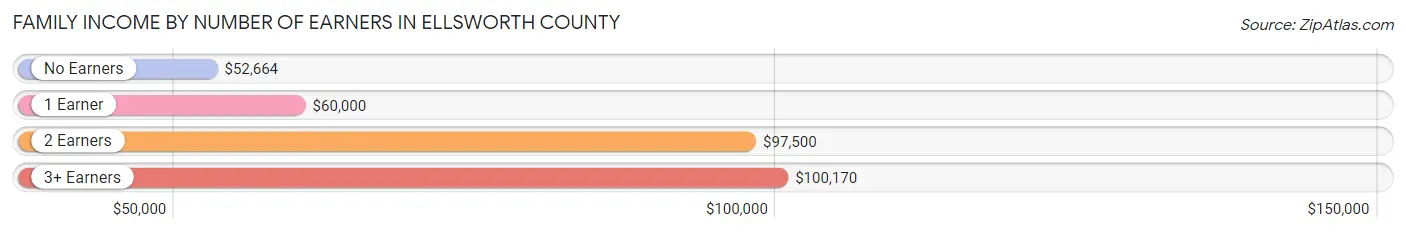
Family Income by Number of Earners in Ellsworth County
The median family income in Ellsworth County is $78,833, with families comprising 3+ earners (109) having the highest median family income of $100,170, while families with no earners (285) have the lowest median family income of $52,664, accounting for 7.3% and 19.1% of families, respectively.
| Number of Earners | # Families | Median Income |
| No Earners | 285 (19.1%) | $52,664 |
| 1 Earner | 298 (20.0%) | $60,000 |
| 2 Earners | 802 (53.7%) | $97,500 |
| 3+ Earners | 109 (7.3%) | $100,170 |
| Total | 1,494 (100.0%) | $78,833 |
Household Income in Ellsworth County
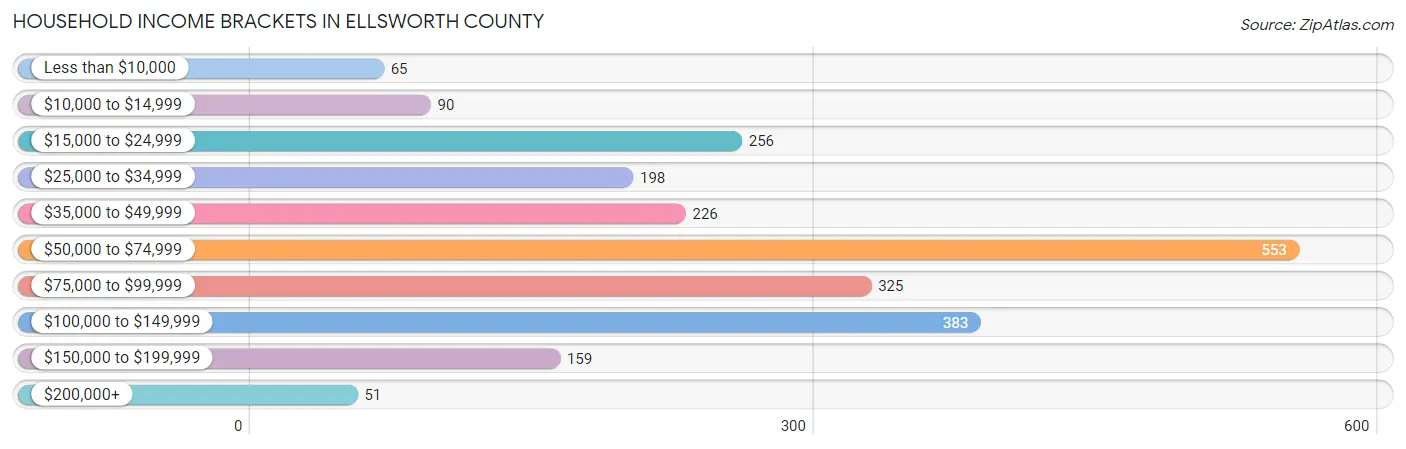
Household Income Brackets in Ellsworth County
With 553 households falling in the category, the $50,000 to $74,999 income range is the most frequent in Ellsworth County, accounting for 24.0% of all households. In contrast, only 51 households (2.2%) fall into the $200,000+ income bracket, making it the least populous group.
| Income Bracket | # Households | % Households |
| Less than $10,000 | 65 | 2.8% |
| $10,000 to $14,999 | 90 | 3.9% |
| $15,000 to $24,999 | 256 | 11.1% |
| $25,000 to $34,999 | 198 | 8.6% |
| $35,000 to $49,999 | 226 | 9.8% |
| $50,000 to $74,999 | 553 | 24.0% |
| $75,000 to $99,999 | 325 | 14.1% |
| $100,000 to $149,999 | 383 | 16.6% |
| $150,000 to $199,999 | 159 | 6.9% |
| $200,000+ | 51 | 2.2% |
Household Income by Householder Age in Ellsworth County
The median household income in Ellsworth County is $59,844, with the highest median household income of $75,100 found in the 25 to 44 years age bracket for the primary householder. A total of 530 households (23.0%) fall into this category. Meanwhile, the 15 to 24 years age bracket for the primary householder has the lowest median household income of $0, with 81 households (3.5%) in this group.
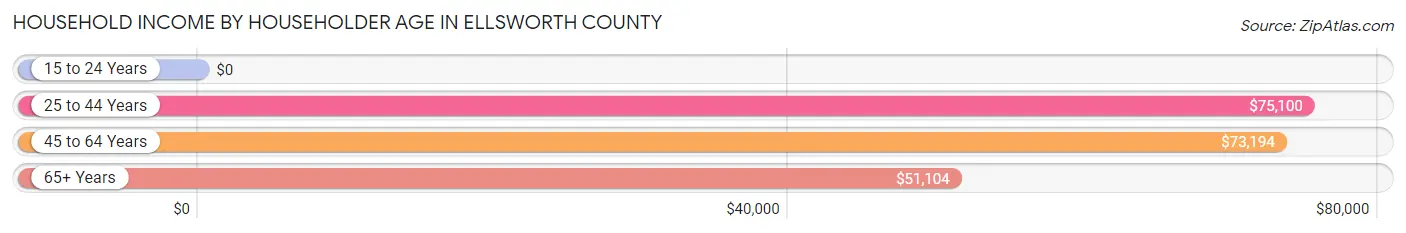
| Income Bracket | # Households | Median Income |
| 15 to 24 Years | 81 (3.5%) | $0 |
| 25 to 44 Years | 530 (23.0%) | $75,100 |
| 45 to 64 Years | 799 (34.7%) | $73,194 |
| 65+ Years | 895 (38.8%) | $51,104 |
| Total | 2,305 (100.0%) | $59,844 |
Poverty in Ellsworth County
Income Below Poverty by Sex and Age in Ellsworth County
With 7.0% poverty level for males and 10.5% for females among the residents of Ellsworth County, 5 year old males and 5 year old females are the most vulnerable to poverty, with 13 males (86.7%) and 7 females (24.1%) in their respective age groups living below the poverty level.
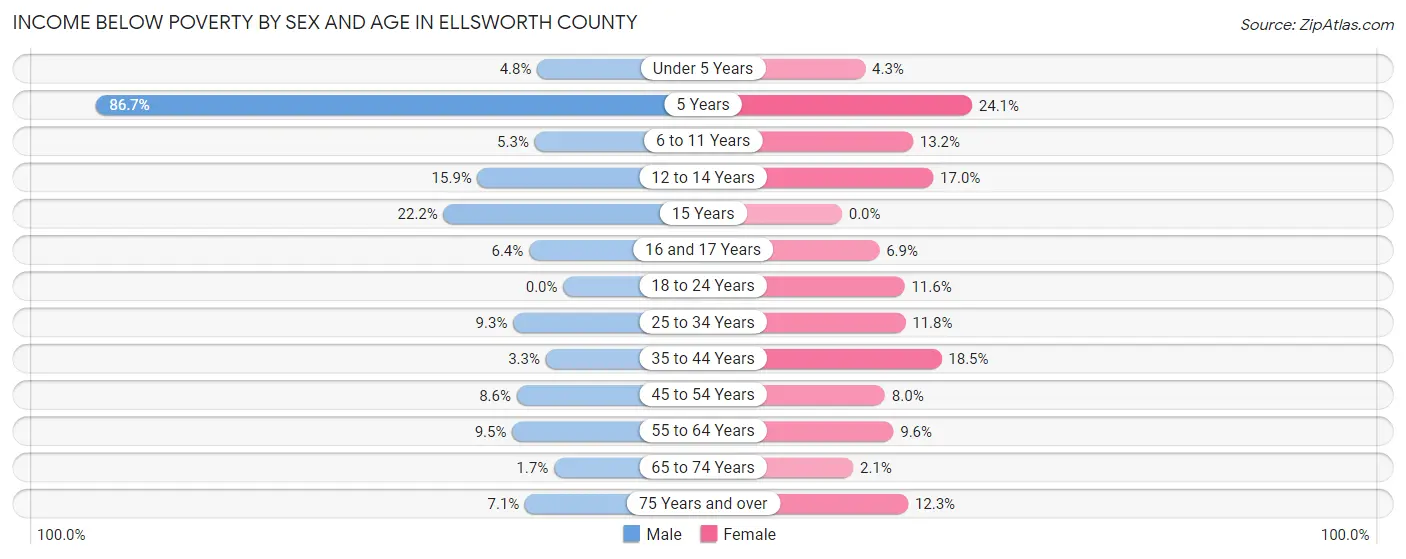
| Age Bracket | Male | Female |
| Under 5 Years | 7 (4.8%) | 6 (4.3%) |
| 5 Years | 13 (86.7%) | 7 (24.1%) |
| 6 to 11 Years | 11 (5.3%) | 24 (13.2%) |
| 12 to 14 Years | 21 (15.9%) | 19 (17.0%) |
| 15 Years | 6 (22.2%) | 0 (0.0%) |
| 16 and 17 Years | 4 (6.4%) | 5 (6.9%) |
| 18 to 24 Years | 0 (0.0%) | 17 (11.6%) |
| 25 to 34 Years | 28 (9.3%) | 31 (11.8%) |
| 35 to 44 Years | 7 (3.3%) | 56 (18.5%) |
| 45 to 54 Years | 26 (8.6%) | 22 (8.0%) |
| 55 to 64 Years | 40 (9.5%) | 41 (9.6%) |
| 65 to 74 Years | 6 (1.7%) | 7 (2.1%) |
| 75 Years and over | 18 (7.1%) | 49 (12.3%) |
| Total | 187 (7.0%) | 284 (10.5%) |
Income Above Poverty by Sex and Age in Ellsworth County
According to the poverty statistics in Ellsworth County, males aged 18 to 24 years and females aged 15 years are the age groups that are most secure financially, with 100.0% of males and 100.0% of females in these age groups living above the poverty line.
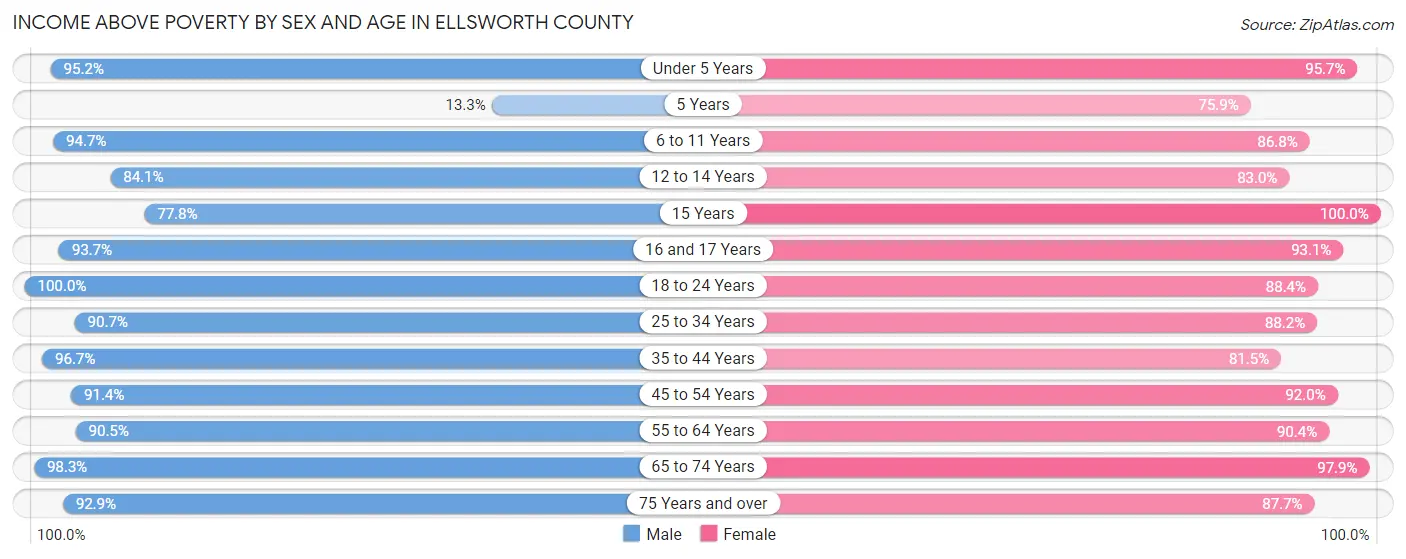
| Age Bracket | Male | Female |
| Under 5 Years | 138 (95.2%) | 133 (95.7%) |
| 5 Years | 2 (13.3%) | 22 (75.9%) |
| 6 to 11 Years | 196 (94.7%) | 158 (86.8%) |
| 12 to 14 Years | 111 (84.1%) | 93 (83.0%) |
| 15 Years | 21 (77.8%) | 25 (100.0%) |
| 16 and 17 Years | 59 (93.6%) | 67 (93.1%) |
| 18 to 24 Years | 249 (100.0%) | 129 (88.4%) |
| 25 to 34 Years | 273 (90.7%) | 232 (88.2%) |
| 35 to 44 Years | 208 (96.7%) | 247 (81.5%) |
| 45 to 54 Years | 275 (91.4%) | 253 (92.0%) |
| 55 to 64 Years | 382 (90.5%) | 388 (90.4%) |
| 65 to 74 Years | 339 (98.3%) | 328 (97.9%) |
| 75 Years and over | 236 (92.9%) | 350 (87.7%) |
| Total | 2,489 (93.0%) | 2,425 (89.5%) |
Income Below Poverty Among Married-Couple Families in Ellsworth County
The poverty statistics for married-couple families in Ellsworth County show that 2.3% or 30 of the total 1,322 families live below the poverty line. Families with 3 or 4 children have the highest poverty rate of 3.1%, comprising of 3 families. On the other hand, families with 5 or more children have the lowest poverty rate of 0.0%, which includes 0 families.
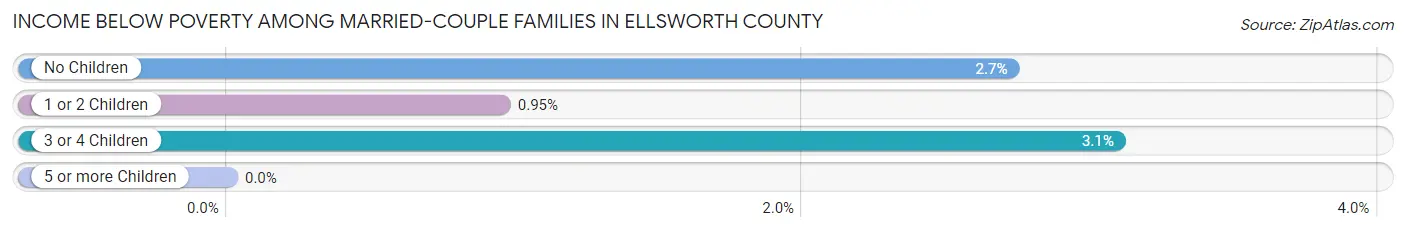
| Children | Above Poverty | Below Poverty |
| No Children | 859 (97.3%) | 24 (2.7%) |
| 1 or 2 Children | 314 (99.1%) | 3 (0.9%) |
| 3 or 4 Children | 94 (96.9%) | 3 (3.1%) |
| 5 or more Children | 25 (100.0%) | 0 (0.0%) |
| Total | 1,292 (97.7%) | 30 (2.3%) |
Income Below Poverty Among Single-Parent Households in Ellsworth County
According to the poverty data in Ellsworth County, 25.0% or 16 single-father households and 35.2% or 38 single-mother households are living below the poverty line. Among single-father households, those with 3 or 4 children have the highest poverty rate, with 5 households (100.0%) experiencing poverty. Likewise, among single-mother households, those with 3 or 4 children have the highest poverty rate, with 13 households (100.0%) falling below the poverty line.
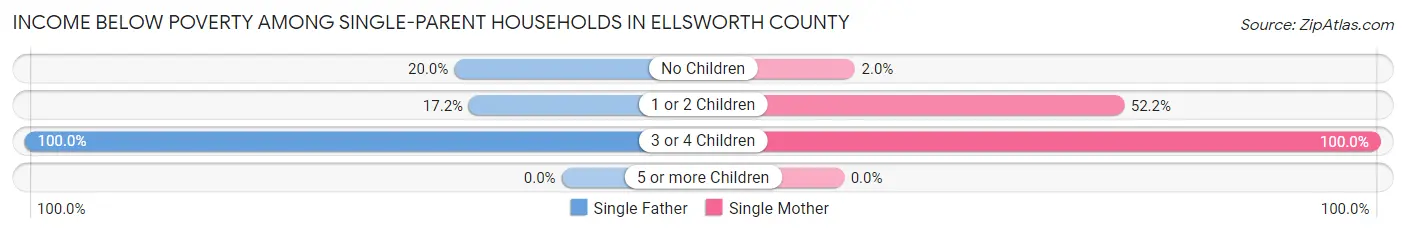
| Children | Single Father | Single Mother |
| No Children | 6 (20.0%) | 1 (2.0%) |
| 1 or 2 Children | 5 (17.2%) | 24 (52.2%) |
| 3 or 4 Children | 5 (100.0%) | 13 (100.0%) |
| 5 or more Children | 0 (0.0%) | 0 (0.0%) |
| Total | 16 (25.0%) | 38 (35.2%) |
Income Below Poverty Among Married-Couple vs Single-Parent Households in Ellsworth County
The poverty data for Ellsworth County shows that 30 of the married-couple family households (2.3%) and 54 of the single-parent households (31.4%) are living below the poverty level. Within the married-couple family households, those with 3 or 4 children have the highest poverty rate, with 3 households (3.1%) falling below the poverty line. Among the single-parent households, those with 3 or 4 children have the highest poverty rate, with 18 household (100.0%) living below poverty.
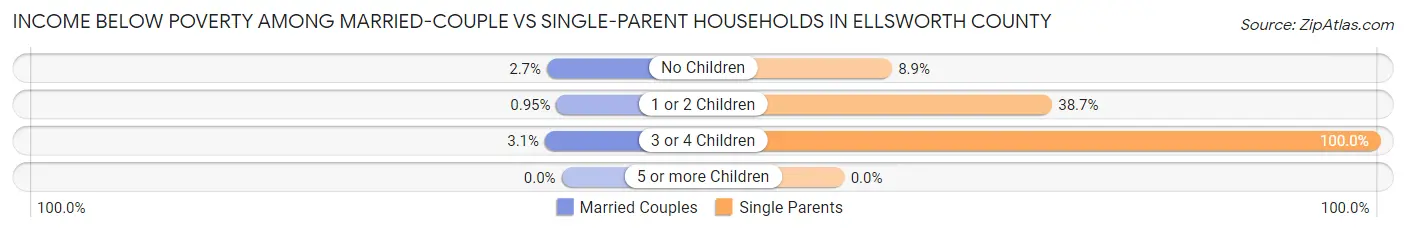
| Children | Married-Couple Families | Single-Parent Households |
| No Children | 24 (2.7%) | 7 (8.9%) |
| 1 or 2 Children | 3 (0.9%) | 29 (38.7%) |
| 3 or 4 Children | 3 (3.1%) | 18 (100.0%) |
| 5 or more Children | 0 (0.0%) | 0 (0.0%) |
| Total | 30 (2.3%) | 54 (31.4%) |
Race in Ellsworth County
The most populous races in Ellsworth County are White / Caucasian (5,601 | 87.9%), Two or more Races (415 | 6.5%), and Hispanic or Latino (392 | 6.1%).
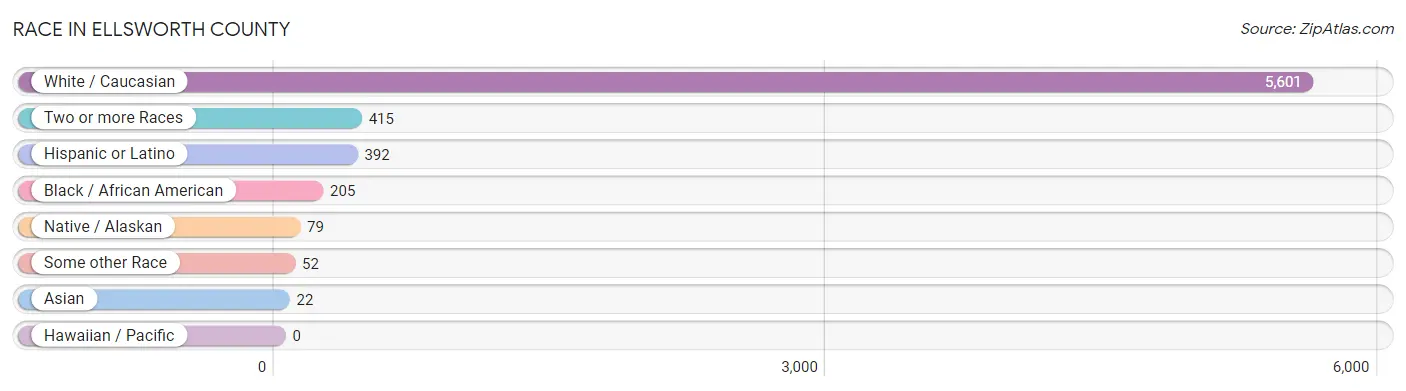
| Race | # Population | % Population |
| Asian | 22 | 0.4% |
| Black / African American | 205 | 3.2% |
| Hawaiian / Pacific | 0 | 0.0% |
| Hispanic or Latino | 392 | 6.1% |
| Native / Alaskan | 79 | 1.2% |
| White / Caucasian | 5,601 | 87.9% |
| Two or more Races | 415 | 6.5% |
| Some other Race | 52 | 0.8% |
| Total | 6,374 | 100.0% |
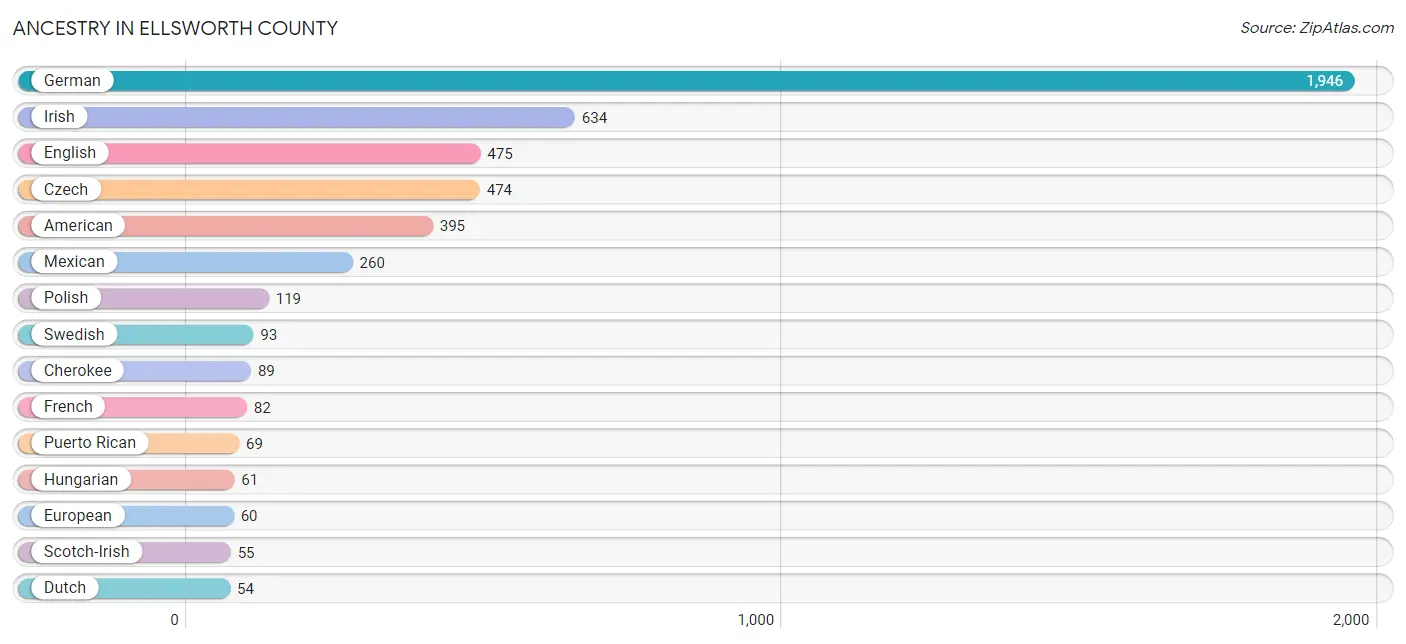
Ancestry in Ellsworth County
The most populous ancestries reported in Ellsworth County are German (1,946 | 30.5%), Irish (634 | 10.0%), English (475 | 7.4%), Czech (474 | 7.4%), and American (395 | 6.2%), together accounting for 61.6% of all Ellsworth County residents.
| Ancestry | # Population | % Population |
| African | 21 | 0.3% |
| Alsatian | 15 | 0.2% |
| American | 395 | 6.2% |
| Arab | 7 | 0.1% |
| Argentinean | 24 | 0.4% |
| Austrian | 14 | 0.2% |
| Bhutanese | 4 | 0.1% |
| British | 10 | 0.2% |
| Celtic | 3 | 0.1% |
| Central American | 3 | 0.1% |
| Cherokee | 89 | 1.4% |
| Chickasaw | 3 | 0.1% |
| Colombian | 14 | 0.2% |
| Creek | 3 | 0.1% |
| Cuban | 20 | 0.3% |
| Czech | 474 | 7.4% |
| Czechoslovakian | 43 | 0.7% |
| Danish | 31 | 0.5% |
| Dutch | 54 | 0.9% |
| Egyptian | 7 | 0.1% |
| English | 475 | 7.4% |
| European | 60 | 0.9% |
| French | 82 | 1.3% |
| French American Indian | 6 | 0.1% |
| French Canadian | 19 | 0.3% |
| German | 1,946 | 30.5% |
| German Russian | 8 | 0.1% |
| Greek | 6 | 0.1% |
| Honduran | 3 | 0.1% |
| Hungarian | 61 | 1.0% |
| Irish | 634 | 10.0% |
| Italian | 37 | 0.6% |
| Korean | 22 | 0.4% |
| Liberian | 5 | 0.1% |
| Luxembourger | 2 | 0.0% |
| Malaysian | 4 | 0.1% |
| Mexican | 260 | 4.1% |
| Mexican American Indian | 7 | 0.1% |
| Norwegian | 19 | 0.3% |
| Polish | 119 | 1.9% |
| Puerto Rican | 69 | 1.1% |
| Romanian | 1 | 0.0% |
| Russian | 29 | 0.4% |
| Scandinavian | 8 | 0.1% |
| Scotch-Irish | 55 | 0.9% |
| Scottish | 36 | 0.6% |
| Shoshone | 1 | 0.0% |
| South American | 38 | 0.6% |
| Spaniard | 2 | 0.0% |
| Subsaharan African | 26 | 0.4% |
| Swedish | 93 | 1.5% |
| Swiss | 11 | 0.2% |
| Thai | 18 | 0.3% |
| Welsh | 49 | 0.8% | View All 54 Rows |
Immigrants in Ellsworth County
The most numerous immigrant groups reported in Ellsworth County came from Latin America (63 | 1.0%), Central America (56 | 0.9%), Mexico (46 | 0.7%), Guatemala (10 | 0.2%), and Europe (8 | 0.1%), together accounting for 2.9% of all Ellsworth County residents.
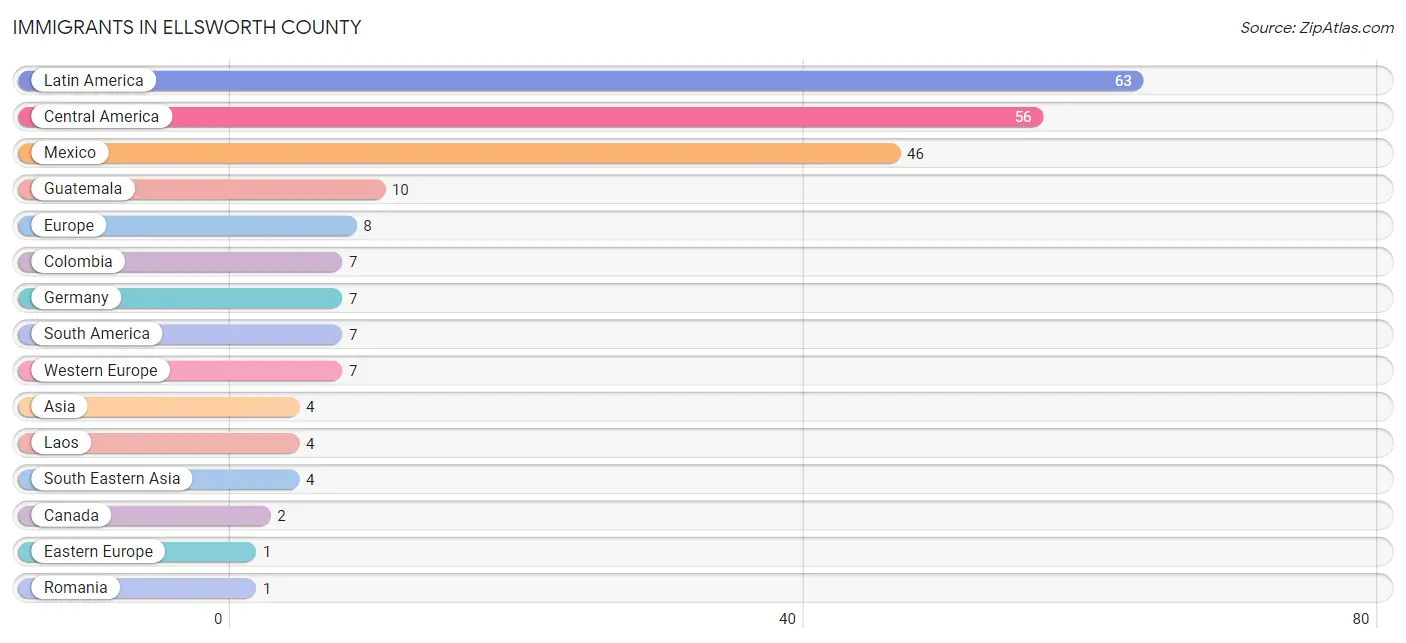
| Immigration Origin | # Population | % Population |
| Asia | 4 | 0.1% |
| Canada | 2 | 0.0% |
| Central America | 56 | 0.9% |
| Colombia | 7 | 0.1% |
| Eastern Europe | 1 | 0.0% |
| Europe | 8 | 0.1% |
| Germany | 7 | 0.1% |
| Guatemala | 10 | 0.2% |
| Laos | 4 | 0.1% |
| Latin America | 63 | 1.0% |
| Mexico | 46 | 0.7% |
| Romania | 1 | 0.0% |
| South America | 7 | 0.1% |
| South Eastern Asia | 4 | 0.1% |
| Western Europe | 7 | 0.1% | View All 15 Rows |
Sex and Age in Ellsworth County
Sex and Age in Ellsworth County
The most populous age groups in Ellsworth County are 25 to 29 Years (340 | 9.5%) for men and 75 to 79 Years (235 | 8.4%) for women.
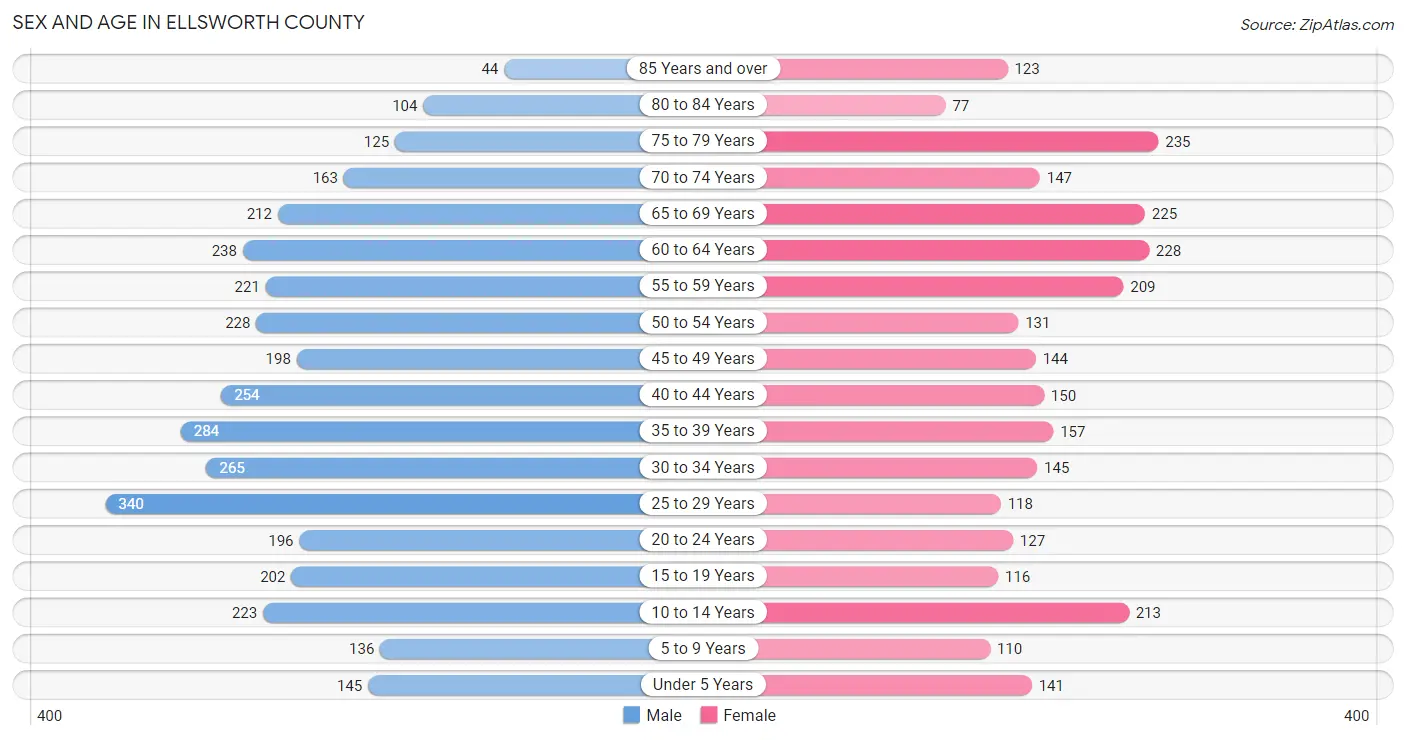
| Age Bracket | Male | Female |
| Under 5 Years | 145 (4.1%) | 141 (5.0%) |
| 5 to 9 Years | 136 (3.8%) | 110 (3.9%) |
| 10 to 14 Years | 223 (6.2%) | 213 (7.6%) |
| 15 to 19 Years | 202 (5.7%) | 116 (4.2%) |
| 20 to 24 Years | 196 (5.5%) | 127 (4.5%) |
| 25 to 29 Years | 340 (9.5%) | 118 (4.2%) |
| 30 to 34 Years | 265 (7.4%) | 145 (5.2%) |
| 35 to 39 Years | 284 (7.9%) | 157 (5.6%) |
| 40 to 44 Years | 254 (7.1%) | 150 (5.4%) |
| 45 to 49 Years | 198 (5.5%) | 144 (5.1%) |
| 50 to 54 Years | 228 (6.4%) | 131 (4.7%) |
| 55 to 59 Years | 221 (6.2%) | 209 (7.5%) |
| 60 to 64 Years | 238 (6.7%) | 228 (8.2%) |
| 65 to 69 Years | 212 (5.9%) | 225 (8.1%) |
| 70 to 74 Years | 163 (4.6%) | 147 (5.3%) |
| 75 to 79 Years | 125 (3.5%) | 235 (8.4%) |
| 80 to 84 Years | 104 (2.9%) | 77 (2.8%) |
| 85 Years and over | 44 (1.2%) | 123 (4.4%) |
| Total | 3,578 (100.0%) | 2,796 (100.0%) |
Families and Households in Ellsworth County
Median Family Size in Ellsworth County
The median family size in Ellsworth County is 2.91 persons per family, with married-couple families (1,322 | 88.5%) accounting for the largest median family size of 2.95 persons per family. On the other hand, single male/father families (64 | 4.3%) represent the smallest median family size with 2.52 persons per family.
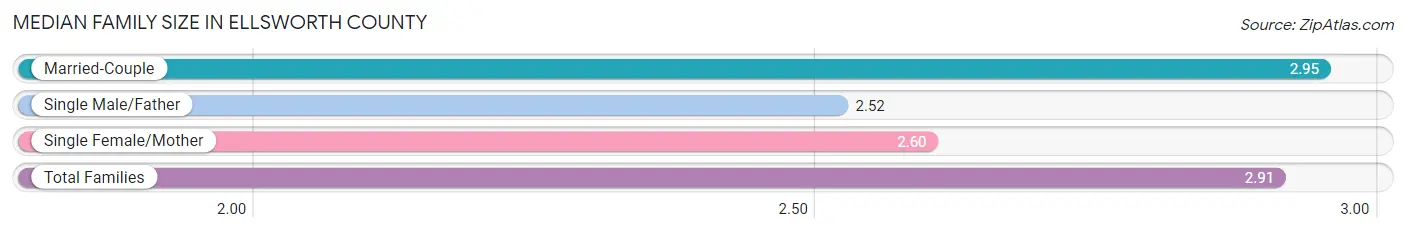
| Family Type | # Families | Family Size |
| Married-Couple | 1,322 (88.5%) | 2.95 |
| Single Male/Father | 64 (4.3%) | 2.52 |
| Single Female/Mother | 108 (7.2%) | 2.60 |
| Total Families | 1,494 (100.0%) | 2.91 |
Median Household Size in Ellsworth County
The median household size in Ellsworth County is 2.33 persons per household, with married-couple households (1,322 | 57.4%) accounting for the largest median household size of 2.99 persons per household. non-family households (811 | 35.2%) represent the smallest median household size with 1.13 persons per household.
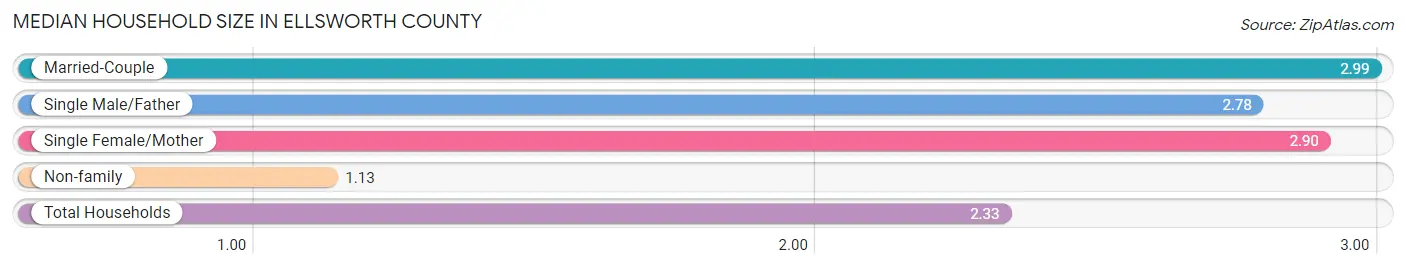
| Household Type | # Households | Household Size |
| Married-Couple | 1,322 (57.4%) | 2.99 |
| Single Male/Father | 64 (2.8%) | 2.78 |
| Single Female/Mother | 108 (4.7%) | 2.90 |
| Non-family | 811 (35.2%) | 1.13 |
| Total Households | 2,305 (100.0%) | 2.33 |
Household Size by Marriage Status in Ellsworth County
Out of a total of 2,305 households in Ellsworth County, 1,494 (64.8%) are family households, while 811 (35.2%) are nonfamily households. The most numerous type of family households are 2-person households, comprising 909, and the most common type of nonfamily households are 1-person households, comprising 741.
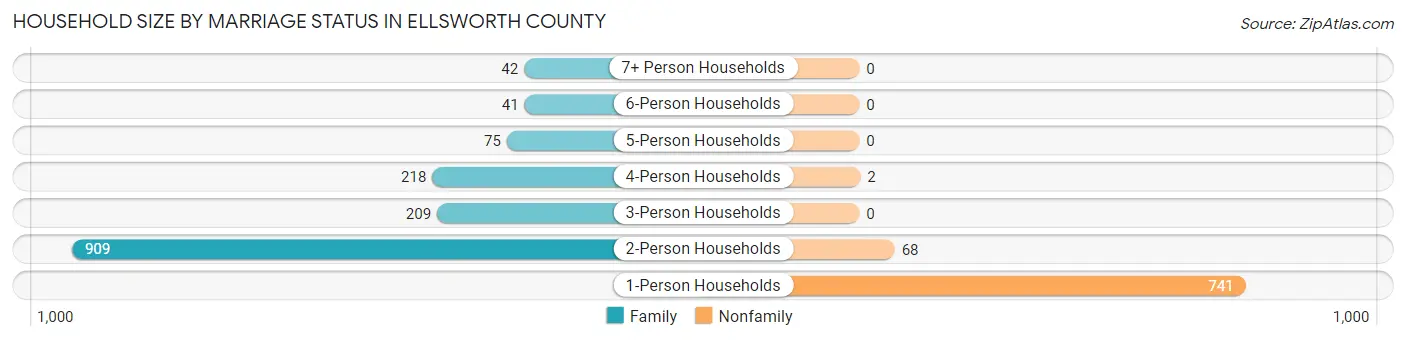
| Household Size | Family Households | Nonfamily Households |
| 1-Person Households | - | 741 (32.2%) |
| 2-Person Households | 909 (39.4%) | 68 (2.9%) |
| 3-Person Households | 209 (9.1%) | 0 (0.0%) |
| 4-Person Households | 218 (9.5%) | 2 (0.1%) |
| 5-Person Households | 75 (3.3%) | 0 (0.0%) |
| 6-Person Households | 41 (1.8%) | 0 (0.0%) |
| 7+ Person Households | 42 (1.8%) | 0 (0.0%) |
| Total | 1,494 (64.8%) | 811 (35.2%) |
Female Fertility in Ellsworth County
Fertility by Age in Ellsworth County
Average fertility rate in Ellsworth County is 80.0 births per 1,000 women. Women in the age bracket of 20 to 34 years have the highest fertility rate with 115.0 births per 1,000 women. Women in the age bracket of 20 to 34 years acount for 57.0% of all women with births.
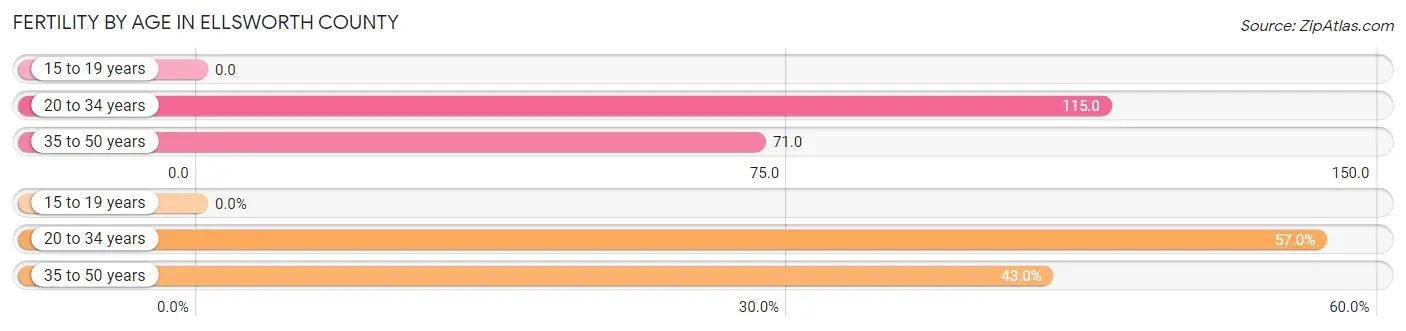
| Age Bracket | Women with Births | Births / 1,000 Women |
| 15 to 19 years | 0 (0.0%) | 0.0 |
| 20 to 34 years | 45 (57.0%) | 115.0 |
| 35 to 50 years | 34 (43.0%) | 71.0 |
| Total | 79 (100.0%) | 80.0 |
Fertility by Age by Marriage Status in Ellsworth County
88.6% of women with births (79) in Ellsworth County are married. The highest percentage of unmarried women with births falls into 20 to 34 years age bracket with 20.0% of them unmarried at the time of birth, while the lowest percentage of unmarried women with births belong to 35 to 50 years age bracket with 0.0% of them unmarried.
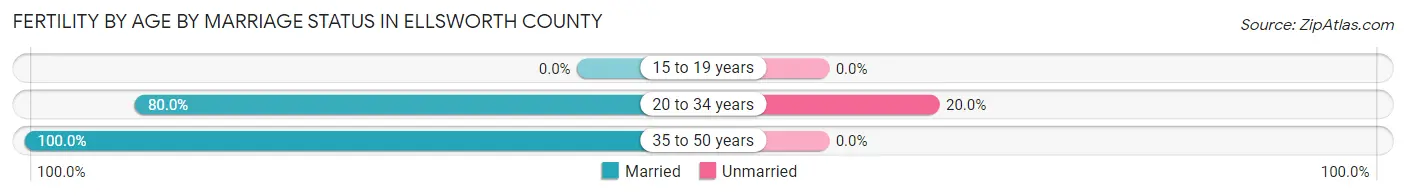
| Age Bracket | Married | Unmarried |
| 15 to 19 years | 0 (0.0%) | 0 (0.0%) |
| 20 to 34 years | 36 (80.0%) | 9 (20.0%) |
| 35 to 50 years | 34 (100.0%) | 0 (0.0%) |
| Total | 70 (88.6%) | 9 (11.4%) |
Fertility by Education in Ellsworth County
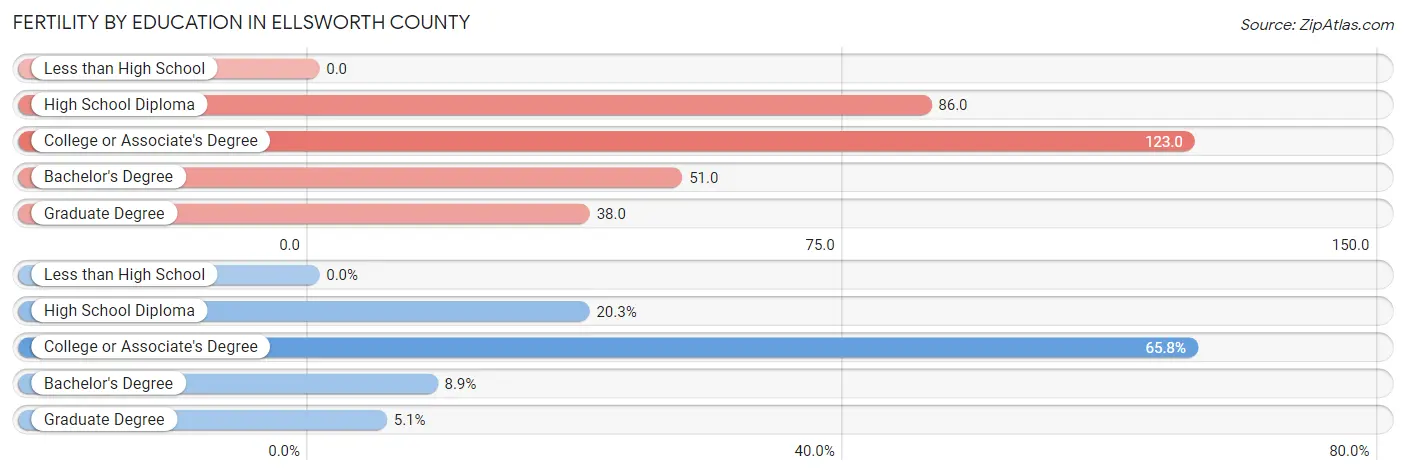
| Educational Attainment | Women with Births | Births / 1,000 Women |
| Less than High School | 0 (0.0%) | 0.0 |
| High School Diploma | 16 (20.3%) | 86.0 |
| College or Associate's Degree | 52 (65.8%) | 123.0 |
| Bachelor's Degree | 7 (8.9%) | 51.0 |
| Graduate Degree | 4 (5.1%) | 38.0 |
| Total | 79 (100.0%) | 80.0 |
Fertility by Education by Marriage Status in Ellsworth County
11.4% of women with births in Ellsworth County are unmarried. Women with the educational attainment of high school diploma are most likely to be married with 100.0% of them married at childbirth, while women with the educational attainment of college or associate's degree are least likely to be married with 17.3% of them unmarried at childbirth.
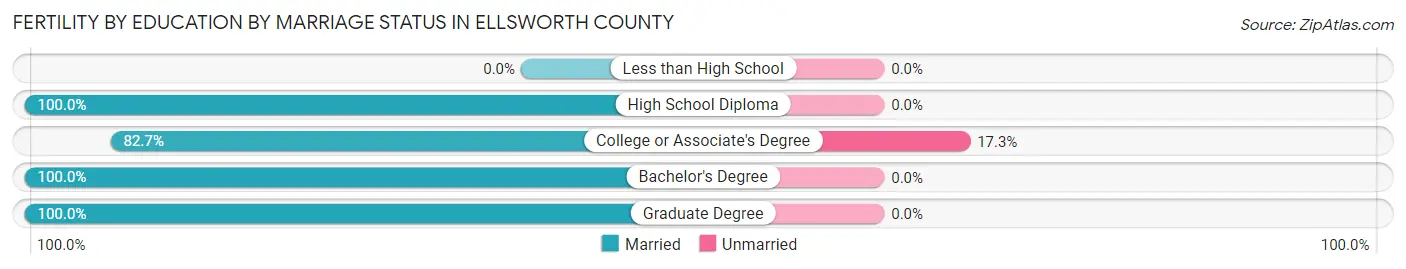
| Educational Attainment | Married | Unmarried |
| Less than High School | 0 (0.0%) | 0 (0.0%) |
| High School Diploma | 16 (100.0%) | 0 (0.0%) |
| College or Associate's Degree | 43 (82.7%) | 9 (17.3%) |
| Bachelor's Degree | 7 (100.0%) | 0 (0.0%) |
| Graduate Degree | 4 (100.0%) | 0 (0.0%) |
| Total | 70 (88.6%) | 9 (11.4%) |
Employment Characteristics in Ellsworth County
Employment by Class of Employer in Ellsworth County
Among the 2,589 employed individuals in Ellsworth County, private company employees (1,480 | 57.2%), local government employees (345 | 13.3%), and self-employed (not incorporated) (254 | 9.8%) make up the most common classes of employment.
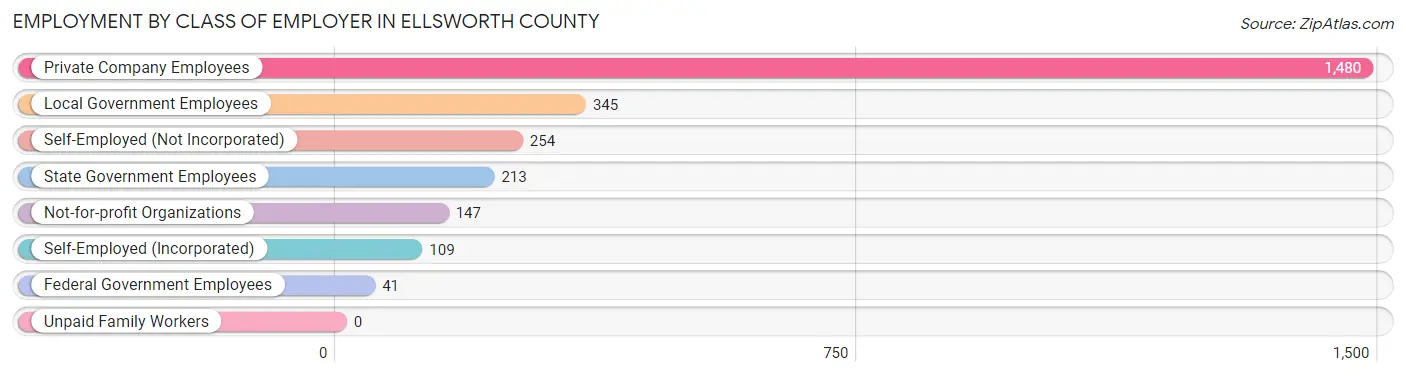
| Employer Class | # Employees | % Employees |
| Private Company Employees | 1,480 | 57.2% |
| Self-Employed (Incorporated) | 109 | 4.2% |
| Self-Employed (Not Incorporated) | 254 | 9.8% |
| Not-for-profit Organizations | 147 | 5.7% |
| Local Government Employees | 345 | 13.3% |
| State Government Employees | 213 | 8.2% |
| Federal Government Employees | 41 | 1.6% |
| Unpaid Family Workers | 0 | 0.0% |
| Total | 2,589 | 100.0% |
Employment Status by Age in Ellsworth County
According to the labor force statistics for Ellsworth County, out of the total population over 16 years of age (5,354), 51.2% or 2,741 individuals are in the labor force, with 3.5% or 96 of them unemployed. The age group with the highest labor force participation rate is 55 to 59 years, with 84.2% or 362 individuals in the labor force. Within the labor force, the 30 to 34 years age range has the highest percentage of unemployed individuals, with 10.5% or 27 of them being unemployed.
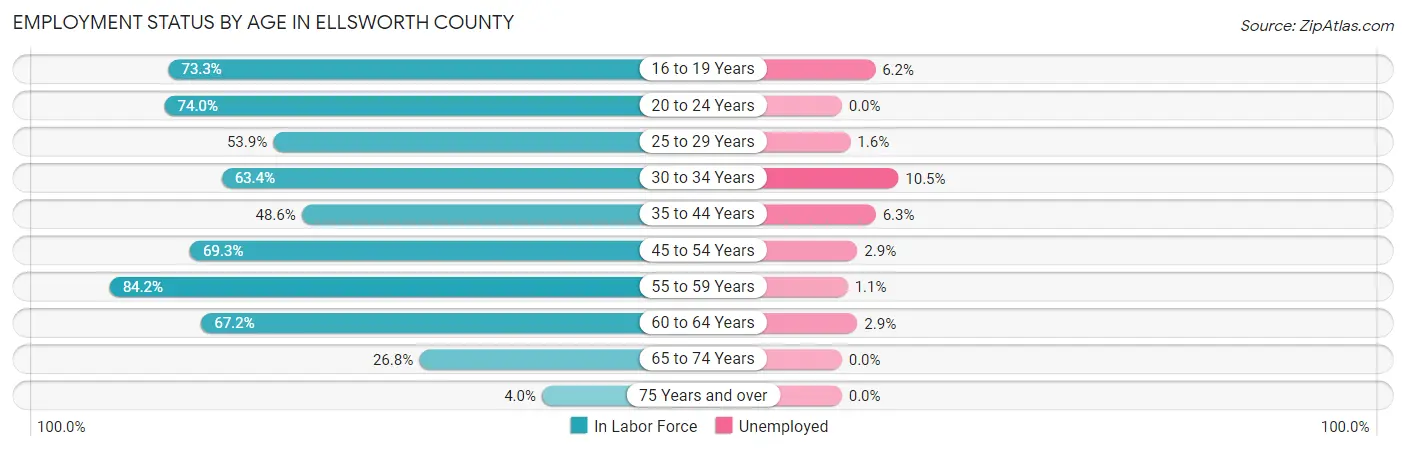
| Age Bracket | In Labor Force | Unemployed |
| 16 to 19 Years | 195 (73.3%) | 12 (6.2%) |
| 20 to 24 Years | 239 (74.0%) | 0 (0.0%) |
| 25 to 29 Years | 247 (53.9%) | 4 (1.6%) |
| 30 to 34 Years | 260 (63.4%) | 27 (10.5%) |
| 35 to 44 Years | 411 (48.6%) | 26 (6.3%) |
| 45 to 54 Years | 486 (69.3%) | 14 (2.9%) |
| 55 to 59 Years | 362 (84.2%) | 4 (1.1%) |
| 60 to 64 Years | 313 (67.2%) | 9 (2.9%) |
| 65 to 74 Years | 200 (26.8%) | 0 (0.0%) |
| 75 Years and over | 28 (4.0%) | 0 (0.0%) |
| Total | 2,741 (51.2%) | 96 (3.5%) |
Employment Status by Educational Attainment in Ellsworth County
According to labor force statistics for Ellsworth County, 62.8% of individuals (2,079) out of the total population between 25 and 64 years of age (3,310) are in the labor force, with 4.1% or 85 of them being unemployed. The group with the highest labor force participation rate are those with the educational attainment of bachelor's degree or higher, with 86.4% or 618 individuals in the labor force. Within the labor force, individuals with high school diploma education have the highest percentage of unemployment, with 8.5% or 46 of them being unemployed.
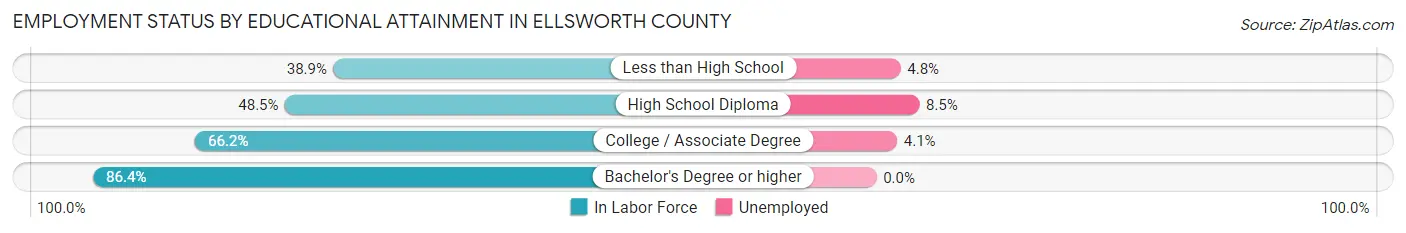
| Educational Attainment | In Labor Force | Unemployed |
| Less than High School | 84 (38.9%) | 10 (4.8%) |
| High School Diploma | 541 (48.5%) | 95 (8.5%) |
| College / Associate Degree | 836 (66.2%) | 52 (4.1%) |
| Bachelor's Degree or higher | 618 (86.4%) | 0 (0.0%) |
| Total | 2,079 (62.8%) | 136 (4.1%) |
Employment Occupations by Sex in Ellsworth County
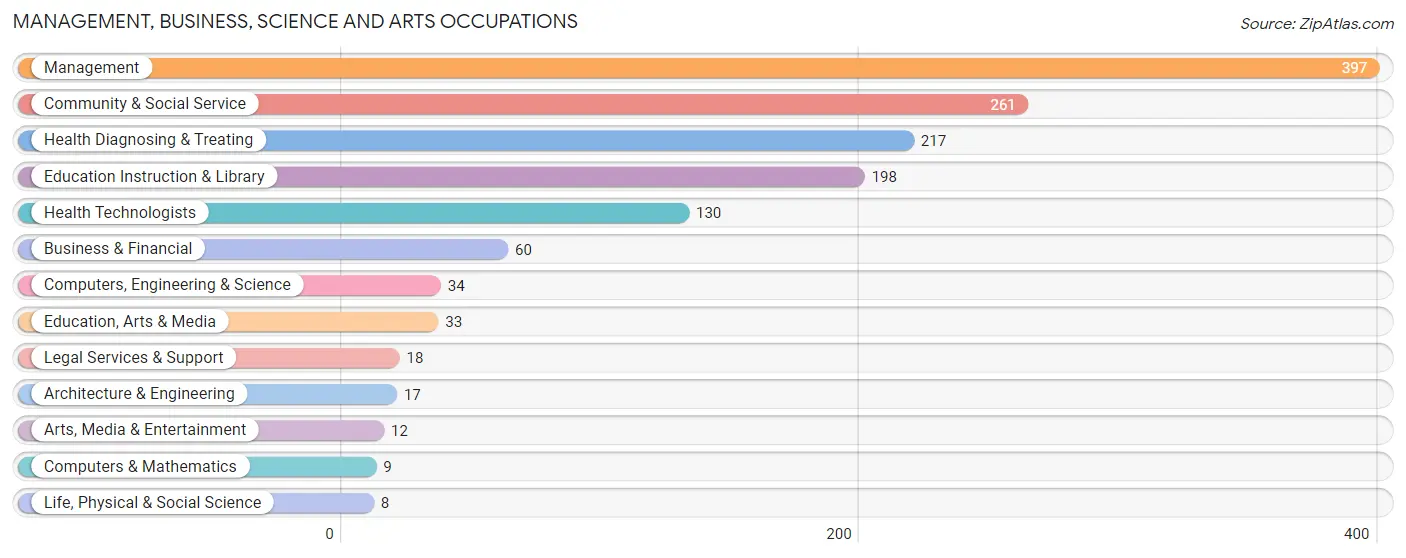
Management, Business, Science and Arts Occupations
The most common Management, Business, Science and Arts occupations in Ellsworth County are Management (397 | 15.0%), Community & Social Service (261 | 9.9%), Health Diagnosing & Treating (217 | 8.2%), Education Instruction & Library (198 | 7.5%), and Health Technologists (130 | 4.9%).
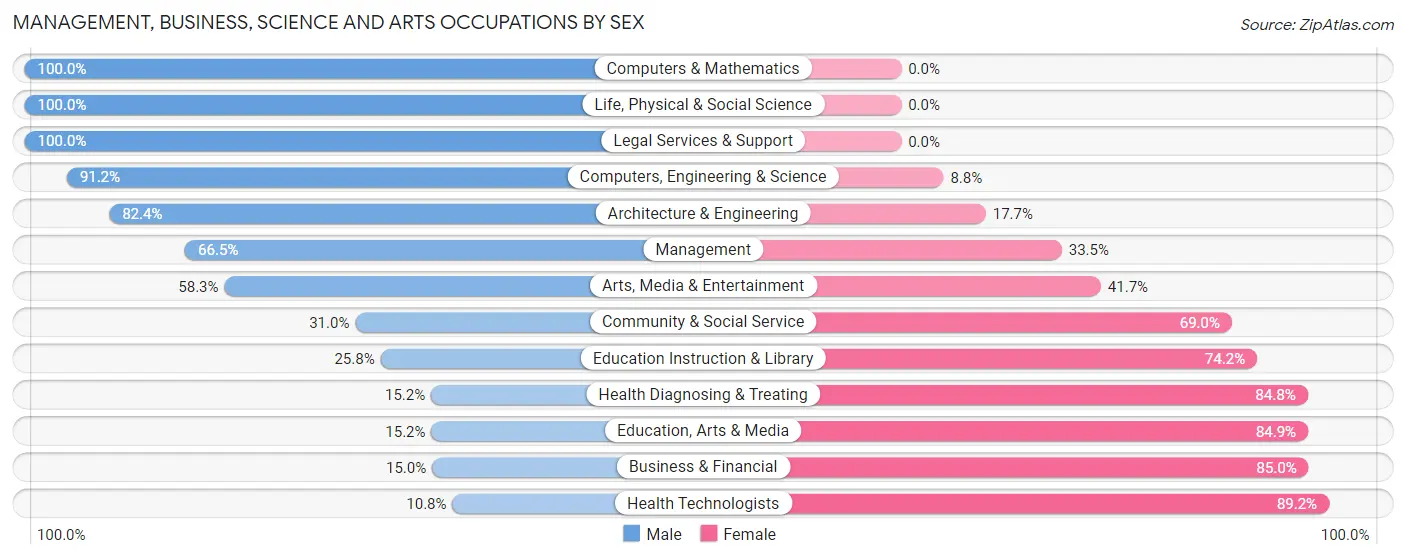
Management, Business, Science and Arts Occupations by Sex
Within the Management, Business, Science and Arts occupations in Ellsworth County, the most male-oriented occupations are Computers & Mathematics (100.0%), Life, Physical & Social Science (100.0%), and Legal Services & Support (100.0%), while the most female-oriented occupations are Health Technologists (89.2%), Business & Financial (85.0%), and Education, Arts & Media (84.9%).
| Occupation | Male | Female |
| Management | 264 (66.5%) | 133 (33.5%) |
| Business & Financial | 9 (15.0%) | 51 (85.0%) |
| Computers, Engineering & Science | 31 (91.2%) | 3 (8.8%) |
| Computers & Mathematics | 9 (100.0%) | 0 (0.0%) |
| Architecture & Engineering | 14 (82.4%) | 3 (17.6%) |
| Life, Physical & Social Science | 8 (100.0%) | 0 (0.0%) |
| Community & Social Service | 81 (31.0%) | 180 (69.0%) |
| Education, Arts & Media | 5 (15.1%) | 28 (84.9%) |
| Legal Services & Support | 18 (100.0%) | 0 (0.0%) |
| Education Instruction & Library | 51 (25.8%) | 147 (74.2%) |
| Arts, Media & Entertainment | 7 (58.3%) | 5 (41.7%) |
| Health Diagnosing & Treating | 33 (15.2%) | 184 (84.8%) |
| Health Technologists | 14 (10.8%) | 116 (89.2%) |
| Total (Category) | 418 (43.1%) | 551 (56.9%) |
| Total (Overall) | 1,417 (53.7%) | 1,221 (46.3%) |
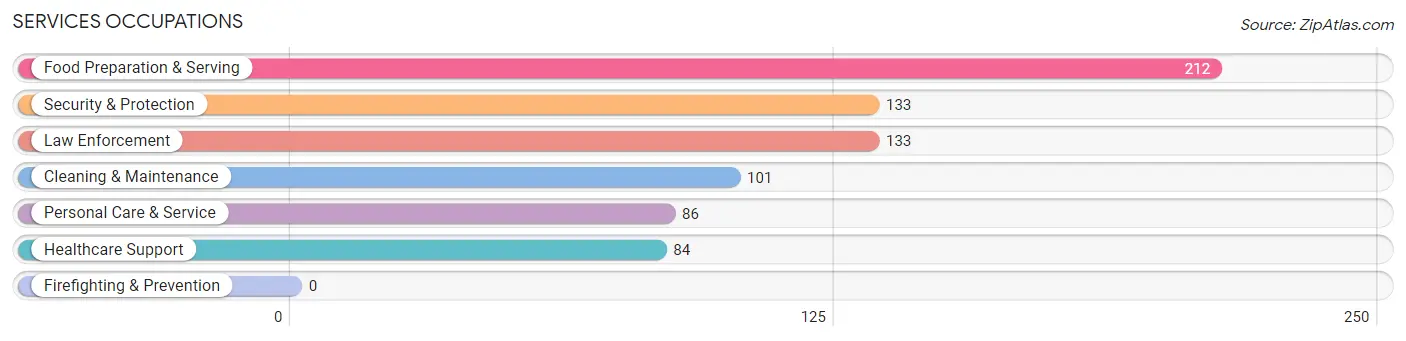
Services Occupations
The most common Services occupations in Ellsworth County are Food Preparation & Serving (212 | 8.0%), Security & Protection (133 | 5.0%), Law Enforcement (133 | 5.0%), Cleaning & Maintenance (101 | 3.8%), and Personal Care & Service (86 | 3.3%).
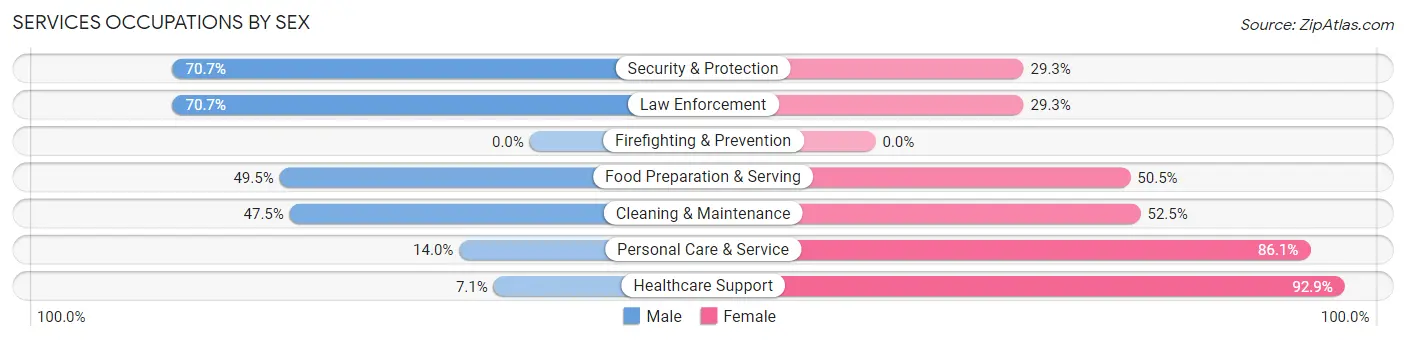
Services Occupations by Sex
Within the Services occupations in Ellsworth County, the most male-oriented occupations are Security & Protection (70.7%), Law Enforcement (70.7%), and Food Preparation & Serving (49.5%), while the most female-oriented occupations are Healthcare Support (92.9%), Personal Care & Service (86.1%), and Cleaning & Maintenance (52.5%).
| Occupation | Male | Female |
| Healthcare Support | 6 (7.1%) | 78 (92.9%) |
| Security & Protection | 94 (70.7%) | 39 (29.3%) |
| Firefighting & Prevention | 0 (0.0%) | 0 (0.0%) |
| Law Enforcement | 94 (70.7%) | 39 (29.3%) |
| Food Preparation & Serving | 105 (49.5%) | 107 (50.5%) |
| Cleaning & Maintenance | 48 (47.5%) | 53 (52.5%) |
| Personal Care & Service | 12 (14.0%) | 74 (86.1%) |
| Total (Category) | 265 (43.0%) | 351 (57.0%) |
| Total (Overall) | 1,417 (53.7%) | 1,221 (46.3%) |
Sales and Office Occupations
The most common Sales and Office occupations in Ellsworth County are Office & Administration (231 | 8.8%), and Sales & Related (127 | 4.8%).
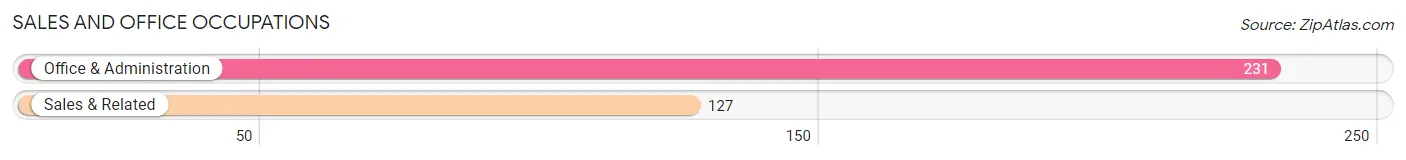
Sales and Office Occupations by Sex
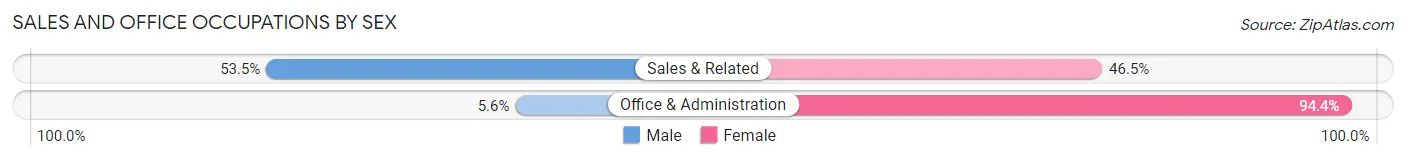
| Occupation | Male | Female |
| Sales & Related | 68 (53.5%) | 59 (46.5%) |
| Office & Administration | 13 (5.6%) | 218 (94.4%) |
| Total (Category) | 81 (22.6%) | 277 (77.4%) |
| Total (Overall) | 1,417 (53.7%) | 1,221 (46.3%) |
Natural Resources, Construction and Maintenance Occupations
The most common Natural Resources, Construction and Maintenance occupations in Ellsworth County are Construction & Extraction (134 | 5.1%), Installation, Maintenance & Repair (124 | 4.7%), and Farming, Fishing & Forestry (72 | 2.7%).
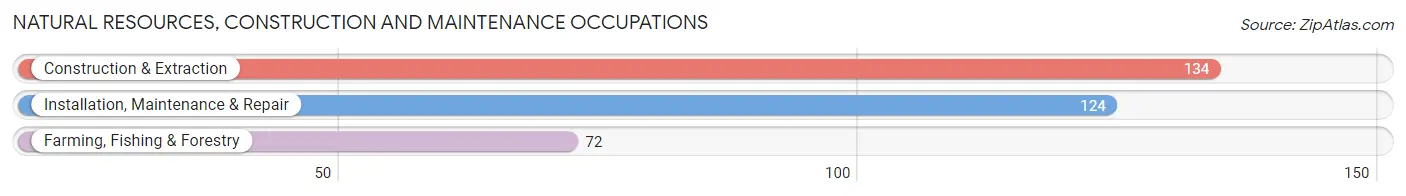
Natural Resources, Construction and Maintenance Occupations by Sex
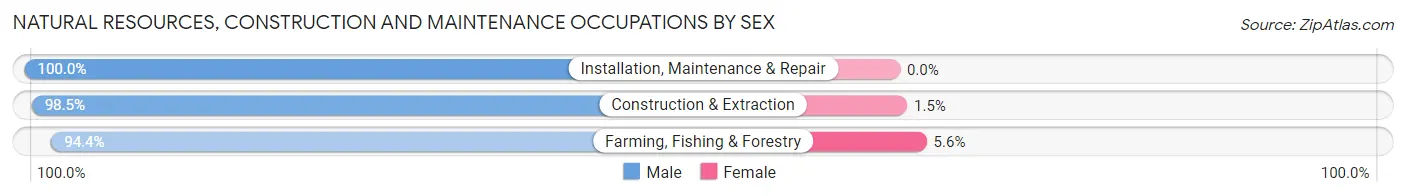
| Occupation | Male | Female |
| Farming, Fishing & Forestry | 68 (94.4%) | 4 (5.6%) |
| Construction & Extraction | 132 (98.5%) | 2 (1.5%) |
| Installation, Maintenance & Repair | 124 (100.0%) | 0 (0.0%) |
| Total (Category) | 324 (98.2%) | 6 (1.8%) |
| Total (Overall) | 1,417 (53.7%) | 1,221 (46.3%) |
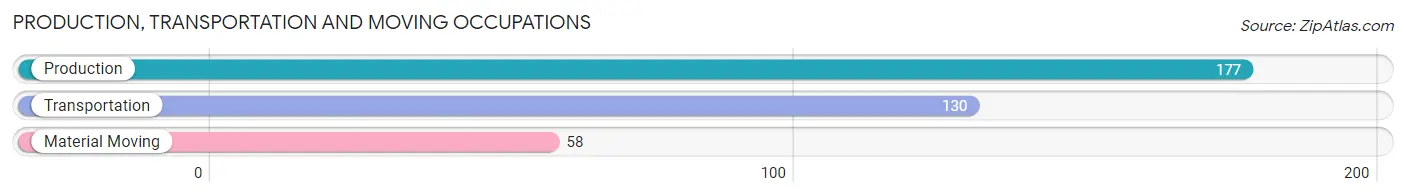
Production, Transportation and Moving Occupations
The most common Production, Transportation and Moving occupations in Ellsworth County are Production (177 | 6.7%), Transportation (130 | 4.9%), and Material Moving (58 | 2.2%).
Production, Transportation and Moving Occupations by Sex
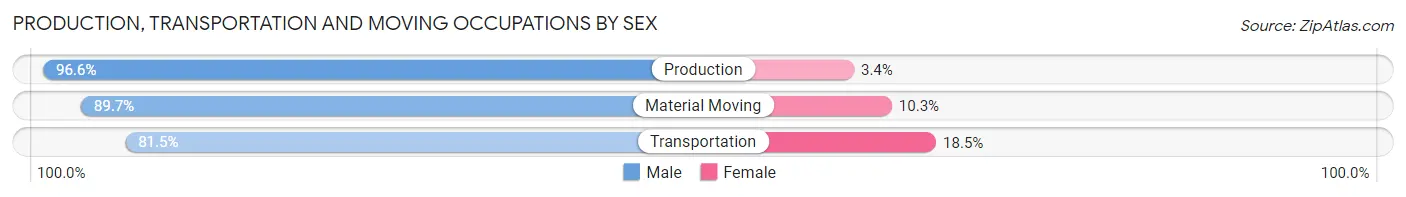
| Occupation | Male | Female |
| Production | 171 (96.6%) | 6 (3.4%) |
| Transportation | 106 (81.5%) | 24 (18.5%) |
| Material Moving | 52 (89.7%) | 6 (10.3%) |
| Total (Category) | 329 (90.1%) | 36 (9.9%) |
| Total (Overall) | 1,417 (53.7%) | 1,221 (46.3%) |
Employment Industries by Sex in Ellsworth County
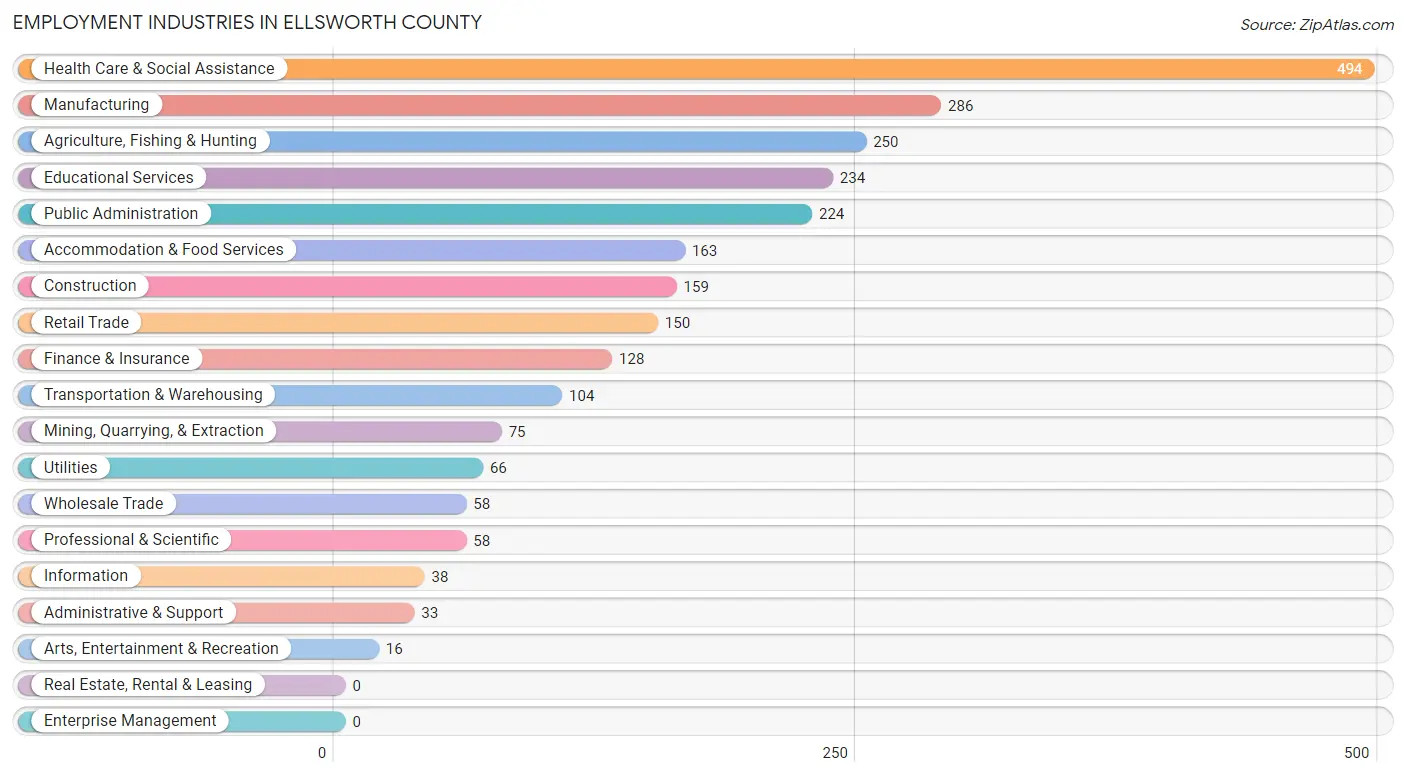
Employment Industries in Ellsworth County
The major employment industries in Ellsworth County include Health Care & Social Assistance (494 | 18.7%), Manufacturing (286 | 10.8%), Agriculture, Fishing & Hunting (250 | 9.5%), Educational Services (234 | 8.9%), and Public Administration (224 | 8.5%).
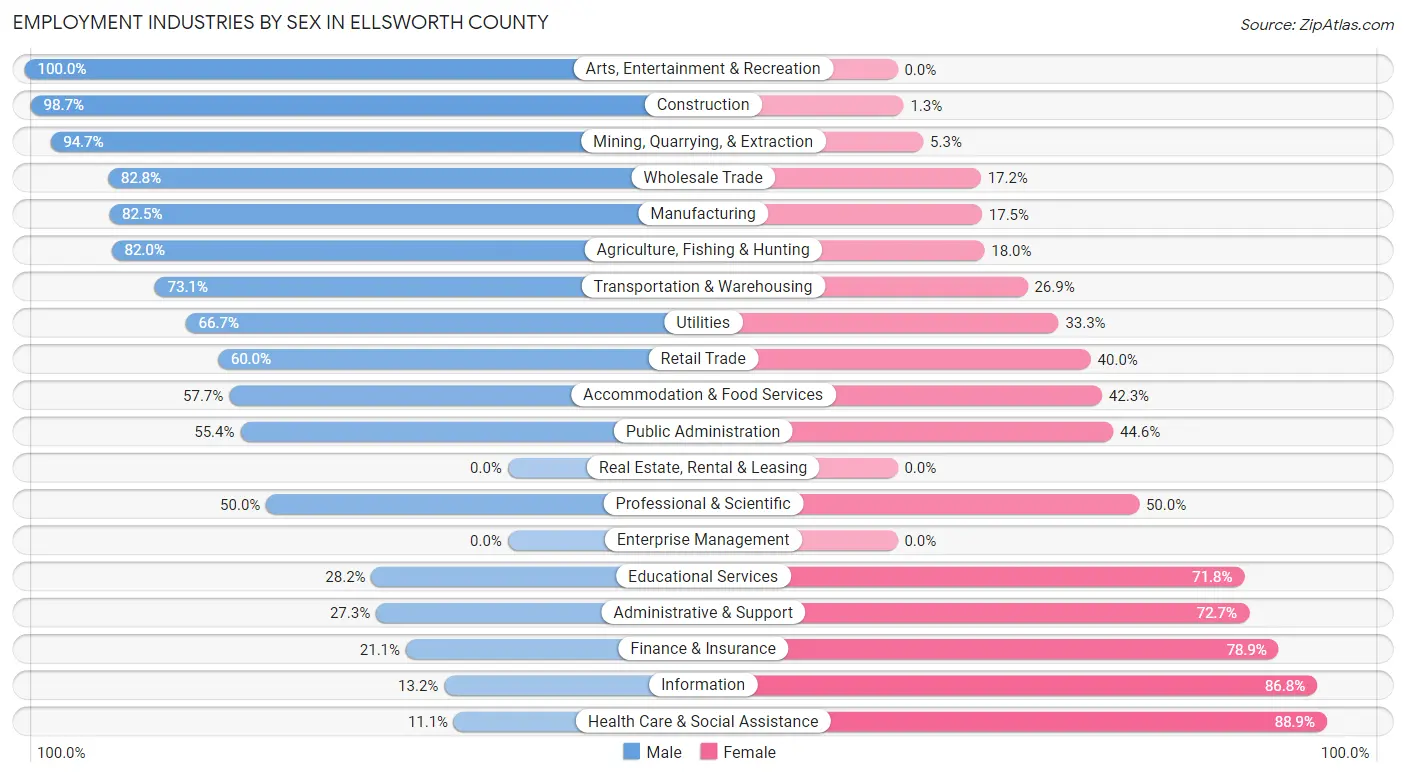
Employment Industries by Sex in Ellsworth County
The Ellsworth County industries that see more men than women are Arts, Entertainment & Recreation (100.0%), Construction (98.7%), and Mining, Quarrying, & Extraction (94.7%), whereas the industries that tend to have a higher number of women are Health Care & Social Assistance (88.9%), Information (86.8%), and Finance & Insurance (78.9%).
| Industry | Male | Female |
| Agriculture, Fishing & Hunting | 205 (82.0%) | 45 (18.0%) |
| Mining, Quarrying, & Extraction | 71 (94.7%) | 4 (5.3%) |
| Construction | 157 (98.7%) | 2 (1.3%) |
| Manufacturing | 236 (82.5%) | 50 (17.5%) |
| Wholesale Trade | 48 (82.8%) | 10 (17.2%) |
| Retail Trade | 90 (60.0%) | 60 (40.0%) |
| Transportation & Warehousing | 76 (73.1%) | 28 (26.9%) |
| Utilities | 44 (66.7%) | 22 (33.3%) |
| Information | 5 (13.2%) | 33 (86.8%) |
| Finance & Insurance | 27 (21.1%) | 101 (78.9%) |
| Real Estate, Rental & Leasing | 0 (0.0%) | 0 (0.0%) |
| Professional & Scientific | 29 (50.0%) | 29 (50.0%) |
| Enterprise Management | 0 (0.0%) | 0 (0.0%) |
| Administrative & Support | 9 (27.3%) | 24 (72.7%) |
| Educational Services | 66 (28.2%) | 168 (71.8%) |
| Health Care & Social Assistance | 55 (11.1%) | 439 (88.9%) |
| Arts, Entertainment & Recreation | 16 (100.0%) | 0 (0.0%) |
| Accommodation & Food Services | 94 (57.7%) | 69 (42.3%) |
| Public Administration | 124 (55.4%) | 100 (44.6%) |
| Total | 1,417 (53.7%) | 1,221 (46.3%) |
Education in Ellsworth County
School Enrollment in Ellsworth County
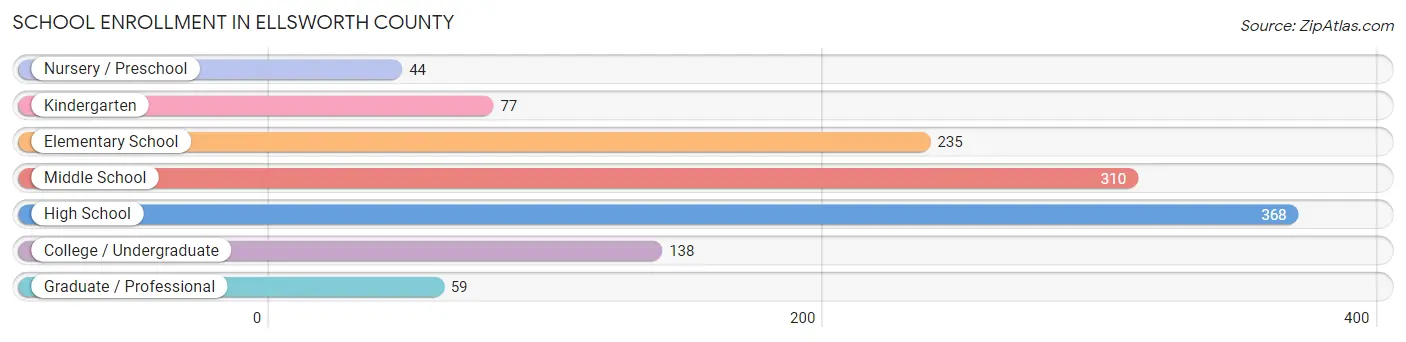
The most common levels of schooling among the 1,231 students in Ellsworth County are high school (368 | 29.9%), middle school (310 | 25.2%), and elementary school (235 | 19.1%).
| School Level | # Students | % Students |
| Nursery / Preschool | 44 | 3.6% |
| Kindergarten | 77 | 6.3% |
| Elementary School | 235 | 19.1% |
| Middle School | 310 | 25.2% |
| High School | 368 | 29.9% |
| College / Undergraduate | 138 | 11.2% |
| Graduate / Professional | 59 | 4.8% |
| Total | 1,231 | 100.0% |
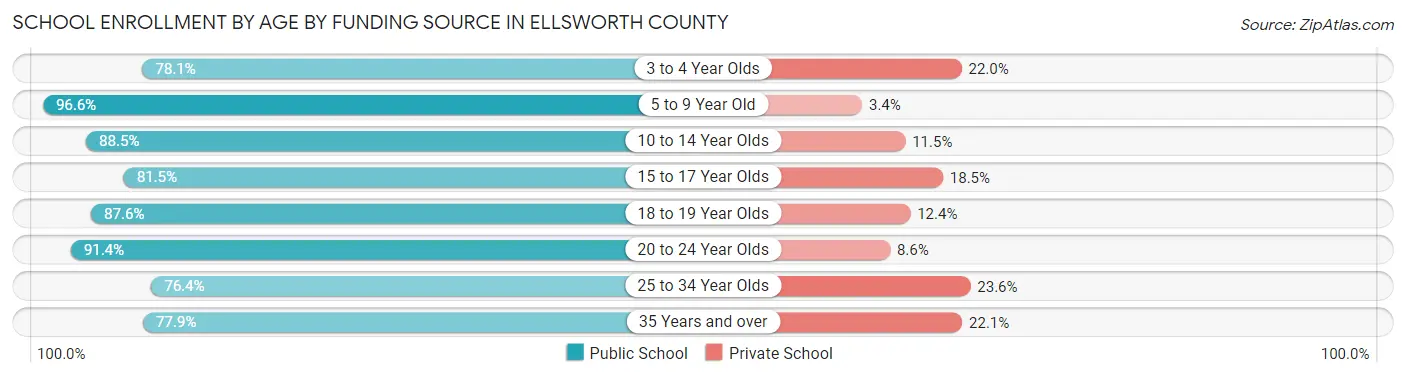
School Enrollment by Age by Funding Source in Ellsworth County
Out of a total of 1,231 students who are enrolled in schools in Ellsworth County, 158 (12.8%) attend a private institution, while the remaining 1,073 (87.2%) are enrolled in public schools. The age group of 25 to 34 year olds has the highest likelihood of being enrolled in private schools, with 21 (23.6% in the age bracket) enrolled. Conversely, the age group of 5 to 9 year old has the lowest likelihood of being enrolled in a private school, with 226 (96.6% in the age bracket) attending a public institution.
| Age Bracket | Public School | Private School |
| 3 to 4 Year Olds | 32 (78.0%) | 9 (22.0%) |
| 5 to 9 Year Old | 226 (96.6%) | 8 (3.4%) |
| 10 to 14 Year Olds | 386 (88.5%) | 50 (11.5%) |
| 15 to 17 Year Olds | 150 (81.5%) | 34 (18.5%) |
| 18 to 19 Year Olds | 106 (87.6%) | 15 (12.4%) |
| 20 to 24 Year Olds | 53 (91.4%) | 5 (8.6%) |
| 25 to 34 Year Olds | 68 (76.4%) | 21 (23.6%) |
| 35 Years and over | 53 (77.9%) | 15 (22.1%) |
| Total | 1,073 (87.2%) | 158 (12.8%) |
Educational Attainment by Field of Study in Ellsworth County
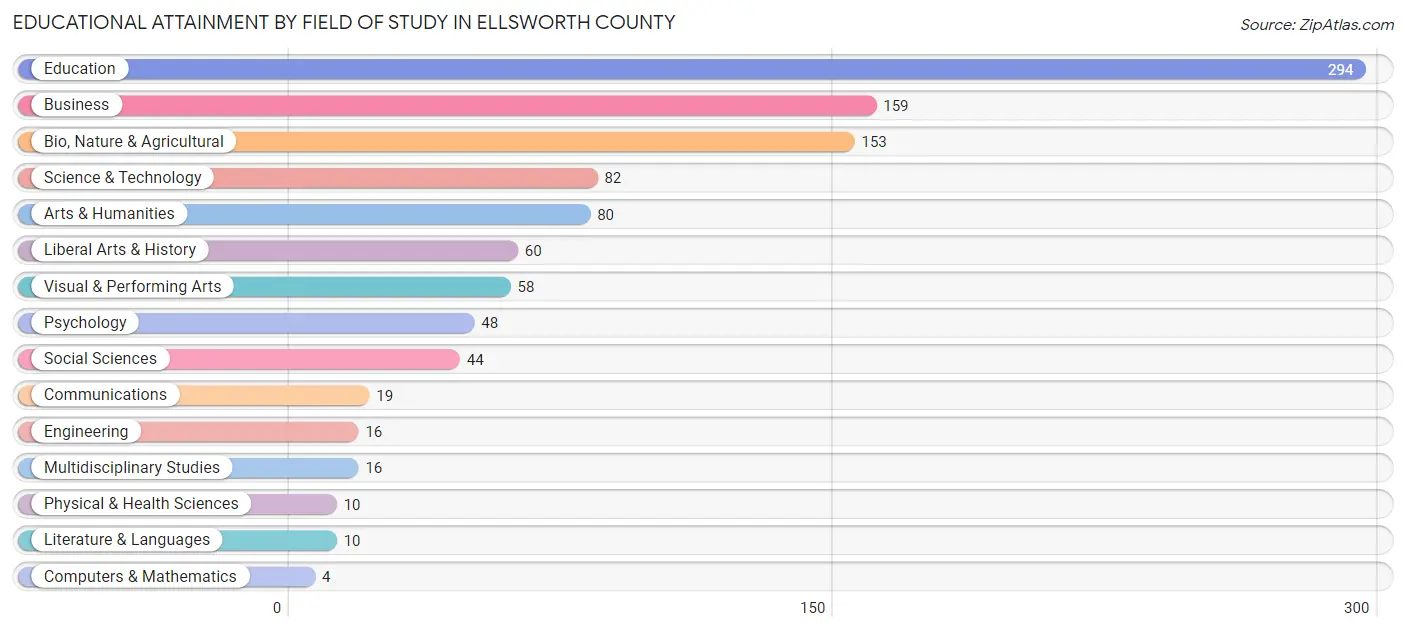
Education (294 | 27.9%), business (159 | 15.1%), bio, nature & agricultural (153 | 14.5%), science & technology (82 | 7.8%), and arts & humanities (80 | 7.6%) are the most common fields of study among 1,053 individuals in Ellsworth County who have obtained a bachelor's degree or higher.
| Field of Study | # Graduates | % Graduates |
| Computers & Mathematics | 4 | 0.4% |
| Bio, Nature & Agricultural | 153 | 14.5% |
| Physical & Health Sciences | 10 | 0.9% |
| Psychology | 48 | 4.6% |
| Social Sciences | 44 | 4.2% |
| Engineering | 16 | 1.5% |
| Multidisciplinary Studies | 16 | 1.5% |
| Science & Technology | 82 | 7.8% |
| Business | 159 | 15.1% |
| Education | 294 | 27.9% |
| Literature & Languages | 10 | 0.9% |
| Liberal Arts & History | 60 | 5.7% |
| Visual & Performing Arts | 58 | 5.5% |
| Communications | 19 | 1.8% |
| Arts & Humanities | 80 | 7.6% |
| Total | 1,053 | 100.0% |
Transportation & Commute in Ellsworth County
Vehicle Availability by Sex in Ellsworth County
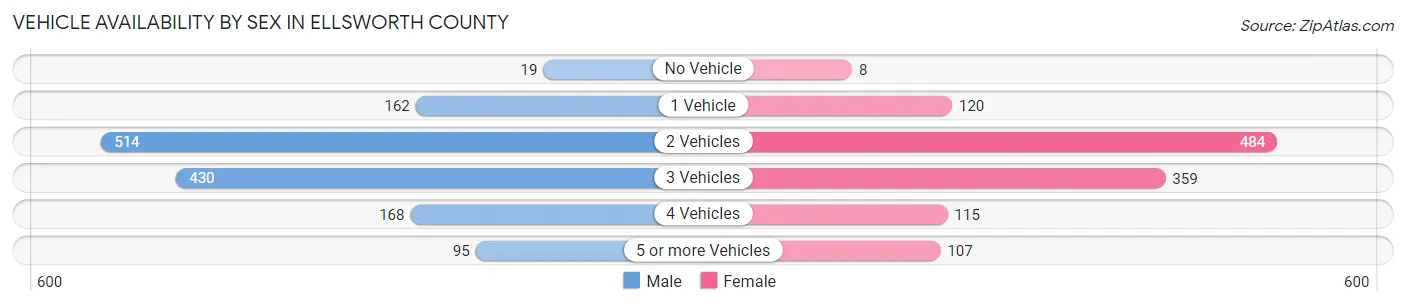
The most prevalent vehicle ownership categories in Ellsworth County are males with 2 vehicles (514, accounting for 37.0%) and females with 2 vehicles (484, making up 43.1%).
| Vehicles Available | Male | Female |
| No Vehicle | 19 (1.4%) | 8 (0.7%) |
| 1 Vehicle | 162 (11.7%) | 120 (10.1%) |
| 2 Vehicles | 514 (37.0%) | 484 (40.6%) |
| 3 Vehicles | 430 (31.0%) | 359 (30.1%) |
| 4 Vehicles | 168 (12.1%) | 115 (9.6%) |
| 5 or more Vehicles | 95 (6.8%) | 107 (9.0%) |
| Total | 1,388 (100.0%) | 1,193 (100.0%) |
Commute Time in Ellsworth County
The most frequently occuring commute durations in Ellsworth County are 5 to 9 minutes (620 commuters, 25.7%), less than 5 minutes (357 commuters, 14.8%), and 10 to 14 minutes (310 commuters, 12.8%).
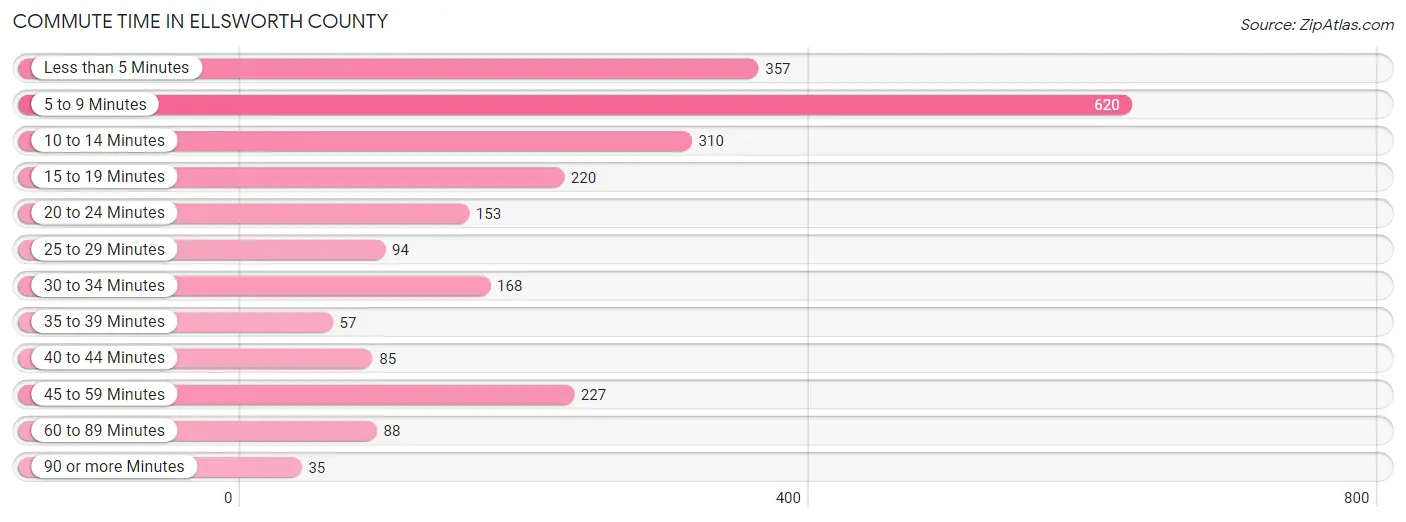
| Commute Time | # Commuters | % Commuters |
| Less than 5 Minutes | 357 | 14.8% |
| 5 to 9 Minutes | 620 | 25.7% |
| 10 to 14 Minutes | 310 | 12.8% |
| 15 to 19 Minutes | 220 | 9.1% |
| 20 to 24 Minutes | 153 | 6.3% |
| 25 to 29 Minutes | 94 | 3.9% |
| 30 to 34 Minutes | 168 | 7.0% |
| 35 to 39 Minutes | 57 | 2.4% |
| 40 to 44 Minutes | 85 | 3.5% |
| 45 to 59 Minutes | 227 | 9.4% |
| 60 to 89 Minutes | 88 | 3.6% |
| 90 or more Minutes | 35 | 1.5% |
Commute Time by Sex in Ellsworth County
The most common commute times in Ellsworth County are 5 to 9 minutes (340 commuters, 25.6%) for males and 5 to 9 minutes (280 commuters, 25.8%) for females.
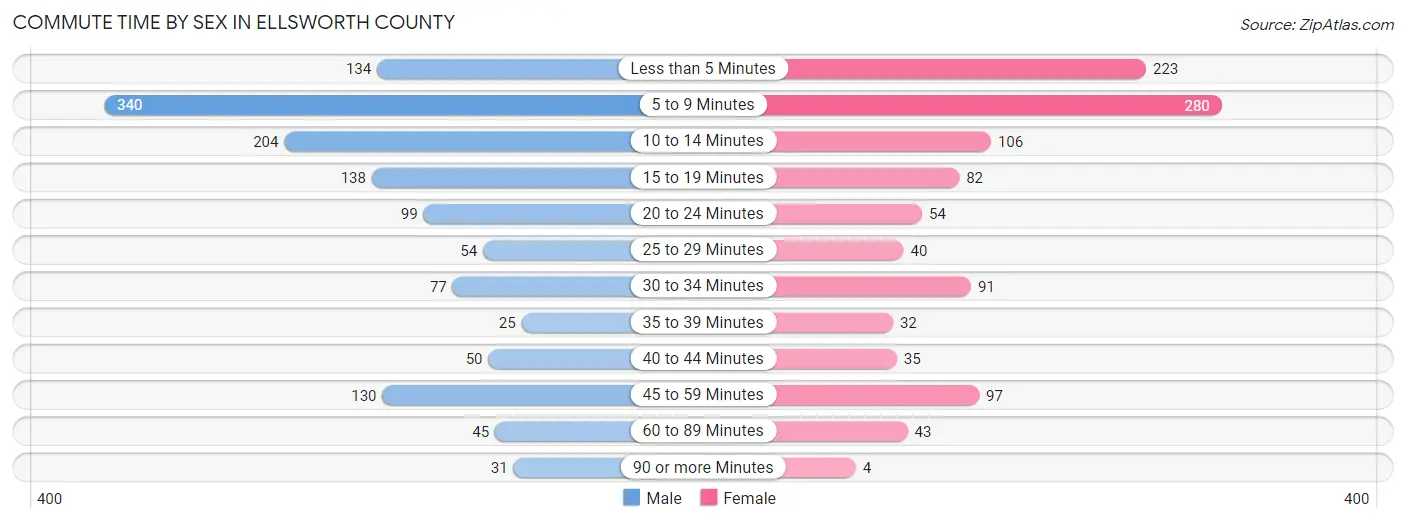
| Commute Time | Male | Female |
| Less than 5 Minutes | 134 (10.1%) | 223 (20.5%) |
| 5 to 9 Minutes | 340 (25.6%) | 280 (25.8%) |
| 10 to 14 Minutes | 204 (15.4%) | 106 (9.8%) |
| 15 to 19 Minutes | 138 (10.4%) | 82 (7.5%) |
| 20 to 24 Minutes | 99 (7.5%) | 54 (5.0%) |
| 25 to 29 Minutes | 54 (4.1%) | 40 (3.7%) |
| 30 to 34 Minutes | 77 (5.8%) | 91 (8.4%) |
| 35 to 39 Minutes | 25 (1.9%) | 32 (2.9%) |
| 40 to 44 Minutes | 50 (3.8%) | 35 (3.2%) |
| 45 to 59 Minutes | 130 (9.8%) | 97 (8.9%) |
| 60 to 89 Minutes | 45 (3.4%) | 43 (4.0%) |
| 90 or more Minutes | 31 (2.3%) | 4 (0.4%) |
Time of Departure to Work by Sex in Ellsworth County
The most frequent times of departure to work in Ellsworth County are 7:00 AM to 7:29 AM (257, 19.4%) for males and 7:30 AM to 7:59 AM (192, 17.7%) for females.
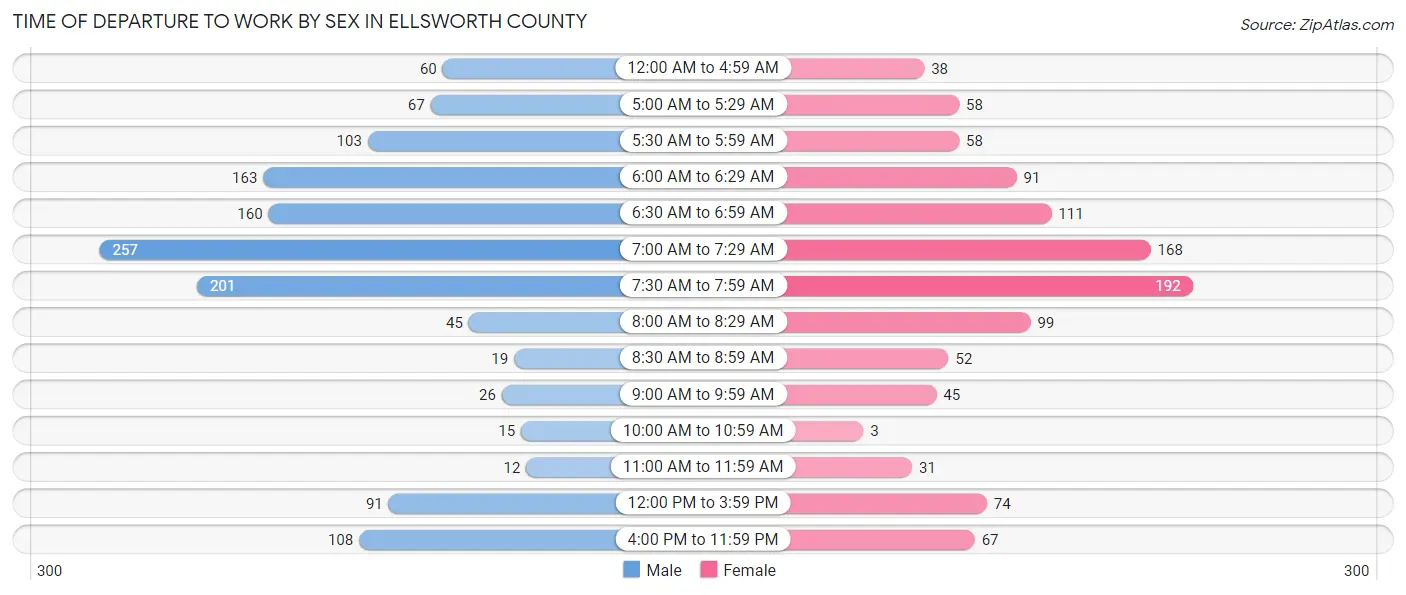
| Time of Departure | Male | Female |
| 12:00 AM to 4:59 AM | 60 (4.5%) | 38 (3.5%) |
| 5:00 AM to 5:29 AM | 67 (5.1%) | 58 (5.3%) |
| 5:30 AM to 5:59 AM | 103 (7.8%) | 58 (5.3%) |
| 6:00 AM to 6:29 AM | 163 (12.3%) | 91 (8.4%) |
| 6:30 AM to 6:59 AM | 160 (12.1%) | 111 (10.2%) |
| 7:00 AM to 7:29 AM | 257 (19.4%) | 168 (15.5%) |
| 7:30 AM to 7:59 AM | 201 (15.1%) | 192 (17.7%) |
| 8:00 AM to 8:29 AM | 45 (3.4%) | 99 (9.1%) |
| 8:30 AM to 8:59 AM | 19 (1.4%) | 52 (4.8%) |
| 9:00 AM to 9:59 AM | 26 (2.0%) | 45 (4.1%) |
| 10:00 AM to 10:59 AM | 15 (1.1%) | 3 (0.3%) |
| 11:00 AM to 11:59 AM | 12 (0.9%) | 31 (2.9%) |
| 12:00 PM to 3:59 PM | 91 (6.9%) | 74 (6.8%) |
| 4:00 PM to 11:59 PM | 108 (8.1%) | 67 (6.2%) |
| Total | 1,327 (100.0%) | 1,087 (100.0%) |
Housing Occupancy in Ellsworth County
Occupancy by Ownership in Ellsworth County
Of the total 2,305 dwellings in Ellsworth County, owner-occupied units account for 1,877 (81.4%), while renter-occupied units make up 428 (18.6%).
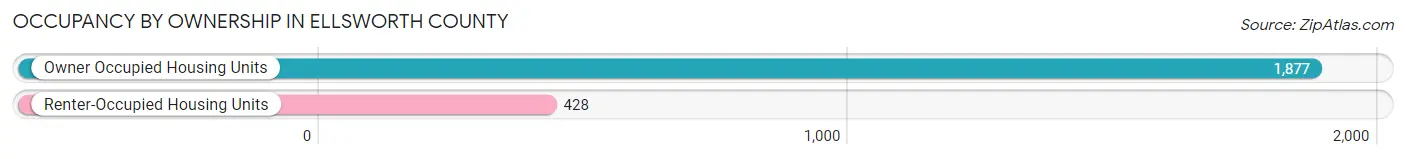
| Occupancy | # Housing Units | % Housing Units |
| Owner Occupied Housing Units | 1,877 | 81.4% |
| Renter-Occupied Housing Units | 428 | 18.6% |
| Total Occupied Housing Units | 2,305 | 100.0% |
Occupancy by Household Size in Ellsworth County
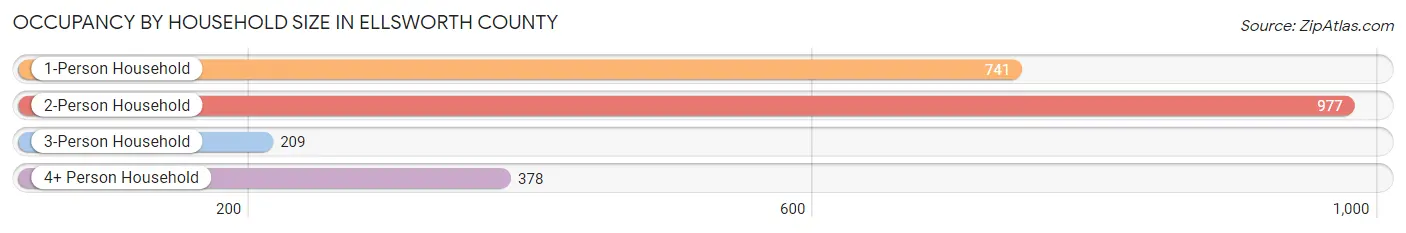
| Household Size | # Housing Units | % Housing Units |
| 1-Person Household | 741 | 32.2% |
| 2-Person Household | 977 | 42.4% |
| 3-Person Household | 209 | 9.1% |
| 4+ Person Household | 378 | 16.4% |
| Total Housing Units | 2,305 | 100.0% |
Occupancy by Ownership by Household Size in Ellsworth County
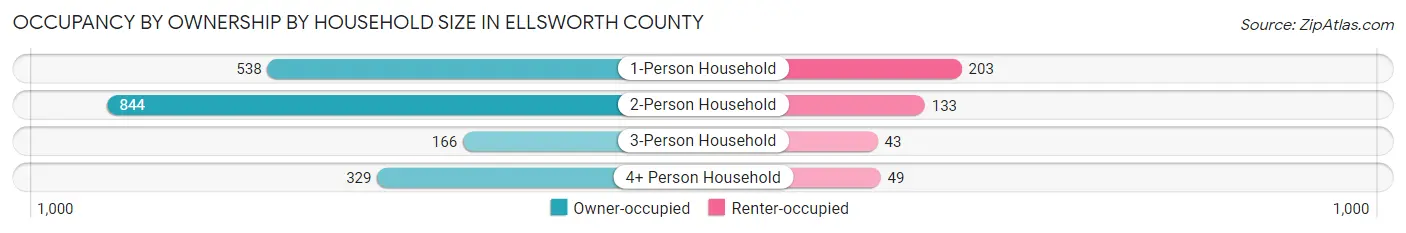
| Household Size | Owner-occupied | Renter-occupied |
| 1-Person Household | 538 (72.6%) | 203 (27.4%) |
| 2-Person Household | 844 (86.4%) | 133 (13.6%) |
| 3-Person Household | 166 (79.4%) | 43 (20.6%) |
| 4+ Person Household | 329 (87.0%) | 49 (13.0%) |
| Total Housing Units | 1,877 (81.4%) | 428 (18.6%) |
Occupancy by Educational Attainment in Ellsworth County
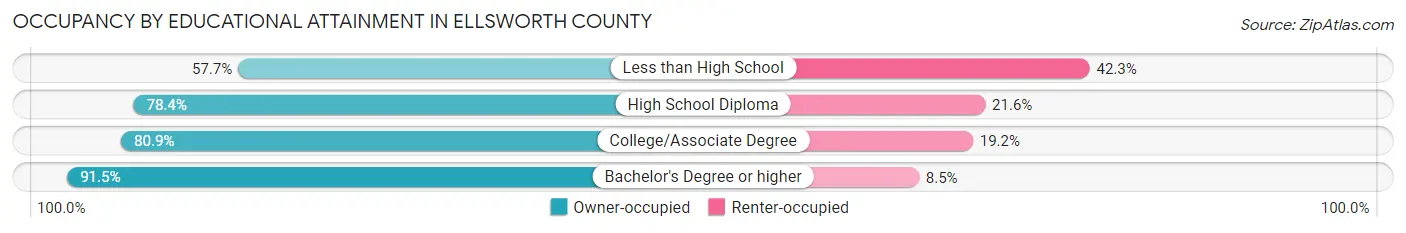
| Household Size | Owner-occupied | Renter-occupied |
| Less than High School | 60 (57.7%) | 44 (42.3%) |
| High School Diploma | 537 (78.4%) | 148 (21.6%) |
| College/Associate Degree | 815 (80.8%) | 193 (19.2%) |
| Bachelor's Degree or higher | 465 (91.5%) | 43 (8.5%) |
Occupancy by Age of Householder in Ellsworth County
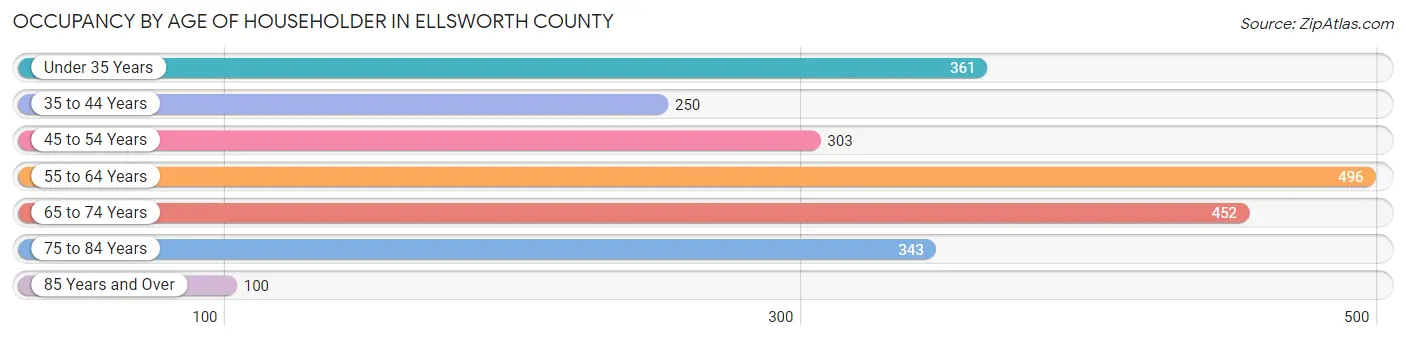
| Age Bracket | # Households | % Households |
| Under 35 Years | 361 | 15.7% |
| 35 to 44 Years | 250 | 10.8% |
| 45 to 54 Years | 303 | 13.2% |
| 55 to 64 Years | 496 | 21.5% |
| 65 to 74 Years | 452 | 19.6% |
| 75 to 84 Years | 343 | 14.9% |
| 85 Years and Over | 100 | 4.3% |
| Total | 2,305 | 100.0% |
Housing Finances in Ellsworth County
Median Income by Occupancy in Ellsworth County
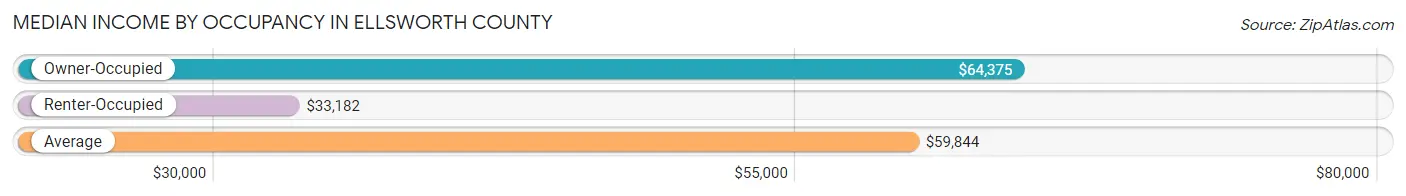
| Occupancy Type | # Households | Median Income |
| Owner-Occupied | 1,877 (81.4%) | $64,375 |
| Renter-Occupied | 428 (18.6%) | $33,182 |
| Average | 2,305 (100.0%) | $59,844 |
Occupancy by Householder Income Bracket in Ellsworth County
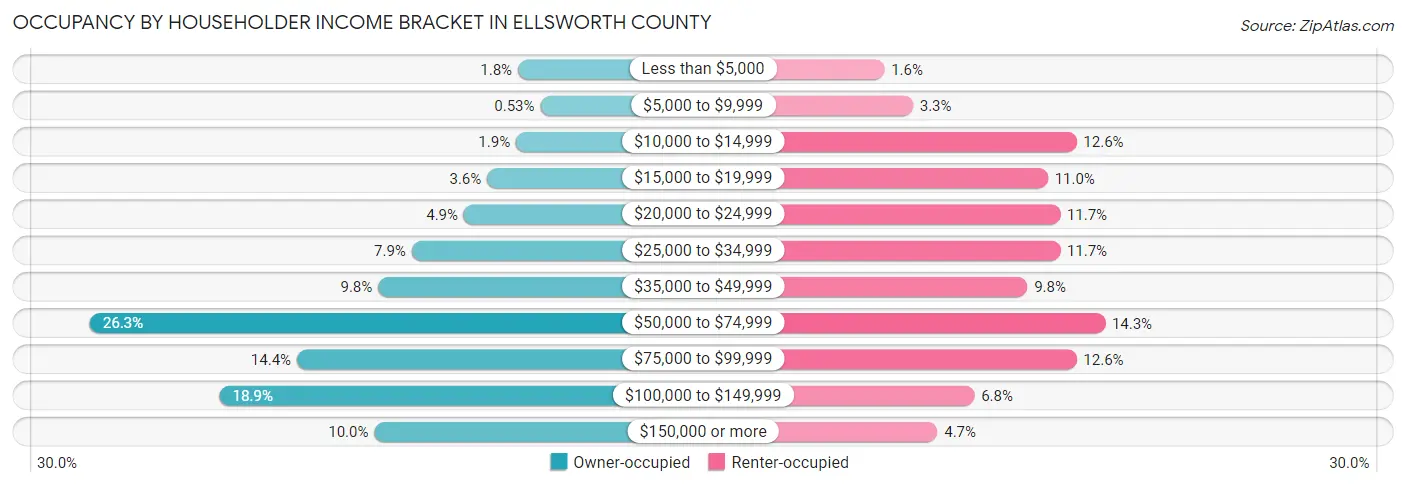
| Income Bracket | Owner-occupied | Renter-occupied |
| Less than $5,000 | 34 (1.8%) | 7 (1.6%) |
| $5,000 to $9,999 | 10 (0.5%) | 14 (3.3%) |
| $10,000 to $14,999 | 36 (1.9%) | 54 (12.6%) |
| $15,000 to $19,999 | 67 (3.6%) | 47 (11.0%) |
| $20,000 to $24,999 | 92 (4.9%) | 50 (11.7%) |
| $25,000 to $34,999 | 148 (7.9%) | 50 (11.7%) |
| $35,000 to $49,999 | 184 (9.8%) | 42 (9.8%) |
| $50,000 to $74,999 | 493 (26.3%) | 61 (14.2%) |
| $75,000 to $99,999 | 271 (14.4%) | 54 (12.6%) |
| $100,000 to $149,999 | 354 (18.9%) | 29 (6.8%) |
| $150,000 or more | 188 (10.0%) | 20 (4.7%) |
| Total | 1,877 (100.0%) | 428 (100.0%) |
Monthly Housing Cost Tiers in Ellsworth County
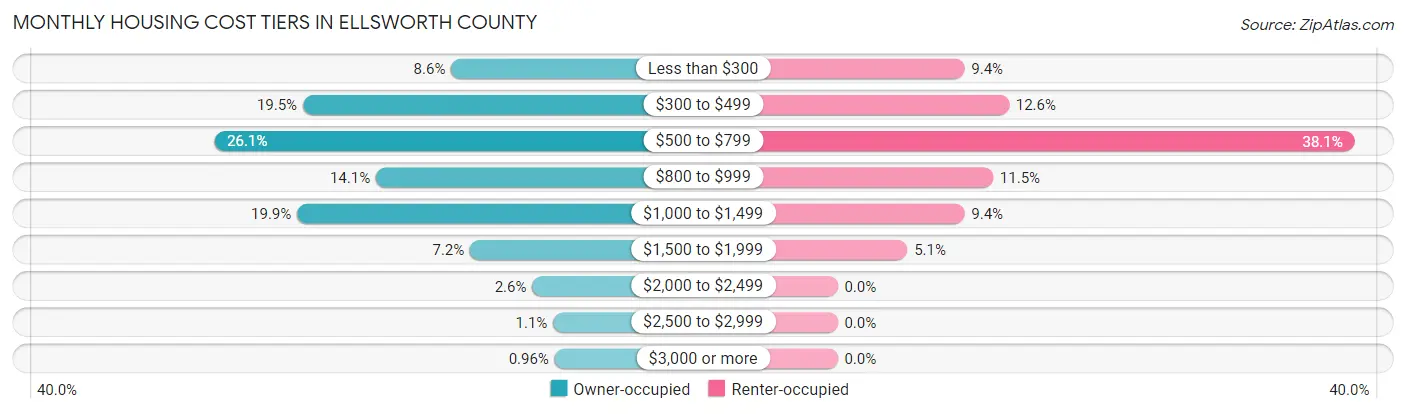
| Monthly Cost | Owner-occupied | Renter-occupied |
| Less than $300 | 161 (8.6%) | 40 (9.3%) |
| $300 to $499 | 366 (19.5%) | 54 (12.6%) |
| $500 to $799 | 489 (26.1%) | 163 (38.1%) |
| $800 to $999 | 265 (14.1%) | 49 (11.5%) |
| $1,000 to $1,499 | 374 (19.9%) | 40 (9.3%) |
| $1,500 to $1,999 | 135 (7.2%) | 22 (5.1%) |
| $2,000 to $2,499 | 49 (2.6%) | 0 (0.0%) |
| $2,500 to $2,999 | 20 (1.1%) | 0 (0.0%) |
| $3,000 or more | 18 (1.0%) | 0 (0.0%) |
| Total | 1,877 (100.0%) | 428 (100.0%) |
Physical Housing Characteristics in Ellsworth County
Housing Structures in Ellsworth County
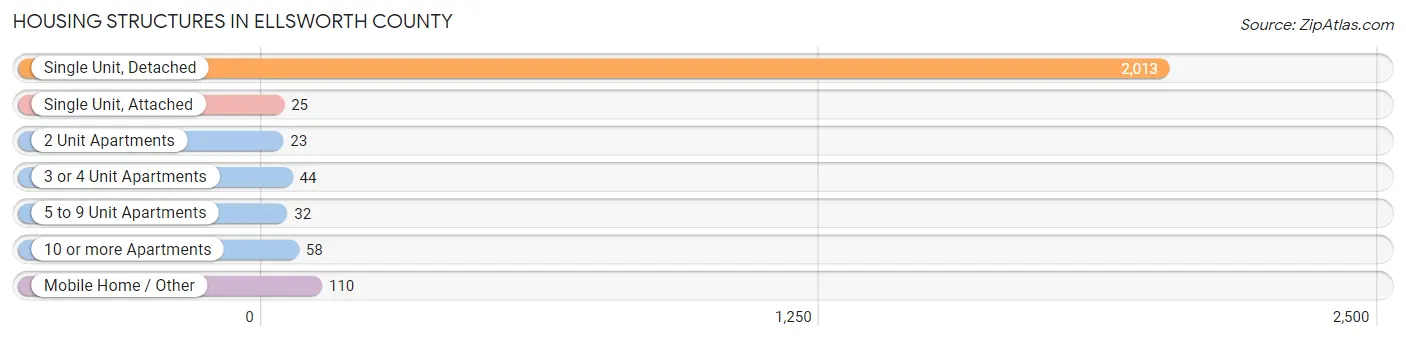
| Structure Type | # Housing Units | % Housing Units |
| Single Unit, Detached | 2,013 | 87.3% |
| Single Unit, Attached | 25 | 1.1% |
| 2 Unit Apartments | 23 | 1.0% |
| 3 or 4 Unit Apartments | 44 | 1.9% |
| 5 to 9 Unit Apartments | 32 | 1.4% |
| 10 or more Apartments | 58 | 2.5% |
| Mobile Home / Other | 110 | 4.8% |
| Total | 2,305 | 100.0% |
Housing Structures by Occupancy in Ellsworth County
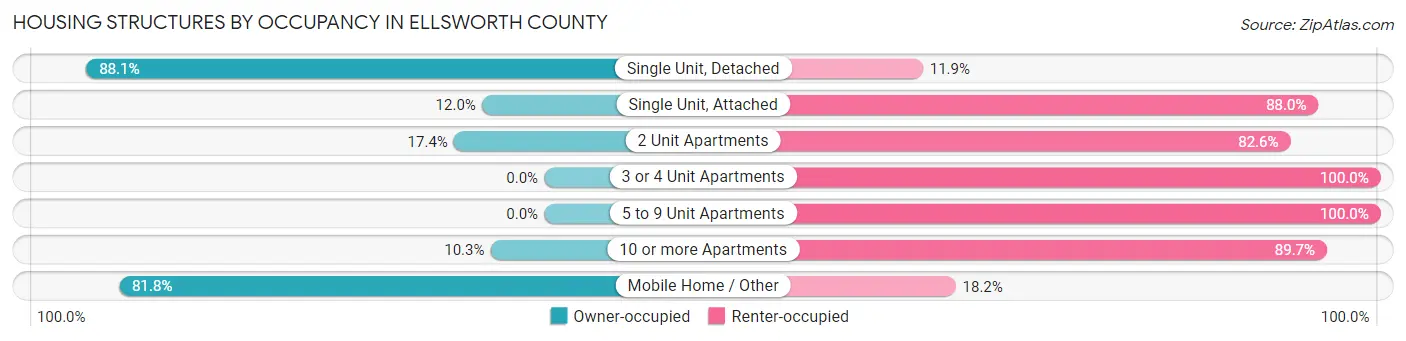
| Structure Type | Owner-occupied | Renter-occupied |
| Single Unit, Detached | 1,774 (88.1%) | 239 (11.9%) |
| Single Unit, Attached | 3 (12.0%) | 22 (88.0%) |
| 2 Unit Apartments | 4 (17.4%) | 19 (82.6%) |
| 3 or 4 Unit Apartments | 0 (0.0%) | 44 (100.0%) |
| 5 to 9 Unit Apartments | 0 (0.0%) | 32 (100.0%) |
| 10 or more Apartments | 6 (10.3%) | 52 (89.7%) |
| Mobile Home / Other | 90 (81.8%) | 20 (18.2%) |
| Total | 1,877 (81.4%) | 428 (18.6%) |
Housing Structures by Number of Rooms in Ellsworth County
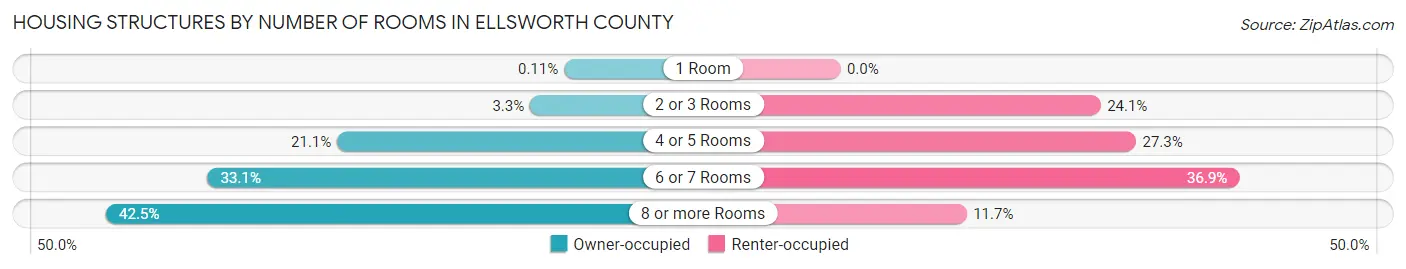
| Number of Rooms | Owner-occupied | Renter-occupied |
| 1 Room | 2 (0.1%) | 0 (0.0%) |
| 2 or 3 Rooms | 61 (3.3%) | 103 (24.1%) |
| 4 or 5 Rooms | 396 (21.1%) | 117 (27.3%) |
| 6 or 7 Rooms | 621 (33.1%) | 158 (36.9%) |
| 8 or more Rooms | 797 (42.5%) | 50 (11.7%) |
| Total | 1,877 (100.0%) | 428 (100.0%) |
Housing Structure by Heating Type in Ellsworth County
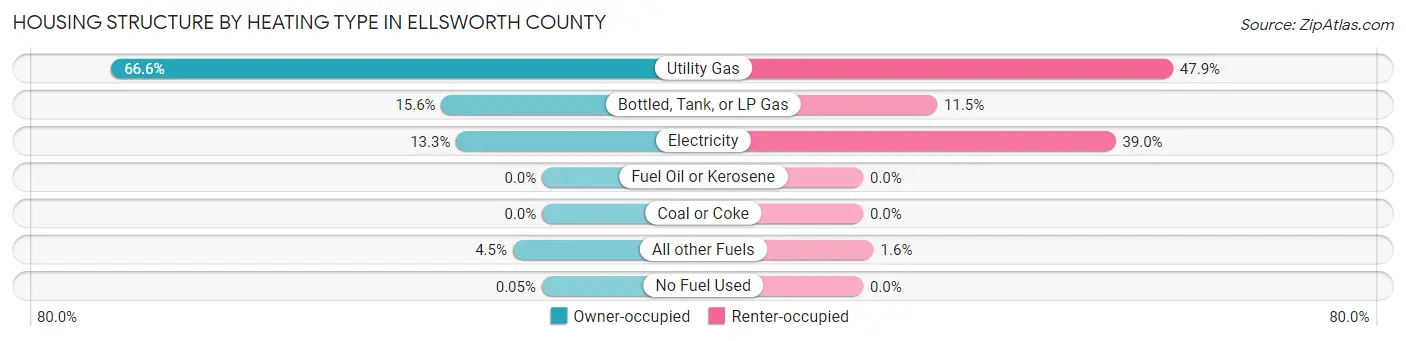
| Heating Type | Owner-occupied | Renter-occupied |
| Utility Gas | 1,250 (66.6%) | 205 (47.9%) |
| Bottled, Tank, or LP Gas | 292 (15.6%) | 49 (11.5%) |
| Electricity | 249 (13.3%) | 167 (39.0%) |
| Fuel Oil or Kerosene | 0 (0.0%) | 0 (0.0%) |
| Coal or Coke | 0 (0.0%) | 0 (0.0%) |
| All other Fuels | 85 (4.5%) | 7 (1.6%) |
| No Fuel Used | 1 (0.1%) | 0 (0.0%) |
| Total | 1,877 (100.0%) | 428 (100.0%) |
Household Vehicle Usage in Ellsworth County
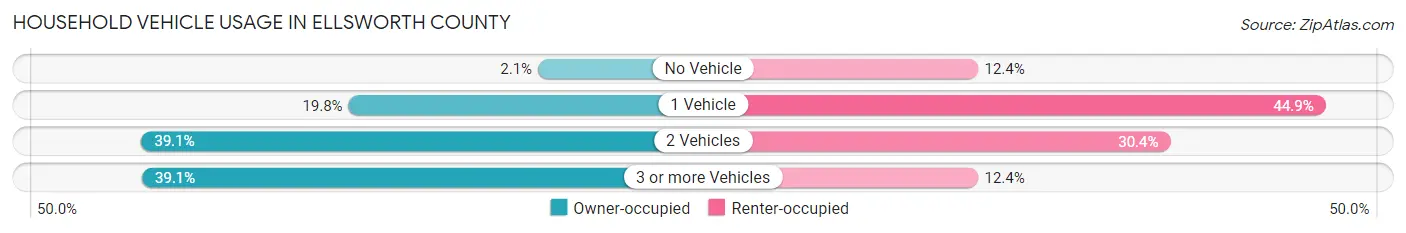
| Vehicles per Household | Owner-occupied | Renter-occupied |
| No Vehicle | 39 (2.1%) | 53 (12.4%) |
| 1 Vehicle | 371 (19.8%) | 192 (44.9%) |
| 2 Vehicles | 734 (39.1%) | 130 (30.4%) |
| 3 or more Vehicles | 733 (39.1%) | 53 (12.4%) |
| Total | 1,877 (100.0%) | 428 (100.0%) |
Real Estate & Mortgages in Ellsworth County
Real Estate and Mortgage Overview in Ellsworth County
| Characteristic | Without Mortgage | With Mortgage |
| Housing Units | 979 | 898 |
| Median Property Value | $112,800 | $104,300 |
| Median Household Income | $54,461 | $123 |
| Monthly Housing Costs | $489 | $16 |
| Real Estate Taxes | $1,425 | $5 |
Property Value by Mortgage Status in Ellsworth County
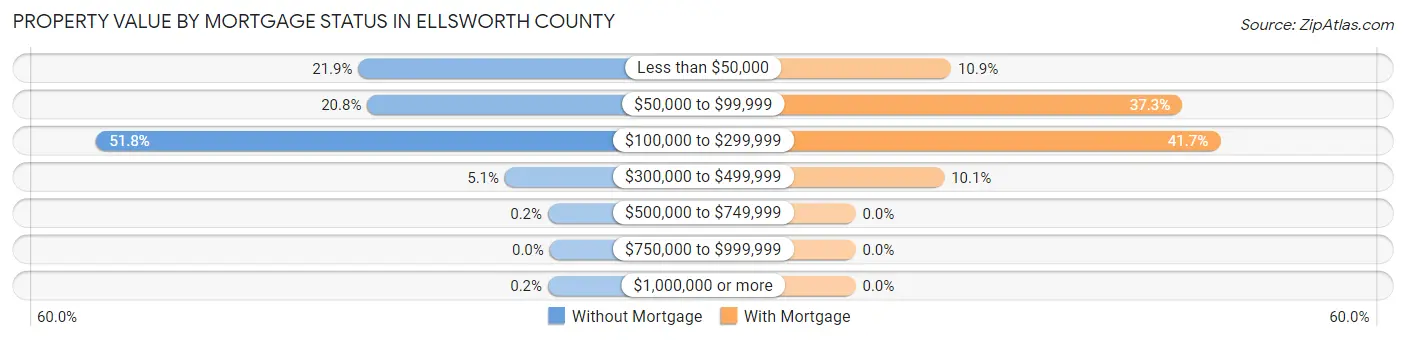
| Property Value | Without Mortgage | With Mortgage |
| Less than $50,000 | 214 (21.9%) | 98 (10.9%) |
| $50,000 to $99,999 | 204 (20.8%) | 335 (37.3%) |
| $100,000 to $299,999 | 507 (51.8%) | 374 (41.6%) |
| $300,000 to $499,999 | 50 (5.1%) | 91 (10.1%) |
| $500,000 to $749,999 | 2 (0.2%) | 0 (0.0%) |
| $750,000 to $999,999 | 0 (0.0%) | 0 (0.0%) |
| $1,000,000 or more | 2 (0.2%) | 0 (0.0%) |
| Total | 979 (100.0%) | 898 (100.0%) |
Household Income by Mortgage Status in Ellsworth County
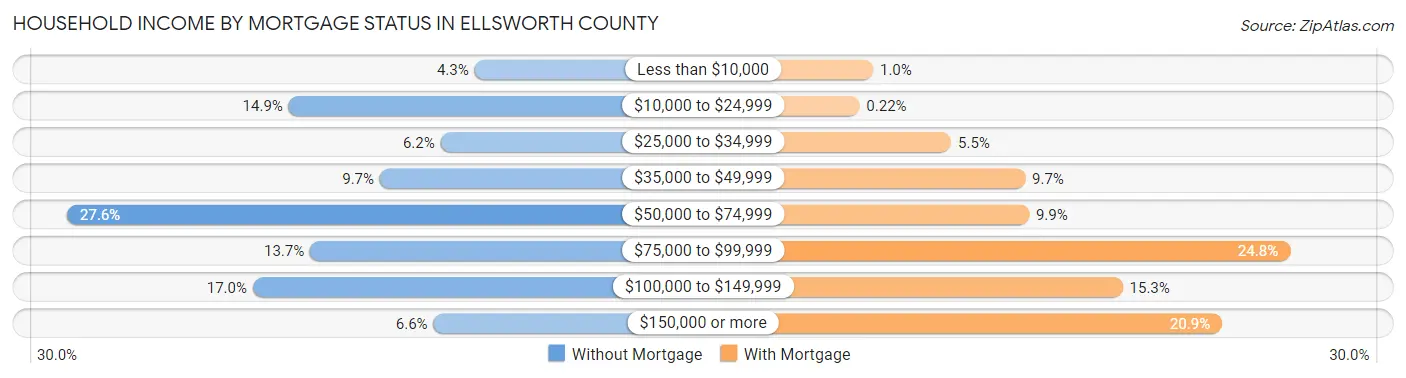
| Household Income | Without Mortgage | With Mortgage |
| Less than $10,000 | 42 (4.3%) | 9 (1.0%) |
| $10,000 to $24,999 | 146 (14.9%) | 2 (0.2%) |
| $25,000 to $34,999 | 61 (6.2%) | 49 (5.5%) |
| $35,000 to $49,999 | 95 (9.7%) | 87 (9.7%) |
| $50,000 to $74,999 | 270 (27.6%) | 89 (9.9%) |
| $75,000 to $99,999 | 134 (13.7%) | 223 (24.8%) |
| $100,000 to $149,999 | 166 (17.0%) | 137 (15.3%) |
| $150,000 or more | 65 (6.6%) | 188 (20.9%) |
| Total | 979 (100.0%) | 898 (100.0%) |
Property Value to Household Income Ratio in Ellsworth County
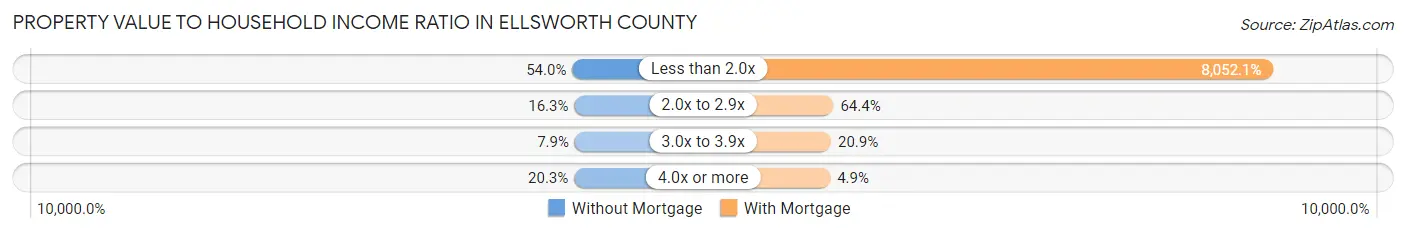
| Value-to-Income Ratio | Without Mortgage | With Mortgage |
| Less than 2.0x | 529 (54.0%) | 72,308 (8,052.1%) |
| 2.0x to 2.9x | 160 (16.3%) | 578 (64.4%) |
| 3.0x to 3.9x | 77 (7.9%) | 188 (20.9%) |
| 4.0x or more | 199 (20.3%) | 44 (4.9%) |
| Total | 979 (100.0%) | 898 (100.0%) |
Real Estate Taxes by Mortgage Status in Ellsworth County
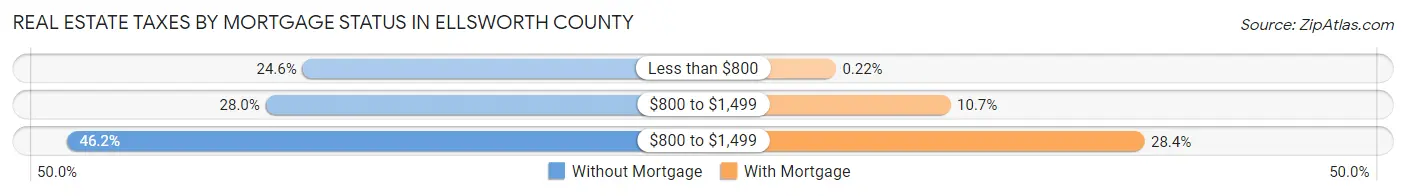
| Property Taxes | Without Mortgage | With Mortgage |
| Less than $800 | 241 (24.6%) | 2 (0.2%) |
| $800 to $1,499 | 274 (28.0%) | 96 (10.7%) |
| $800 to $1,499 | 452 (46.2%) | 255 (28.4%) |
| Total | 979 (100.0%) | 898 (100.0%) |
Health & Disability in Ellsworth County
Health Insurance Coverage by Age in Ellsworth County
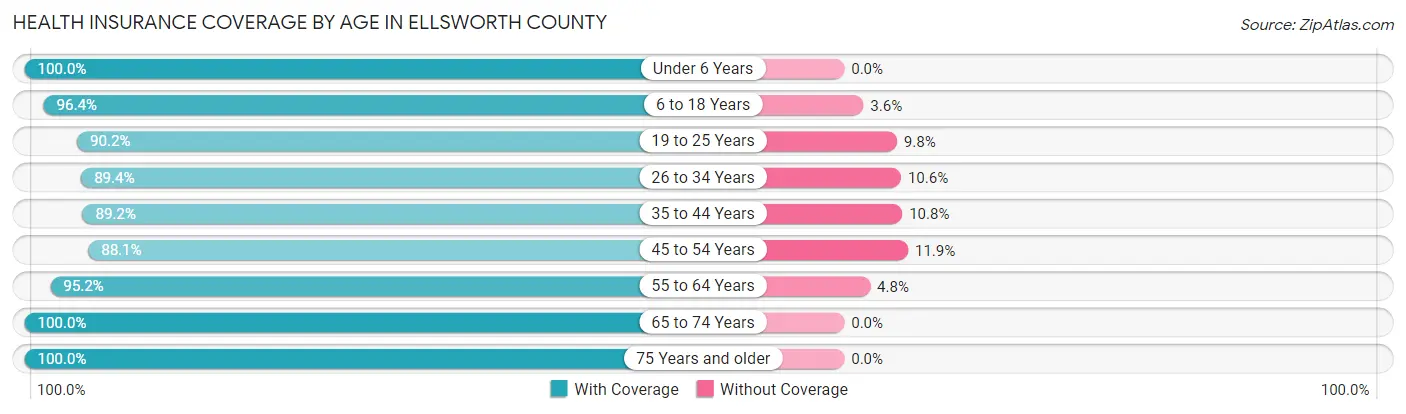
| Age Bracket | With Coverage | Without Coverage |
| Under 6 Years | 334 (100.0%) | 0 (0.0%) |
| 6 to 18 Years | 894 (96.4%) | 33 (3.6%) |
| 19 to 25 Years | 340 (90.2%) | 37 (9.8%) |
| 26 to 34 Years | 423 (89.4%) | 50 (10.6%) |
| 35 to 44 Years | 462 (89.2%) | 56 (10.8%) |
| 45 to 54 Years | 504 (88.1%) | 68 (11.9%) |
| 55 to 64 Years | 810 (95.2%) | 41 (4.8%) |
| 65 to 74 Years | 680 (100.0%) | 0 (0.0%) |
| 75 Years and older | 653 (100.0%) | 0 (0.0%) |
| Total | 5,100 (94.7%) | 285 (5.3%) |
Health Insurance Coverage by Citizenship Status in Ellsworth County
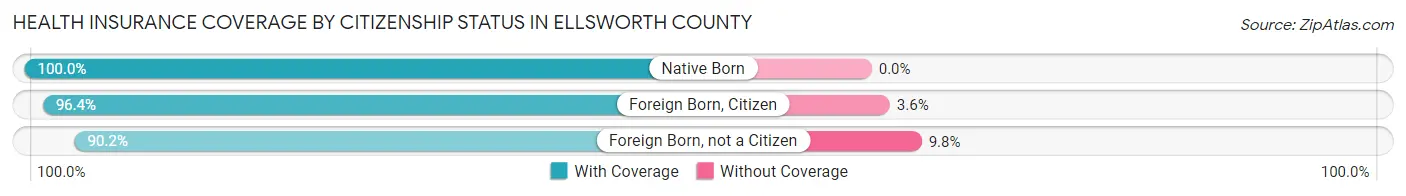
| Citizenship Status | With Coverage | Without Coverage |
| Native Born | 334 (100.0%) | 0 (0.0%) |
| Foreign Born, Citizen | 894 (96.4%) | 33 (3.6%) |
| Foreign Born, not a Citizen | 340 (90.2%) | 37 (9.8%) |
Health Insurance Coverage by Household Income in Ellsworth County
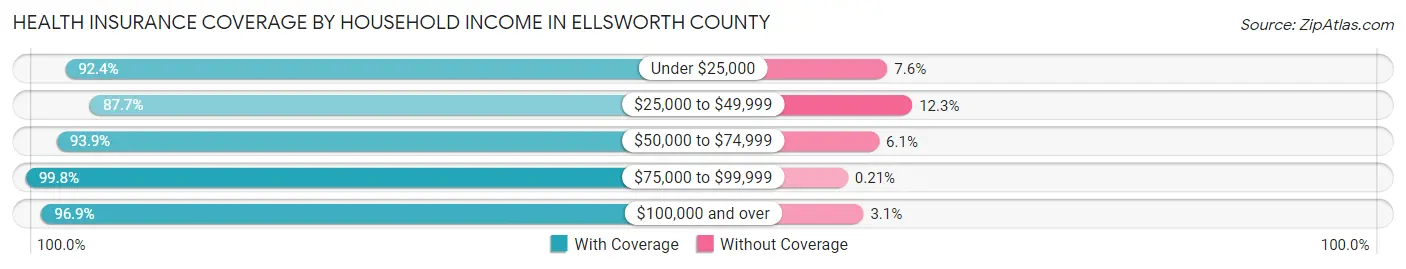
| Household Income | With Coverage | Without Coverage |
| Under $25,000 | 510 (92.4%) | 42 (7.6%) |
| $25,000 to $49,999 | 744 (87.7%) | 104 (12.3%) |
| $50,000 to $74,999 | 1,210 (93.9%) | 78 (6.1%) |
| $75,000 to $99,999 | 941 (99.8%) | 2 (0.2%) |
| $100,000 and over | 1,671 (96.9%) | 54 (3.1%) |
Public vs Private Health Insurance Coverage by Age in Ellsworth County
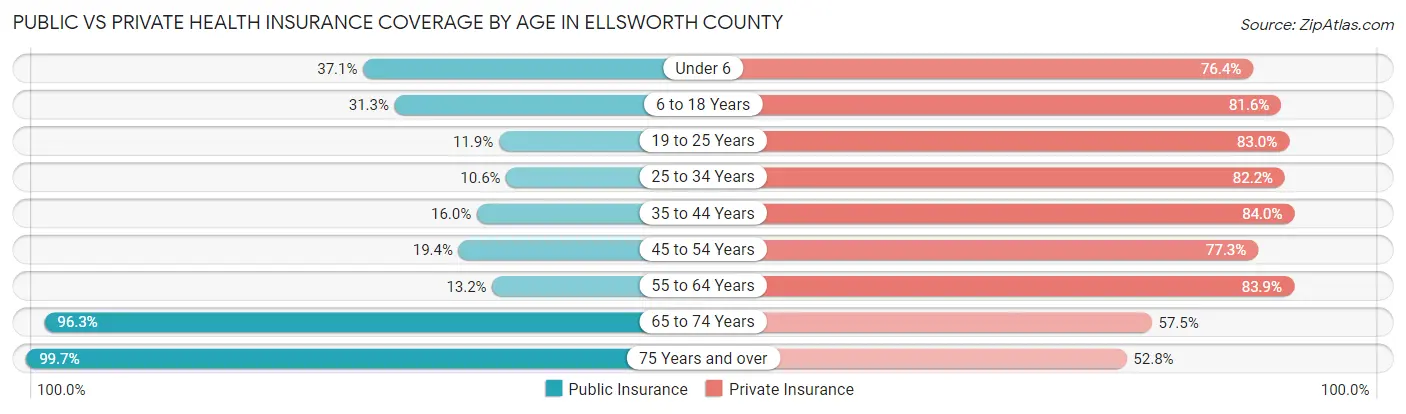
| Age Bracket | Public Insurance | Private Insurance |
| Under 6 | 124 (37.1%) | 255 (76.3%) |
| 6 to 18 Years | 290 (31.3%) | 756 (81.6%) |
| 19 to 25 Years | 45 (11.9%) | 313 (83.0%) |
| 25 to 34 Years | 50 (10.6%) | 389 (82.2%) |
| 35 to 44 Years | 83 (16.0%) | 435 (84.0%) |
| 45 to 54 Years | 111 (19.4%) | 442 (77.3%) |
| 55 to 64 Years | 112 (13.2%) | 714 (83.9%) |
| 65 to 74 Years | 655 (96.3%) | 391 (57.5%) |
| 75 Years and over | 651 (99.7%) | 345 (52.8%) |
| Total | 2,121 (39.4%) | 4,040 (75.0%) |
Disability Status by Sex by Age in Ellsworth County
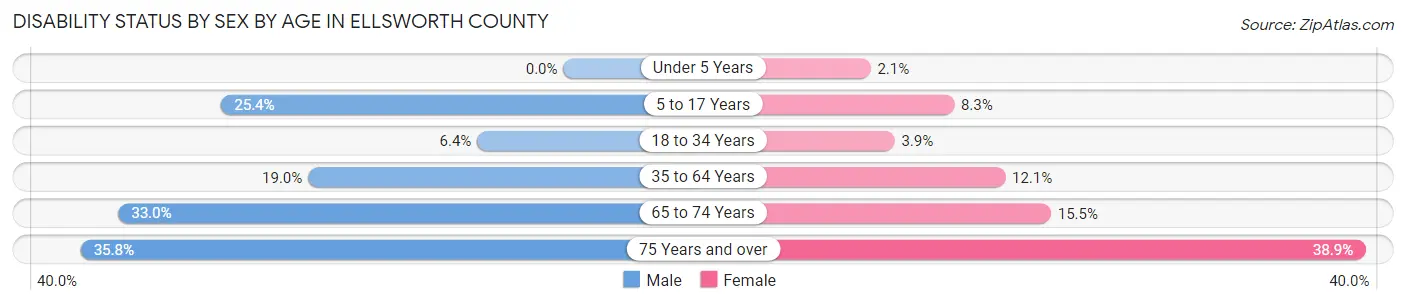
| Age Bracket | Male | Female |
| Under 5 Years | 0 (0.0%) | 3 (2.1%) |
| 5 to 17 Years | 114 (25.4%) | 35 (8.3%) |
| 18 to 34 Years | 35 (6.4%) | 16 (3.9%) |
| 35 to 64 Years | 177 (19.0%) | 122 (12.1%) |
| 65 to 74 Years | 114 (33.0%) | 52 (15.5%) |
| 75 Years and over | 91 (35.8%) | 155 (38.9%) |
Disability Class by Sex by Age in Ellsworth County
Disability Class: Hearing Difficulty
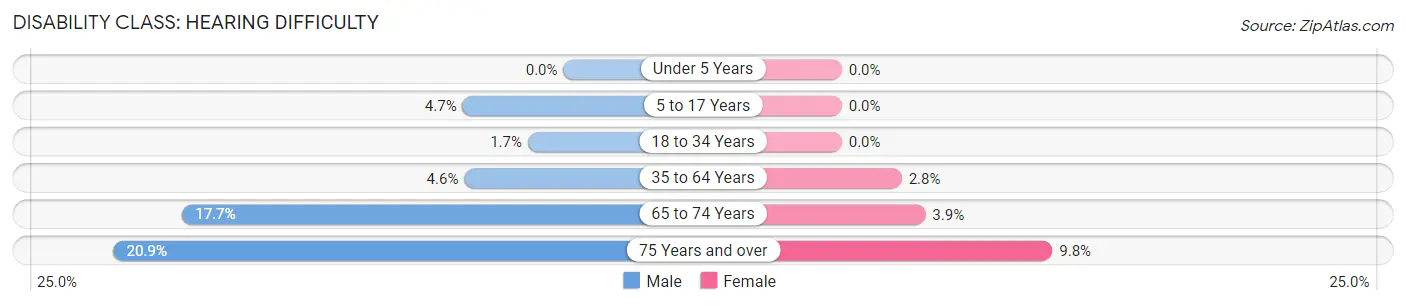
| Age Bracket | Male | Female |
| Under 5 Years | 0 (0.0%) | 0 (0.0%) |
| 5 to 17 Years | 21 (4.7%) | 0 (0.0%) |
| 18 to 34 Years | 9 (1.7%) | 0 (0.0%) |
| 35 to 64 Years | 43 (4.6%) | 28 (2.8%) |
| 65 to 74 Years | 61 (17.7%) | 13 (3.9%) |
| 75 Years and over | 53 (20.9%) | 39 (9.8%) |
Disability Class: Vision Difficulty
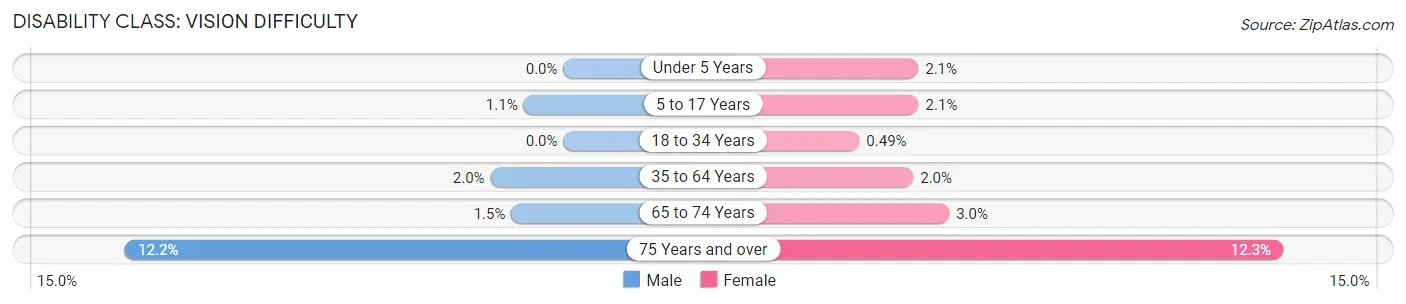
| Age Bracket | Male | Female |
| Under 5 Years | 0 (0.0%) | 3 (2.1%) |
| 5 to 17 Years | 5 (1.1%) | 9 (2.1%) |
| 18 to 34 Years | 0 (0.0%) | 2 (0.5%) |
| 35 to 64 Years | 19 (2.0%) | 20 (2.0%) |
| 65 to 74 Years | 5 (1.5%) | 10 (3.0%) |
| 75 Years and over | 31 (12.2%) | 49 (12.3%) |
Disability Class: Cognitive Difficulty
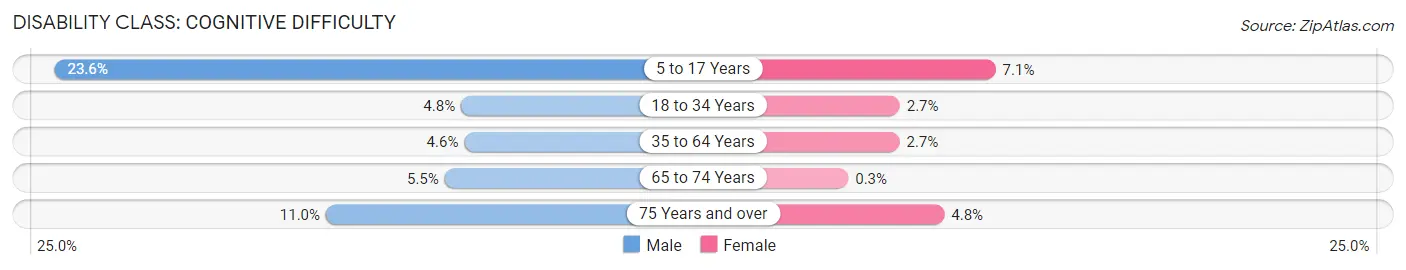
| Age Bracket | Male | Female |
| 5 to 17 Years | 106 (23.6%) | 30 (7.1%) |
| 18 to 34 Years | 26 (4.8%) | 11 (2.7%) |
| 35 to 64 Years | 43 (4.6%) | 27 (2.7%) |
| 65 to 74 Years | 19 (5.5%) | 1 (0.3%) |
| 75 Years and over | 28 (11.0%) | 19 (4.8%) |
Disability Class: Ambulatory Difficulty
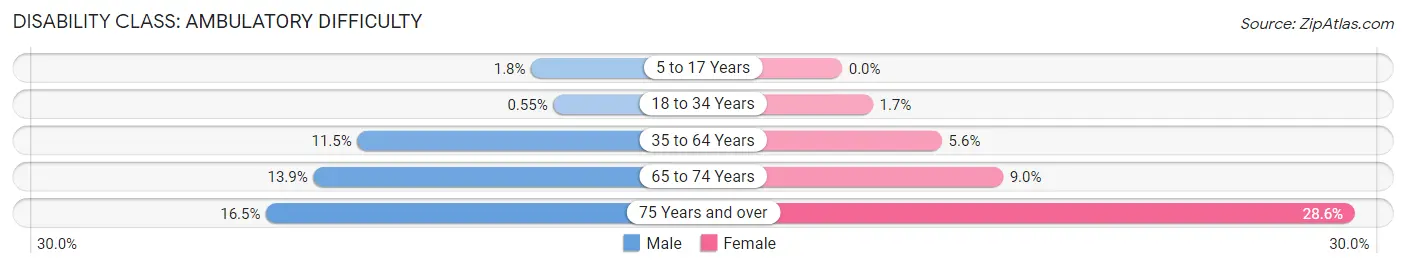
| Age Bracket | Male | Female |
| 5 to 17 Years | 8 (1.8%) | 0 (0.0%) |
| 18 to 34 Years | 3 (0.5%) | 7 (1.7%) |
| 35 to 64 Years | 107 (11.5%) | 56 (5.6%) |
| 65 to 74 Years | 48 (13.9%) | 30 (9.0%) |
| 75 Years and over | 42 (16.5%) | 114 (28.6%) |
Disability Class: Self-Care Difficulty
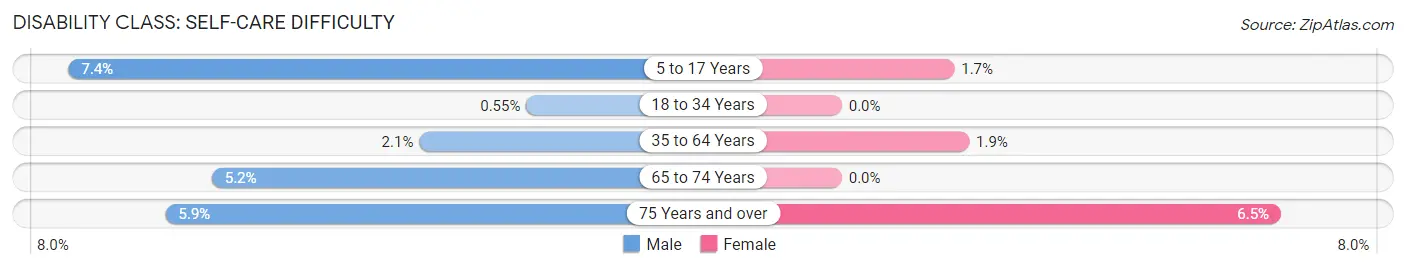
| Age Bracket | Male | Female |
| 5 to 17 Years | 33 (7.3%) | 7 (1.7%) |
| 18 to 34 Years | 3 (0.5%) | 0 (0.0%) |
| 35 to 64 Years | 20 (2.1%) | 19 (1.9%) |
| 65 to 74 Years | 18 (5.2%) | 0 (0.0%) |
| 75 Years and over | 15 (5.9%) | 26 (6.5%) |
Technology Access in Ellsworth County
Computing Device Access in Ellsworth County
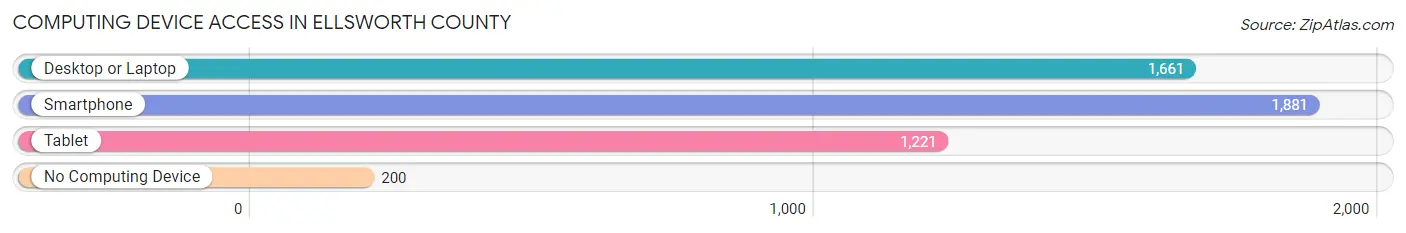
| Device Type | # Households | % Households |
| Desktop or Laptop | 1,661 | 72.1% |
| Smartphone | 1,881 | 81.6% |
| Tablet | 1,221 | 53.0% |
| No Computing Device | 200 | 8.7% |
| Total | 2,305 | 100.0% |
Internet Access in Ellsworth County
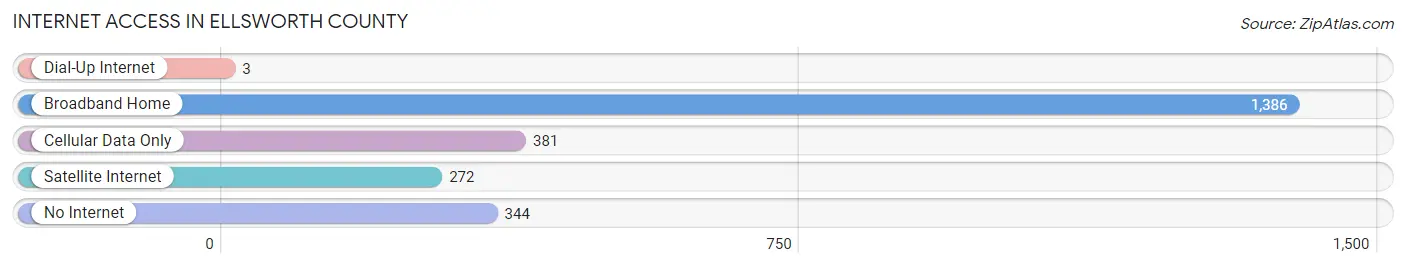
| Internet Type | # Households | % Households |
| Dial-Up Internet | 3 | 0.1% |
| Broadband Home | 1,386 | 60.1% |
| Cellular Data Only | 381 | 16.5% |
| Satellite Internet | 272 | 11.8% |
| No Internet | 344 | 14.9% |
| Total | 2,305 | 100.0% |
Ellsworth County Summary
Ellsworth County, Kansas is located in the north-central part of the state, and is bordered by Russell County to the north, Lincoln County to the east, Saline County to the south, and Rice and McPherson counties to the west. The county seat is Ellsworth, and the county has a total area of 845 square miles, of which 844 square miles is land and 1 square mile is water.
Geography
Ellsworth County is located in the Smoky Hills region of the Great Plains. The county is mostly flat, with some rolling hills in the western part of the county. The Smoky Hill River runs through the county, and there are several small creeks and streams. The county is mostly covered in grassland, with some areas of cropland and woodlands.
History
Ellsworth County was established in 1867, and was named after Fort Ellsworth, which was built in the area in 1865. The county was originally populated by Native American tribes, including the Kansa, Osage, and Pawnee. The first settlers arrived in the area in the late 1860s, and the county was officially organized in 1871.
The county was an important agricultural center in the late 19th and early 20th centuries, and the population grew steadily throughout the period. The county was also home to several small towns, including Ellsworth, Kanopolis, Wilson, and Holyrood.
Economy
The economy of Ellsworth County is largely based on agriculture. The county is home to several large farms, and the main crops grown in the area are wheat, corn, and soybeans. The county is also home to several small businesses, including manufacturing, retail, and service industries.
Demographics
As of the 2010 census, Ellsworth County had a population of 6,497. The racial makeup of the county was 95.3% White, 0.7% African American, 0.5% Native American, 0.3% Asian, 0.1% Pacific Islander, 1.7% from other races, and 1.4% from two or more races. Hispanic or Latino of any race were 4.2% of the population.
The median income for a household in the county was $45,813, and the median income for a family was $51,945. The per capita income for the county was $20,945. About 8.7% of families and 11.2% of the population were below the poverty line, including 14.2% of those under age 18 and 8.2% of those age 65 or over.
Ellsworth County is a rural county with a strong agricultural base. The county has a diverse population, and the economy is largely based on agriculture and small businesses. The county is home to several small towns, and the population has remained relatively stable over the past few decades.
Common Questions
What is Per Capita Income in Ellsworth County?
Per Capita income in Ellsworth County is $29,968.
What is the Median Family Income in Ellsworth County?
Median Family Income in Ellsworth County is $78,833.
What is the Median Household income in Ellsworth County?
Median Household Income in Ellsworth County is $59,844.
What is Income or Wage Gap in Ellsworth County?
Income or Wage Gap in Ellsworth County is 5.9%.
Women in Ellsworth County earn 94.1 cents for every dollar earned by a man.
What is Family Income Deficit in Ellsworth County?
Family Income Deficit in Ellsworth County is $9,205.
Families that are below poverty line in Ellsworth County earn $9,205 less on average than the poverty threshold level.
What is Inequality or Gini Index in Ellsworth County?
Inequality or Gini Index in Ellsworth County is 0.40.
What is the Total Population of Ellsworth County?
Total Population of Ellsworth County is 6,374.
What is the Total Male Population of Ellsworth County?
Total Male Population of Ellsworth County is 3,578.
What is the Total Female Population of Ellsworth County?
Total Female Population of Ellsworth County is 2,796.
What is the Ratio of Males per 100 Females in Ellsworth County?
There are 127.97 Males per 100 Females in Ellsworth County.
What is the Ratio of Females per 100 Males in Ellsworth County?
There are 78.14 Females per 100 Males in Ellsworth County.
What is the Median Population Age in Ellsworth County?
Median Population Age in Ellsworth County is 43.1 Years.
What is the Average Family Size in Ellsworth County
Average Family Size in Ellsworth County is 2.9 People.
What is the Average Household Size in Ellsworth County
Average Household Size in Ellsworth County is 2.3 People.
How Large is the Labor Force in Ellsworth County?
There are 2,741 People in the Labor Forcein in Ellsworth County.
What is the Percentage of People in the Labor Force in Ellsworth County?
51.2% of People are in the Labor Force in Ellsworth County.
What is the Unemployment Rate in Ellsworth County?
Unemployment Rate in Ellsworth County is 3.5%.