Elk County, KS Map & Demographics
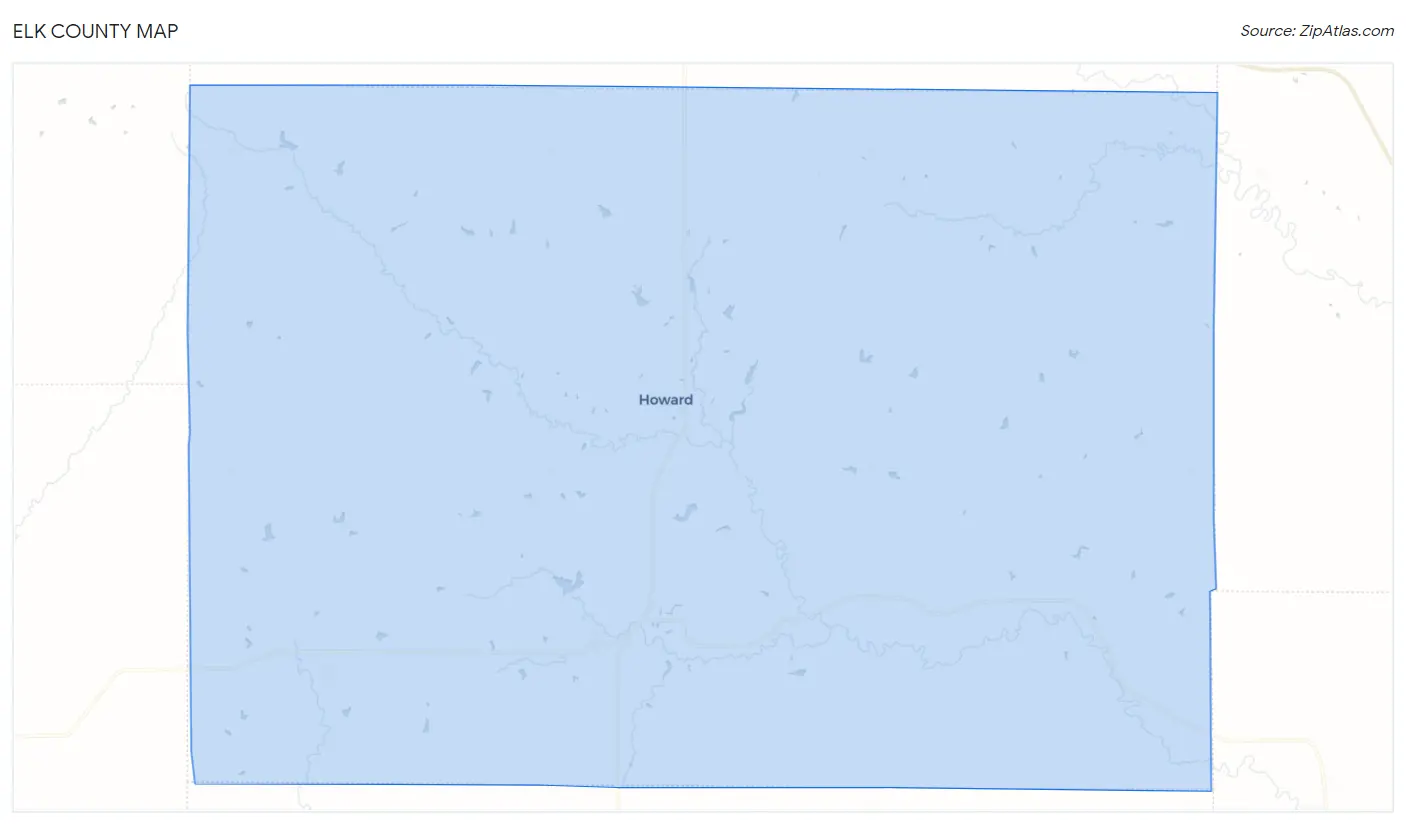
Elk County Map
Elk County Overview
$28,159
PER CAPITA INCOME
$65,701
AVG FAMILY INCOME
$50,000
AVG HOUSEHOLD INCOME
44.5%
WAGE / INCOME GAP [ % ]
55.5¢/ $1
WAGE / INCOME GAP [ $ ]
0.44
INEQUALITY / GINI INDEX
2,453
TOTAL POPULATION
1,245
MALE POPULATION
1,208
FEMALE POPULATION
103.06
MALES / 100 FEMALES
97.03
FEMALES / 100 MALES
50.4
MEDIAN AGE
3.0
AVG FAMILY SIZE
2.4
AVG HOUSEHOLD SIZE
993
LABOR FORCE [ PEOPLE ]
50.2%
PERCENT IN LABOR FORCE
3.8%
UNEMPLOYMENT RATE
Elk County Area Codes
Income in Elk County
Income Overview in Elk County
Per Capita Income in Elk County is $28,159, while median incomes of families and households are $65,701 and $50,000 respectively.
| Characteristic | Number | Measure |
| Per Capita Income | 2,453 | $28,159 |
| Median Family Income | 679 | $65,701 |
| Mean Family Income | 679 | $76,649 |
| Median Household Income | 1,028 | $50,000 |
| Mean Household Income | 1,028 | $66,254 |
| Income Deficit | 679 | $0 |
| Wage / Income Gap (%) | 2,453 | 44.46% |
| Wage / Income Gap ($) | 2,453 | 55.54¢ per $1 |
| Gini / Inequality Index | 2,453 | 0.44 |
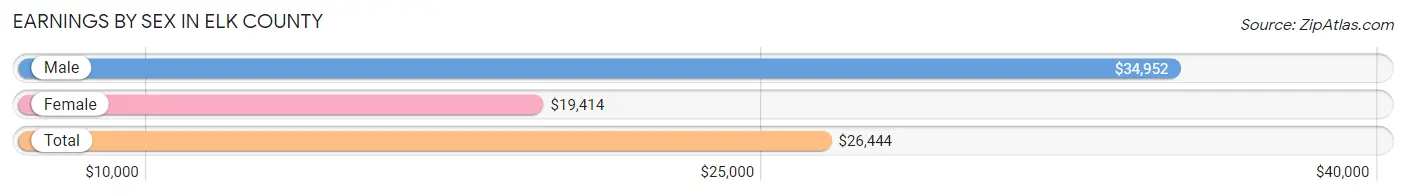
Earnings by Sex in Elk County
Average Earnings in Elk County are $26,444, $34,952 for men and $19,414 for women, a difference of 44.5%.
| Sex | Number | Average Earnings |
| Male | 619 (56.5%) | $34,952 |
| Female | 477 (43.5%) | $19,414 |
| Total | 1,096 (100.0%) | $26,444 |
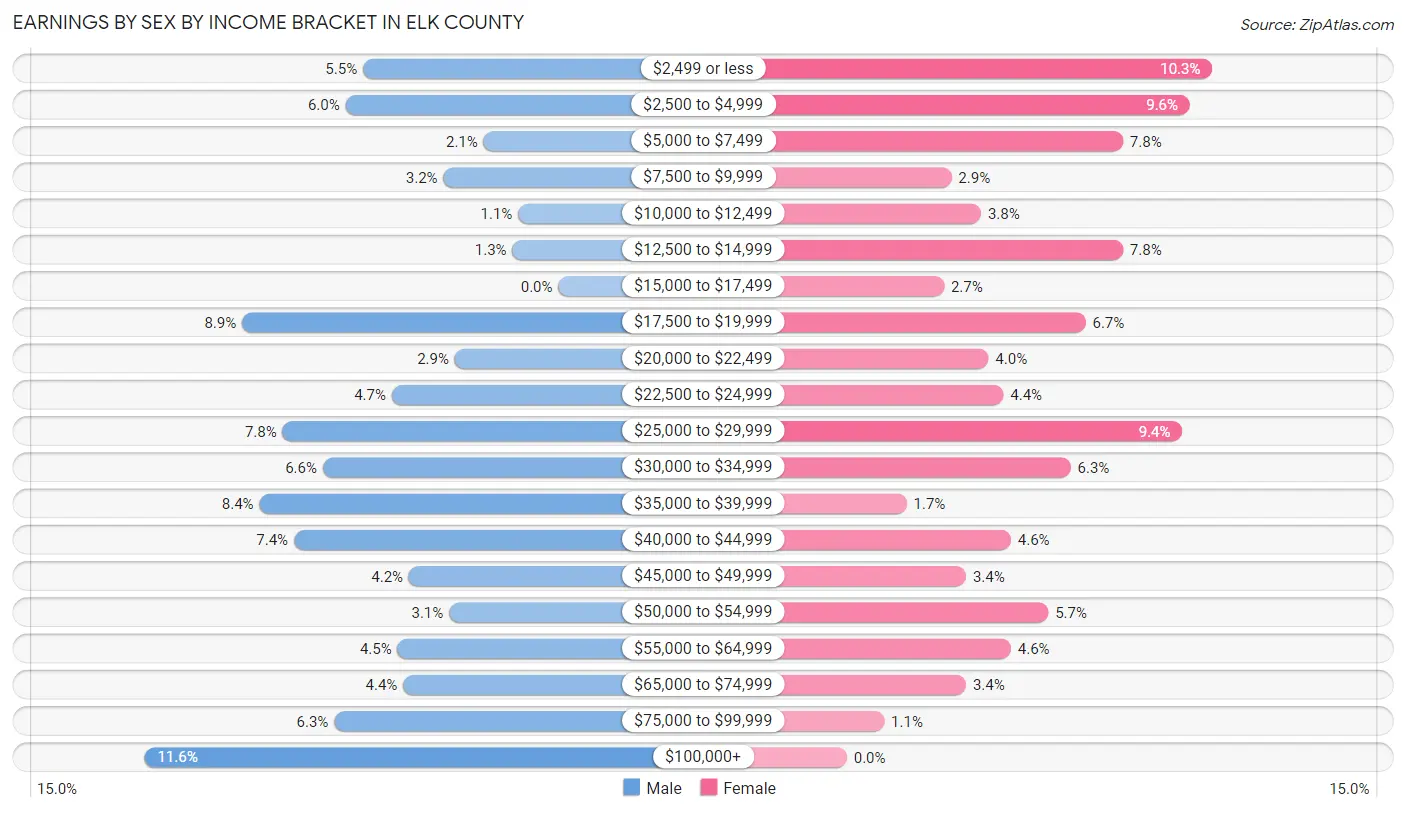
Earnings by Sex by Income Bracket in Elk County
The most common earnings brackets in Elk County are $100,000+ for men (72 | 11.6%) and $2,499 or less for women (49 | 10.3%).
| Income | Male | Female |
| $2,499 or less | 34 (5.5%) | 49 (10.3%) |
| $2,500 to $4,999 | 37 (6.0%) | 46 (9.6%) |
| $5,000 to $7,499 | 13 (2.1%) | 37 (7.8%) |
| $7,500 to $9,999 | 20 (3.2%) | 14 (2.9%) |
| $10,000 to $12,499 | 7 (1.1%) | 18 (3.8%) |
| $12,500 to $14,999 | 8 (1.3%) | 37 (7.8%) |
| $15,000 to $17,499 | 0 (0.0%) | 13 (2.7%) |
| $17,500 to $19,999 | 55 (8.9%) | 32 (6.7%) |
| $20,000 to $22,499 | 18 (2.9%) | 19 (4.0%) |
| $22,500 to $24,999 | 29 (4.7%) | 21 (4.4%) |
| $25,000 to $29,999 | 48 (7.7%) | 45 (9.4%) |
| $30,000 to $34,999 | 41 (6.6%) | 30 (6.3%) |
| $35,000 to $39,999 | 52 (8.4%) | 8 (1.7%) |
| $40,000 to $44,999 | 46 (7.4%) | 22 (4.6%) |
| $45,000 to $49,999 | 26 (4.2%) | 16 (3.4%) |
| $50,000 to $54,999 | 19 (3.1%) | 27 (5.7%) |
| $55,000 to $64,999 | 28 (4.5%) | 22 (4.6%) |
| $65,000 to $74,999 | 27 (4.4%) | 16 (3.4%) |
| $75,000 to $99,999 | 39 (6.3%) | 5 (1.1%) |
| $100,000+ | 72 (11.6%) | 0 (0.0%) |
| Total | 619 (100.0%) | 477 (100.0%) |
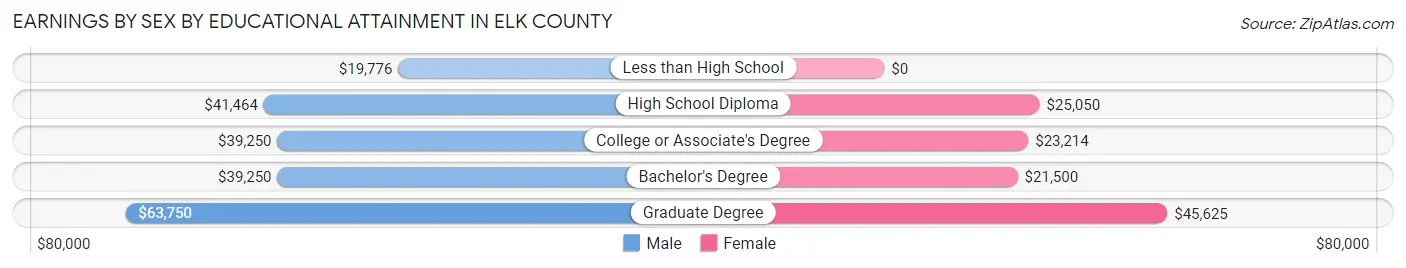
Earnings by Sex by Educational Attainment in Elk County
Average earnings in Elk County are $39,295 for men and $23,036 for women, a difference of 41.4%. Men with an educational attainment of graduate degree enjoy the highest average annual earnings of $63,750, while those with less than high school education earn the least with $19,776. Women with an educational attainment of graduate degree earn the most with the average annual earnings of $45,625, while those with bachelor's degree education have the smallest earnings of $21,500.
| Educational Attainment | Male Income | Female Income |
| Less than High School | $19,776 | $0 |
| High School Diploma | $41,464 | $25,050 |
| College or Associate's Degree | $39,250 | $23,214 |
| Bachelor's Degree | $39,250 | $21,500 |
| Graduate Degree | $63,750 | $45,625 |
| Total | $39,295 | $23,036 |
Family Income in Elk County
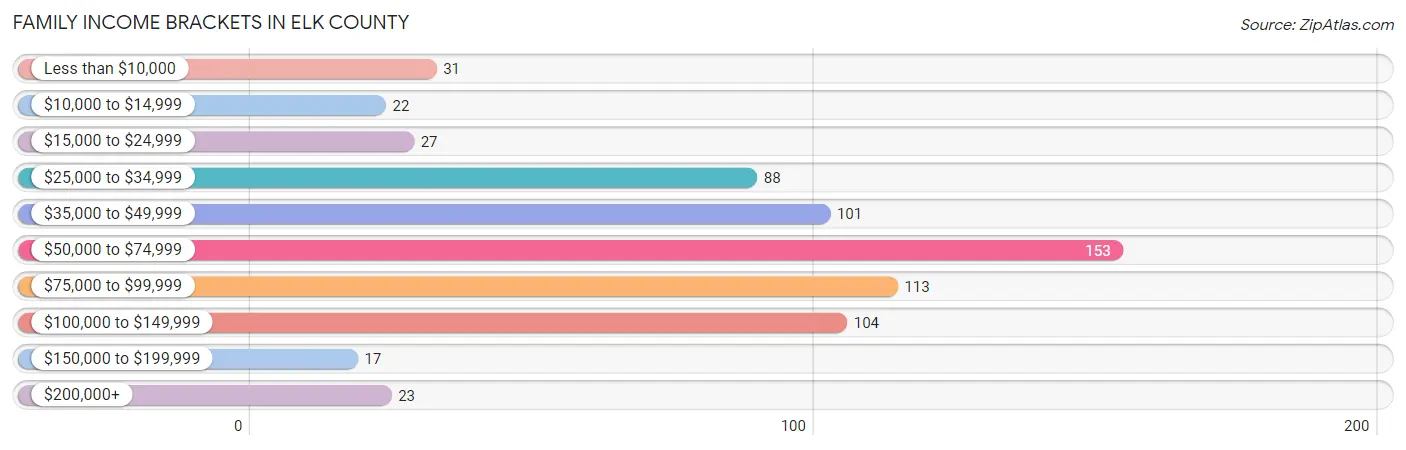
Family Income Brackets in Elk County
According to the Elk County family income data, there are 153 families falling into the $50,000 to $74,999 income range, which is the most common income bracket and makes up 22.5% of all families. Conversely, the $150,000 to $199,999 income bracket is the least frequent group with only 17 families (2.5%) belonging to this category.
| Income Bracket | # Families | % Families |
| Less than $10,000 | 31 | 4.6% |
| $10,000 to $14,999 | 22 | 3.2% |
| $15,000 to $24,999 | 27 | 4.0% |
| $25,000 to $34,999 | 88 | 13.0% |
| $35,000 to $49,999 | 101 | 14.9% |
| $50,000 to $74,999 | 153 | 22.5% |
| $75,000 to $99,999 | 113 | 16.6% |
| $100,000 to $149,999 | 104 | 15.3% |
| $150,000 to $199,999 | 17 | 2.5% |
| $200,000+ | 23 | 3.4% |
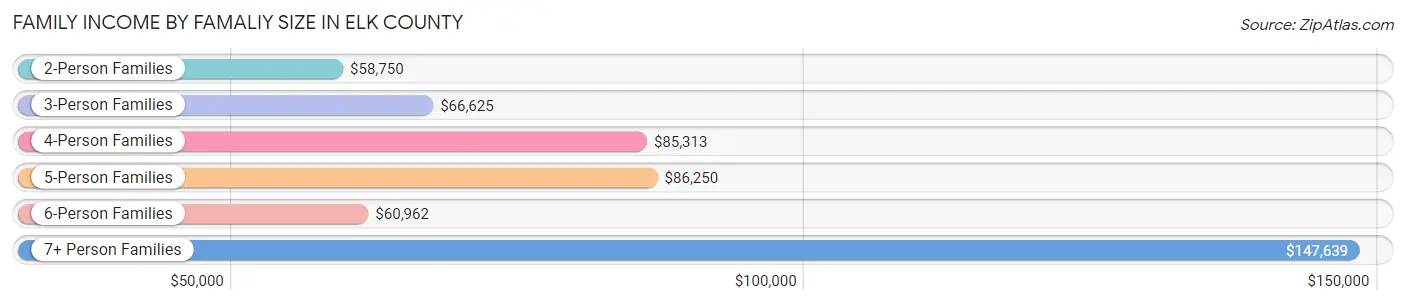
Family Income by Famaliy Size in Elk County
7+ person families (17 | 2.5%) account for the highest median family income in Elk County with $147,639 per family, while 2-person families (432 | 63.6%) have the highest median income of $29,375 per family member.
| Income Bracket | # Families | Median Income |
| 2-Person Families | 432 (63.6%) | $58,750 |
| 3-Person Families | 97 (14.3%) | $66,625 |
| 4-Person Families | 83 (12.2%) | $85,313 |
| 5-Person Families | 24 (3.5%) | $86,250 |
| 6-Person Families | 26 (3.8%) | $60,962 |
| 7+ Person Families | 17 (2.5%) | $147,639 |
| Total | 679 (100.0%) | $65,701 |
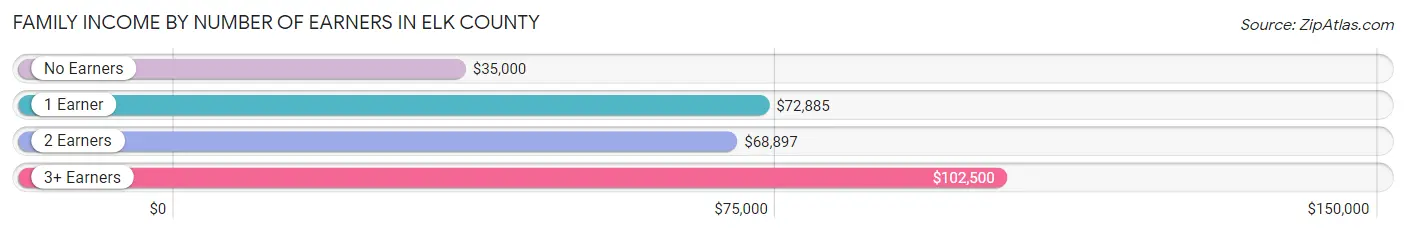
Family Income by Number of Earners in Elk County
The median family income in Elk County is $65,701, with families comprising 3+ earners (56) having the highest median family income of $102,500, while families with no earners (184) have the lowest median family income of $35,000, accounting for 8.3% and 27.1% of families, respectively.
| Number of Earners | # Families | Median Income |
| No Earners | 184 (27.1%) | $35,000 |
| 1 Earner | 206 (30.3%) | $72,885 |
| 2 Earners | 233 (34.3%) | $68,897 |
| 3+ Earners | 56 (8.3%) | $102,500 |
| Total | 679 (100.0%) | $65,701 |
Household Income in Elk County
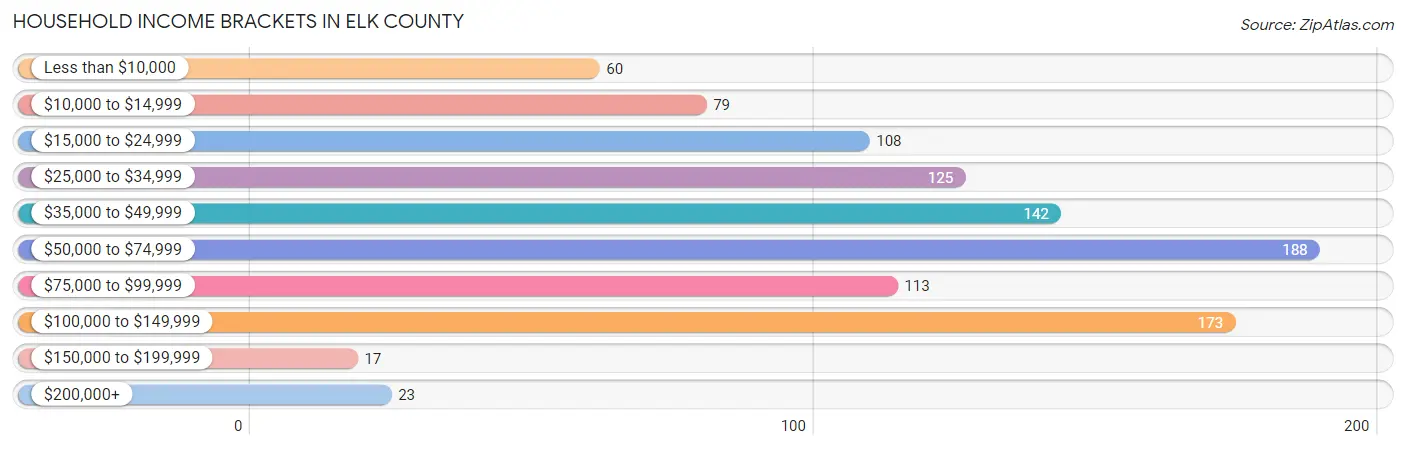
Household Income Brackets in Elk County
With 188 households falling in the category, the $50,000 to $74,999 income range is the most frequent in Elk County, accounting for 18.3% of all households. In contrast, only 17 households (1.7%) fall into the $150,000 to $199,999 income bracket, making it the least populous group.
| Income Bracket | # Households | % Households |
| Less than $10,000 | 60 | 5.8% |
| $10,000 to $14,999 | 79 | 7.7% |
| $15,000 to $24,999 | 108 | 10.5% |
| $25,000 to $34,999 | 125 | 12.2% |
| $35,000 to $49,999 | 142 | 13.8% |
| $50,000 to $74,999 | 188 | 18.3% |
| $75,000 to $99,999 | 113 | 11.0% |
| $100,000 to $149,999 | 173 | 16.8% |
| $150,000 to $199,999 | 17 | 1.7% |
| $200,000+ | 23 | 2.2% |
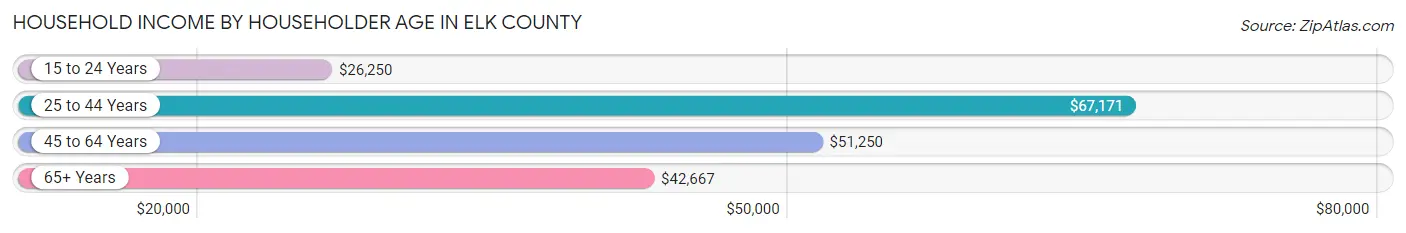
Household Income by Householder Age in Elk County
The median household income in Elk County is $50,000, with the highest median household income of $67,171 found in the 25 to 44 years age bracket for the primary householder. A total of 163 households (15.9%) fall into this category. Meanwhile, the 15 to 24 years age bracket for the primary householder has the lowest median household income of $26,250, with 29 households (2.8%) in this group.
| Income Bracket | # Households | Median Income |
| 15 to 24 Years | 29 (2.8%) | $26,250 |
| 25 to 44 Years | 163 (15.9%) | $67,171 |
| 45 to 64 Years | 426 (41.4%) | $51,250 |
| 65+ Years | 410 (39.9%) | $42,667 |
| Total | 1,028 (100.0%) | $50,000 |
Poverty in Elk County
Income Below Poverty by Sex and Age in Elk County
With 12.4% poverty level for males and 17.3% for females among the residents of Elk County, 15 year old males and 15 year old females are the most vulnerable to poverty, with 4 males (25.0%) and 1 females (50.0%) in their respective age groups living below the poverty level.
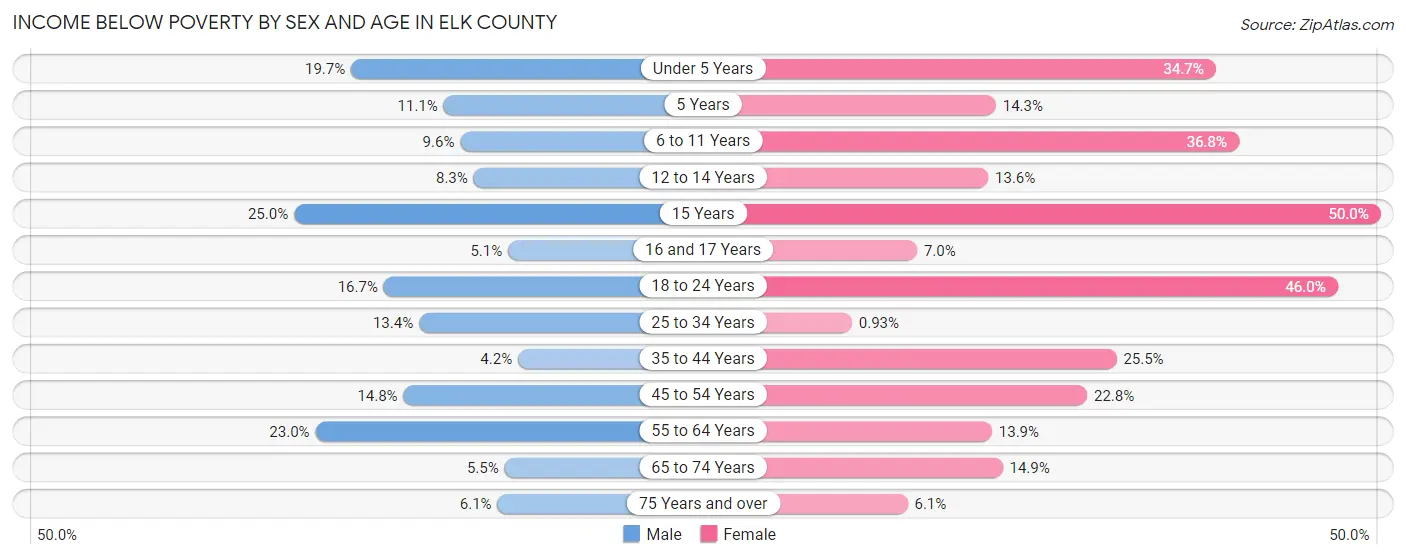
| Age Bracket | Male | Female |
| Under 5 Years | 13 (19.7%) | 17 (34.7%) |
| 5 Years | 4 (11.1%) | 1 (14.3%) |
| 6 to 11 Years | 9 (9.6%) | 28 (36.8%) |
| 12 to 14 Years | 4 (8.3%) | 11 (13.6%) |
| 15 Years | 4 (25.0%) | 1 (50.0%) |
| 16 and 17 Years | 2 (5.1%) | 3 (7.0%) |
| 18 to 24 Years | 10 (16.7%) | 23 (46.0%) |
| 25 to 34 Years | 13 (13.4%) | 1 (0.9%) |
| 35 to 44 Years | 4 (4.2%) | 26 (25.5%) |
| 45 to 54 Years | 19 (14.8%) | 33 (22.8%) |
| 55 to 64 Years | 52 (23.0%) | 28 (13.9%) |
| 65 to 74 Years | 10 (5.5%) | 27 (14.9%) |
| 75 Years and over | 9 (6.1%) | 10 (6.1%) |
| Total | 153 (12.4%) | 209 (17.3%) |
Income Above Poverty by Sex and Age in Elk County
According to the poverty statistics in Elk County, males aged 35 to 44 years and females aged 25 to 34 years are the age groups that are most secure financially, with 95.8% of males and 99.1% of females in these age groups living above the poverty line.
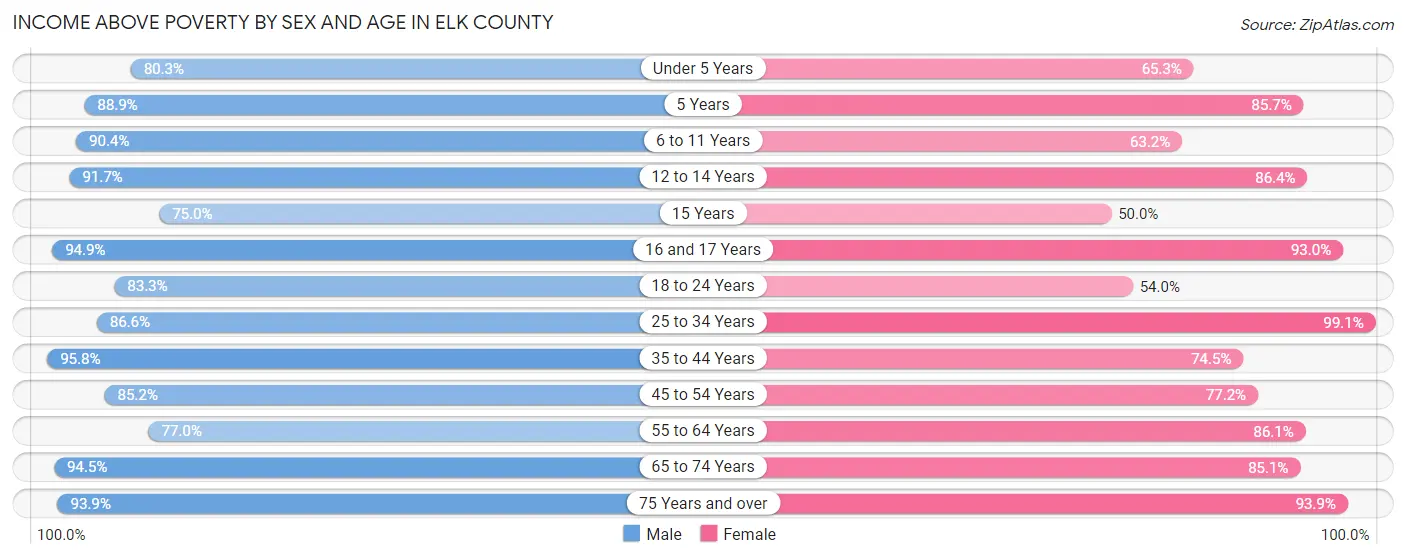
| Age Bracket | Male | Female |
| Under 5 Years | 53 (80.3%) | 32 (65.3%) |
| 5 Years | 32 (88.9%) | 6 (85.7%) |
| 6 to 11 Years | 85 (90.4%) | 48 (63.2%) |
| 12 to 14 Years | 44 (91.7%) | 70 (86.4%) |
| 15 Years | 12 (75.0%) | 1 (50.0%) |
| 16 and 17 Years | 37 (94.9%) | 40 (93.0%) |
| 18 to 24 Years | 50 (83.3%) | 27 (54.0%) |
| 25 to 34 Years | 84 (86.6%) | 106 (99.1%) |
| 35 to 44 Years | 91 (95.8%) | 76 (74.5%) |
| 45 to 54 Years | 109 (85.2%) | 112 (77.2%) |
| 55 to 64 Years | 174 (77.0%) | 173 (86.1%) |
| 65 to 74 Years | 173 (94.5%) | 154 (85.1%) |
| 75 Years and over | 138 (93.9%) | 154 (93.9%) |
| Total | 1,082 (87.6%) | 999 (82.7%) |
Income Below Poverty Among Married-Couple Families in Elk County
The poverty statistics for married-couple families in Elk County show that 6.0% or 34 of the total 566 families live below the poverty line. Families with 5 or more children have the highest poverty rate of 25.0%, comprising of 1 families. On the other hand, families with 3 or 4 children have the lowest poverty rate of 0.0%, which includes 0 families.
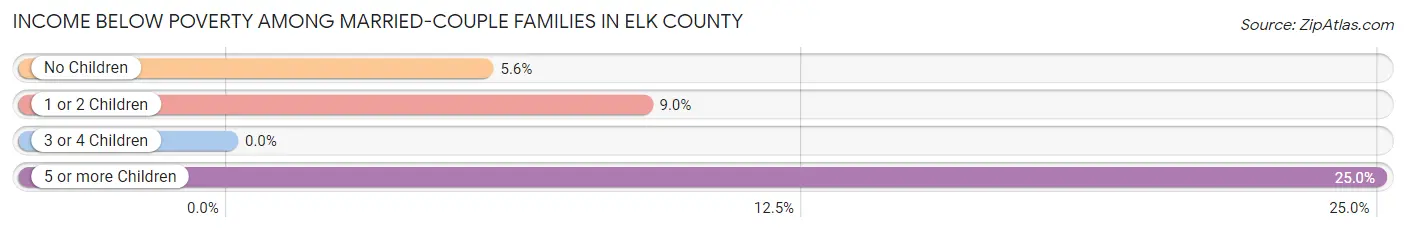
| Children | Above Poverty | Below Poverty |
| No Children | 374 (94.4%) | 22 (5.6%) |
| 1 or 2 Children | 111 (91.0%) | 11 (9.0%) |
| 3 or 4 Children | 44 (100.0%) | 0 (0.0%) |
| 5 or more Children | 3 (75.0%) | 1 (25.0%) |
| Total | 532 (94.0%) | 34 (6.0%) |
Income Below Poverty Among Single-Parent Households in Elk County
According to the poverty data in Elk County, 52.4% or 22 single-father households and 22.5% or 16 single-mother households are living below the poverty line. Among single-father households, those with 1 or 2 children have the highest poverty rate, with 21 households (95.5%) experiencing poverty. Likewise, among single-mother households, those with 3 or 4 children have the highest poverty rate, with 11 households (55.0%) falling below the poverty line.
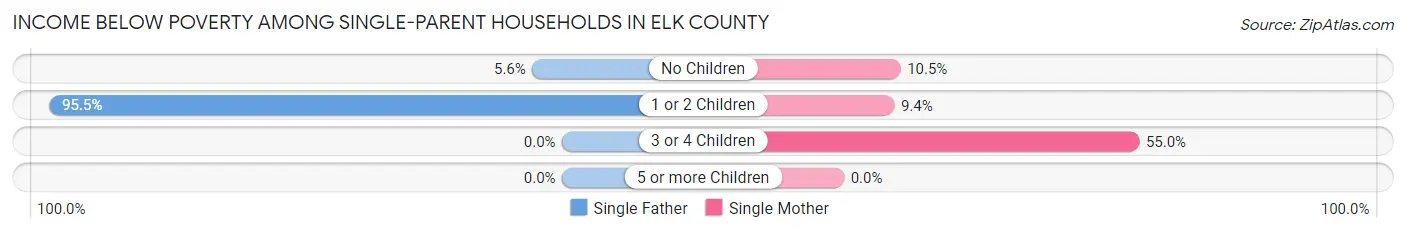
| Children | Single Father | Single Mother |
| No Children | 1 (5.6%) | 2 (10.5%) |
| 1 or 2 Children | 21 (95.5%) | 3 (9.4%) |
| 3 or 4 Children | 0 (0.0%) | 11 (55.0%) |
| 5 or more Children | 0 (0.0%) | 0 (0.0%) |
| Total | 22 (52.4%) | 16 (22.5%) |
Income Below Poverty Among Married-Couple vs Single-Parent Households in Elk County
The poverty data for Elk County shows that 34 of the married-couple family households (6.0%) and 38 of the single-parent households (33.6%) are living below the poverty level. Within the married-couple family households, those with 5 or more children have the highest poverty rate, with 1 households (25.0%) falling below the poverty line. Among the single-parent households, those with 3 or 4 children have the highest poverty rate, with 11 household (50.0%) living below poverty.
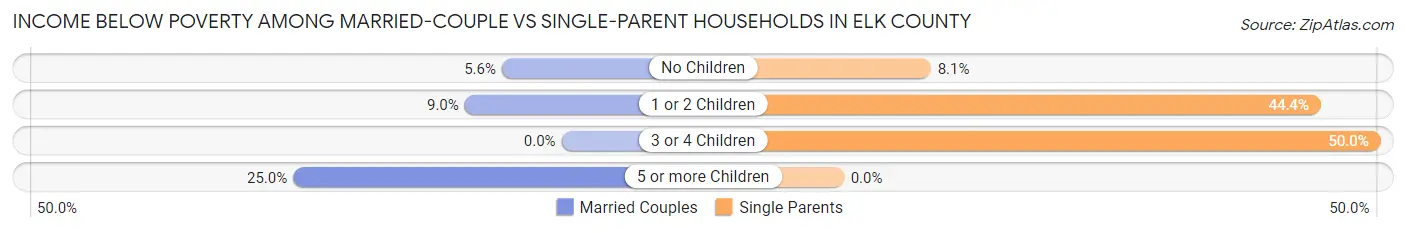
| Children | Married-Couple Families | Single-Parent Households |
| No Children | 22 (5.6%) | 3 (8.1%) |
| 1 or 2 Children | 11 (9.0%) | 24 (44.4%) |
| 3 or 4 Children | 0 (0.0%) | 11 (50.0%) |
| 5 or more Children | 1 (25.0%) | 0 (0.0%) |
| Total | 34 (6.0%) | 38 (33.6%) |
Race in Elk County
The most populous races in Elk County are White / Caucasian (2,267 | 92.4%), Two or more Races (133 | 5.4%), and Hispanic or Latino (116 | 4.7%).
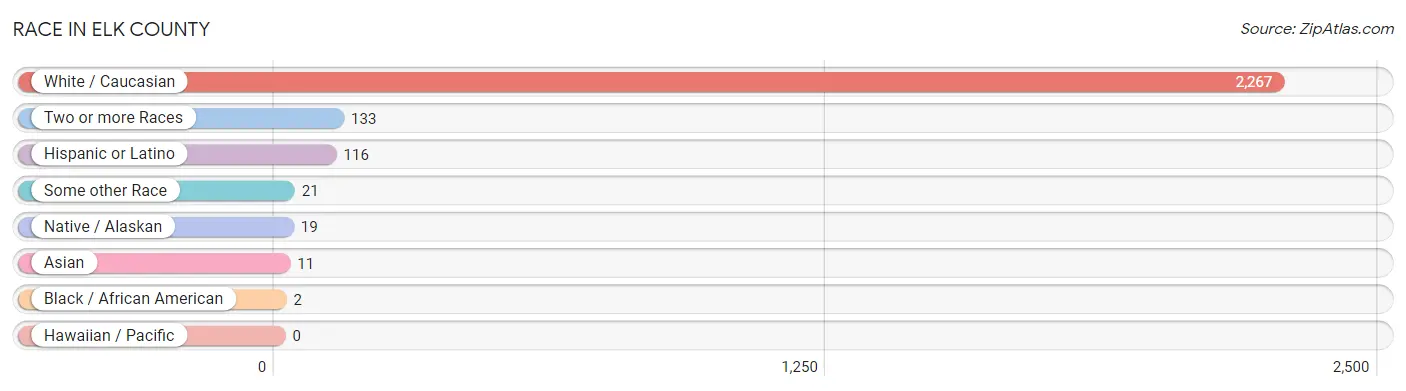
| Race | # Population | % Population |
| Asian | 11 | 0.4% |
| Black / African American | 2 | 0.1% |
| Hawaiian / Pacific | 0 | 0.0% |
| Hispanic or Latino | 116 | 4.7% |
| Native / Alaskan | 19 | 0.8% |
| White / Caucasian | 2,267 | 92.4% |
| Two or more Races | 133 | 5.4% |
| Some other Race | 21 | 0.9% |
| Total | 2,453 | 100.0% |
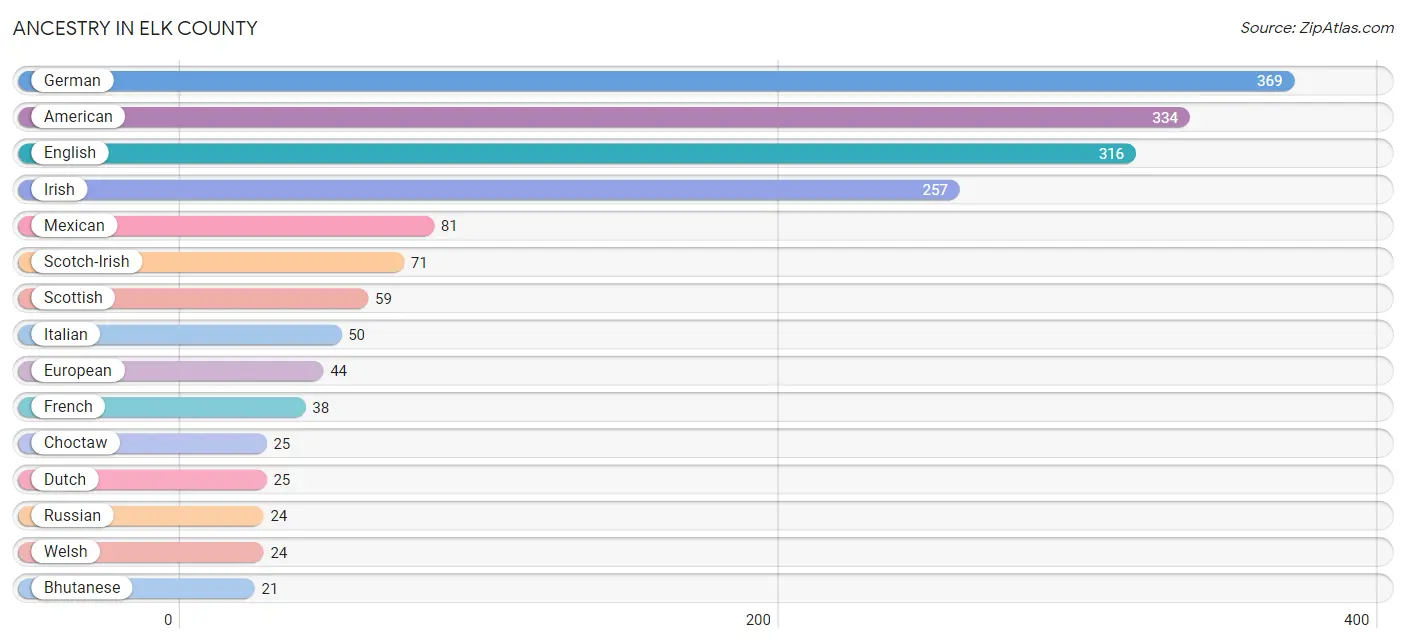
Ancestry in Elk County
The most populous ancestries reported in Elk County are German (369 | 15.0%), American (334 | 13.6%), English (316 | 12.9%), Irish (257 | 10.5%), and Mexican (81 | 3.3%), together accounting for 55.3% of all Elk County residents.
| Ancestry | # Population | % Population |
| American | 334 | 13.6% |
| Belgian | 6 | 0.2% |
| Bhutanese | 21 | 0.9% |
| British | 10 | 0.4% |
| Burmese | 3 | 0.1% |
| Cajun | 7 | 0.3% |
| Cherokee | 20 | 0.8% |
| Choctaw | 25 | 1.0% |
| Czech | 10 | 0.4% |
| Dutch | 25 | 1.0% |
| English | 316 | 12.9% |
| European | 44 | 1.8% |
| French | 38 | 1.5% |
| French American Indian | 1 | 0.0% |
| French Canadian | 17 | 0.7% |
| German | 369 | 15.0% |
| Greek | 1 | 0.0% |
| Irish | 257 | 10.5% |
| Italian | 50 | 2.0% |
| Korean | 12 | 0.5% |
| Mexican | 81 | 3.3% |
| Northern European | 1 | 0.0% |
| Norwegian | 8 | 0.3% |
| Osage | 5 | 0.2% |
| Pennsylvania German | 4 | 0.2% |
| Polish | 11 | 0.4% |
| Russian | 24 | 1.0% |
| Scandinavian | 3 | 0.1% |
| Scotch-Irish | 71 | 2.9% |
| Scottish | 59 | 2.4% |
| Sioux | 1 | 0.0% |
| Swedish | 7 | 0.3% |
| Welsh | 24 | 1.0% | View All 33 Rows |
Immigrants in Elk County
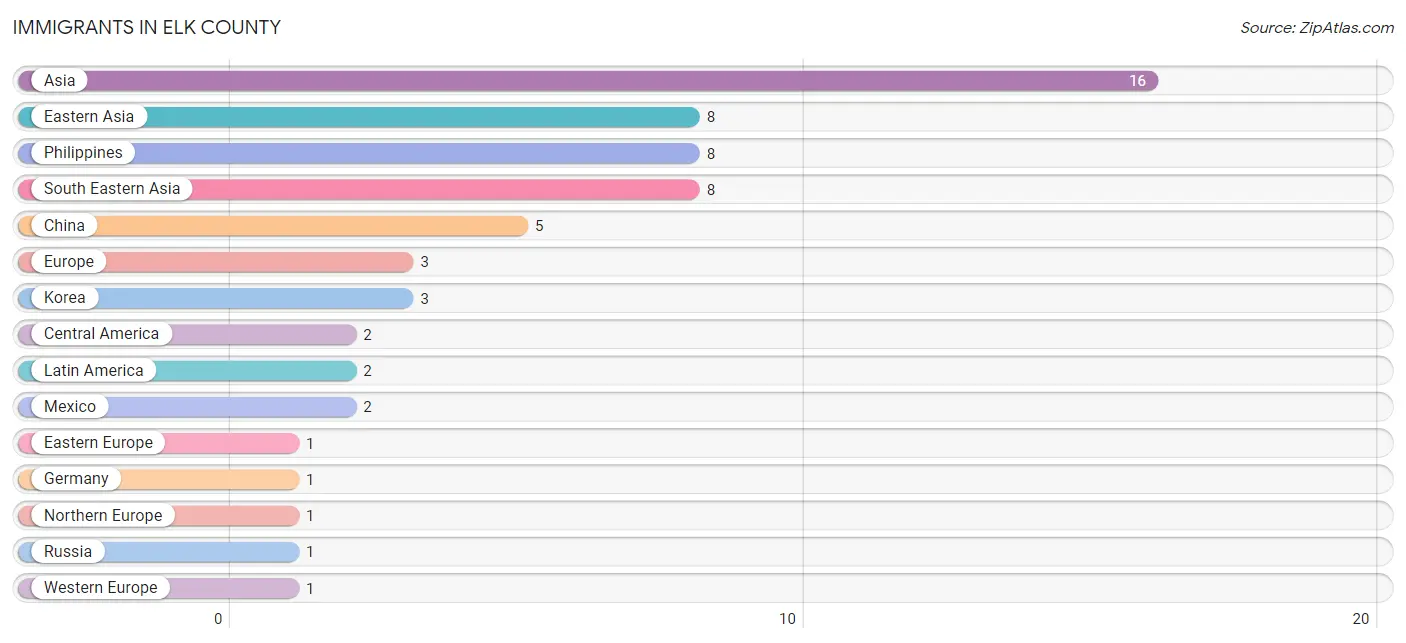
The most numerous immigrant groups reported in Elk County came from Asia (16 | 0.6%), Eastern Asia (8 | 0.3%), Philippines (8 | 0.3%), South Eastern Asia (8 | 0.3%), and China (5 | 0.2%), together accounting for 1.8% of all Elk County residents.
| Immigration Origin | # Population | % Population |
| Asia | 16 | 0.6% |
| Central America | 2 | 0.1% |
| China | 5 | 0.2% |
| Eastern Asia | 8 | 0.3% |
| Eastern Europe | 1 | 0.0% |
| Europe | 3 | 0.1% |
| Germany | 1 | 0.0% |
| Korea | 3 | 0.1% |
| Latin America | 2 | 0.1% |
| Mexico | 2 | 0.1% |
| Northern Europe | 1 | 0.0% |
| Philippines | 8 | 0.3% |
| Russia | 1 | 0.0% |
| South Eastern Asia | 8 | 0.3% |
| Western Europe | 1 | 0.0% | View All 15 Rows |
Sex and Age in Elk County
Sex and Age in Elk County
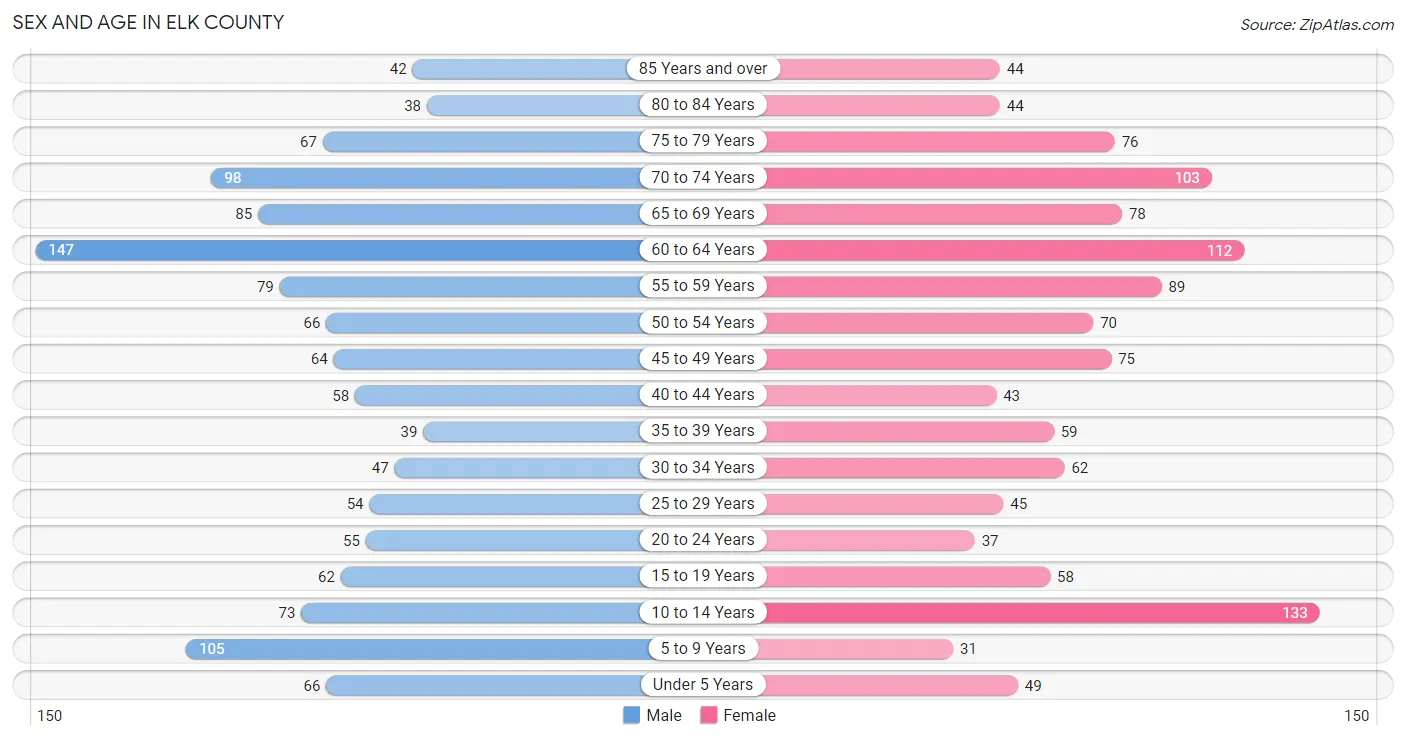
The most populous age groups in Elk County are 60 to 64 Years (147 | 11.8%) for men and 10 to 14 Years (133 | 11.0%) for women.
| Age Bracket | Male | Female |
| Under 5 Years | 66 (5.3%) | 49 (4.1%) |
| 5 to 9 Years | 105 (8.4%) | 31 (2.6%) |
| 10 to 14 Years | 73 (5.9%) | 133 (11.0%) |
| 15 to 19 Years | 62 (5.0%) | 58 (4.8%) |
| 20 to 24 Years | 55 (4.4%) | 37 (3.1%) |
| 25 to 29 Years | 54 (4.3%) | 45 (3.7%) |
| 30 to 34 Years | 47 (3.8%) | 62 (5.1%) |
| 35 to 39 Years | 39 (3.1%) | 59 (4.9%) |
| 40 to 44 Years | 58 (4.7%) | 43 (3.6%) |
| 45 to 49 Years | 64 (5.1%) | 75 (6.2%) |
| 50 to 54 Years | 66 (5.3%) | 70 (5.8%) |
| 55 to 59 Years | 79 (6.4%) | 89 (7.4%) |
| 60 to 64 Years | 147 (11.8%) | 112 (9.3%) |
| 65 to 69 Years | 85 (6.8%) | 78 (6.5%) |
| 70 to 74 Years | 98 (7.9%) | 103 (8.5%) |
| 75 to 79 Years | 67 (5.4%) | 76 (6.3%) |
| 80 to 84 Years | 38 (3.0%) | 44 (3.6%) |
| 85 Years and over | 42 (3.4%) | 44 (3.6%) |
| Total | 1,245 (100.0%) | 1,208 (100.0%) |
Families and Households in Elk County
Median Family Size in Elk County
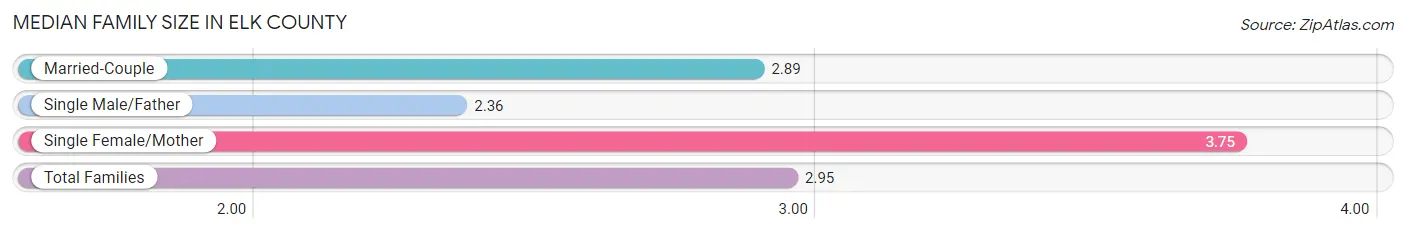
The median family size in Elk County is 2.95 persons per family, with single female/mother families (71 | 10.5%) accounting for the largest median family size of 3.75 persons per family. On the other hand, single male/father families (42 | 6.2%) represent the smallest median family size with 2.36 persons per family.
| Family Type | # Families | Family Size |
| Married-Couple | 566 (83.4%) | 2.89 |
| Single Male/Father | 42 (6.2%) | 2.36 |
| Single Female/Mother | 71 (10.5%) | 3.75 |
| Total Families | 679 (100.0%) | 2.95 |
Median Household Size in Elk County
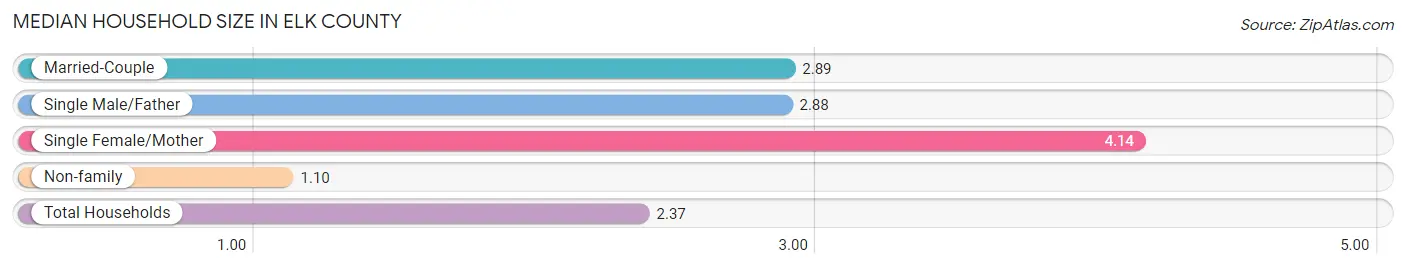
The median household size in Elk County is 2.37 persons per household, with single female/mother households (71 | 6.9%) accounting for the largest median household size of 4.14 persons per household. non-family households (349 | 34.0%) represent the smallest median household size with 1.10 persons per household.
| Household Type | # Households | Household Size |
| Married-Couple | 566 (55.1%) | 2.89 |
| Single Male/Father | 42 (4.1%) | 2.88 |
| Single Female/Mother | 71 (6.9%) | 4.14 |
| Non-family | 349 (34.0%) | 1.10 |
| Total Households | 1,028 (100.0%) | 2.37 |
Household Size by Marriage Status in Elk County
Out of a total of 1,028 households in Elk County, 679 (66.0%) are family households, while 349 (34.0%) are nonfamily households. The most numerous type of family households are 2-person households, comprising 400, and the most common type of nonfamily households are 1-person households, comprising 326.
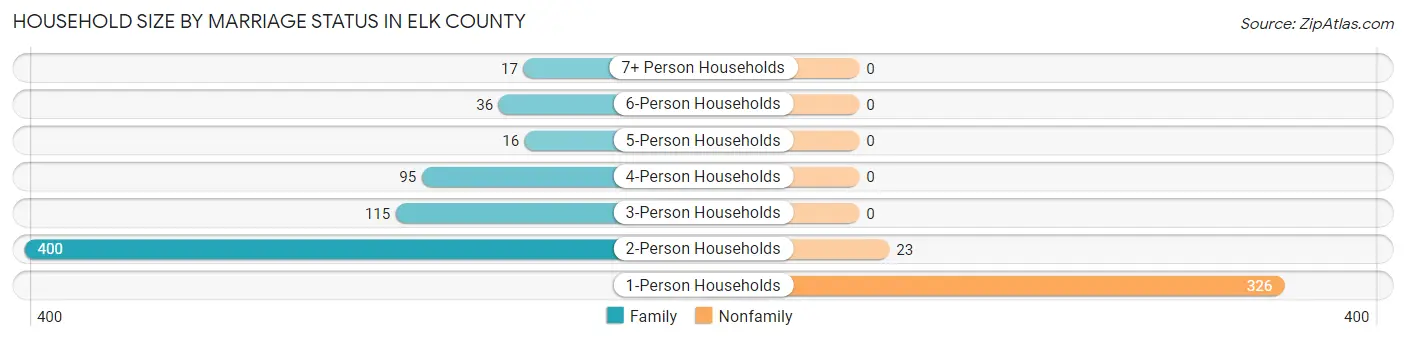
| Household Size | Family Households | Nonfamily Households |
| 1-Person Households | - | 326 (31.7%) |
| 2-Person Households | 400 (38.9%) | 23 (2.2%) |
| 3-Person Households | 115 (11.2%) | 0 (0.0%) |
| 4-Person Households | 95 (9.2%) | 0 (0.0%) |
| 5-Person Households | 16 (1.6%) | 0 (0.0%) |
| 6-Person Households | 36 (3.5%) | 0 (0.0%) |
| 7+ Person Households | 17 (1.7%) | 0 (0.0%) |
| Total | 679 (66.0%) | 349 (34.0%) |
Female Fertility in Elk County
Fertility by Age in Elk County
Average fertility rate in Elk County is 33.0 births per 1,000 women. Women in the age bracket of 20 to 34 years have the highest fertility rate with 63.0 births per 1,000 women. Women in the age bracket of 20 to 34 years acount for 69.2% of all women with births.
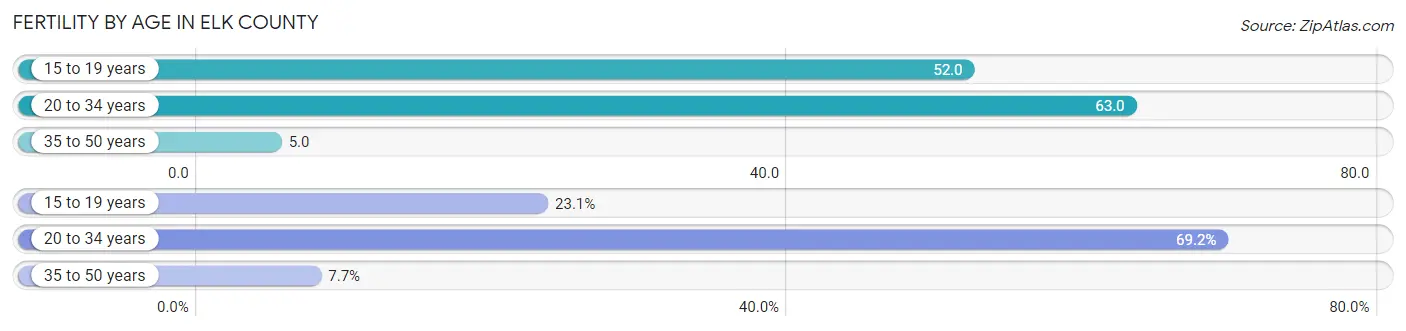
| Age Bracket | Women with Births | Births / 1,000 Women |
| 15 to 19 years | 3 (23.1%) | 52.0 |
| 20 to 34 years | 9 (69.2%) | 63.0 |
| 35 to 50 years | 1 (7.7%) | 5.0 |
| Total | 13 (100.0%) | 33.0 |
Fertility by Age by Marriage Status in Elk County
76.9% of women with births (13) in Elk County are married. The highest percentage of unmarried women with births falls into 15 to 19 years age bracket with 100.0% of them unmarried at the time of birth, while the lowest percentage of unmarried women with births belong to 20 to 34 years age bracket with 0.0% of them unmarried.
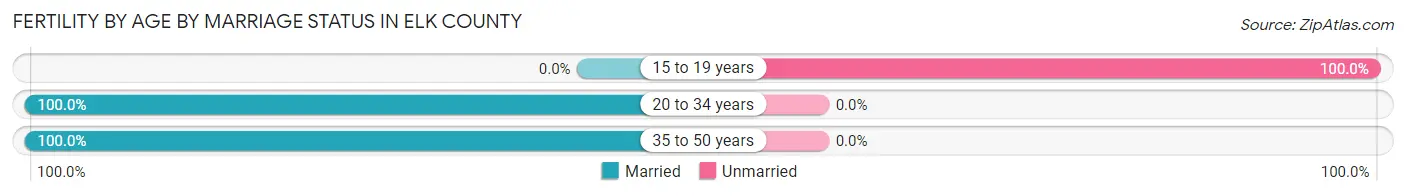
| Age Bracket | Married | Unmarried |
| 15 to 19 years | 0 (0.0%) | 3 (100.0%) |
| 20 to 34 years | 9 (100.0%) | 0 (0.0%) |
| 35 to 50 years | 1 (100.0%) | 0 (0.0%) |
| Total | 10 (76.9%) | 3 (23.1%) |
Fertility by Education in Elk County
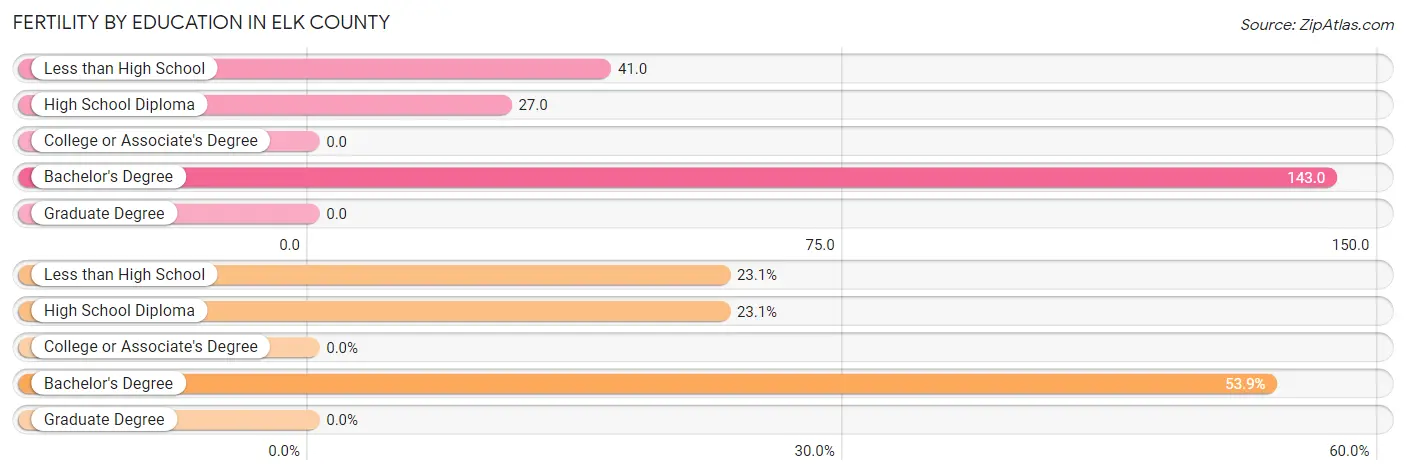
| Educational Attainment | Women with Births | Births / 1,000 Women |
| Less than High School | 3 (23.1%) | 41.0 |
| High School Diploma | 3 (23.1%) | 27.0 |
| College or Associate's Degree | 0 (0.0%) | 0.0 |
| Bachelor's Degree | 7 (53.8%) | 143.0 |
| Graduate Degree | 0 (0.0%) | 0.0 |
| Total | 13 (100.0%) | 33.0 |
Fertility by Education by Marriage Status in Elk County
23.1% of women with births in Elk County are unmarried. Women with the educational attainment of high school diploma are most likely to be married with 100.0% of them married at childbirth, while women with the educational attainment of less than high school are least likely to be married with 100.0% of them unmarried at childbirth.
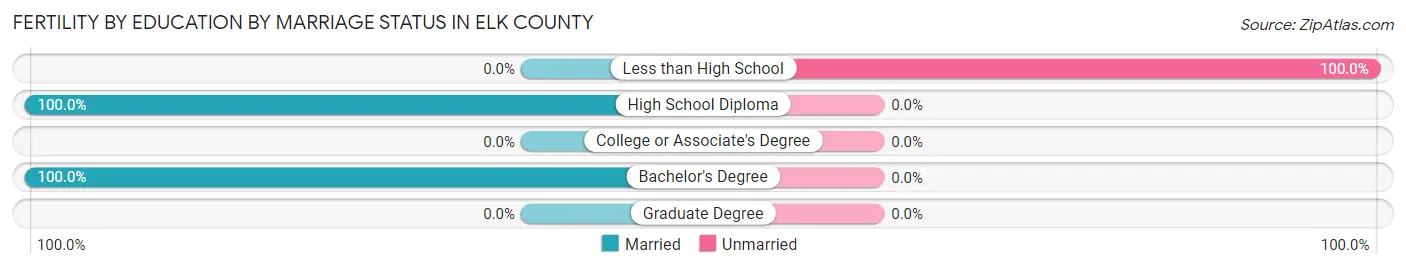
| Educational Attainment | Married | Unmarried |
| Less than High School | 0 (0.0%) | 3 (100.0%) |
| High School Diploma | 3 (100.0%) | 0 (0.0%) |
| College or Associate's Degree | 0 (0.0%) | 0 (0.0%) |
| Bachelor's Degree | 7 (100.0%) | 0 (0.0%) |
| Graduate Degree | 0 (0.0%) | 0 (0.0%) |
| Total | 10 (76.9%) | 3 (23.1%) |
Employment Characteristics in Elk County
Employment by Class of Employer in Elk County
Among the 943 employed individuals in Elk County, private company employees (488 | 51.7%), local government employees (177 | 18.8%), and self-employed (not incorporated) (74 | 7.9%) make up the most common classes of employment.
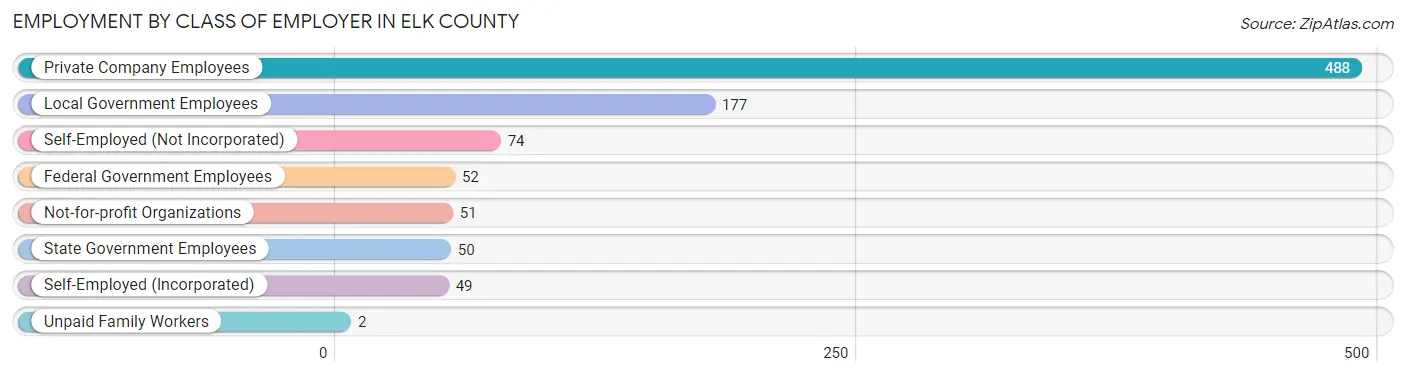
| Employer Class | # Employees | % Employees |
| Private Company Employees | 488 | 51.7% |
| Self-Employed (Incorporated) | 49 | 5.2% |
| Self-Employed (Not Incorporated) | 74 | 7.9% |
| Not-for-profit Organizations | 51 | 5.4% |
| Local Government Employees | 177 | 18.8% |
| State Government Employees | 50 | 5.3% |
| Federal Government Employees | 52 | 5.5% |
| Unpaid Family Workers | 2 | 0.2% |
| Total | 943 | 100.0% |
Employment Status by Age in Elk County
According to the labor force statistics for Elk County, out of the total population over 16 years of age (1,978), 50.2% or 993 individuals are in the labor force, with 3.8% or 38 of them unemployed. The age group with the highest labor force participation rate is 30 to 34 years, with 87.2% or 95 individuals in the labor force. Within the labor force, the 55 to 59 years age range has the highest percentage of unemployed individuals, with 23.1% or 21 of them being unemployed.
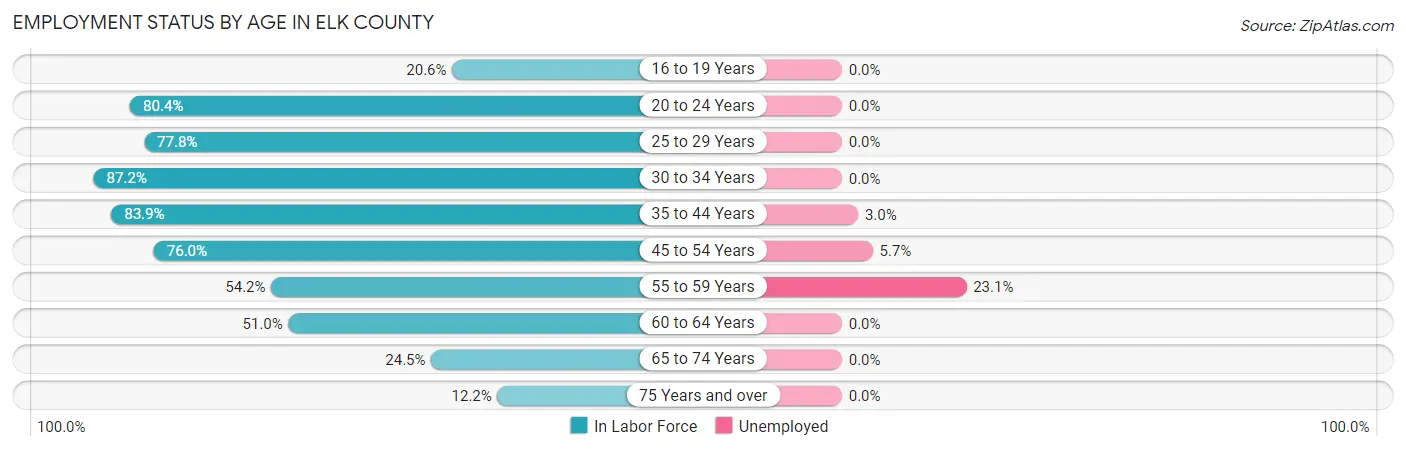
| Age Bracket | In Labor Force | Unemployed |
| 16 to 19 Years | 21 (20.6%) | 0 (0.0%) |
| 20 to 24 Years | 74 (80.4%) | 0 (0.0%) |
| 25 to 29 Years | 77 (77.8%) | 0 (0.0%) |
| 30 to 34 Years | 95 (87.2%) | 0 (0.0%) |
| 35 to 44 Years | 167 (83.9%) | 5 (3.0%) |
| 45 to 54 Years | 209 (76.0%) | 12 (5.7%) |
| 55 to 59 Years | 91 (54.2%) | 21 (23.1%) |
| 60 to 64 Years | 132 (51.0%) | 0 (0.0%) |
| 65 to 74 Years | 89 (24.5%) | 0 (0.0%) |
| 75 Years and over | 38 (12.2%) | 0 (0.0%) |
| Total | 993 (50.2%) | 38 (3.8%) |
Employment Status by Educational Attainment in Elk County
According to labor force statistics for Elk County, 69.5% of individuals (771) out of the total population between 25 and 64 years of age (1,109) are in the labor force, with 4.9% or 38 of them being unemployed. The group with the highest labor force participation rate are those with the educational attainment of bachelor's degree or higher, with 88.0% or 139 individuals in the labor force. Within the labor force, individuals with high school diploma education have the highest percentage of unemployment, with 8.7% or 24 of them being unemployed.
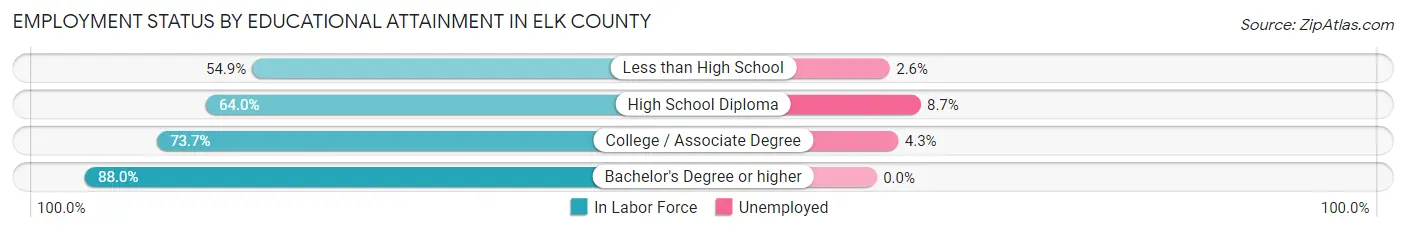
| Educational Attainment | In Labor Force | Unemployed |
| Less than High School | 78 (54.9%) | 4 (2.6%) |
| High School Diploma | 277 (64.0%) | 38 (8.7%) |
| College / Associate Degree | 277 (73.7%) | 16 (4.3%) |
| Bachelor's Degree or higher | 139 (88.0%) | 0 (0.0%) |
| Total | 771 (69.5%) | 54 (4.9%) |
Employment Occupations by Sex in Elk County
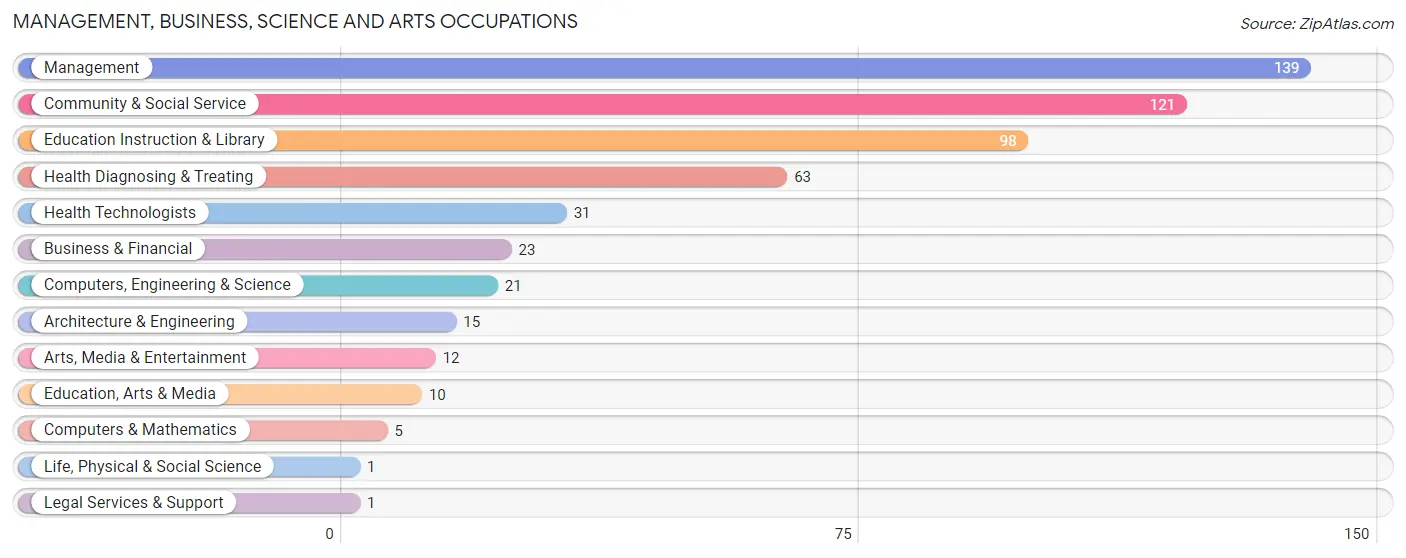
Management, Business, Science and Arts Occupations
The most common Management, Business, Science and Arts occupations in Elk County are Management (139 | 14.5%), Community & Social Service (121 | 12.7%), Education Instruction & Library (98 | 10.3%), Health Diagnosing & Treating (63 | 6.6%), and Health Technologists (31 | 3.3%).
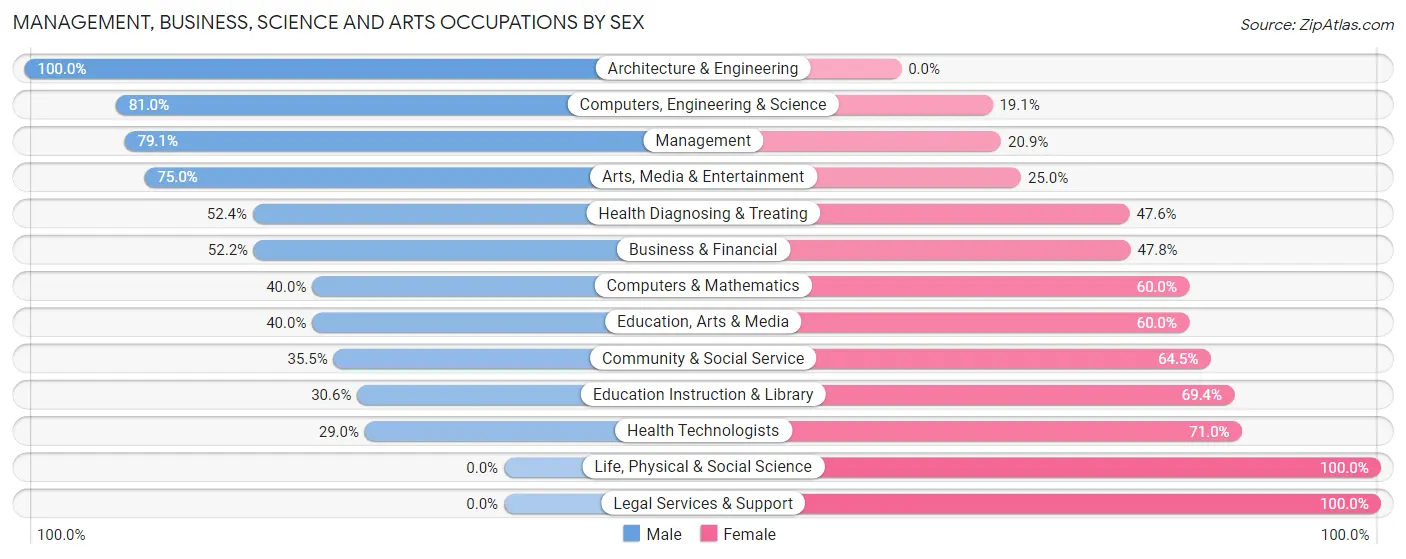
Management, Business, Science and Arts Occupations by Sex
Within the Management, Business, Science and Arts occupations in Elk County, the most male-oriented occupations are Architecture & Engineering (100.0%), Computers, Engineering & Science (80.9%), and Management (79.1%), while the most female-oriented occupations are Life, Physical & Social Science (100.0%), Legal Services & Support (100.0%), and Health Technologists (71.0%).
| Occupation | Male | Female |
| Management | 110 (79.1%) | 29 (20.9%) |
| Business & Financial | 12 (52.2%) | 11 (47.8%) |
| Computers, Engineering & Science | 17 (80.9%) | 4 (19.1%) |
| Computers & Mathematics | 2 (40.0%) | 3 (60.0%) |
| Architecture & Engineering | 15 (100.0%) | 0 (0.0%) |
| Life, Physical & Social Science | 0 (0.0%) | 1 (100.0%) |
| Community & Social Service | 43 (35.5%) | 78 (64.5%) |
| Education, Arts & Media | 4 (40.0%) | 6 (60.0%) |
| Legal Services & Support | 0 (0.0%) | 1 (100.0%) |
| Education Instruction & Library | 30 (30.6%) | 68 (69.4%) |
| Arts, Media & Entertainment | 9 (75.0%) | 3 (25.0%) |
| Health Diagnosing & Treating | 33 (52.4%) | 30 (47.6%) |
| Health Technologists | 9 (29.0%) | 22 (71.0%) |
| Total (Category) | 215 (58.6%) | 152 (41.4%) |
| Total (Overall) | 530 (55.5%) | 425 (44.5%) |
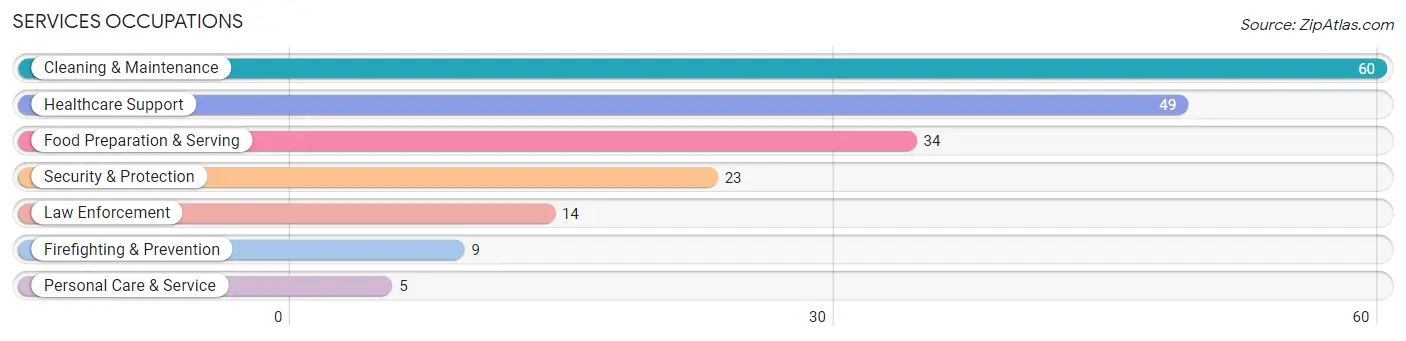
Services Occupations
The most common Services occupations in Elk County are Cleaning & Maintenance (60 | 6.3%), Healthcare Support (49 | 5.1%), Food Preparation & Serving (34 | 3.6%), Security & Protection (23 | 2.4%), and Law Enforcement (14 | 1.5%).
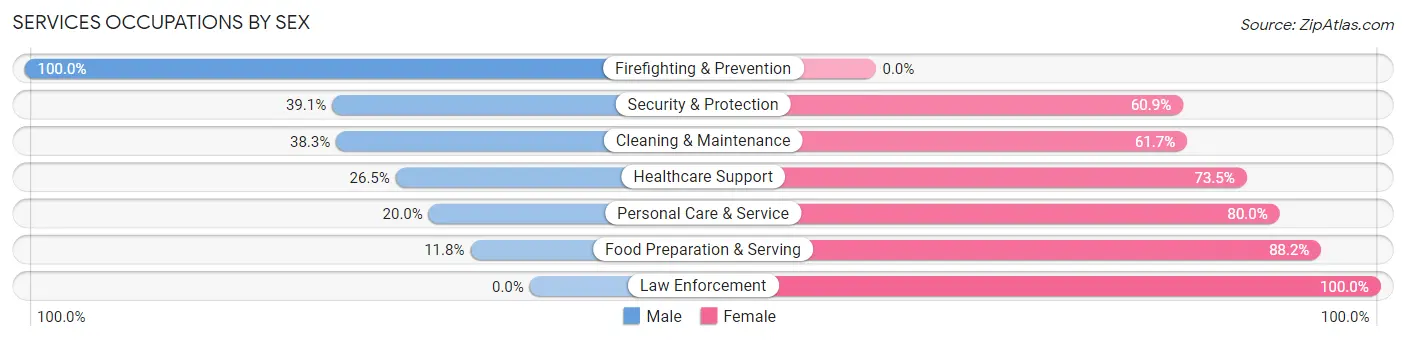
Services Occupations by Sex
Within the Services occupations in Elk County, the most male-oriented occupations are Firefighting & Prevention (100.0%), Security & Protection (39.1%), and Cleaning & Maintenance (38.3%), while the most female-oriented occupations are Law Enforcement (100.0%), Food Preparation & Serving (88.2%), and Personal Care & Service (80.0%).
| Occupation | Male | Female |
| Healthcare Support | 13 (26.5%) | 36 (73.5%) |
| Security & Protection | 9 (39.1%) | 14 (60.9%) |
| Firefighting & Prevention | 9 (100.0%) | 0 (0.0%) |
| Law Enforcement | 0 (0.0%) | 14 (100.0%) |
| Food Preparation & Serving | 4 (11.8%) | 30 (88.2%) |
| Cleaning & Maintenance | 23 (38.3%) | 37 (61.7%) |
| Personal Care & Service | 1 (20.0%) | 4 (80.0%) |
| Total (Category) | 50 (29.2%) | 121 (70.8%) |
| Total (Overall) | 530 (55.5%) | 425 (44.5%) |
Sales and Office Occupations
The most common Sales and Office occupations in Elk County are Office & Administration (104 | 10.9%), and Sales & Related (72 | 7.5%).

Sales and Office Occupations by Sex

| Occupation | Male | Female |
| Sales & Related | 36 (50.0%) | 36 (50.0%) |
| Office & Administration | 14 (13.5%) | 90 (86.5%) |
| Total (Category) | 50 (28.4%) | 126 (71.6%) |
| Total (Overall) | 530 (55.5%) | 425 (44.5%) |
Natural Resources, Construction and Maintenance Occupations
The most common Natural Resources, Construction and Maintenance occupations in Elk County are Construction & Extraction (82 | 8.6%), Installation, Maintenance & Repair (47 | 4.9%), and Farming, Fishing & Forestry (3 | 0.3%).

Natural Resources, Construction and Maintenance Occupations by Sex
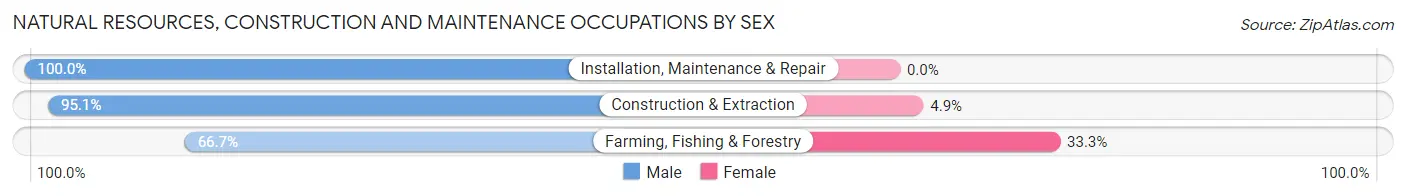
| Occupation | Male | Female |
| Farming, Fishing & Forestry | 2 (66.7%) | 1 (33.3%) |
| Construction & Extraction | 78 (95.1%) | 4 (4.9%) |
| Installation, Maintenance & Repair | 47 (100.0%) | 0 (0.0%) |
| Total (Category) | 127 (96.2%) | 5 (3.8%) |
| Total (Overall) | 530 (55.5%) | 425 (44.5%) |
Production, Transportation and Moving Occupations
The most common Production, Transportation and Moving occupations in Elk County are Production (49 | 5.1%), Transportation (41 | 4.3%), and Material Moving (19 | 2.0%).
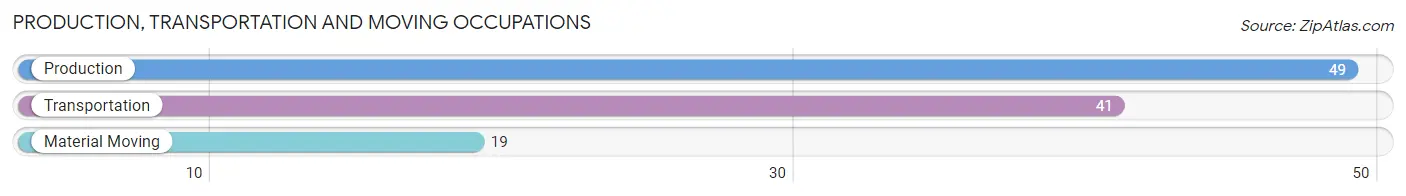
Production, Transportation and Moving Occupations by Sex
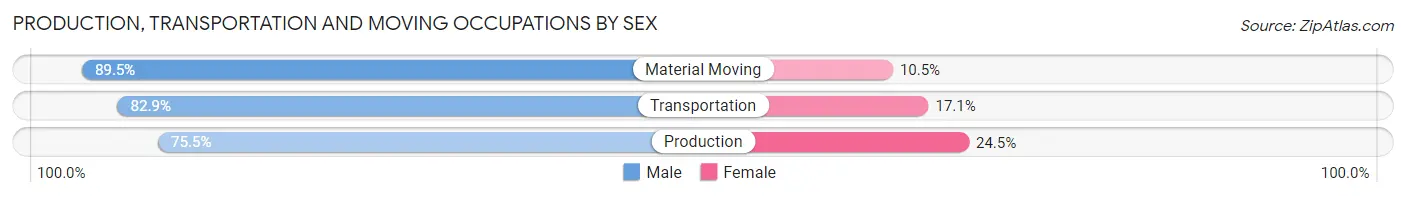
| Occupation | Male | Female |
| Production | 37 (75.5%) | 12 (24.5%) |
| Transportation | 34 (82.9%) | 7 (17.1%) |
| Material Moving | 17 (89.5%) | 2 (10.5%) |
| Total (Category) | 88 (80.7%) | 21 (19.3%) |
| Total (Overall) | 530 (55.5%) | 425 (44.5%) |
Employment Industries by Sex in Elk County
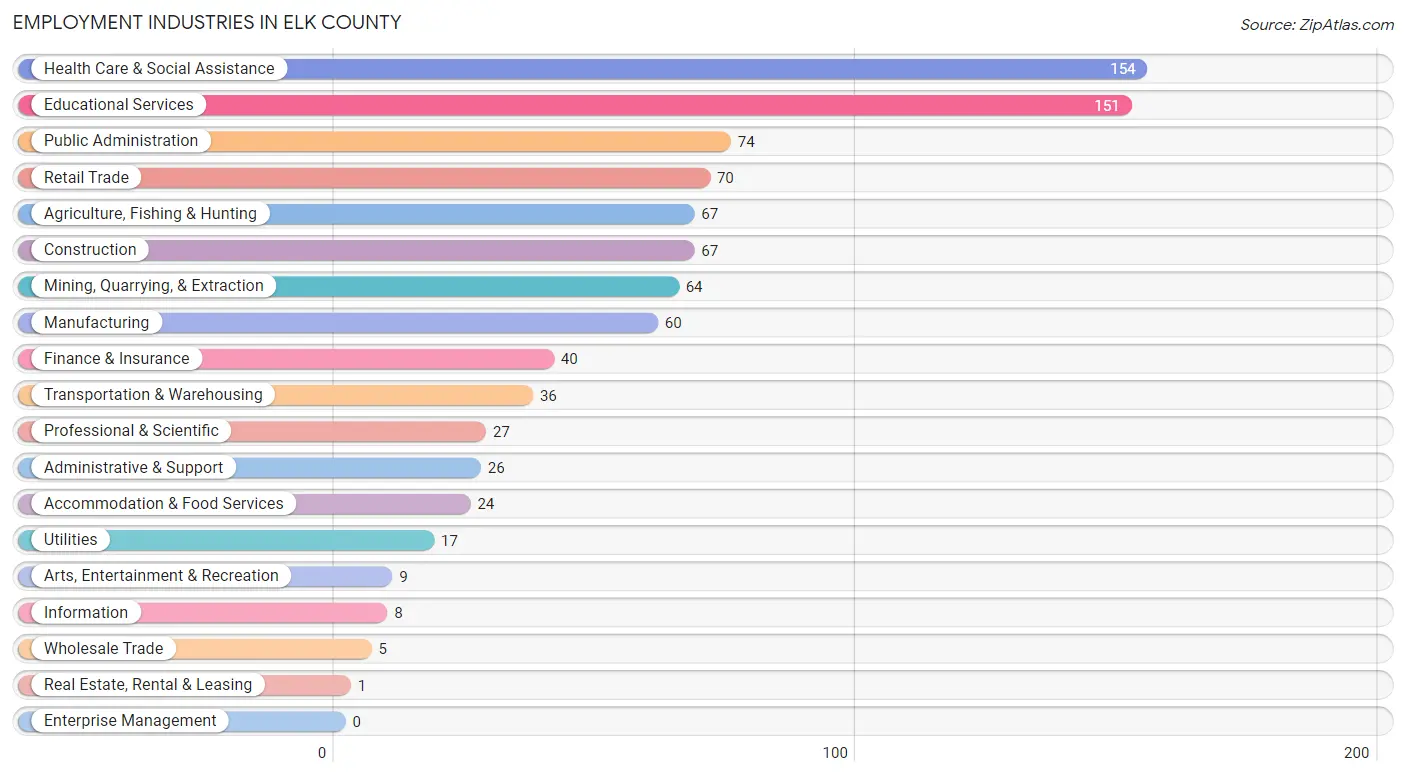
Employment Industries in Elk County
The major employment industries in Elk County include Health Care & Social Assistance (154 | 16.1%), Educational Services (151 | 15.8%), Public Administration (74 | 7.7%), Retail Trade (70 | 7.3%), and Agriculture, Fishing & Hunting (67 | 7.0%).
Employment Industries by Sex in Elk County
The Elk County industries that see more men than women are Wholesale Trade (100.0%), Real Estate, Rental & Leasing (100.0%), and Arts, Entertainment & Recreation (100.0%), whereas the industries that tend to have a higher number of women are Finance & Insurance (87.5%), Information (75.0%), and Public Administration (71.6%).
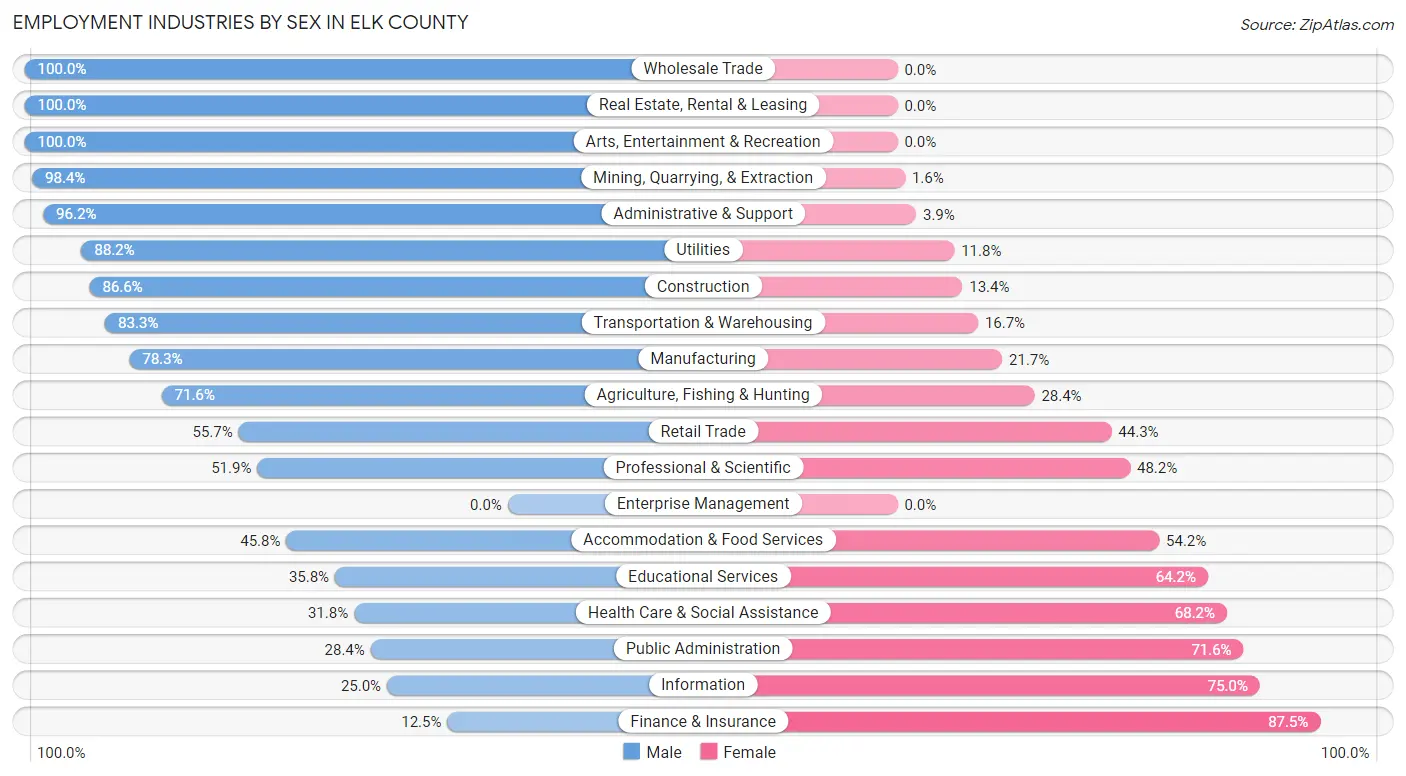
| Industry | Male | Female |
| Agriculture, Fishing & Hunting | 48 (71.6%) | 19 (28.4%) |
| Mining, Quarrying, & Extraction | 63 (98.4%) | 1 (1.6%) |
| Construction | 58 (86.6%) | 9 (13.4%) |
| Manufacturing | 47 (78.3%) | 13 (21.7%) |
| Wholesale Trade | 5 (100.0%) | 0 (0.0%) |
| Retail Trade | 39 (55.7%) | 31 (44.3%) |
| Transportation & Warehousing | 30 (83.3%) | 6 (16.7%) |
| Utilities | 15 (88.2%) | 2 (11.8%) |
| Information | 2 (25.0%) | 6 (75.0%) |
| Finance & Insurance | 5 (12.5%) | 35 (87.5%) |
| Real Estate, Rental & Leasing | 1 (100.0%) | 0 (0.0%) |
| Professional & Scientific | 14 (51.8%) | 13 (48.1%) |
| Enterprise Management | 0 (0.0%) | 0 (0.0%) |
| Administrative & Support | 25 (96.2%) | 1 (3.8%) |
| Educational Services | 54 (35.8%) | 97 (64.2%) |
| Health Care & Social Assistance | 49 (31.8%) | 105 (68.2%) |
| Arts, Entertainment & Recreation | 9 (100.0%) | 0 (0.0%) |
| Accommodation & Food Services | 11 (45.8%) | 13 (54.2%) |
| Public Administration | 21 (28.4%) | 53 (71.6%) |
| Total | 530 (55.5%) | 425 (44.5%) |
Education in Elk County
School Enrollment in Elk County
The most common levels of schooling among the 556 students in Elk County are middle school (149 | 26.8%), elementary school (123 | 22.1%), and high school (122 | 21.9%).
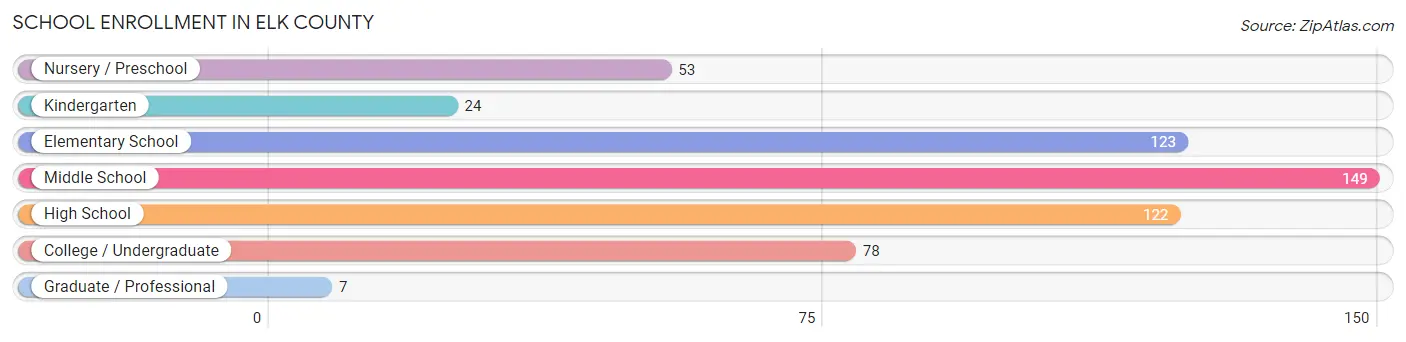
| School Level | # Students | % Students |
| Nursery / Preschool | 53 | 9.5% |
| Kindergarten | 24 | 4.3% |
| Elementary School | 123 | 22.1% |
| Middle School | 149 | 26.8% |
| High School | 122 | 21.9% |
| College / Undergraduate | 78 | 14.0% |
| Graduate / Professional | 7 | 1.3% |
| Total | 556 | 100.0% |
School Enrollment by Age by Funding Source in Elk County
Out of a total of 556 students who are enrolled in schools in Elk County, 37 (6.7%) attend a private institution, while the remaining 519 (93.3%) are enrolled in public schools. The age group of 25 to 34 year olds has the highest likelihood of being enrolled in private schools, with 4 (100.0% in the age bracket) enrolled. Conversely, the age group of 18 to 19 year olds has the lowest likelihood of being enrolled in a private school, with 14 (100.0% in the age bracket) attending a public institution.
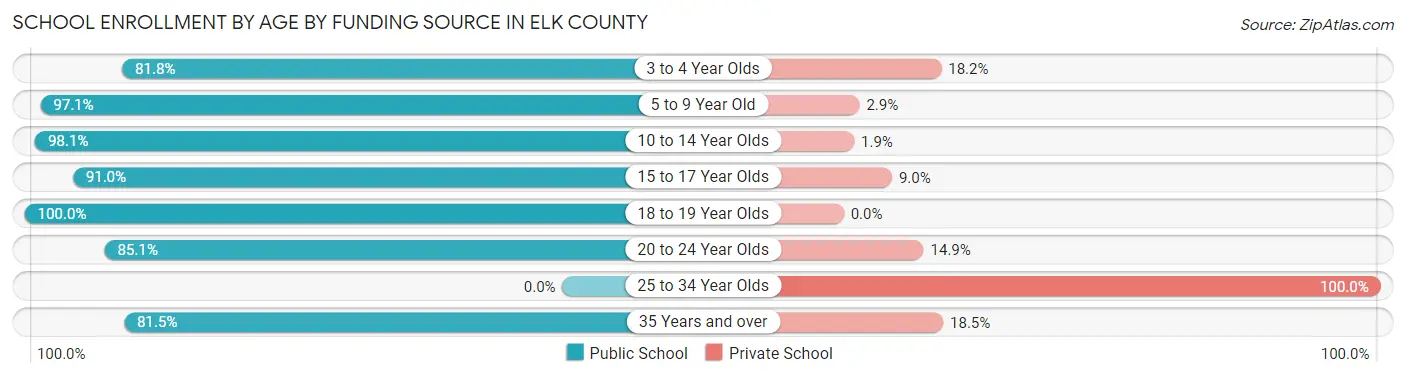
| Age Bracket | Public School | Private School |
| 3 to 4 Year Olds | 18 (81.8%) | 4 (18.2%) |
| 5 to 9 Year Old | 132 (97.1%) | 4 (2.9%) |
| 10 to 14 Year Olds | 202 (98.1%) | 4 (1.9%) |
| 15 to 17 Year Olds | 91 (91.0%) | 9 (9.0%) |
| 18 to 19 Year Olds | 14 (100.0%) | 0 (0.0%) |
| 20 to 24 Year Olds | 40 (85.1%) | 7 (14.9%) |
| 25 to 34 Year Olds | 0 (0.0%) | 4 (100.0%) |
| 35 Years and over | 22 (81.5%) | 5 (18.5%) |
| Total | 519 (93.3%) | 37 (6.7%) |
Educational Attainment by Field of Study in Elk County
Education (95 | 28.1%), bio, nature & agricultural (60 | 17.7%), science & technology (53 | 15.7%), business (31 | 9.2%), and arts & humanities (30 | 8.9%) are the most common fields of study among 338 individuals in Elk County who have obtained a bachelor's degree or higher.
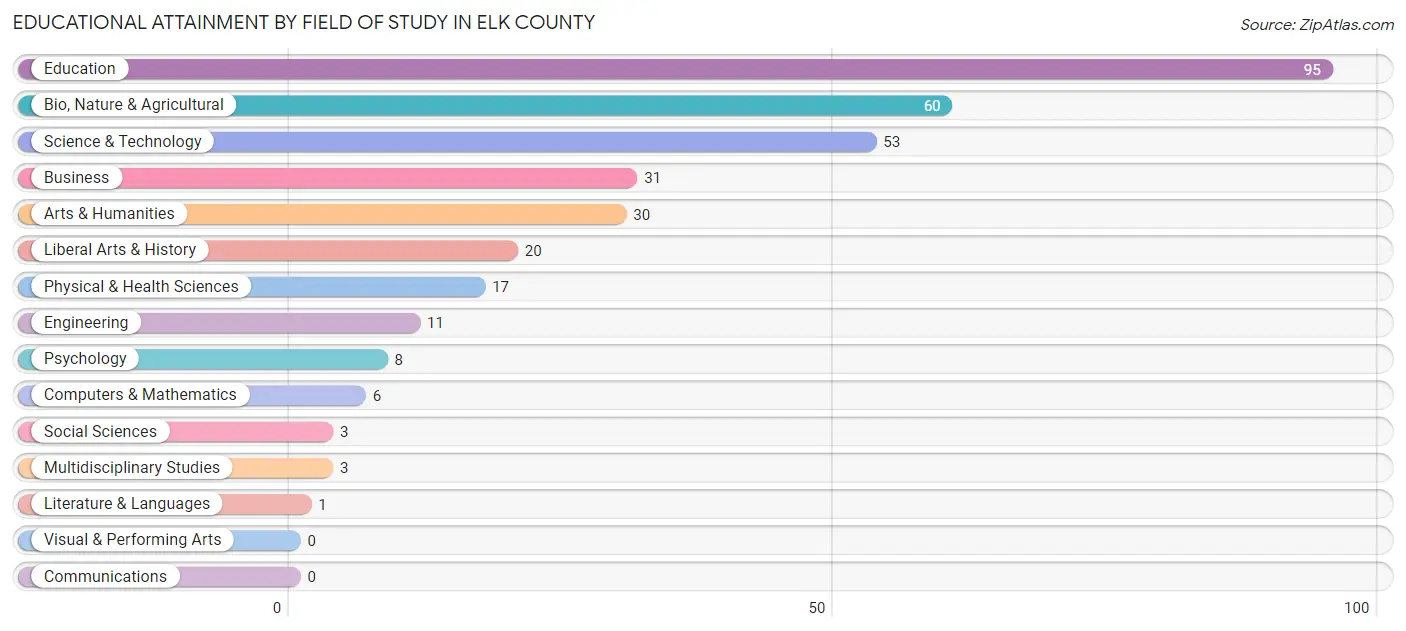
| Field of Study | # Graduates | % Graduates |
| Computers & Mathematics | 6 | 1.8% |
| Bio, Nature & Agricultural | 60 | 17.7% |
| Physical & Health Sciences | 17 | 5.0% |
| Psychology | 8 | 2.4% |
| Social Sciences | 3 | 0.9% |
| Engineering | 11 | 3.3% |
| Multidisciplinary Studies | 3 | 0.9% |
| Science & Technology | 53 | 15.7% |
| Business | 31 | 9.2% |
| Education | 95 | 28.1% |
| Literature & Languages | 1 | 0.3% |
| Liberal Arts & History | 20 | 5.9% |
| Visual & Performing Arts | 0 | 0.0% |
| Communications | 0 | 0.0% |
| Arts & Humanities | 30 | 8.9% |
| Total | 338 | 100.0% |
Transportation & Commute in Elk County
Vehicle Availability by Sex in Elk County
The most prevalent vehicle ownership categories in Elk County are males with 2 vehicles (188, accounting for 35.9%) and females with 2 vehicles (162, making up 44.8%).
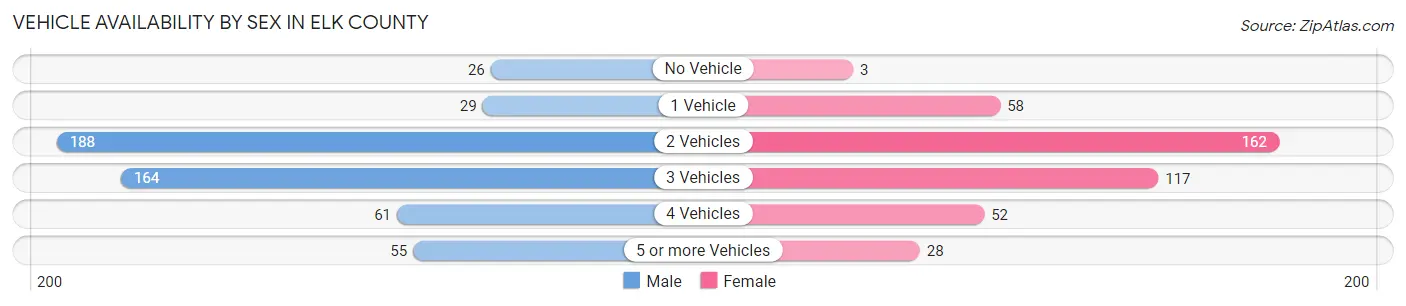
| Vehicles Available | Male | Female |
| No Vehicle | 26 (5.0%) | 3 (0.7%) |
| 1 Vehicle | 29 (5.5%) | 58 (13.8%) |
| 2 Vehicles | 188 (35.9%) | 162 (38.6%) |
| 3 Vehicles | 164 (31.4%) | 117 (27.9%) |
| 4 Vehicles | 61 (11.7%) | 52 (12.4%) |
| 5 or more Vehicles | 55 (10.5%) | 28 (6.7%) |
| Total | 523 (100.0%) | 420 (100.0%) |
Commute Time in Elk County
The most frequently occuring commute durations in Elk County are less than 5 minutes (162 commuters, 18.1%), 5 to 9 minutes (144 commuters, 16.1%), and 30 to 34 minutes (73 commuters, 8.2%).
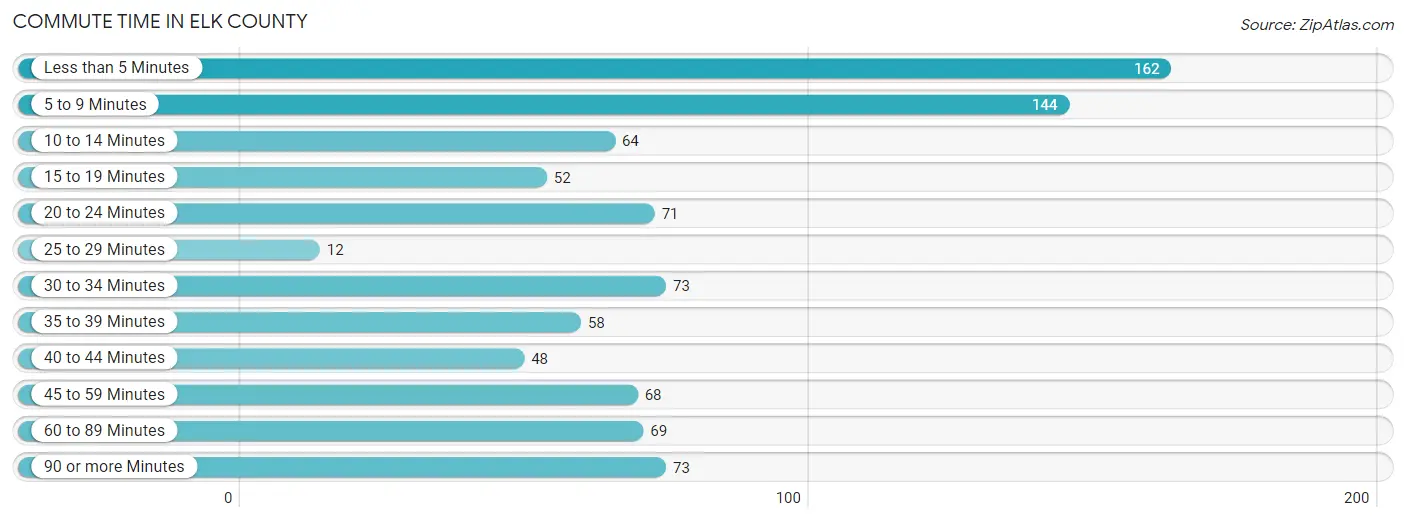
| Commute Time | # Commuters | % Commuters |
| Less than 5 Minutes | 162 | 18.1% |
| 5 to 9 Minutes | 144 | 16.1% |
| 10 to 14 Minutes | 64 | 7.2% |
| 15 to 19 Minutes | 52 | 5.8% |
| 20 to 24 Minutes | 71 | 7.9% |
| 25 to 29 Minutes | 12 | 1.3% |
| 30 to 34 Minutes | 73 | 8.2% |
| 35 to 39 Minutes | 58 | 6.5% |
| 40 to 44 Minutes | 48 | 5.4% |
| 45 to 59 Minutes | 68 | 7.6% |
| 60 to 89 Minutes | 69 | 7.7% |
| 90 or more Minutes | 73 | 8.2% |
Commute Time by Sex in Elk County
The most common commute times in Elk County are less than 5 minutes (84 commuters, 17.0%) for males and less than 5 minutes (78 commuters, 19.5%) for females.
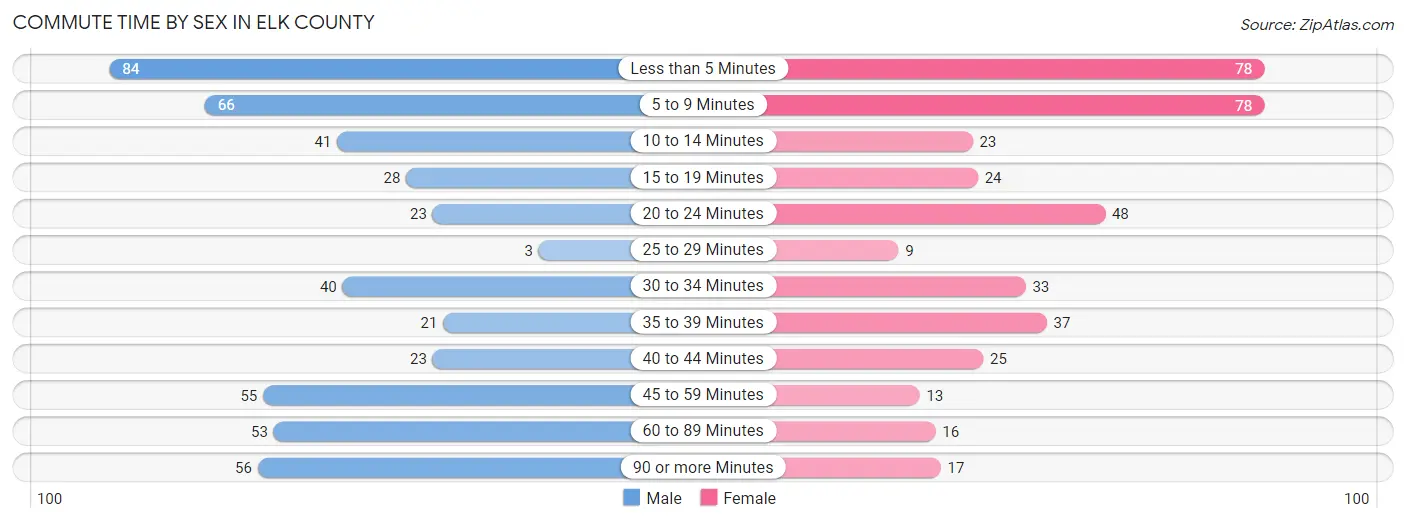
| Commute Time | Male | Female |
| Less than 5 Minutes | 84 (17.0%) | 78 (19.5%) |
| 5 to 9 Minutes | 66 (13.4%) | 78 (19.5%) |
| 10 to 14 Minutes | 41 (8.3%) | 23 (5.7%) |
| 15 to 19 Minutes | 28 (5.7%) | 24 (6.0%) |
| 20 to 24 Minutes | 23 (4.7%) | 48 (12.0%) |
| 25 to 29 Minutes | 3 (0.6%) | 9 (2.2%) |
| 30 to 34 Minutes | 40 (8.1%) | 33 (8.2%) |
| 35 to 39 Minutes | 21 (4.3%) | 37 (9.2%) |
| 40 to 44 Minutes | 23 (4.7%) | 25 (6.2%) |
| 45 to 59 Minutes | 55 (11.2%) | 13 (3.2%) |
| 60 to 89 Minutes | 53 (10.7%) | 16 (4.0%) |
| 90 or more Minutes | 56 (11.4%) | 17 (4.2%) |
Time of Departure to Work by Sex in Elk County
The most frequent times of departure to work in Elk County are 6:30 AM to 6:59 AM (94, 19.1%) for males and 7:00 AM to 7:29 AM (101, 25.2%) for females.
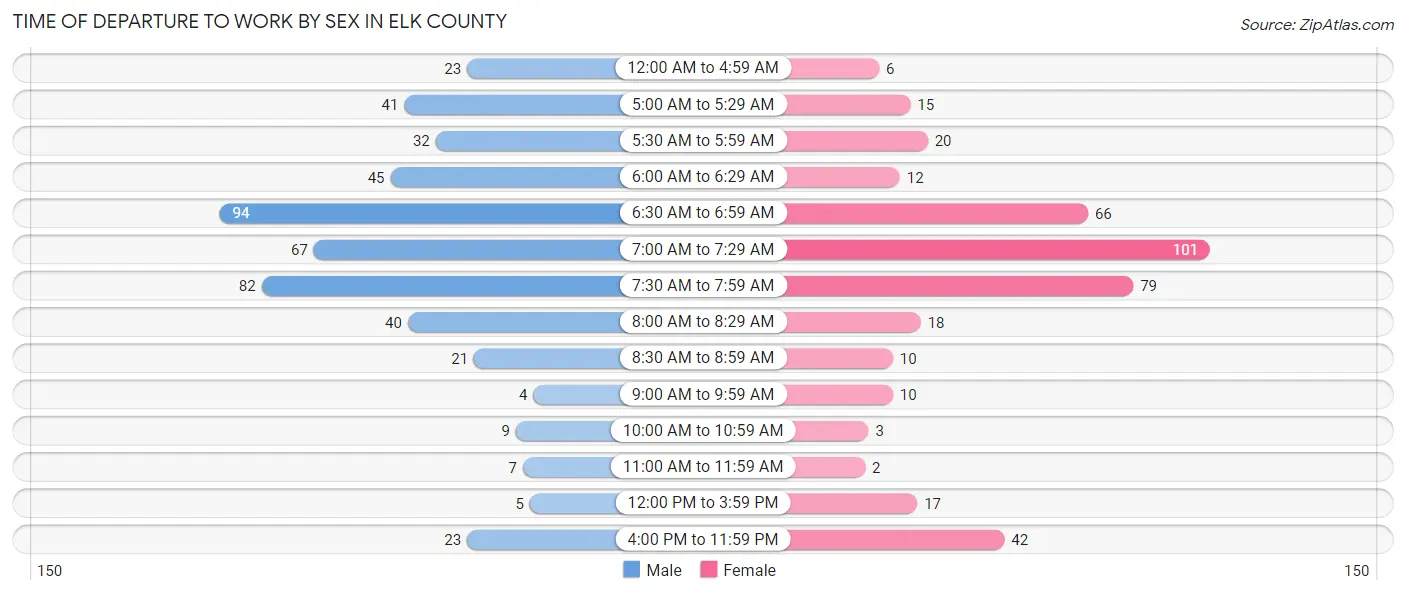
| Time of Departure | Male | Female |
| 12:00 AM to 4:59 AM | 23 (4.7%) | 6 (1.5%) |
| 5:00 AM to 5:29 AM | 41 (8.3%) | 15 (3.7%) |
| 5:30 AM to 5:59 AM | 32 (6.5%) | 20 (5.0%) |
| 6:00 AM to 6:29 AM | 45 (9.1%) | 12 (3.0%) |
| 6:30 AM to 6:59 AM | 94 (19.1%) | 66 (16.5%) |
| 7:00 AM to 7:29 AM | 67 (13.6%) | 101 (25.2%) |
| 7:30 AM to 7:59 AM | 82 (16.6%) | 79 (19.7%) |
| 8:00 AM to 8:29 AM | 40 (8.1%) | 18 (4.5%) |
| 8:30 AM to 8:59 AM | 21 (4.3%) | 10 (2.5%) |
| 9:00 AM to 9:59 AM | 4 (0.8%) | 10 (2.5%) |
| 10:00 AM to 10:59 AM | 9 (1.8%) | 3 (0.7%) |
| 11:00 AM to 11:59 AM | 7 (1.4%) | 2 (0.5%) |
| 12:00 PM to 3:59 PM | 5 (1.0%) | 17 (4.2%) |
| 4:00 PM to 11:59 PM | 23 (4.7%) | 42 (10.5%) |
| Total | 493 (100.0%) | 401 (100.0%) |
Housing Occupancy in Elk County
Occupancy by Ownership in Elk County
Of the total 1,028 dwellings in Elk County, owner-occupied units account for 799 (77.7%), while renter-occupied units make up 229 (22.3%).
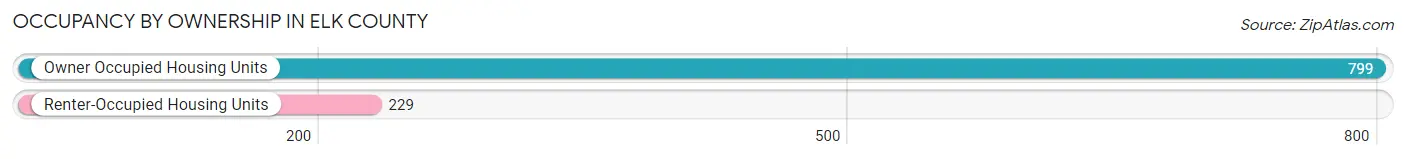
| Occupancy | # Housing Units | % Housing Units |
| Owner Occupied Housing Units | 799 | 77.7% |
| Renter-Occupied Housing Units | 229 | 22.3% |
| Total Occupied Housing Units | 1,028 | 100.0% |
Occupancy by Household Size in Elk County
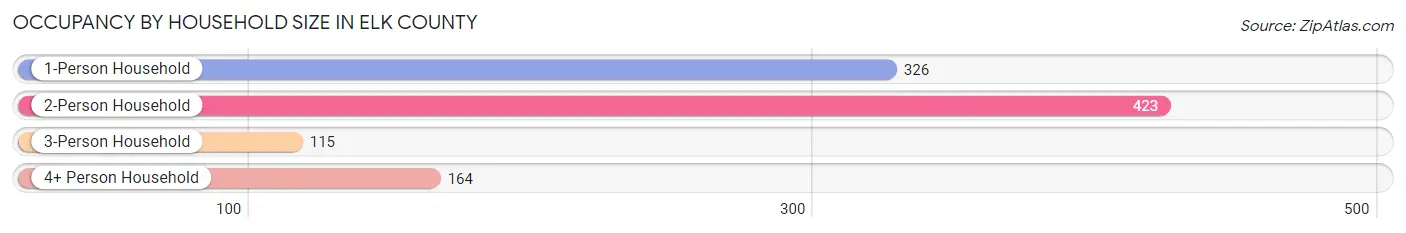
| Household Size | # Housing Units | % Housing Units |
| 1-Person Household | 326 | 31.7% |
| 2-Person Household | 423 | 41.1% |
| 3-Person Household | 115 | 11.2% |
| 4+ Person Household | 164 | 16.0% |
| Total Housing Units | 1,028 | 100.0% |
Occupancy by Ownership by Household Size in Elk County
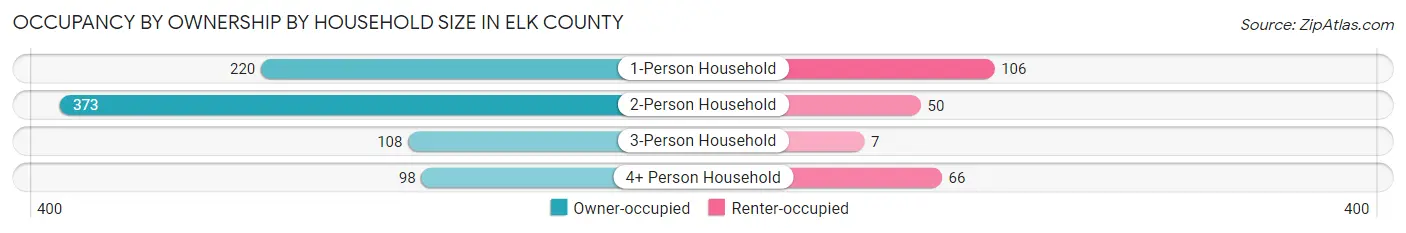
| Household Size | Owner-occupied | Renter-occupied |
| 1-Person Household | 220 (67.5%) | 106 (32.5%) |
| 2-Person Household | 373 (88.2%) | 50 (11.8%) |
| 3-Person Household | 108 (93.9%) | 7 (6.1%) |
| 4+ Person Household | 98 (59.8%) | 66 (40.2%) |
| Total Housing Units | 799 (77.7%) | 229 (22.3%) |
Occupancy by Educational Attainment in Elk County
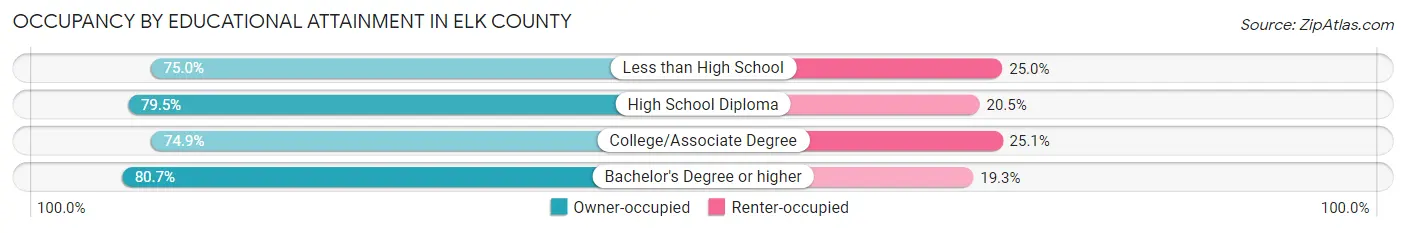
| Household Size | Owner-occupied | Renter-occupied |
| Less than High School | 75 (75.0%) | 25 (25.0%) |
| High School Diploma | 252 (79.5%) | 65 (20.5%) |
| College/Associate Degree | 275 (74.9%) | 92 (25.1%) |
| Bachelor's Degree or higher | 197 (80.7%) | 47 (19.3%) |
Occupancy by Age of Householder in Elk County
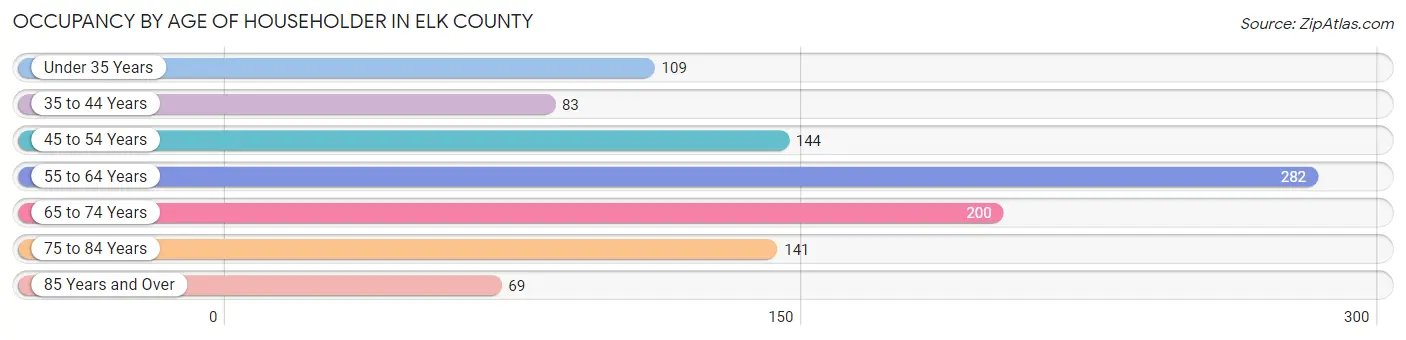
| Age Bracket | # Households | % Households |
| Under 35 Years | 109 | 10.6% |
| 35 to 44 Years | 83 | 8.1% |
| 45 to 54 Years | 144 | 14.0% |
| 55 to 64 Years | 282 | 27.4% |
| 65 to 74 Years | 200 | 19.5% |
| 75 to 84 Years | 141 | 13.7% |
| 85 Years and Over | 69 | 6.7% |
| Total | 1,028 | 100.0% |
Housing Finances in Elk County
Median Income by Occupancy in Elk County
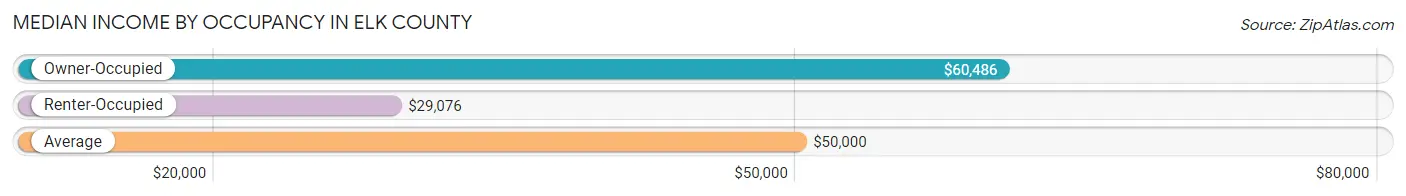
| Occupancy Type | # Households | Median Income |
| Owner-Occupied | 799 (77.7%) | $60,486 |
| Renter-Occupied | 229 (22.3%) | $29,076 |
| Average | 1,028 (100.0%) | $50,000 |
Occupancy by Householder Income Bracket in Elk County
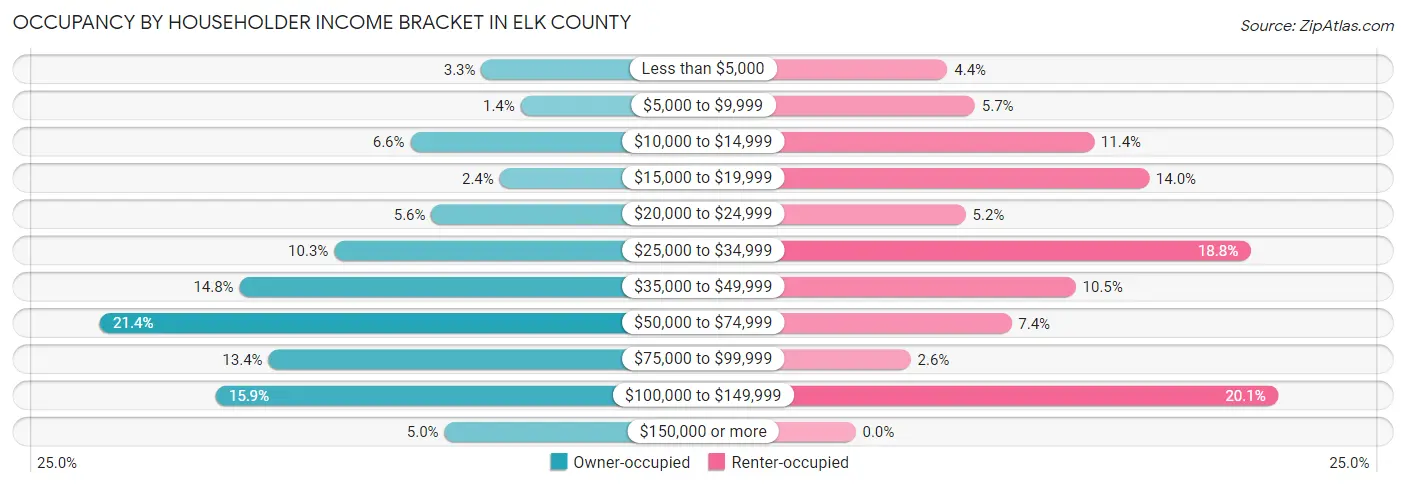
| Income Bracket | Owner-occupied | Renter-occupied |
| Less than $5,000 | 26 (3.3%) | 10 (4.4%) |
| $5,000 to $9,999 | 11 (1.4%) | 13 (5.7%) |
| $10,000 to $14,999 | 53 (6.6%) | 26 (11.4%) |
| $15,000 to $19,999 | 19 (2.4%) | 32 (14.0%) |
| $20,000 to $24,999 | 45 (5.6%) | 12 (5.2%) |
| $25,000 to $34,999 | 82 (10.3%) | 43 (18.8%) |
| $35,000 to $49,999 | 118 (14.8%) | 24 (10.5%) |
| $50,000 to $74,999 | 171 (21.4%) | 17 (7.4%) |
| $75,000 to $99,999 | 107 (13.4%) | 6 (2.6%) |
| $100,000 to $149,999 | 127 (15.9%) | 46 (20.1%) |
| $150,000 or more | 40 (5.0%) | 0 (0.0%) |
| Total | 799 (100.0%) | 229 (100.0%) |
Monthly Housing Cost Tiers in Elk County
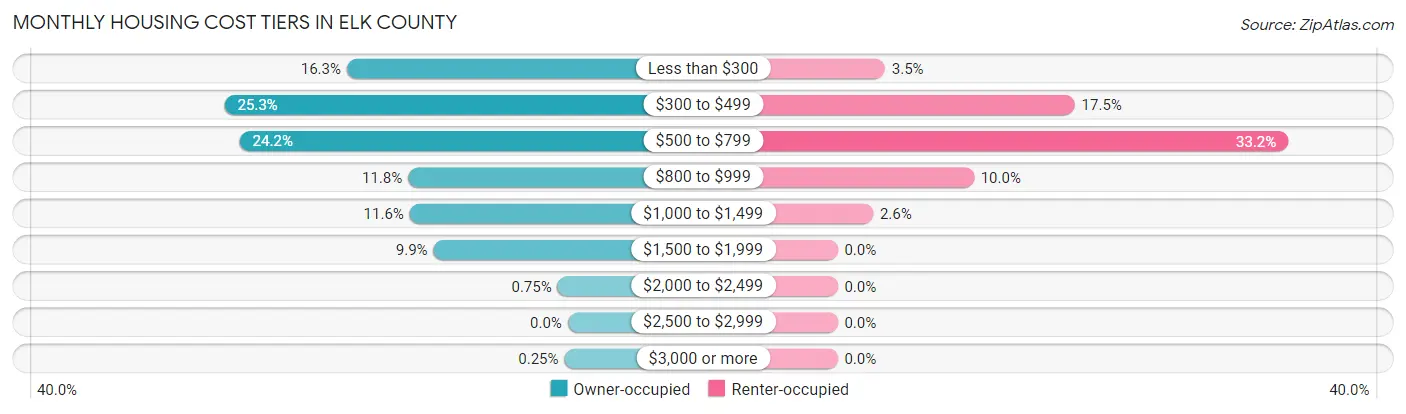
| Monthly Cost | Owner-occupied | Renter-occupied |
| Less than $300 | 130 (16.3%) | 8 (3.5%) |
| $300 to $499 | 202 (25.3%) | 40 (17.5%) |
| $500 to $799 | 193 (24.2%) | 76 (33.2%) |
| $800 to $999 | 94 (11.8%) | 23 (10.0%) |
| $1,000 to $1,499 | 93 (11.6%) | 6 (2.6%) |
| $1,500 to $1,999 | 79 (9.9%) | 0 (0.0%) |
| $2,000 to $2,499 | 6 (0.7%) | 0 (0.0%) |
| $2,500 to $2,999 | 0 (0.0%) | 0 (0.0%) |
| $3,000 or more | 2 (0.3%) | 0 (0.0%) |
| Total | 799 (100.0%) | 229 (100.0%) |
Physical Housing Characteristics in Elk County
Housing Structures in Elk County
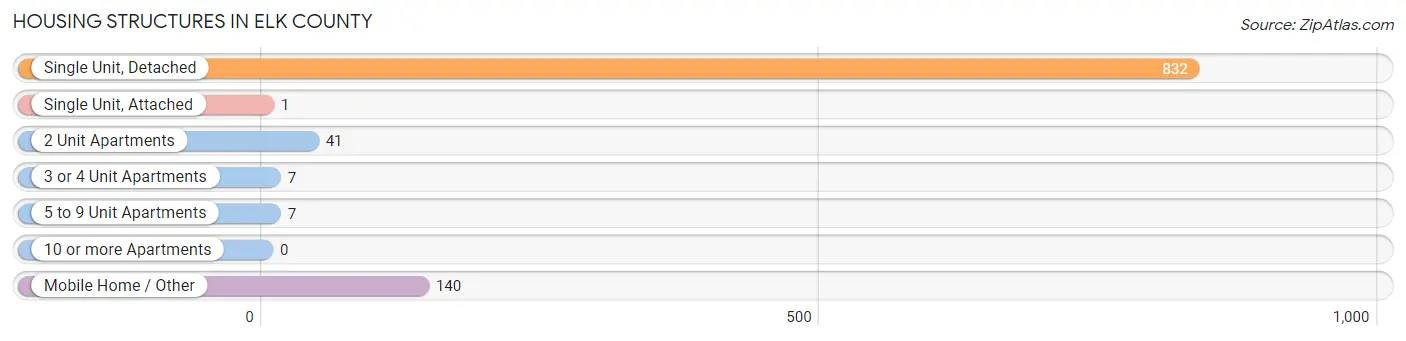
| Structure Type | # Housing Units | % Housing Units |
| Single Unit, Detached | 832 | 80.9% |
| Single Unit, Attached | 1 | 0.1% |
| 2 Unit Apartments | 41 | 4.0% |
| 3 or 4 Unit Apartments | 7 | 0.7% |
| 5 to 9 Unit Apartments | 7 | 0.7% |
| 10 or more Apartments | 0 | 0.0% |
| Mobile Home / Other | 140 | 13.6% |
| Total | 1,028 | 100.0% |
Housing Structures by Occupancy in Elk County
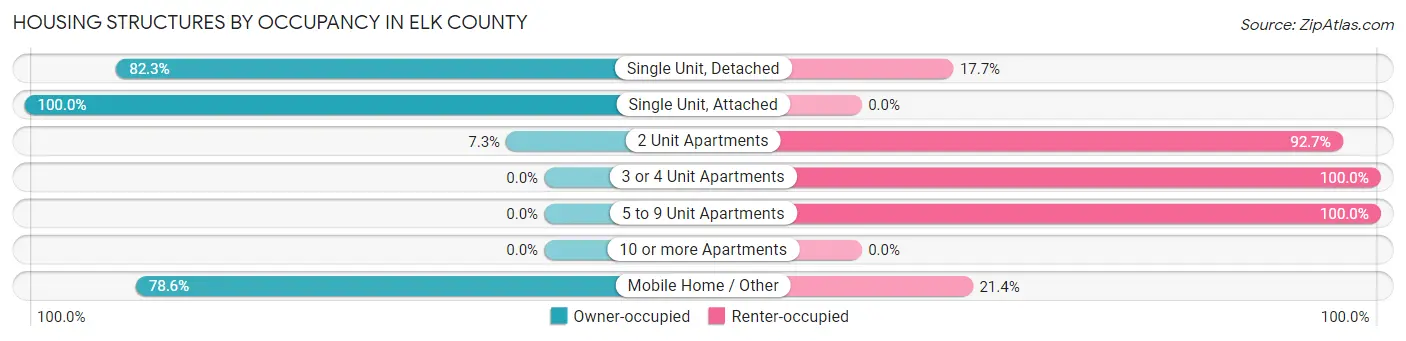
| Structure Type | Owner-occupied | Renter-occupied |
| Single Unit, Detached | 685 (82.3%) | 147 (17.7%) |
| Single Unit, Attached | 1 (100.0%) | 0 (0.0%) |
| 2 Unit Apartments | 3 (7.3%) | 38 (92.7%) |
| 3 or 4 Unit Apartments | 0 (0.0%) | 7 (100.0%) |
| 5 to 9 Unit Apartments | 0 (0.0%) | 7 (100.0%) |
| 10 or more Apartments | 0 (0.0%) | 0 (0.0%) |
| Mobile Home / Other | 110 (78.6%) | 30 (21.4%) |
| Total | 799 (77.7%) | 229 (22.3%) |
Housing Structures by Number of Rooms in Elk County
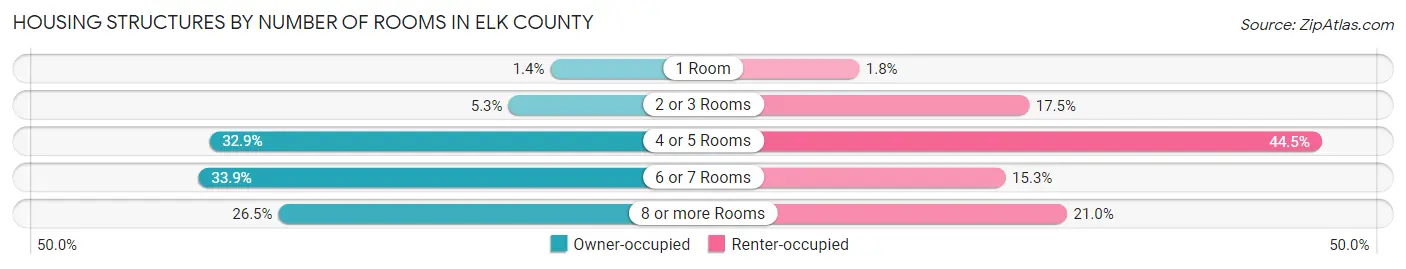
| Number of Rooms | Owner-occupied | Renter-occupied |
| 1 Room | 11 (1.4%) | 4 (1.8%) |
| 2 or 3 Rooms | 42 (5.3%) | 40 (17.5%) |
| 4 or 5 Rooms | 263 (32.9%) | 102 (44.5%) |
| 6 or 7 Rooms | 271 (33.9%) | 35 (15.3%) |
| 8 or more Rooms | 212 (26.5%) | 48 (21.0%) |
| Total | 799 (100.0%) | 229 (100.0%) |
Housing Structure by Heating Type in Elk County
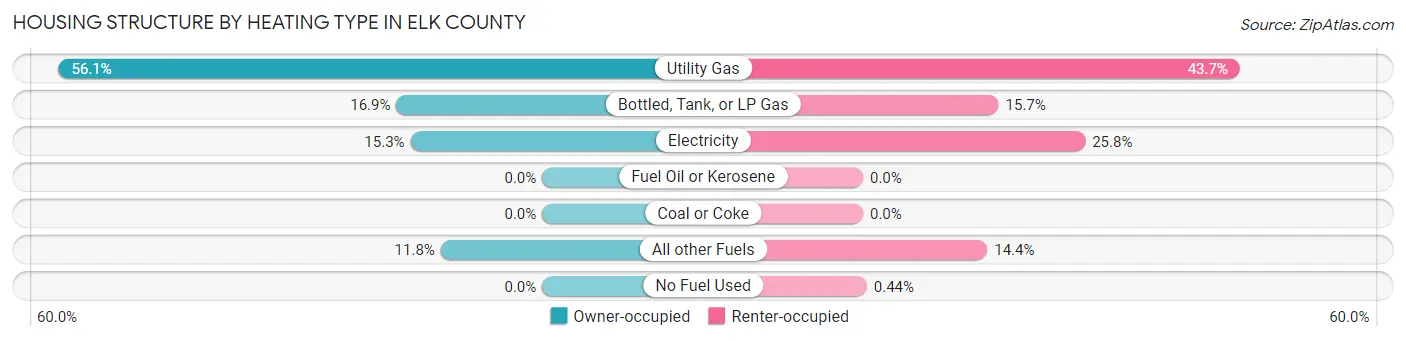
| Heating Type | Owner-occupied | Renter-occupied |
| Utility Gas | 448 (56.1%) | 100 (43.7%) |
| Bottled, Tank, or LP Gas | 135 (16.9%) | 36 (15.7%) |
| Electricity | 122 (15.3%) | 59 (25.8%) |
| Fuel Oil or Kerosene | 0 (0.0%) | 0 (0.0%) |
| Coal or Coke | 0 (0.0%) | 0 (0.0%) |
| All other Fuels | 94 (11.8%) | 33 (14.4%) |
| No Fuel Used | 0 (0.0%) | 1 (0.4%) |
| Total | 799 (100.0%) | 229 (100.0%) |
Household Vehicle Usage in Elk County
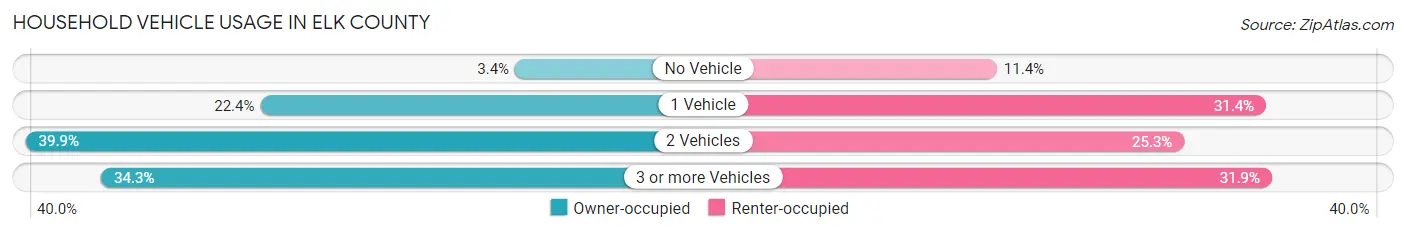
| Vehicles per Household | Owner-occupied | Renter-occupied |
| No Vehicle | 27 (3.4%) | 26 (11.4%) |
| 1 Vehicle | 179 (22.4%) | 72 (31.4%) |
| 2 Vehicles | 319 (39.9%) | 58 (25.3%) |
| 3 or more Vehicles | 274 (34.3%) | 73 (31.9%) |
| Total | 799 (100.0%) | 229 (100.0%) |
Real Estate & Mortgages in Elk County
Real Estate and Mortgage Overview in Elk County
| Characteristic | Without Mortgage | With Mortgage |
| Housing Units | 546 | 253 |
| Median Property Value | $51,900 | $80,300 |
| Median Household Income | $43,333 | $33 |
| Monthly Housing Costs | $450 | $0 |
| Real Estate Taxes | $1,150 | $14 |
Property Value by Mortgage Status in Elk County
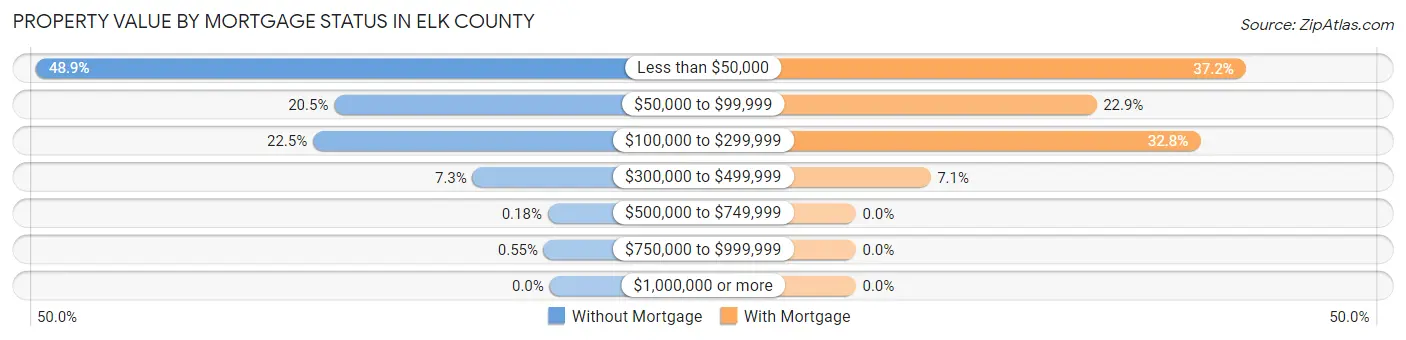
| Property Value | Without Mortgage | With Mortgage |
| Less than $50,000 | 267 (48.9%) | 94 (37.1%) |
| $50,000 to $99,999 | 112 (20.5%) | 58 (22.9%) |
| $100,000 to $299,999 | 123 (22.5%) | 83 (32.8%) |
| $300,000 to $499,999 | 40 (7.3%) | 18 (7.1%) |
| $500,000 to $749,999 | 1 (0.2%) | 0 (0.0%) |
| $750,000 to $999,999 | 3 (0.5%) | 0 (0.0%) |
| $1,000,000 or more | 0 (0.0%) | 0 (0.0%) |
| Total | 546 (100.0%) | 253 (100.0%) |
Household Income by Mortgage Status in Elk County
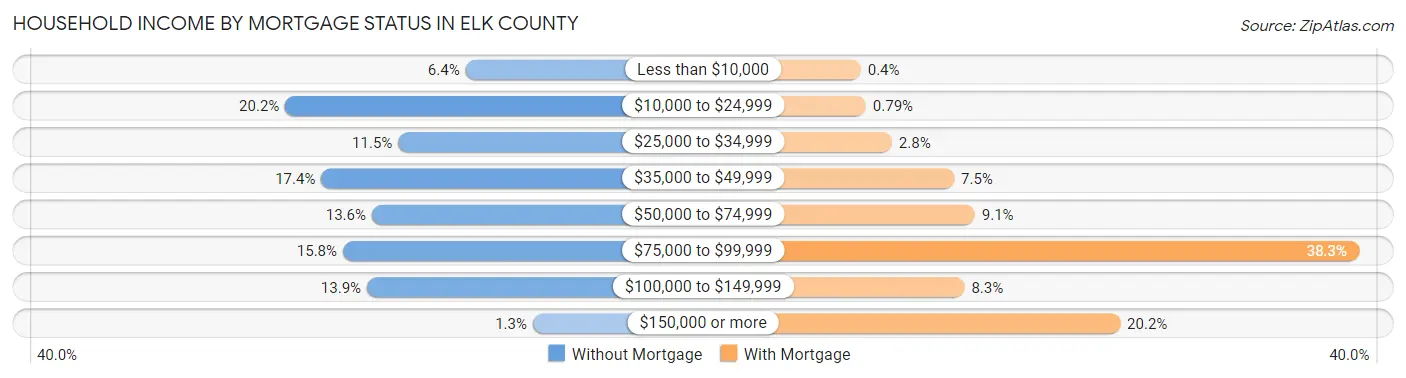
| Household Income | Without Mortgage | With Mortgage |
| Less than $10,000 | 35 (6.4%) | 1 (0.4%) |
| $10,000 to $24,999 | 110 (20.2%) | 2 (0.8%) |
| $25,000 to $34,999 | 63 (11.5%) | 7 (2.8%) |
| $35,000 to $49,999 | 95 (17.4%) | 19 (7.5%) |
| $50,000 to $74,999 | 74 (13.6%) | 23 (9.1%) |
| $75,000 to $99,999 | 86 (15.8%) | 97 (38.3%) |
| $100,000 to $149,999 | 76 (13.9%) | 21 (8.3%) |
| $150,000 or more | 7 (1.3%) | 51 (20.2%) |
| Total | 546 (100.0%) | 253 (100.0%) |
Property Value to Household Income Ratio in Elk County
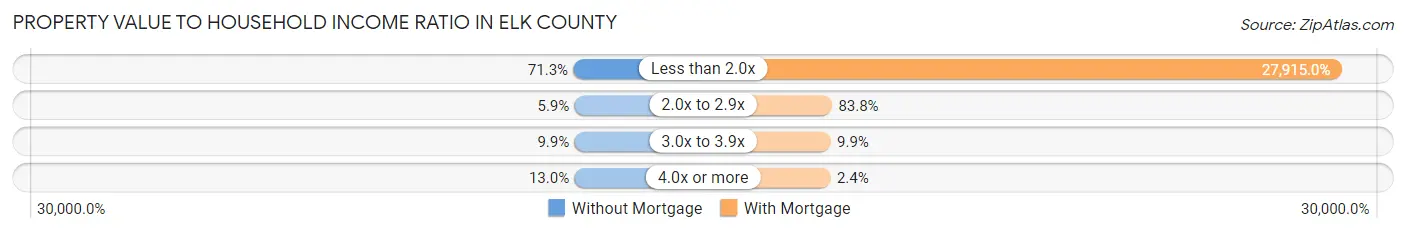
| Value-to-Income Ratio | Without Mortgage | With Mortgage |
| Less than 2.0x | 389 (71.3%) | 70,625 (27,915.0%) |
| 2.0x to 2.9x | 32 (5.9%) | 212 (83.8%) |
| 3.0x to 3.9x | 54 (9.9%) | 25 (9.9%) |
| 4.0x or more | 71 (13.0%) | 6 (2.4%) |
| Total | 546 (100.0%) | 253 (100.0%) |
Real Estate Taxes by Mortgage Status in Elk County

| Property Taxes | Without Mortgage | With Mortgage |
| Less than $800 | 221 (40.5%) | 0 (0.0%) |
| $800 to $1,499 | 74 (13.6%) | 85 (33.6%) |
| $800 to $1,499 | 218 (39.9%) | 45 (17.8%) |
| Total | 546 (100.0%) | 253 (100.0%) |
Health & Disability in Elk County
Health Insurance Coverage by Age in Elk County
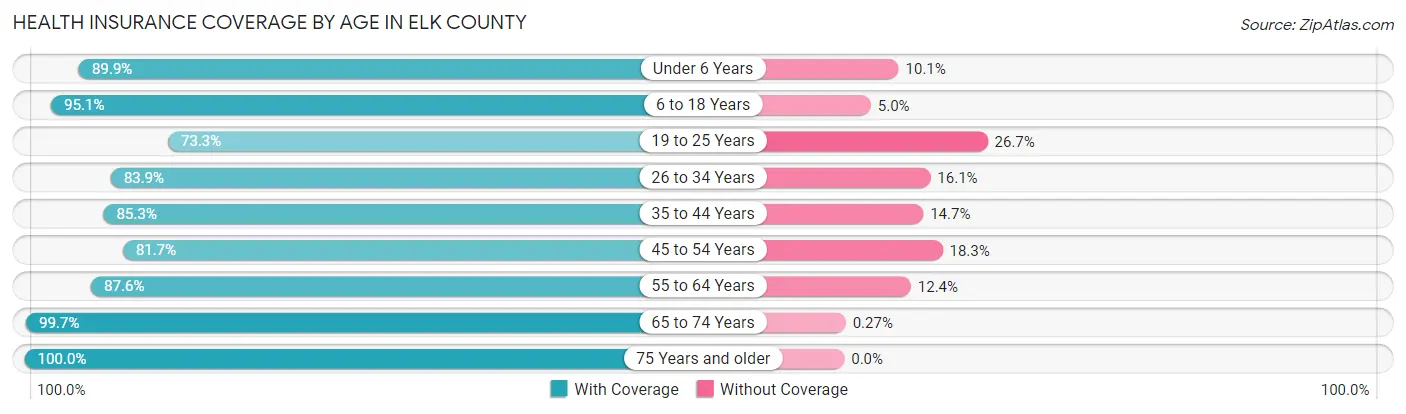
| Age Bracket | With Coverage | Without Coverage |
| Under 6 Years | 142 (89.9%) | 16 (10.1%) |
| 6 to 18 Years | 384 (95.1%) | 20 (5.0%) |
| 19 to 25 Years | 85 (73.3%) | 31 (26.7%) |
| 26 to 34 Years | 162 (83.9%) | 31 (16.1%) |
| 35 to 44 Years | 168 (85.3%) | 29 (14.7%) |
| 45 to 54 Years | 223 (81.7%) | 50 (18.3%) |
| 55 to 64 Years | 374 (87.6%) | 53 (12.4%) |
| 65 to 74 Years | 363 (99.7%) | 1 (0.3%) |
| 75 Years and older | 311 (100.0%) | 0 (0.0%) |
| Total | 2,212 (90.5%) | 231 (9.5%) |
Health Insurance Coverage by Citizenship Status in Elk County

| Citizenship Status | With Coverage | Without Coverage |
| Native Born | 142 (89.9%) | 16 (10.1%) |
| Foreign Born, Citizen | 384 (95.1%) | 20 (5.0%) |
| Foreign Born, not a Citizen | 85 (73.3%) | 31 (26.7%) |
Health Insurance Coverage by Household Income in Elk County
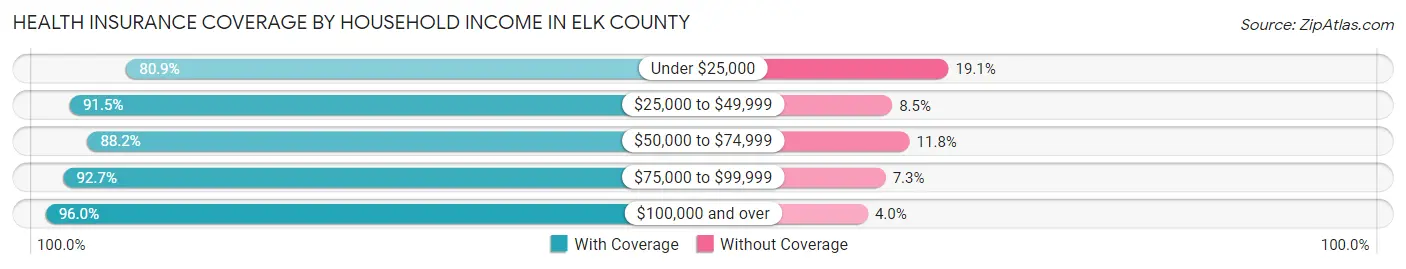
| Household Income | With Coverage | Without Coverage |
| Under $25,000 | 314 (80.9%) | 74 (19.1%) |
| $25,000 to $49,999 | 570 (91.5%) | 53 (8.5%) |
| $50,000 to $74,999 | 412 (88.2%) | 55 (11.8%) |
| $75,000 to $99,999 | 305 (92.7%) | 24 (7.3%) |
| $100,000 and over | 604 (96.0%) | 25 (4.0%) |
Public vs Private Health Insurance Coverage by Age in Elk County
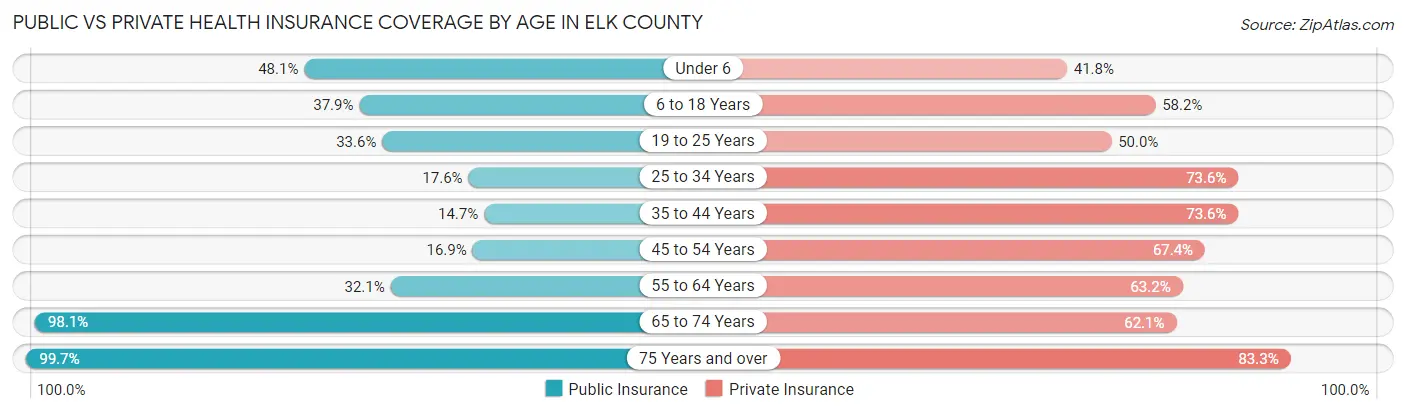
| Age Bracket | Public Insurance | Private Insurance |
| Under 6 | 76 (48.1%) | 66 (41.8%) |
| 6 to 18 Years | 153 (37.9%) | 235 (58.2%) |
| 19 to 25 Years | 39 (33.6%) | 58 (50.0%) |
| 25 to 34 Years | 34 (17.6%) | 142 (73.6%) |
| 35 to 44 Years | 29 (14.7%) | 145 (73.6%) |
| 45 to 54 Years | 46 (16.9%) | 184 (67.4%) |
| 55 to 64 Years | 137 (32.1%) | 270 (63.2%) |
| 65 to 74 Years | 357 (98.1%) | 226 (62.1%) |
| 75 Years and over | 310 (99.7%) | 259 (83.3%) |
| Total | 1,181 (48.3%) | 1,585 (64.9%) |
Disability Status by Sex by Age in Elk County

| Age Bracket | Male | Female |
| Under 5 Years | 0 (0.0%) | 0 (0.0%) |
| 5 to 17 Years | 18 (7.7%) | 14 (6.7%) |
| 18 to 34 Years | 14 (8.9%) | 31 (19.8%) |
| 35 to 64 Years | 110 (24.5%) | 129 (28.8%) |
| 65 to 74 Years | 39 (21.3%) | 39 (21.5%) |
| 75 Years and over | 96 (65.3%) | 98 (59.8%) |
Disability Class by Sex by Age in Elk County
Disability Class: Hearing Difficulty
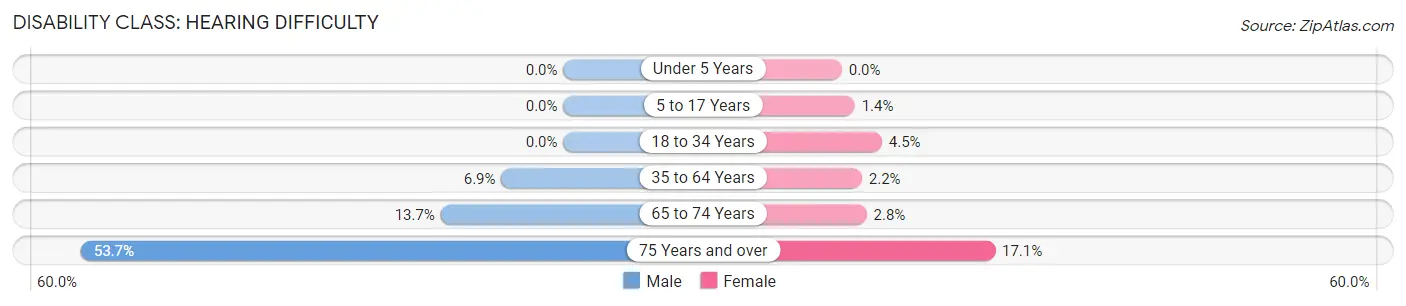
| Age Bracket | Male | Female |
| Under 5 Years | 0 (0.0%) | 0 (0.0%) |
| 5 to 17 Years | 0 (0.0%) | 3 (1.4%) |
| 18 to 34 Years | 0 (0.0%) | 7 (4.5%) |
| 35 to 64 Years | 31 (6.9%) | 10 (2.2%) |
| 65 to 74 Years | 25 (13.7%) | 5 (2.8%) |
| 75 Years and over | 79 (53.7%) | 28 (17.1%) |
Disability Class: Vision Difficulty
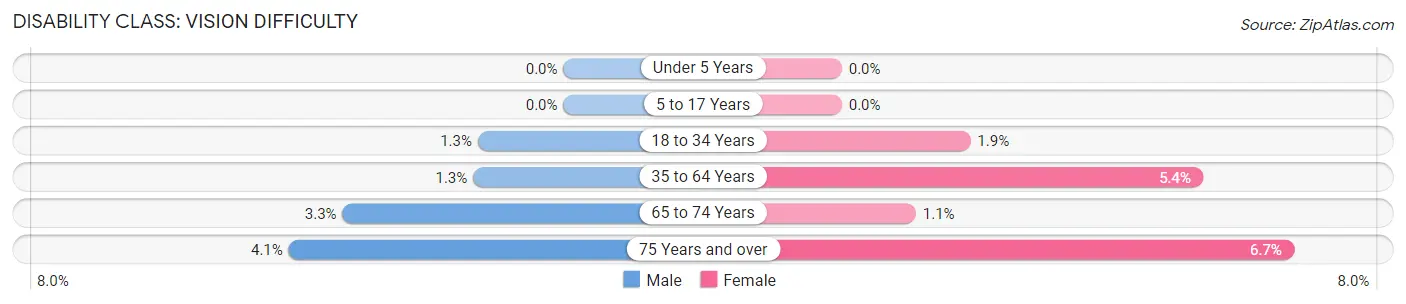
| Age Bracket | Male | Female |
| Under 5 Years | 0 (0.0%) | 0 (0.0%) |
| 5 to 17 Years | 0 (0.0%) | 0 (0.0%) |
| 18 to 34 Years | 2 (1.3%) | 3 (1.9%) |
| 35 to 64 Years | 6 (1.3%) | 24 (5.4%) |
| 65 to 74 Years | 6 (3.3%) | 2 (1.1%) |
| 75 Years and over | 6 (4.1%) | 11 (6.7%) |
Disability Class: Cognitive Difficulty
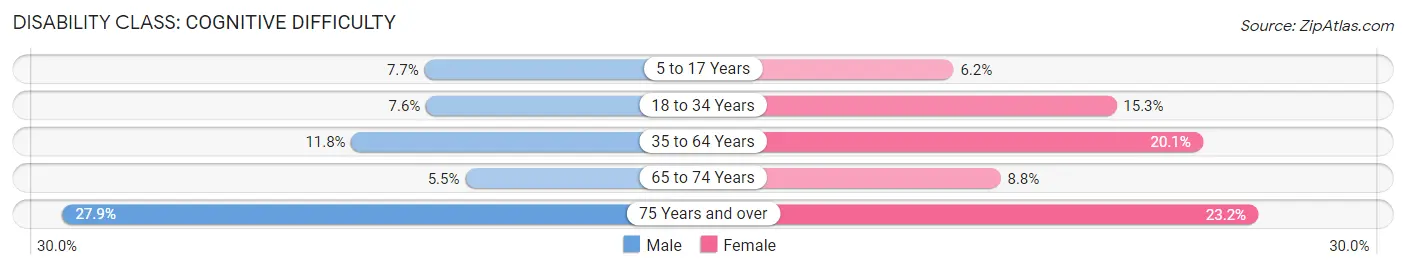
| Age Bracket | Male | Female |
| 5 to 17 Years | 18 (7.7%) | 13 (6.2%) |
| 18 to 34 Years | 12 (7.6%) | 24 (15.3%) |
| 35 to 64 Years | 53 (11.8%) | 90 (20.1%) |
| 65 to 74 Years | 10 (5.5%) | 16 (8.8%) |
| 75 Years and over | 41 (27.9%) | 38 (23.2%) |
Disability Class: Ambulatory Difficulty
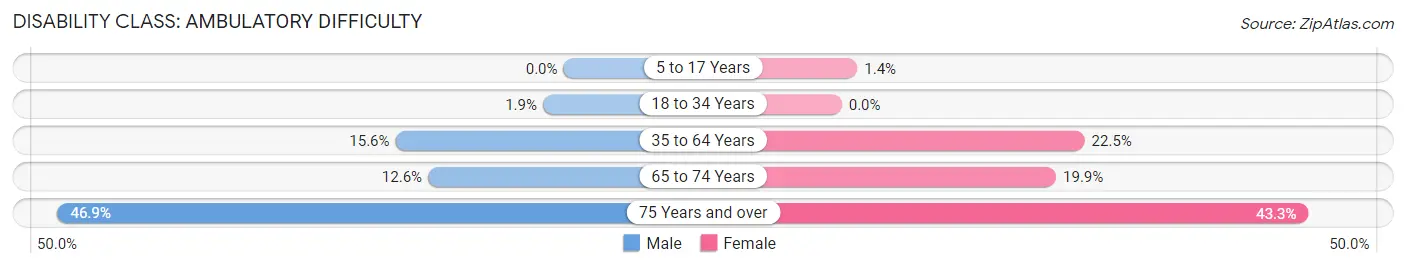
| Age Bracket | Male | Female |
| 5 to 17 Years | 0 (0.0%) | 3 (1.4%) |
| 18 to 34 Years | 3 (1.9%) | 0 (0.0%) |
| 35 to 64 Years | 70 (15.6%) | 101 (22.5%) |
| 65 to 74 Years | 23 (12.6%) | 36 (19.9%) |
| 75 Years and over | 69 (46.9%) | 71 (43.3%) |
Disability Class: Self-Care Difficulty
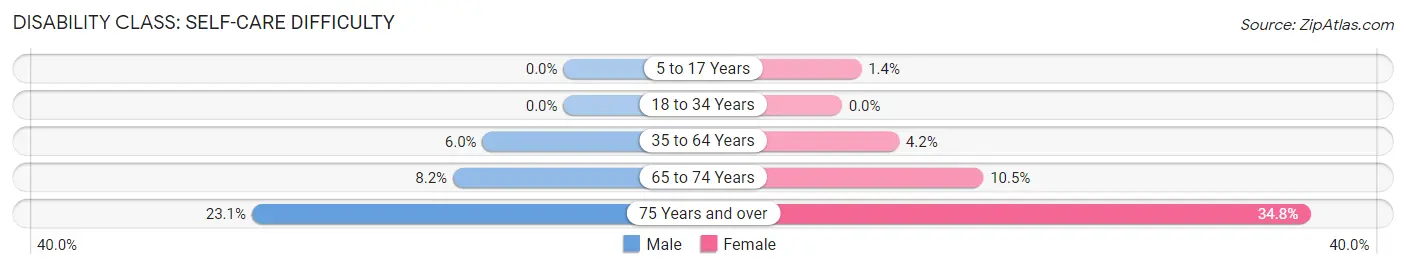
| Age Bracket | Male | Female |
| 5 to 17 Years | 0 (0.0%) | 3 (1.4%) |
| 18 to 34 Years | 0 (0.0%) | 0 (0.0%) |
| 35 to 64 Years | 27 (6.0%) | 19 (4.2%) |
| 65 to 74 Years | 15 (8.2%) | 19 (10.5%) |
| 75 Years and over | 34 (23.1%) | 57 (34.8%) |
Technology Access in Elk County
Computing Device Access in Elk County
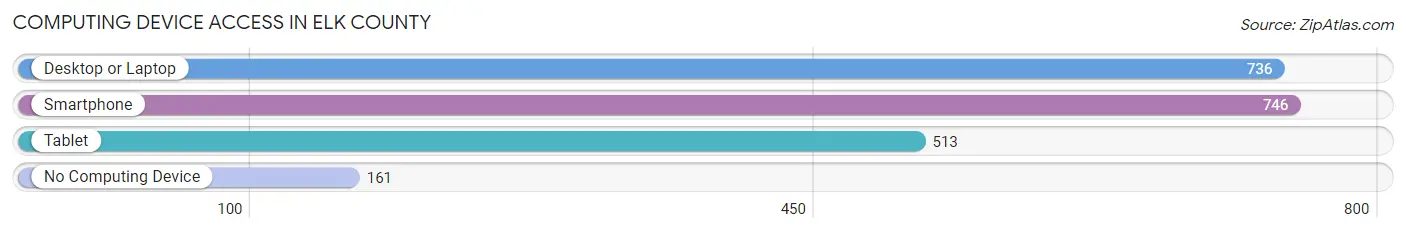
| Device Type | # Households | % Households |
| Desktop or Laptop | 736 | 71.6% |
| Smartphone | 746 | 72.6% |
| Tablet | 513 | 49.9% |
| No Computing Device | 161 | 15.7% |
| Total | 1,028 | 100.0% |
Internet Access in Elk County
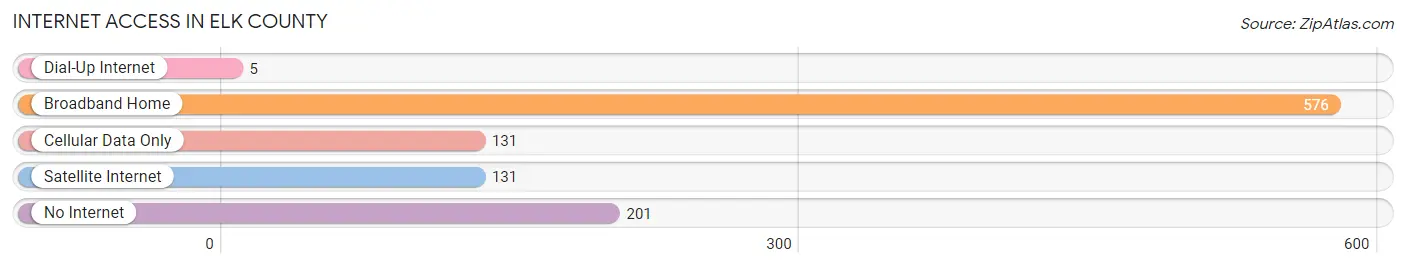
| Internet Type | # Households | % Households |
| Dial-Up Internet | 5 | 0.5% |
| Broadband Home | 576 | 56.0% |
| Cellular Data Only | 131 | 12.7% |
| Satellite Internet | 131 | 12.7% |
| No Internet | 201 | 19.6% |
| Total | 1,028 | 100.0% |
Elk County Summary
Elk County, Kansas is located in the southeastern corner of the state and is bordered by Greenwood County to the north, Chautauqua County to the east, Montgomery County to the south, and Wilson County to the west. The county seat is Howard, and the largest city is Moline. The county was established in 1875 and named for the elk that once roamed the area.
Geography
Elk County covers an area of 576 square miles and is located in the Osage Plains region of Kansas. The county is mostly flat with rolling hills and is drained by the Elk River and its tributaries. The highest point in the county is located in the northwest corner at 1,400 feet above sea level. The county is mostly covered in grassland, with some areas of woodland.
Demographics
As of the 2010 census, Elk County had a population of 2,582. The racial makeup of the county was 95.3% White, 0.7% Black or African American, 0.7% Native American, 0.2% Asian, 0.1% Pacific Islander, 1.7% from other races, and 1.3% from two or more races. Hispanic or Latino of any race were 3.2% of the population.
The median income for a household in the county was $37,917 and the median income for a family was $45,000. The per capita income for the county was $17,945. About 11.2% of families and 14.2% of the population were below the poverty line, including 17.2% of those under age 18 and 10.2% of those age 65 or over.
Economy
The economy of Elk County is largely based on agriculture. The county is home to several large farms that produce corn, wheat, soybeans, and other crops. Cattle and hog farming are also important to the local economy.
In addition to agriculture, Elk County is home to several small businesses, including a few restaurants, a grocery store, and a few retail stores. The county also has a few manufacturing companies that produce a variety of products, including furniture, clothing, and automotive parts.
The county is served by two airports, the Howard Municipal Airport and the Moline Municipal Airport. The county is also served by several highways, including US-54, US-160, and US-166.
Conclusion
Elk County, Kansas is a rural county located in the southeastern corner of the state. The county is mostly flat with rolling hills and is mostly covered in grassland. The county has a population of 2,582 and the economy is largely based on agriculture. The county is served by two airports and several highways, and is home to several small businesses.
Common Questions
What is Per Capita Income in Elk County?
Per Capita income in Elk County is $28,159.
What is the Median Family Income in Elk County?
Median Family Income in Elk County is $65,701.
What is the Median Household income in Elk County?
Median Household Income in Elk County is $50,000.
What is Income or Wage Gap in Elk County?
Income or Wage Gap in Elk County is 44.5%.
Women in Elk County earn 55.5 cents for every dollar earned by a man.
What is Inequality or Gini Index in Elk County?
Inequality or Gini Index in Elk County is 0.44.
What is the Total Population of Elk County?
Total Population of Elk County is 2,453.
What is the Total Male Population of Elk County?
Total Male Population of Elk County is 1,245.
What is the Total Female Population of Elk County?
Total Female Population of Elk County is 1,208.
What is the Ratio of Males per 100 Females in Elk County?
There are 103.06 Males per 100 Females in Elk County.
What is the Ratio of Females per 100 Males in Elk County?
There are 97.03 Females per 100 Males in Elk County.
What is the Median Population Age in Elk County?
Median Population Age in Elk County is 50.4 Years.
What is the Average Family Size in Elk County
Average Family Size in Elk County is 3.0 People.
What is the Average Household Size in Elk County
Average Household Size in Elk County is 2.4 People.
How Large is the Labor Force in Elk County?
There are 993 People in the Labor Forcein in Elk County.
What is the Percentage of People in the Labor Force in Elk County?
50.2% of People are in the Labor Force in Elk County.
What is the Unemployment Rate in Elk County?
Unemployment Rate in Elk County is 3.8%.