Edwards County, KS Map & Demographics
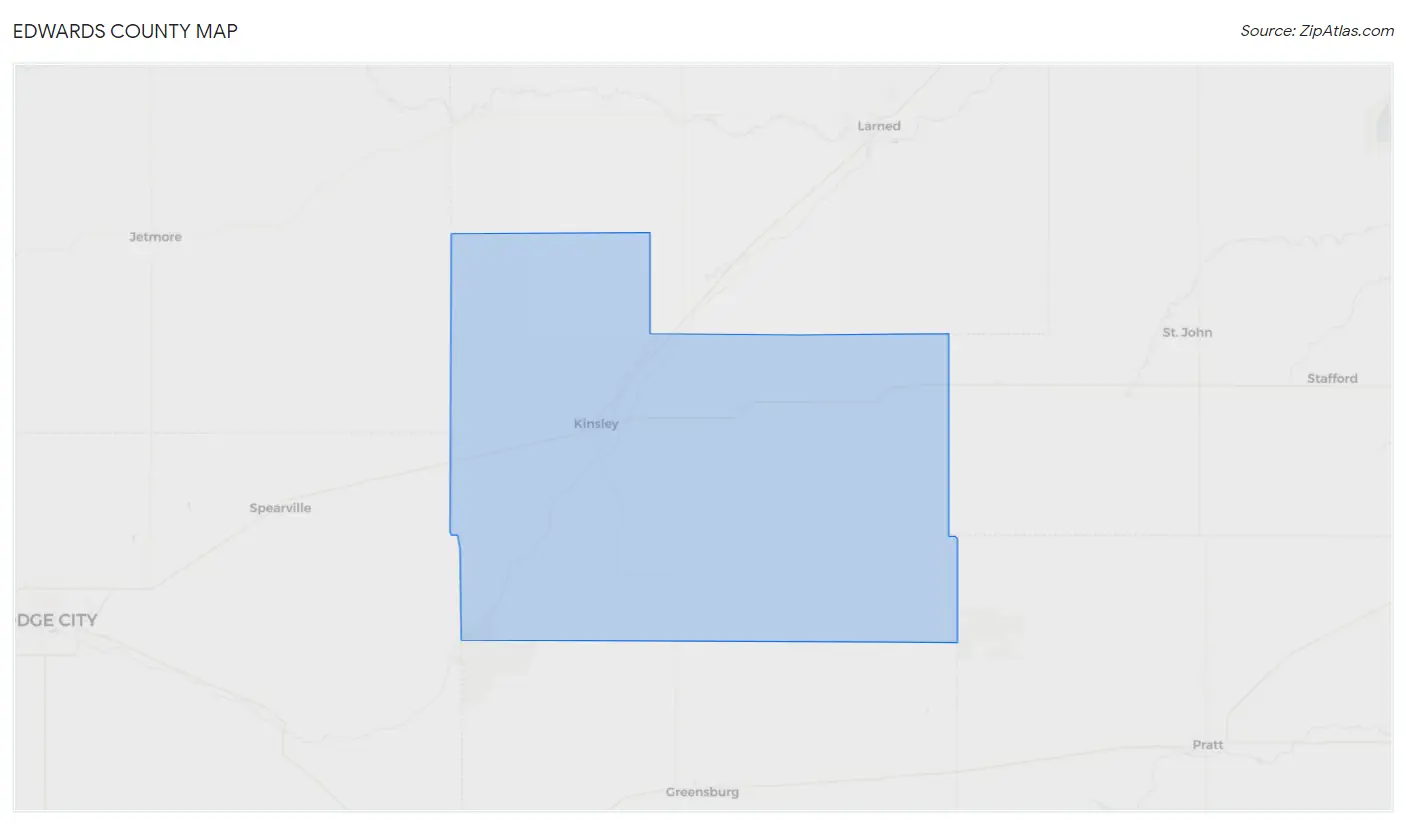
Edwards County Map
Edwards County Overview
$31,368
PER CAPITA INCOME
$76,989
AVG FAMILY INCOME
$52,750
AVG HOUSEHOLD INCOME
32.8%
WAGE / INCOME GAP [ % ]
67.2¢/ $1
WAGE / INCOME GAP [ $ ]
0.42
INEQUALITY / GINI INDEX
2,849
TOTAL POPULATION
1,404
MALE POPULATION
1,445
FEMALE POPULATION
97.16
MALES / 100 FEMALES
102.92
FEMALES / 100 MALES
43.8
MEDIAN AGE
2.9
AVG FAMILY SIZE
2.3
AVG HOUSEHOLD SIZE
1,415
LABOR FORCE [ PEOPLE ]
62.2%
PERCENT IN LABOR FORCE
3.9%
UNEMPLOYMENT RATE
Edwards County Area Codes
Income in Edwards County
Income Overview in Edwards County
Per Capita Income in Edwards County is $31,368, while median incomes of families and households are $76,989 and $52,750 respectively.
| Characteristic | Number | Measure |
| Per Capita Income | 2,849 | $31,368 |
| Median Family Income | 755 | $76,989 |
| Mean Family Income | 755 | $90,615 |
| Median Household Income | 1,225 | $52,750 |
| Mean Household Income | 1,225 | $70,588 |
| Income Deficit | 755 | $0 |
| Wage / Income Gap (%) | 2,849 | 32.78% |
| Wage / Income Gap ($) | 2,849 | 67.22¢ per $1 |
| Gini / Inequality Index | 2,849 | 0.42 |
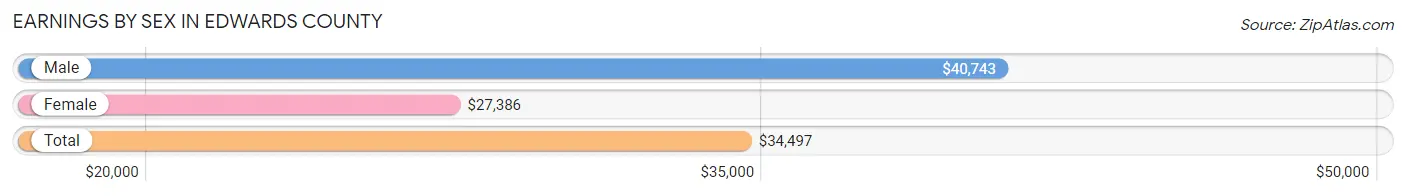
Earnings by Sex in Edwards County
Average Earnings in Edwards County are $34,497, $40,743 for men and $27,386 for women, a difference of 32.8%.
| Sex | Number | Average Earnings |
| Male | 822 (55.0%) | $40,743 |
| Female | 673 (45.0%) | $27,386 |
| Total | 1,495 (100.0%) | $34,497 |
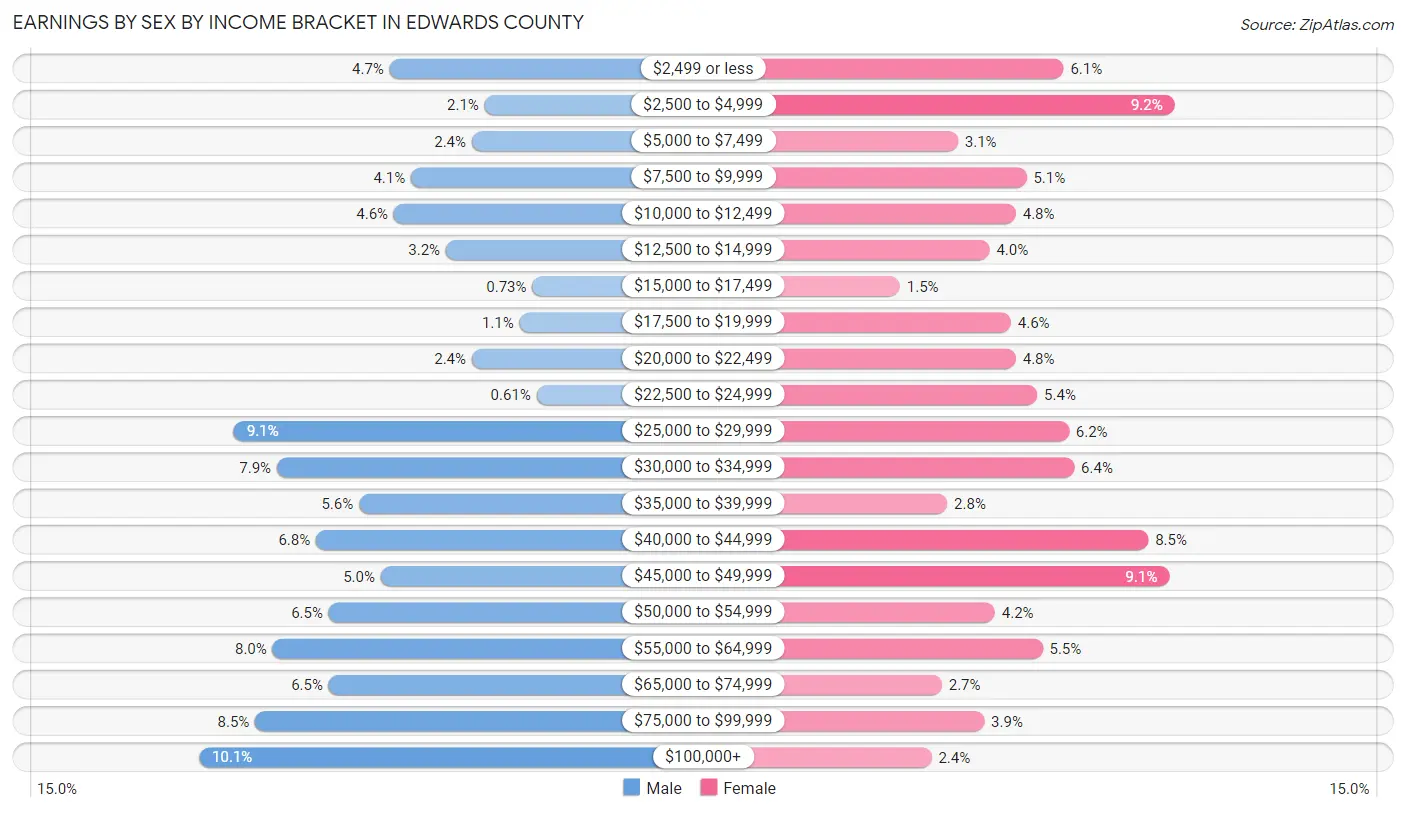
Earnings by Sex by Income Bracket in Edwards County
The most common earnings brackets in Edwards County are $100,000+ for men (83 | 10.1%) and $2,500 to $4,999 for women (62 | 9.2%).
| Income | Male | Female |
| $2,499 or less | 39 (4.7%) | 41 (6.1%) |
| $2,500 to $4,999 | 17 (2.1%) | 62 (9.2%) |
| $5,000 to $7,499 | 20 (2.4%) | 21 (3.1%) |
| $7,500 to $9,999 | 34 (4.1%) | 34 (5.1%) |
| $10,000 to $12,499 | 38 (4.6%) | 32 (4.8%) |
| $12,500 to $14,999 | 26 (3.2%) | 27 (4.0%) |
| $15,000 to $17,499 | 6 (0.7%) | 10 (1.5%) |
| $17,500 to $19,999 | 9 (1.1%) | 31 (4.6%) |
| $20,000 to $22,499 | 20 (2.4%) | 32 (4.8%) |
| $22,500 to $24,999 | 5 (0.6%) | 36 (5.3%) |
| $25,000 to $29,999 | 75 (9.1%) | 42 (6.2%) |
| $30,000 to $34,999 | 65 (7.9%) | 43 (6.4%) |
| $35,000 to $39,999 | 46 (5.6%) | 19 (2.8%) |
| $40,000 to $44,999 | 56 (6.8%) | 57 (8.5%) |
| $45,000 to $49,999 | 41 (5.0%) | 61 (9.1%) |
| $50,000 to $54,999 | 53 (6.5%) | 28 (4.2%) |
| $55,000 to $64,999 | 66 (8.0%) | 37 (5.5%) |
| $65,000 to $74,999 | 53 (6.5%) | 18 (2.7%) |
| $75,000 to $99,999 | 70 (8.5%) | 26 (3.9%) |
| $100,000+ | 83 (10.1%) | 16 (2.4%) |
| Total | 822 (100.0%) | 673 (100.0%) |
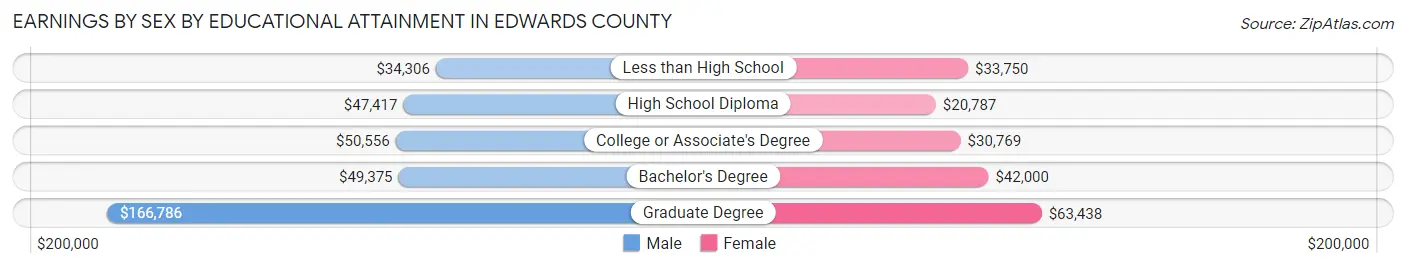
Earnings by Sex by Educational Attainment in Edwards County
Average earnings in Edwards County are $45,500 for men and $28,750 for women, a difference of 36.8%. Men with an educational attainment of graduate degree enjoy the highest average annual earnings of $166,786, while those with less than high school education earn the least with $34,306. Women with an educational attainment of graduate degree earn the most with the average annual earnings of $63,438, while those with high school diploma education have the smallest earnings of $20,787.
| Educational Attainment | Male Income | Female Income |
| Less than High School | $34,306 | $33,750 |
| High School Diploma | $47,417 | $20,787 |
| College or Associate's Degree | $50,556 | $30,769 |
| Bachelor's Degree | $49,375 | $42,000 |
| Graduate Degree | $166,786 | $63,438 |
| Total | $45,500 | $28,750 |
Family Income in Edwards County
Family Income Brackets in Edwards County
According to the Edwards County family income data, there are 167 families falling into the $50,000 to $74,999 income range, which is the most common income bracket and makes up 22.1% of all families.
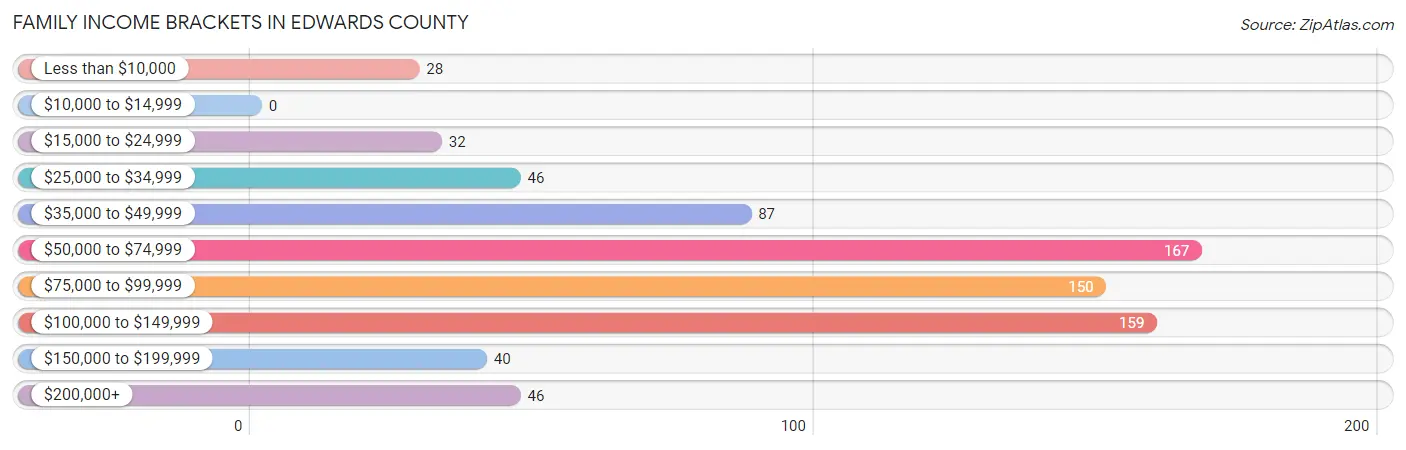
| Income Bracket | # Families | % Families |
| Less than $10,000 | 28 | 3.7% |
| $10,000 to $14,999 | 0 | 0.0% |
| $15,000 to $24,999 | 32 | 4.2% |
| $25,000 to $34,999 | 46 | 6.1% |
| $35,000 to $49,999 | 87 | 11.5% |
| $50,000 to $74,999 | 167 | 22.1% |
| $75,000 to $99,999 | 150 | 19.9% |
| $100,000 to $149,999 | 159 | 21.1% |
| $150,000 to $199,999 | 40 | 5.3% |
| $200,000+ | 46 | 6.1% |
Family Income by Famaliy Size in Edwards County
2-person families (422 | 55.9%) account for the highest median family income in Edwards County with $92,969 per family, while 2-person families (422 | 55.9%) have the highest median income of $46,484 per family member.
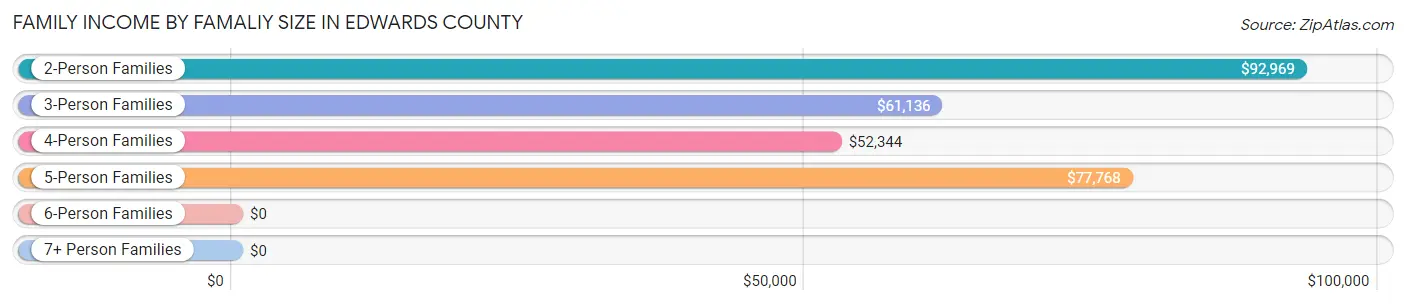
| Income Bracket | # Families | Median Income |
| 2-Person Families | 422 (55.9%) | $92,969 |
| 3-Person Families | 152 (20.1%) | $61,136 |
| 4-Person Families | 129 (17.1%) | $52,344 |
| 5-Person Families | 51 (6.8%) | $77,768 |
| 6-Person Families | 1 (0.1%) | $0 |
| 7+ Person Families | 0 (0.0%) | $0 |
| Total | 755 (100.0%) | $76,989 |
Family Income by Number of Earners in Edwards County
The median family income in Edwards County is $76,989, with families comprising no earners (99) having the highest median family income of $107,775, while families with 1 earner (278) have the lowest median family income of $60,000, accounting for 13.1% and 36.8% of families, respectively.
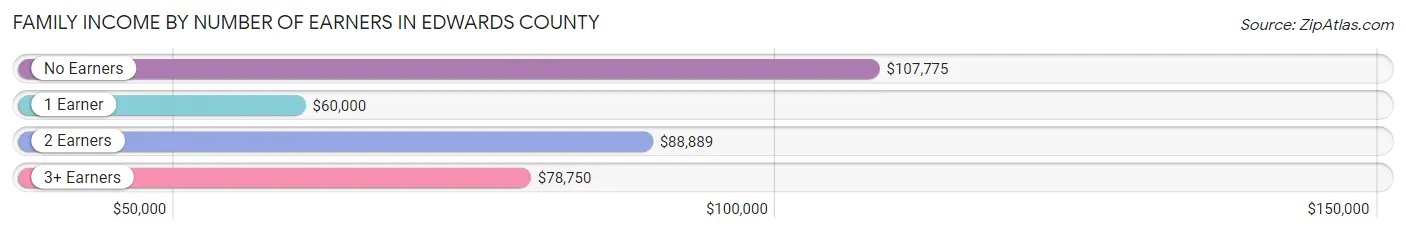
| Number of Earners | # Families | Median Income |
| No Earners | 99 (13.1%) | $107,775 |
| 1 Earner | 278 (36.8%) | $60,000 |
| 2 Earners | 340 (45.0%) | $88,889 |
| 3+ Earners | 38 (5.0%) | $78,750 |
| Total | 755 (100.0%) | $76,989 |
Household Income in Edwards County
Household Income Brackets in Edwards County
With 216 households falling in the category, the $35,000 to $49,999 income range is the most frequent in Edwards County, accounting for 17.6% of all households. In contrast, only 40 households (3.3%) fall into the $150,000 to $199,999 income bracket, making it the least populous group.
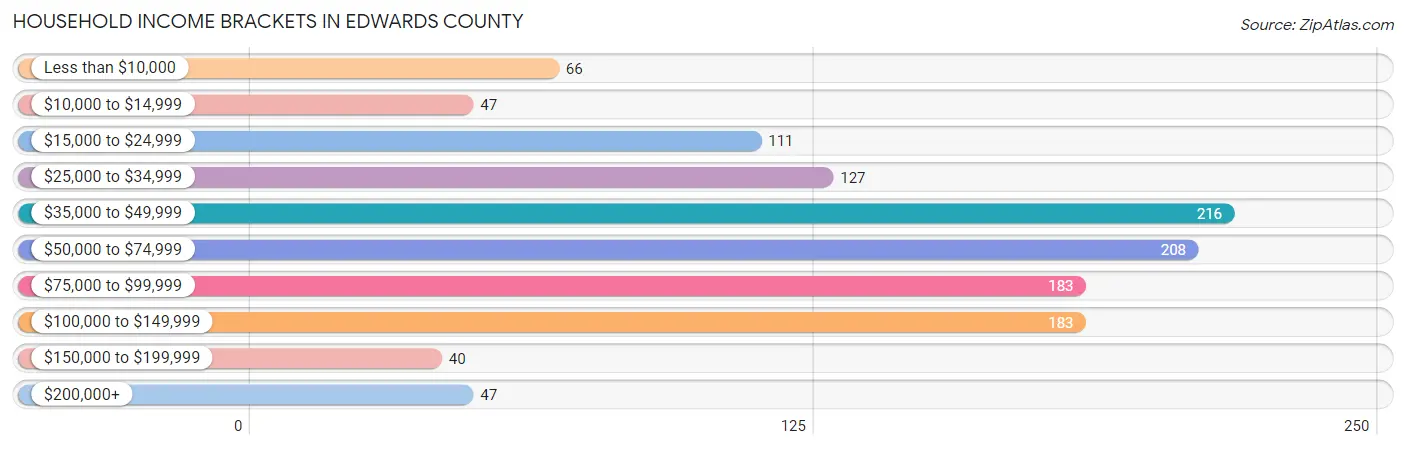
| Income Bracket | # Households | % Households |
| Less than $10,000 | 66 | 5.4% |
| $10,000 to $14,999 | 47 | 3.8% |
| $15,000 to $24,999 | 111 | 9.1% |
| $25,000 to $34,999 | 127 | 10.4% |
| $35,000 to $49,999 | 216 | 17.6% |
| $50,000 to $74,999 | 208 | 17.0% |
| $75,000 to $99,999 | 183 | 14.9% |
| $100,000 to $149,999 | 183 | 14.9% |
| $150,000 to $199,999 | 40 | 3.3% |
| $200,000+ | 47 | 3.8% |
Household Income by Householder Age in Edwards County
The median household income in Edwards County is $52,750, with the highest median household income of $60,547 found in the 25 to 44 years age bracket for the primary householder. A total of 339 households (27.7%) fall into this category. Meanwhile, the 15 to 24 years age bracket for the primary householder has the lowest median household income of $21,750, with 35 households (2.9%) in this group.
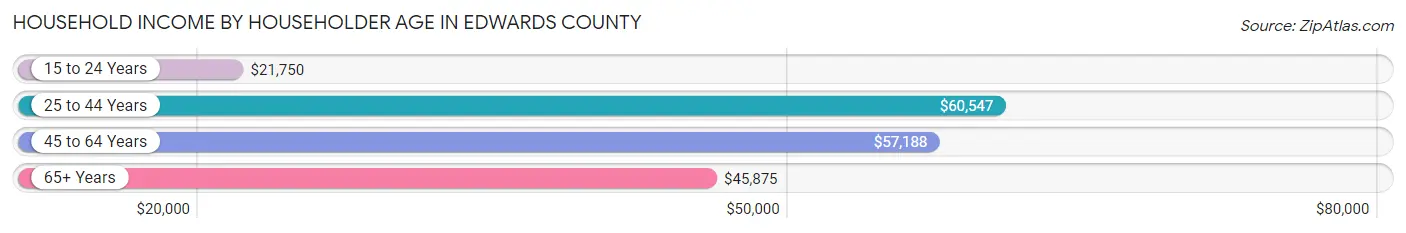
| Income Bracket | # Households | Median Income |
| 15 to 24 Years | 35 (2.9%) | $21,750 |
| 25 to 44 Years | 339 (27.7%) | $60,547 |
| 45 to 64 Years | 424 (34.6%) | $57,188 |
| 65+ Years | 427 (34.9%) | $45,875 |
| Total | 1,225 (100.0%) | $52,750 |
Poverty in Edwards County
Income Below Poverty by Sex and Age in Edwards County
With 10.3% poverty level for males and 16.7% for females among the residents of Edwards County, 15 year old males and 15 year old females are the most vulnerable to poverty, with 2 males (100.0%) and 7 females (70.0%) in their respective age groups living below the poverty level.
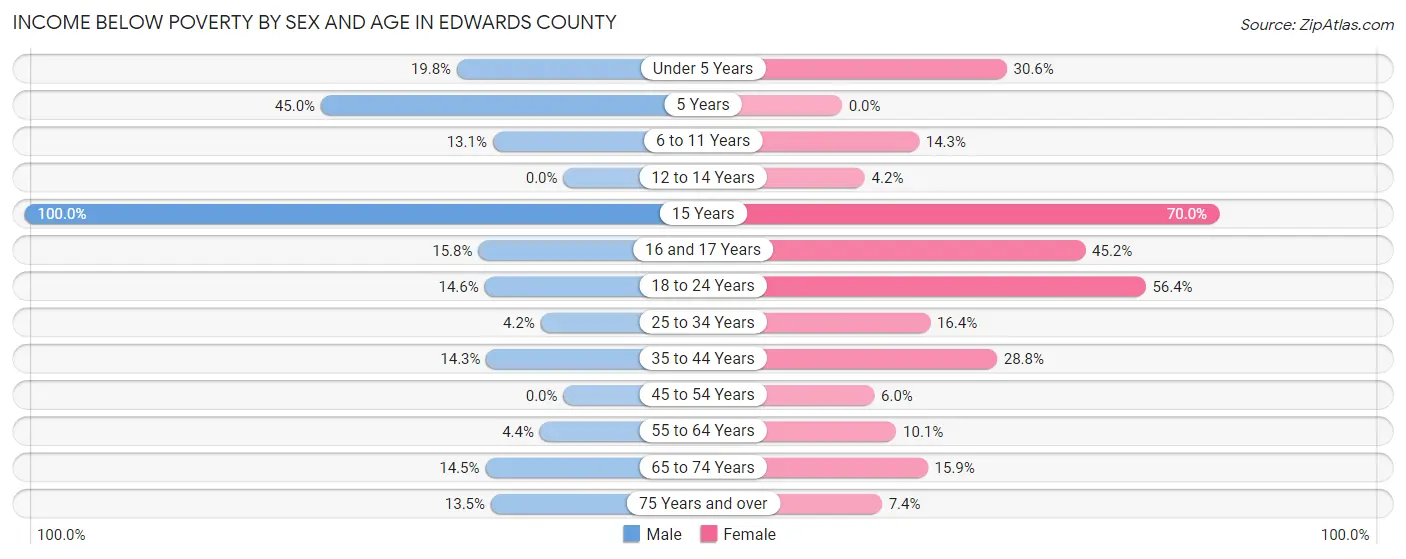
| Age Bracket | Male | Female |
| Under 5 Years | 16 (19.8%) | 26 (30.6%) |
| 5 Years | 9 (45.0%) | 0 (0.0%) |
| 6 to 11 Years | 16 (13.1%) | 13 (14.3%) |
| 12 to 14 Years | 0 (0.0%) | 5 (4.2%) |
| 15 Years | 2 (100.0%) | 7 (70.0%) |
| 16 and 17 Years | 6 (15.8%) | 14 (45.2%) |
| 18 to 24 Years | 12 (14.6%) | 31 (56.4%) |
| 25 to 34 Years | 8 (4.2%) | 28 (16.4%) |
| 35 to 44 Years | 23 (14.3%) | 42 (28.8%) |
| 45 to 54 Years | 0 (0.0%) | 9 (6.0%) |
| 55 to 64 Years | 10 (4.4%) | 25 (10.1%) |
| 65 to 74 Years | 21 (14.5%) | 29 (15.9%) |
| 75 Years and over | 16 (13.5%) | 10 (7.4%) |
| Total | 139 (10.3%) | 239 (16.7%) |
Income Above Poverty by Sex and Age in Edwards County
According to the poverty statistics in Edwards County, males aged 12 to 14 years and females aged 5 years are the age groups that are most secure financially, with 100.0% of males and 100.0% of females in these age groups living above the poverty line.
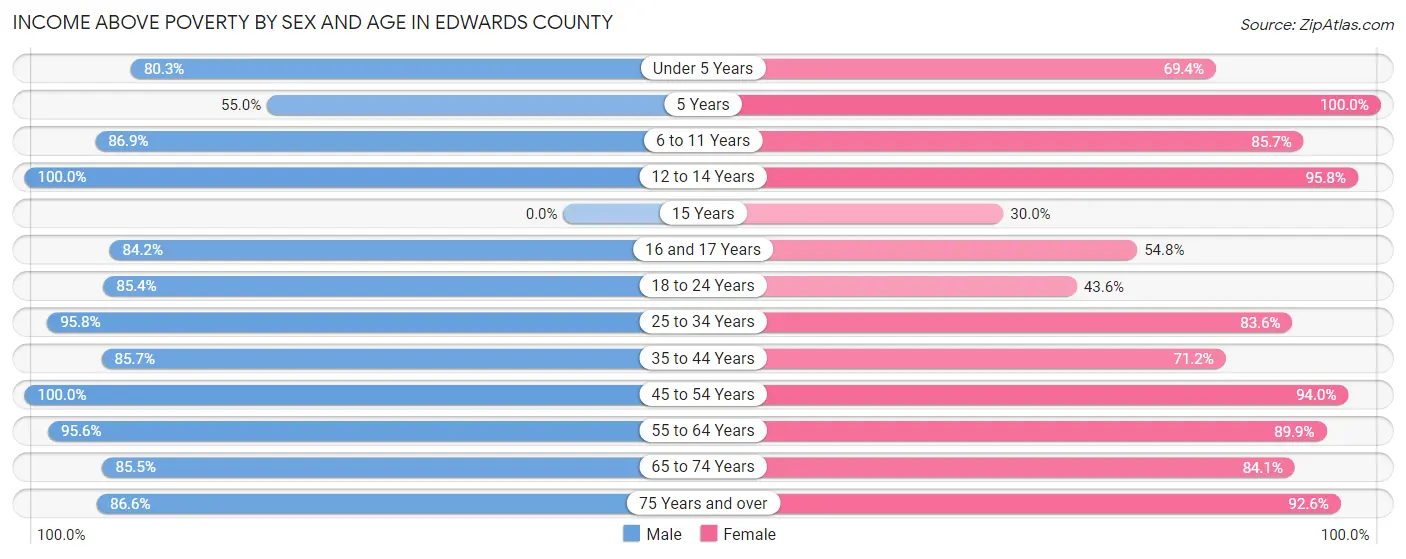
| Age Bracket | Male | Female |
| Under 5 Years | 65 (80.2%) | 59 (69.4%) |
| 5 Years | 11 (55.0%) | 8 (100.0%) |
| 6 to 11 Years | 106 (86.9%) | 78 (85.7%) |
| 12 to 14 Years | 35 (100.0%) | 113 (95.8%) |
| 15 Years | 0 (0.0%) | 3 (30.0%) |
| 16 and 17 Years | 32 (84.2%) | 17 (54.8%) |
| 18 to 24 Years | 70 (85.4%) | 24 (43.6%) |
| 25 to 34 Years | 182 (95.8%) | 143 (83.6%) |
| 35 to 44 Years | 138 (85.7%) | 104 (71.2%) |
| 45 to 54 Years | 123 (100.0%) | 141 (94.0%) |
| 55 to 64 Years | 219 (95.6%) | 223 (89.9%) |
| 65 to 74 Years | 124 (85.5%) | 153 (84.1%) |
| 75 Years and over | 103 (86.6%) | 125 (92.6%) |
| Total | 1,208 (89.7%) | 1,191 (83.3%) |
Income Below Poverty Among Married-Couple Families in Edwards County
The poverty statistics for married-couple families in Edwards County show that 4.7% or 26 of the total 553 families live below the poverty line. Families with 3 or 4 children have the highest poverty rate of 20.5%, comprising of 8 families. On the other hand, families with no children have the lowest poverty rate of 0.8%, which includes 3 families.
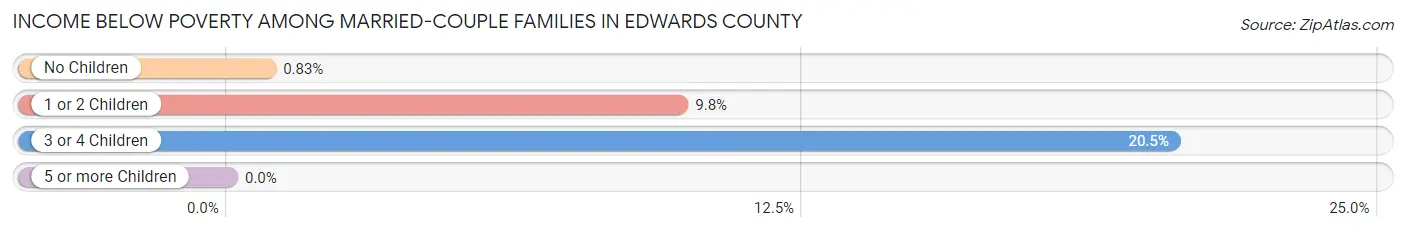
| Children | Above Poverty | Below Poverty |
| No Children | 358 (99.2%) | 3 (0.8%) |
| 1 or 2 Children | 138 (90.2%) | 15 (9.8%) |
| 3 or 4 Children | 31 (79.5%) | 8 (20.5%) |
| 5 or more Children | 0 (0.0%) | 0 (0.0%) |
| Total | 527 (95.3%) | 26 (4.7%) |
Income Below Poverty Among Single-Parent Households in Edwards County
According to the poverty data in Edwards County, 17.9% or 12 single-father households and 24.4% or 33 single-mother households are living below the poverty line. Among single-father households, those with 3 or 4 children have the highest poverty rate, with 3 households (42.9%) experiencing poverty. Likewise, among single-mother households, those with 3 or 4 children have the highest poverty rate, with 9 households (56.2%) falling below the poverty line.
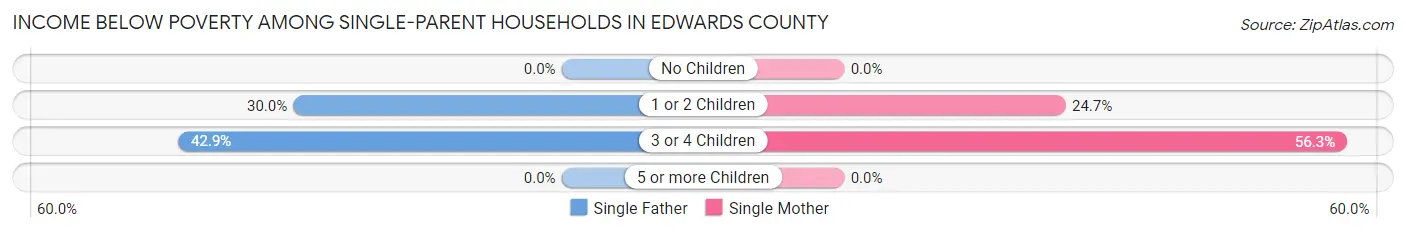
| Children | Single Father | Single Mother |
| No Children | 0 (0.0%) | 0 (0.0%) |
| 1 or 2 Children | 9 (30.0%) | 24 (24.7%) |
| 3 or 4 Children | 3 (42.9%) | 9 (56.2%) |
| 5 or more Children | 0 (0.0%) | 0 (0.0%) |
| Total | 12 (17.9%) | 33 (24.4%) |
Income Below Poverty Among Married-Couple vs Single-Parent Households in Edwards County
The poverty data for Edwards County shows that 26 of the married-couple family households (4.7%) and 45 of the single-parent households (22.3%) are living below the poverty level. Within the married-couple family households, those with 3 or 4 children have the highest poverty rate, with 8 households (20.5%) falling below the poverty line. Among the single-parent households, those with 3 or 4 children have the highest poverty rate, with 12 household (52.2%) living below poverty.
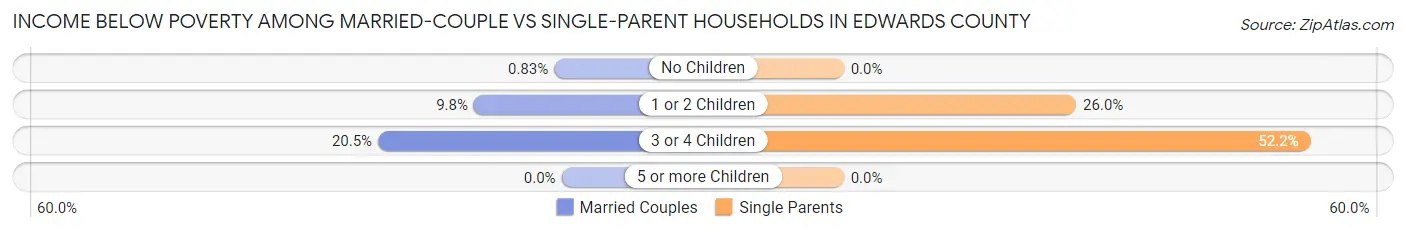
| Children | Married-Couple Families | Single-Parent Households |
| No Children | 3 (0.8%) | 0 (0.0%) |
| 1 or 2 Children | 15 (9.8%) | 33 (26.0%) |
| 3 or 4 Children | 8 (20.5%) | 12 (52.2%) |
| 5 or more Children | 0 (0.0%) | 0 (0.0%) |
| Total | 26 (4.7%) | 45 (22.3%) |
Race in Edwards County
The most populous races in Edwards County are White / Caucasian (2,503 | 87.9%), Hispanic or Latino (610 | 21.4%), and Two or more Races (198 | 7.0%).
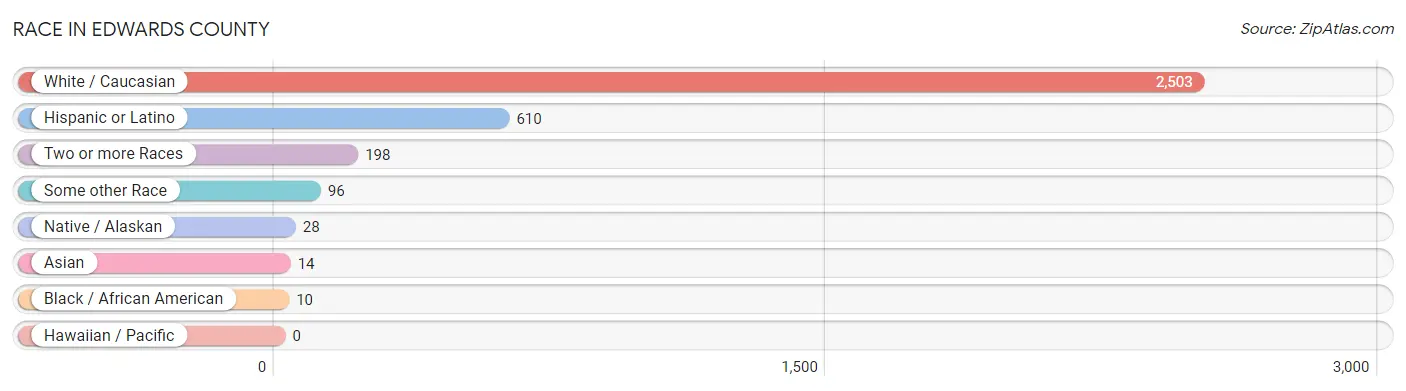
| Race | # Population | % Population |
| Asian | 14 | 0.5% |
| Black / African American | 10 | 0.4% |
| Hawaiian / Pacific | 0 | 0.0% |
| Hispanic or Latino | 610 | 21.4% |
| Native / Alaskan | 28 | 1.0% |
| White / Caucasian | 2,503 | 87.9% |
| Two or more Races | 198 | 7.0% |
| Some other Race | 96 | 3.4% |
| Total | 2,849 | 100.0% |
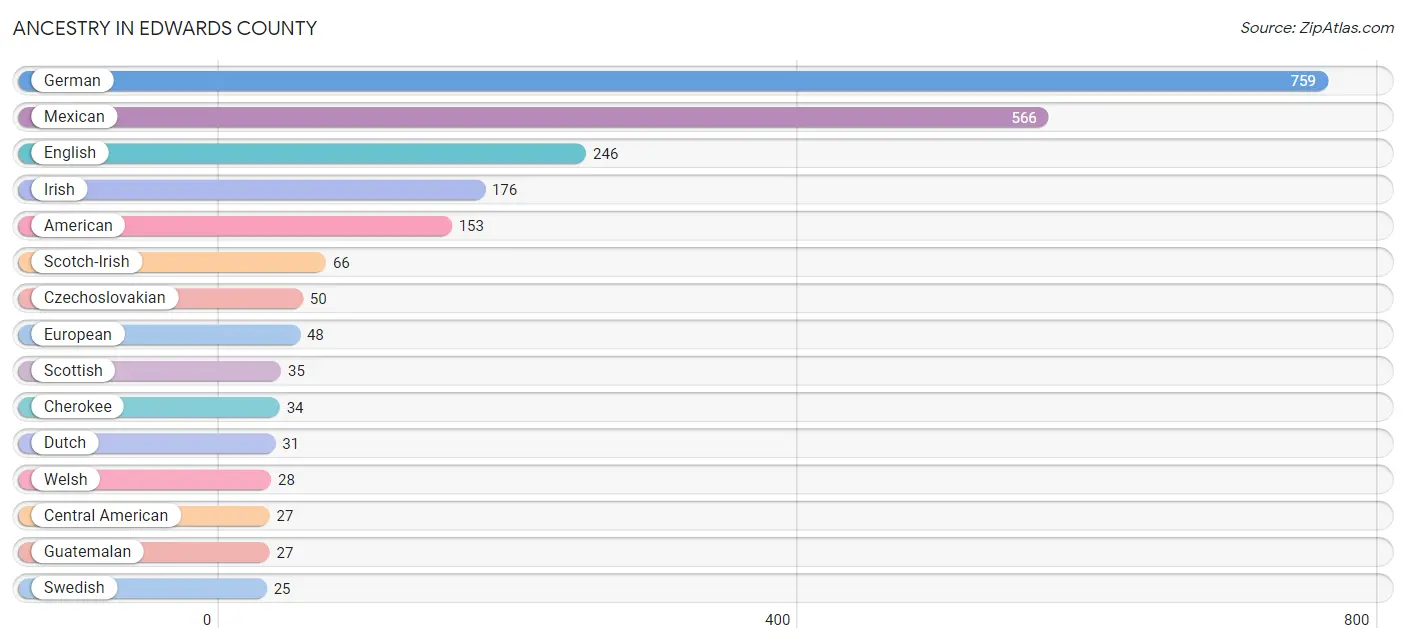
Ancestry in Edwards County
The most populous ancestries reported in Edwards County are German (759 | 26.6%), Mexican (566 | 19.9%), English (246 | 8.6%), Irish (176 | 6.2%), and American (153 | 5.4%), together accounting for 66.7% of all Edwards County residents.
| Ancestry | # Population | % Population |
| African | 1 | 0.0% |
| American | 153 | 5.4% |
| Apache | 7 | 0.3% |
| Arab | 8 | 0.3% |
| Austrian | 7 | 0.3% |
| Blackfeet | 9 | 0.3% |
| British | 15 | 0.5% |
| Central American | 27 | 0.9% |
| Cherokee | 34 | 1.2% |
| Chippewa | 1 | 0.0% |
| Choctaw | 5 | 0.2% |
| Colombian | 12 | 0.4% |
| Comanche | 10 | 0.4% |
| Creek | 11 | 0.4% |
| Czech | 4 | 0.1% |
| Czechoslovakian | 50 | 1.8% |
| Danish | 10 | 0.4% |
| Dutch | 31 | 1.1% |
| English | 246 | 8.6% |
| European | 48 | 1.7% |
| French | 24 | 0.8% |
| German | 759 | 26.6% |
| Guatemalan | 27 | 0.9% |
| Irish | 176 | 6.2% |
| Italian | 5 | 0.2% |
| Kiowa | 10 | 0.4% |
| Korean | 8 | 0.3% |
| Lebanese | 1 | 0.0% |
| Mexican | 566 | 19.9% |
| Norwegian | 1 | 0.0% |
| Pakistani | 5 | 0.2% |
| Polish | 9 | 0.3% |
| Russian | 3 | 0.1% |
| Scotch-Irish | 66 | 2.3% |
| Scottish | 35 | 1.2% |
| South American | 12 | 0.4% |
| Subsaharan African | 1 | 0.0% |
| Swedish | 25 | 0.9% |
| Swiss | 7 | 0.3% |
| Syrian | 7 | 0.3% |
| Thai | 1 | 0.0% |
| Welsh | 28 | 1.0% |
| Yaqui | 10 | 0.4% | View All 43 Rows |
Immigrants in Edwards County
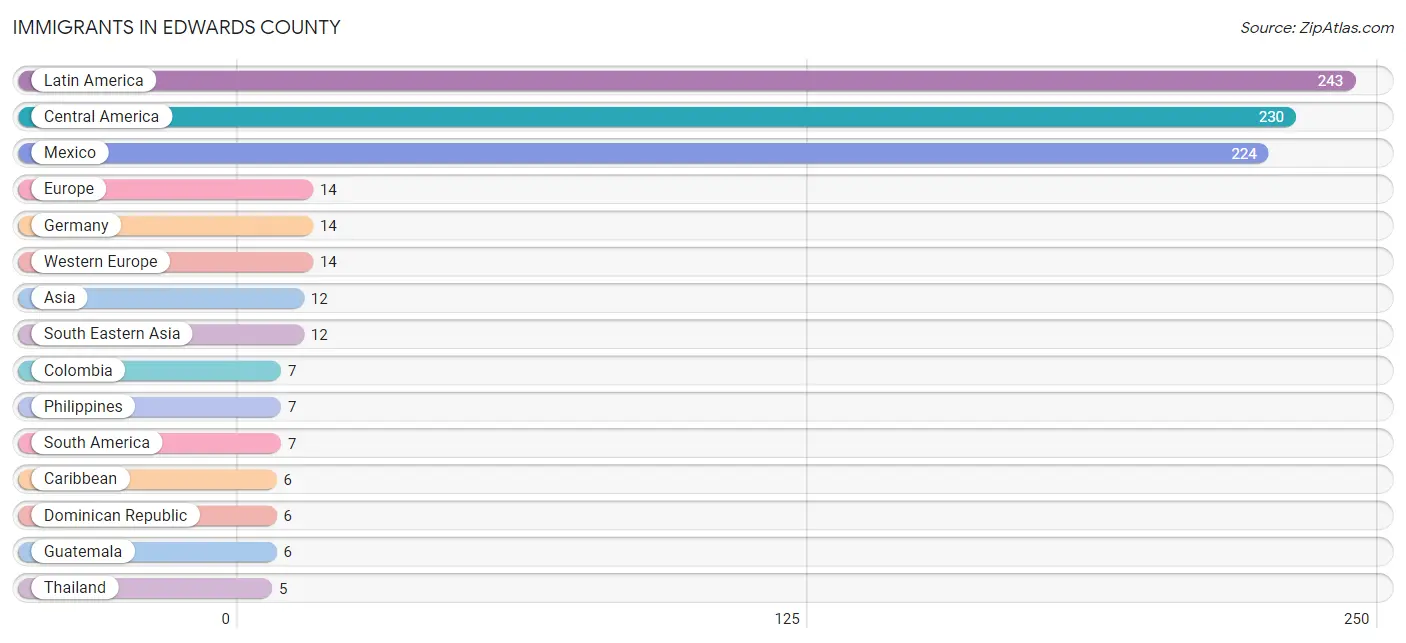
The most numerous immigrant groups reported in Edwards County came from Latin America (243 | 8.5%), Central America (230 | 8.1%), Mexico (224 | 7.9%), Europe (14 | 0.5%), and Germany (14 | 0.5%), together accounting for 25.4% of all Edwards County residents.
| Immigration Origin | # Population | % Population |
| Asia | 12 | 0.4% |
| Caribbean | 6 | 0.2% |
| Central America | 230 | 8.1% |
| Colombia | 7 | 0.3% |
| Dominican Republic | 6 | 0.2% |
| Europe | 14 | 0.5% |
| Germany | 14 | 0.5% |
| Guatemala | 6 | 0.2% |
| Latin America | 243 | 8.5% |
| Mexico | 224 | 7.9% |
| Philippines | 7 | 0.3% |
| South America | 7 | 0.3% |
| South Eastern Asia | 12 | 0.4% |
| Thailand | 5 | 0.2% |
| Western Europe | 14 | 0.5% | View All 15 Rows |
Sex and Age in Edwards County
Sex and Age in Edwards County
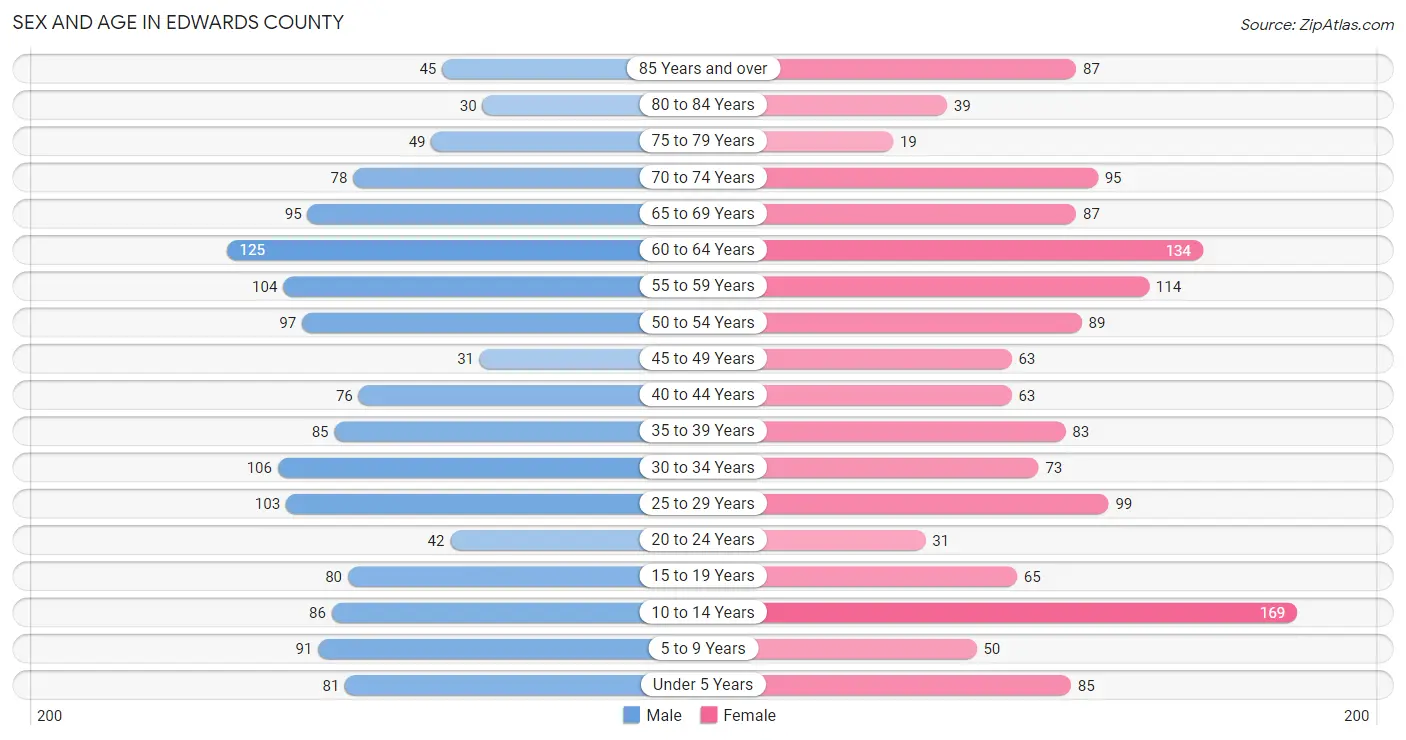
The most populous age groups in Edwards County are 60 to 64 Years (125 | 8.9%) for men and 10 to 14 Years (169 | 11.7%) for women.
| Age Bracket | Male | Female |
| Under 5 Years | 81 (5.8%) | 85 (5.9%) |
| 5 to 9 Years | 91 (6.5%) | 50 (3.5%) |
| 10 to 14 Years | 86 (6.1%) | 169 (11.7%) |
| 15 to 19 Years | 80 (5.7%) | 65 (4.5%) |
| 20 to 24 Years | 42 (3.0%) | 31 (2.1%) |
| 25 to 29 Years | 103 (7.3%) | 99 (6.9%) |
| 30 to 34 Years | 106 (7.5%) | 73 (5.1%) |
| 35 to 39 Years | 85 (6.0%) | 83 (5.7%) |
| 40 to 44 Years | 76 (5.4%) | 63 (4.4%) |
| 45 to 49 Years | 31 (2.2%) | 63 (4.4%) |
| 50 to 54 Years | 97 (6.9%) | 89 (6.2%) |
| 55 to 59 Years | 104 (7.4%) | 114 (7.9%) |
| 60 to 64 Years | 125 (8.9%) | 134 (9.3%) |
| 65 to 69 Years | 95 (6.8%) | 87 (6.0%) |
| 70 to 74 Years | 78 (5.6%) | 95 (6.6%) |
| 75 to 79 Years | 49 (3.5%) | 19 (1.3%) |
| 80 to 84 Years | 30 (2.1%) | 39 (2.7%) |
| 85 Years and over | 45 (3.2%) | 87 (6.0%) |
| Total | 1,404 (100.0%) | 1,445 (100.0%) |
Families and Households in Edwards County
Median Family Size in Edwards County
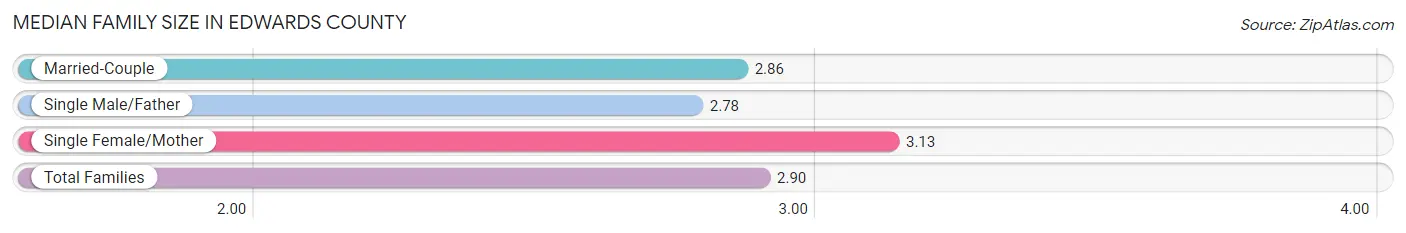
The median family size in Edwards County is 2.90 persons per family, with single female/mother families (135 | 17.9%) accounting for the largest median family size of 3.13 persons per family. On the other hand, single male/father families (67 | 8.9%) represent the smallest median family size with 2.78 persons per family.
| Family Type | # Families | Family Size |
| Married-Couple | 553 (73.3%) | 2.86 |
| Single Male/Father | 67 (8.9%) | 2.78 |
| Single Female/Mother | 135 (17.9%) | 3.13 |
| Total Families | 755 (100.0%) | 2.90 |
Median Household Size in Edwards County
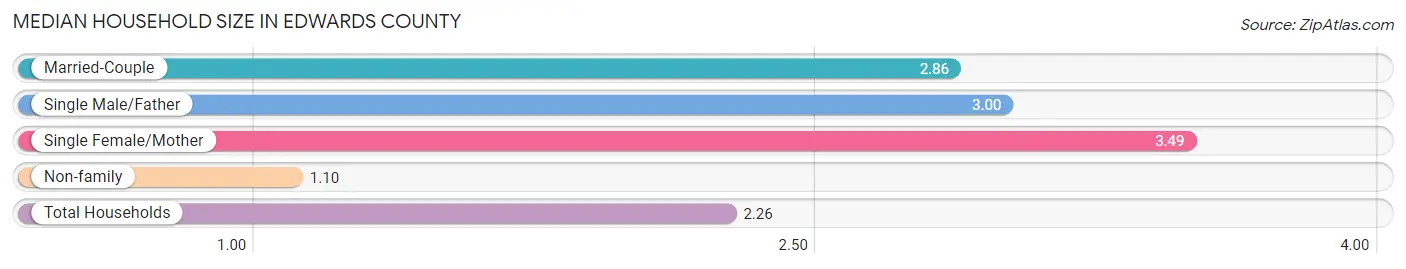
The median household size in Edwards County is 2.26 persons per household, with single female/mother households (135 | 11.0%) accounting for the largest median household size of 3.49 persons per household. non-family households (470 | 38.4%) represent the smallest median household size with 1.10 persons per household.
| Household Type | # Households | Household Size |
| Married-Couple | 553 (45.1%) | 2.86 |
| Single Male/Father | 67 (5.5%) | 3.00 |
| Single Female/Mother | 135 (11.0%) | 3.49 |
| Non-family | 470 (38.4%) | 1.10 |
| Total Households | 1,225 (100.0%) | 2.26 |
Household Size by Marriage Status in Edwards County
Out of a total of 1,225 households in Edwards County, 755 (61.6%) are family households, while 470 (38.4%) are nonfamily households. The most numerous type of family households are 2-person households, comprising 398, and the most common type of nonfamily households are 1-person households, comprising 443.
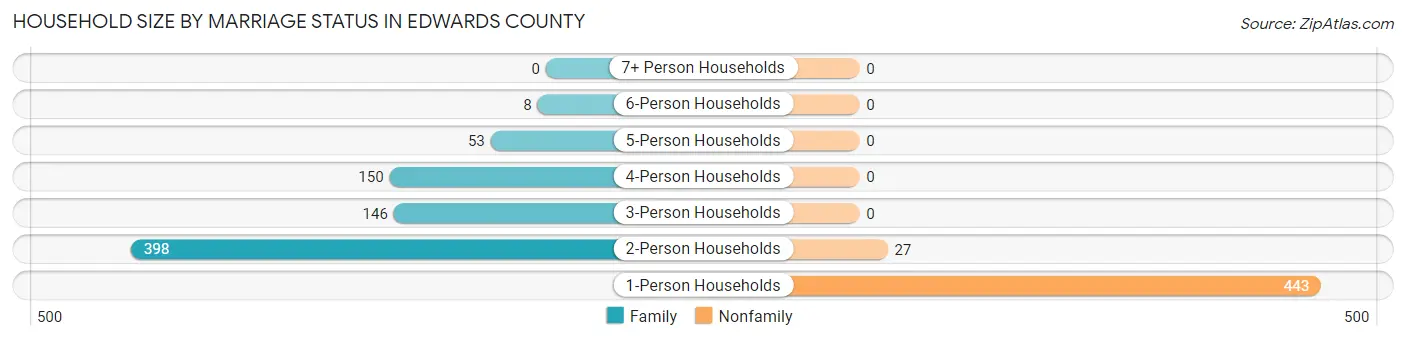
| Household Size | Family Households | Nonfamily Households |
| 1-Person Households | - | 443 (36.2%) |
| 2-Person Households | 398 (32.5%) | 27 (2.2%) |
| 3-Person Households | 146 (11.9%) | 0 (0.0%) |
| 4-Person Households | 150 (12.2%) | 0 (0.0%) |
| 5-Person Households | 53 (4.3%) | 0 (0.0%) |
| 6-Person Households | 8 (0.6%) | 0 (0.0%) |
| 7+ Person Households | 0 (0.0%) | 0 (0.0%) |
| Total | 755 (61.6%) | 470 (38.4%) |
Female Fertility in Edwards County
Fertility by Age in Edwards County
Average fertility rate in Edwards County is 48.0 births per 1,000 women. Women in the age bracket of 20 to 34 years have the highest fertility rate with 113.0 births per 1,000 women. Women in the age bracket of 20 to 34 years acount for 100.0% of all women with births.
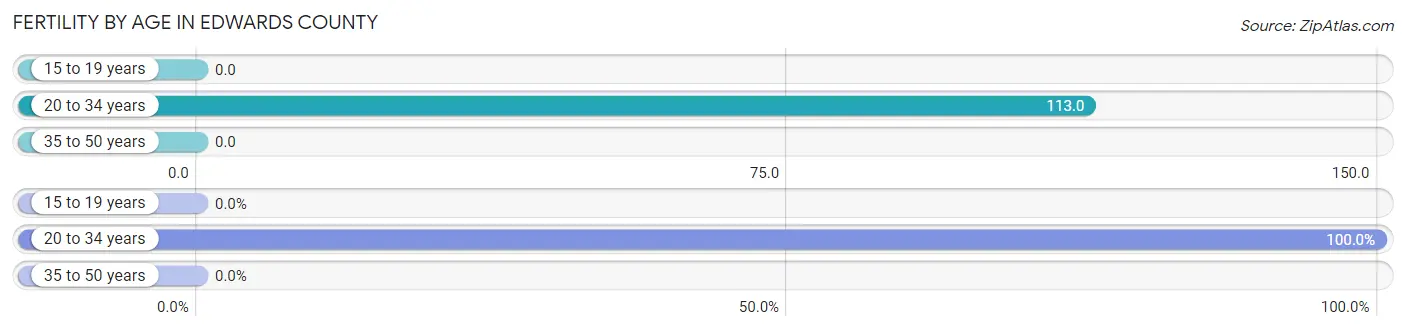
| Age Bracket | Women with Births | Births / 1,000 Women |
| 15 to 19 years | 0 (0.0%) | 0.0 |
| 20 to 34 years | 23 (100.0%) | 113.0 |
| 35 to 50 years | 0 (0.0%) | 0.0 |
| Total | 23 (100.0%) | 48.0 |
Fertility by Age by Marriage Status in Edwards County
82.6% of women with births (23) in Edwards County are married. The highest percentage of unmarried women with births falls into 20 to 34 years age bracket with 17.4% of them unmarried at the time of birth, while the lowest percentage of unmarried women with births belong to 20 to 34 years age bracket with 17.4% of them unmarried.
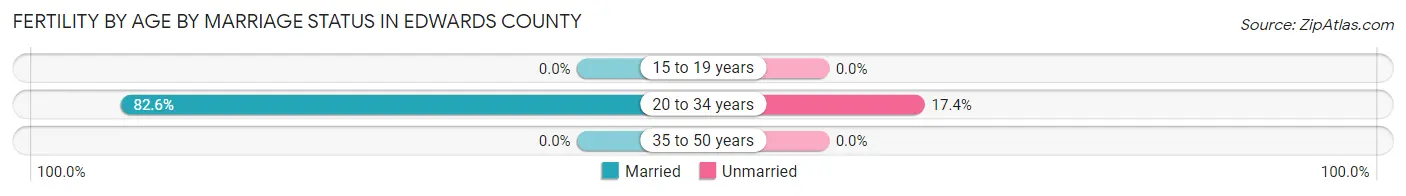
| Age Bracket | Married | Unmarried |
| 15 to 19 years | 0 (0.0%) | 0 (0.0%) |
| 20 to 34 years | 19 (82.6%) | 4 (17.4%) |
| 35 to 50 years | 0 (0.0%) | 0 (0.0%) |
| Total | 19 (82.6%) | 4 (17.4%) |
Fertility by Education in Edwards County

| Educational Attainment | Women with Births | Births / 1,000 Women |
| Less than High School | 0 (0.0%) | 0.0 |
| High School Diploma | 3 (13.0%) | 29.0 |
| College or Associate's Degree | 9 (39.1%) | 43.0 |
| Bachelor's Degree | 11 (47.8%) | 121.0 |
| Graduate Degree | 0 (0.0%) | 0.0 |
| Total | 23 (100.0%) | 48.0 |
Fertility by Education by Marriage Status in Edwards County
17.4% of women with births in Edwards County are unmarried. Women with the educational attainment of high school diploma are most likely to be married with 100.0% of them married at childbirth, while women with the educational attainment of college or associate's degree are least likely to be married with 44.4% of them unmarried at childbirth.
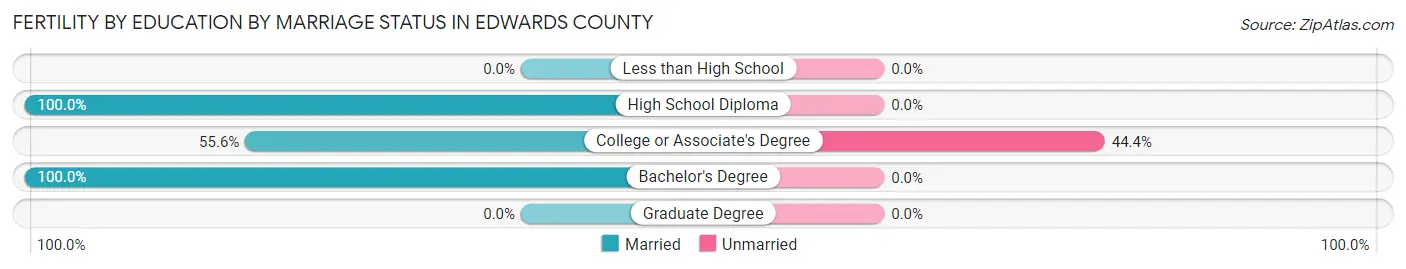
| Educational Attainment | Married | Unmarried |
| Less than High School | 0 (0.0%) | 0 (0.0%) |
| High School Diploma | 3 (100.0%) | 0 (0.0%) |
| College or Associate's Degree | 5 (55.6%) | 4 (44.4%) |
| Bachelor's Degree | 11 (100.0%) | 0 (0.0%) |
| Graduate Degree | 0 (0.0%) | 0 (0.0%) |
| Total | 19 (82.6%) | 4 (17.4%) |
Employment Characteristics in Edwards County
Employment by Class of Employer in Edwards County
Among the 1,342 employed individuals in Edwards County, private company employees (684 | 51.0%), self-employed (not incorporated) (198 | 14.7%), and local government employees (156 | 11.6%) make up the most common classes of employment.
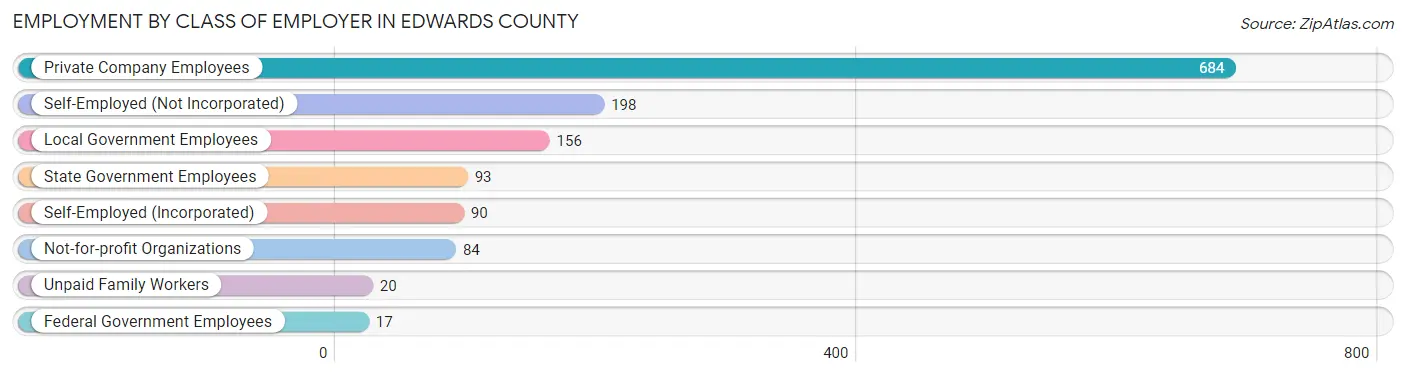
| Employer Class | # Employees | % Employees |
| Private Company Employees | 684 | 51.0% |
| Self-Employed (Incorporated) | 90 | 6.7% |
| Self-Employed (Not Incorporated) | 198 | 14.7% |
| Not-for-profit Organizations | 84 | 6.3% |
| Local Government Employees | 156 | 11.6% |
| State Government Employees | 93 | 6.9% |
| Federal Government Employees | 17 | 1.3% |
| Unpaid Family Workers | 20 | 1.5% |
| Total | 1,342 | 100.0% |
Employment Status by Age in Edwards County
According to the labor force statistics for Edwards County, out of the total population over 16 years of age (2,275), 62.2% or 1,415 individuals are in the labor force, with 3.9% or 55 of them unemployed. The age group with the highest labor force participation rate is 20 to 24 years, with 97.3% or 71 individuals in the labor force. Within the labor force, the 20 to 24 years age range has the highest percentage of unemployed individuals, with 32.4% or 23 of them being unemployed.
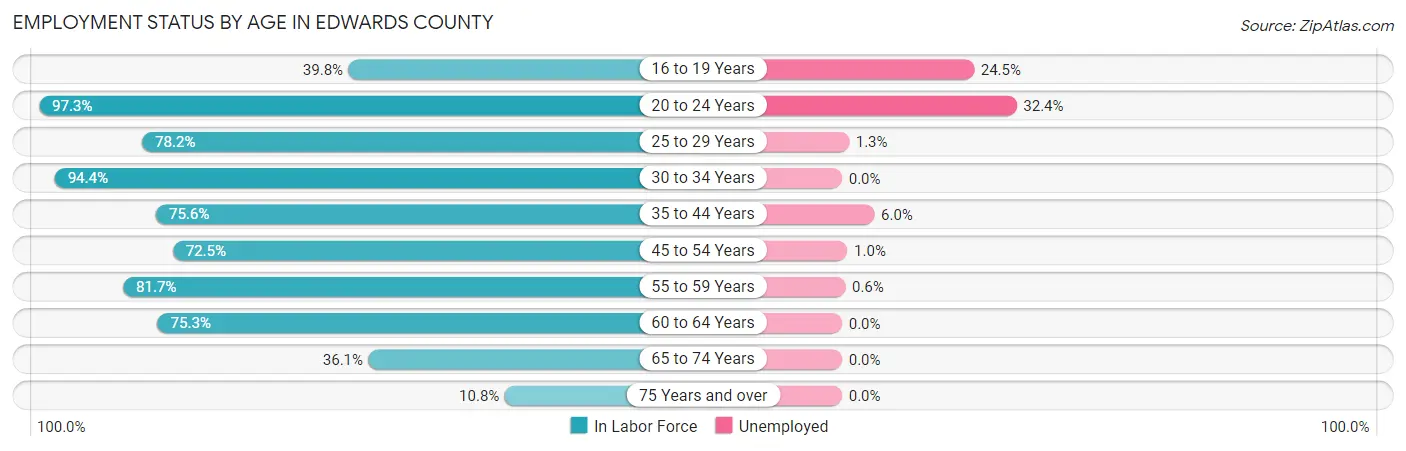
| Age Bracket | In Labor Force | Unemployed |
| 16 to 19 Years | 53 (39.8%) | 13 (24.5%) |
| 20 to 24 Years | 71 (97.3%) | 23 (32.4%) |
| 25 to 29 Years | 158 (78.2%) | 2 (1.3%) |
| 30 to 34 Years | 169 (94.4%) | 0 (0.0%) |
| 35 to 44 Years | 232 (75.6%) | 14 (6.0%) |
| 45 to 54 Years | 203 (72.5%) | 2 (1.0%) |
| 55 to 59 Years | 178 (81.7%) | 1 (0.6%) |
| 60 to 64 Years | 195 (75.3%) | 0 (0.0%) |
| 65 to 74 Years | 128 (36.1%) | 0 (0.0%) |
| 75 Years and over | 29 (10.8%) | 0 (0.0%) |
| Total | 1,415 (62.2%) | 55 (3.9%) |
Employment Status by Educational Attainment in Edwards County
According to labor force statistics for Edwards County, 78.5% of individuals (1,134) out of the total population between 25 and 64 years of age (1,445) are in the labor force, with 1.7% or 19 of them being unemployed. The group with the highest labor force participation rate are those with the educational attainment of bachelor's degree or higher, with 90.7% or 264 individuals in the labor force. Within the labor force, individuals with high school diploma education have the highest percentage of unemployment, with 4.9% or 15 of them being unemployed.
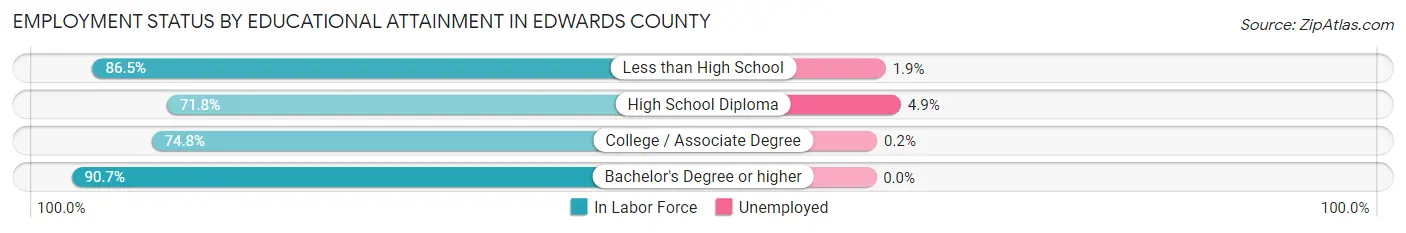
| Educational Attainment | In Labor Force | Unemployed |
| Less than High School | 154 (86.5%) | 3 (1.9%) |
| High School Diploma | 308 (71.8%) | 21 (4.9%) |
| College / Associate Degree | 409 (74.8%) | 1 (0.2%) |
| Bachelor's Degree or higher | 264 (90.7%) | 0 (0.0%) |
| Total | 1,134 (78.5%) | 25 (1.7%) |
Employment Occupations by Sex in Edwards County
Management, Business, Science and Arts Occupations
The most common Management, Business, Science and Arts occupations in Edwards County are Management (255 | 18.8%), Community & Social Service (78 | 5.7%), Education Instruction & Library (63 | 4.6%), Health Diagnosing & Treating (48 | 3.5%), and Computers, Engineering & Science (34 | 2.5%).
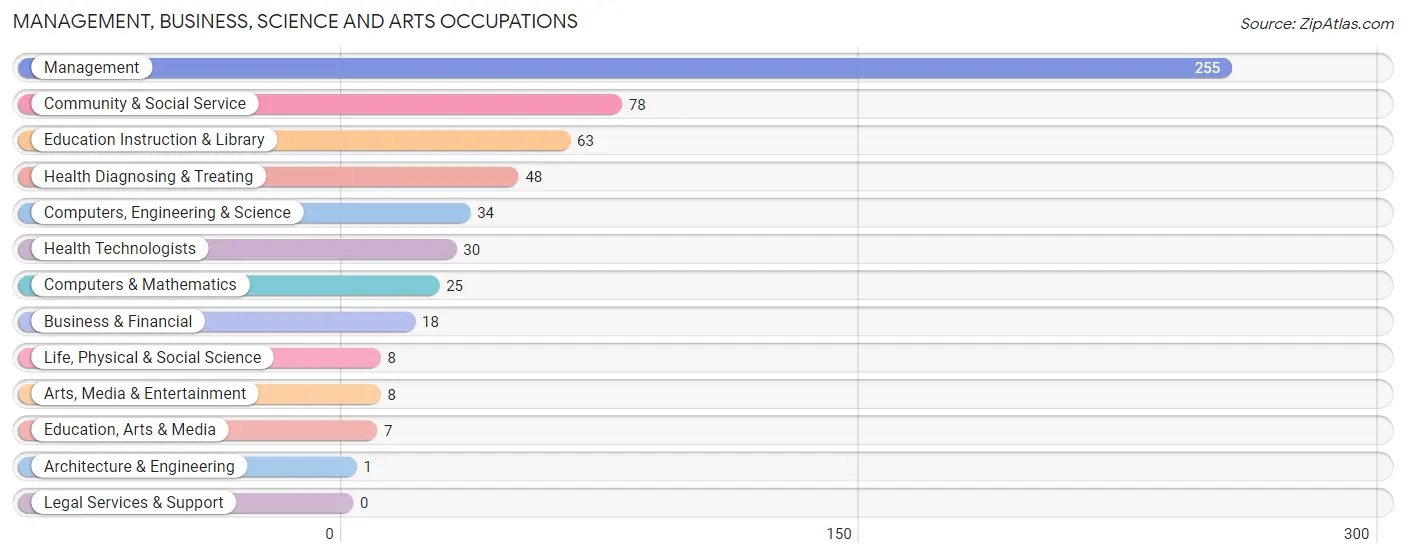
Management, Business, Science and Arts Occupations by Sex
Within the Management, Business, Science and Arts occupations in Edwards County, the most male-oriented occupations are Architecture & Engineering (100.0%), Management (79.2%), and Education, Arts & Media (57.1%), while the most female-oriented occupations are Arts, Media & Entertainment (100.0%), Business & Financial (83.3%), and Education Instruction & Library (77.8%).
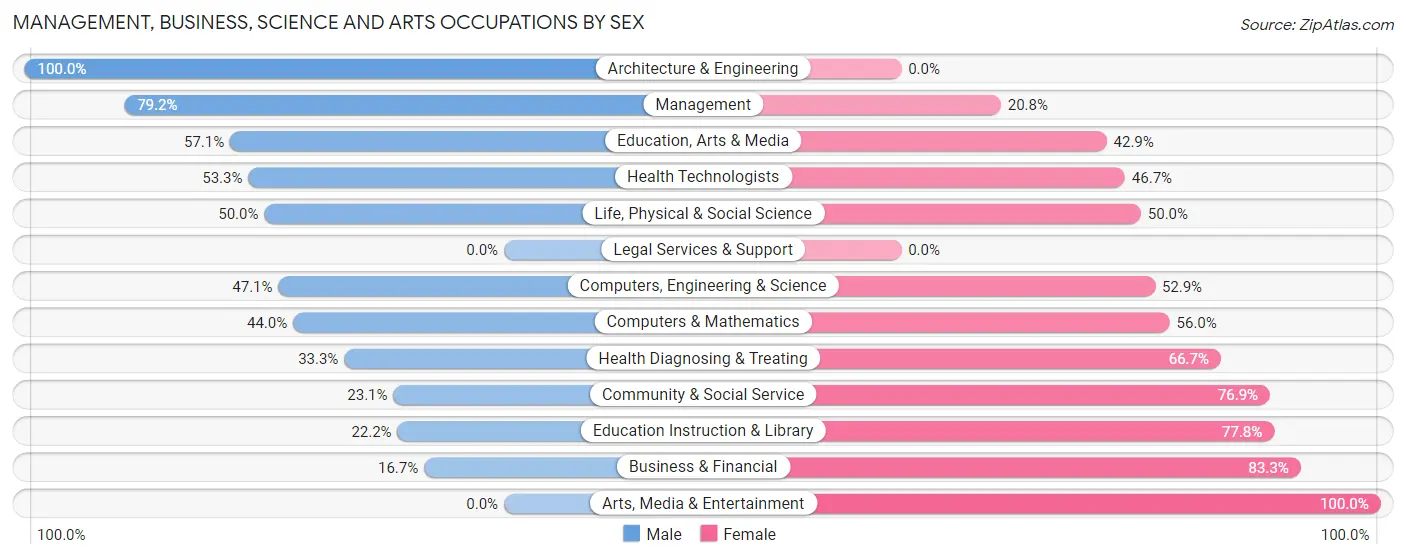
| Occupation | Male | Female |
| Management | 202 (79.2%) | 53 (20.8%) |
| Business & Financial | 3 (16.7%) | 15 (83.3%) |
| Computers, Engineering & Science | 16 (47.1%) | 18 (52.9%) |
| Computers & Mathematics | 11 (44.0%) | 14 (56.0%) |
| Architecture & Engineering | 1 (100.0%) | 0 (0.0%) |
| Life, Physical & Social Science | 4 (50.0%) | 4 (50.0%) |
| Community & Social Service | 18 (23.1%) | 60 (76.9%) |
| Education, Arts & Media | 4 (57.1%) | 3 (42.9%) |
| Legal Services & Support | 0 (0.0%) | 0 (0.0%) |
| Education Instruction & Library | 14 (22.2%) | 49 (77.8%) |
| Arts, Media & Entertainment | 0 (0.0%) | 8 (100.0%) |
| Health Diagnosing & Treating | 16 (33.3%) | 32 (66.7%) |
| Health Technologists | 16 (53.3%) | 14 (46.7%) |
| Total (Category) | 255 (58.9%) | 178 (41.1%) |
| Total (Overall) | 772 (56.8%) | 587 (43.2%) |
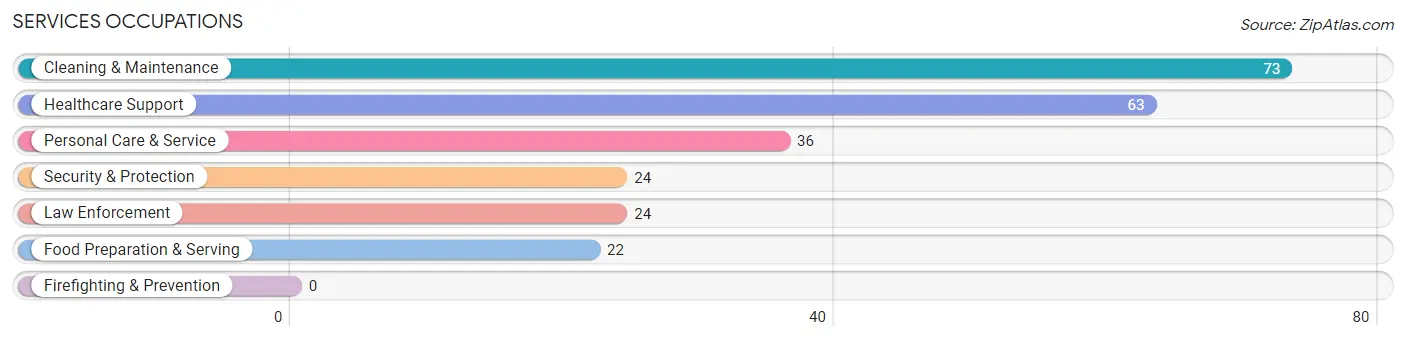
Services Occupations
The most common Services occupations in Edwards County are Cleaning & Maintenance (73 | 5.4%), Healthcare Support (63 | 4.6%), Personal Care & Service (36 | 2.6%), Security & Protection (24 | 1.8%), and Law Enforcement (24 | 1.8%).
Services Occupations by Sex
Within the Services occupations in Edwards County, the most male-oriented occupations are Cleaning & Maintenance (49.3%), Food Preparation & Serving (45.5%), and Security & Protection (33.3%), while the most female-oriented occupations are Personal Care & Service (97.2%), Healthcare Support (95.2%), and Security & Protection (66.7%).
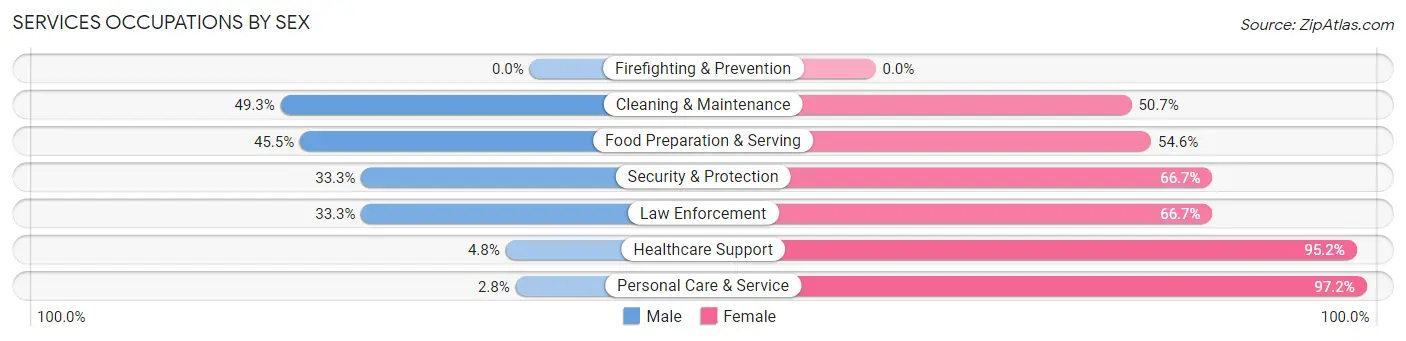
| Occupation | Male | Female |
| Healthcare Support | 3 (4.8%) | 60 (95.2%) |
| Security & Protection | 8 (33.3%) | 16 (66.7%) |
| Firefighting & Prevention | 0 (0.0%) | 0 (0.0%) |
| Law Enforcement | 8 (33.3%) | 16 (66.7%) |
| Food Preparation & Serving | 10 (45.5%) | 12 (54.5%) |
| Cleaning & Maintenance | 36 (49.3%) | 37 (50.7%) |
| Personal Care & Service | 1 (2.8%) | 35 (97.2%) |
| Total (Category) | 58 (26.6%) | 160 (73.4%) |
| Total (Overall) | 772 (56.8%) | 587 (43.2%) |
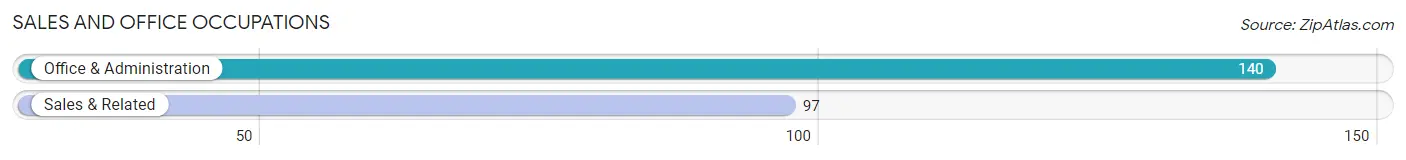
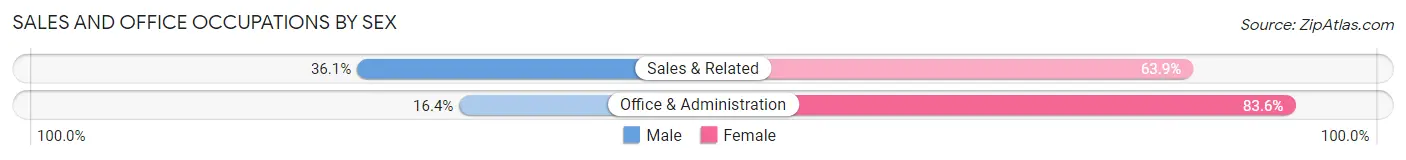
Sales and Office Occupations
The most common Sales and Office occupations in Edwards County are Office & Administration (140 | 10.3%), and Sales & Related (97 | 7.1%).
Sales and Office Occupations by Sex
| Occupation | Male | Female |
| Sales & Related | 35 (36.1%) | 62 (63.9%) |
| Office & Administration | 23 (16.4%) | 117 (83.6%) |
| Total (Category) | 58 (24.5%) | 179 (75.5%) |
| Total (Overall) | 772 (56.8%) | 587 (43.2%) |
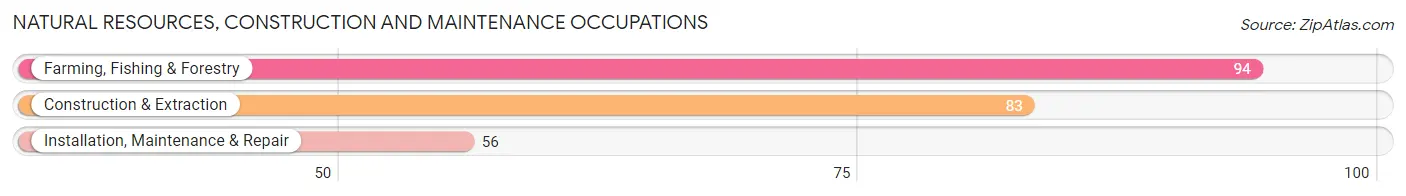
Natural Resources, Construction and Maintenance Occupations
The most common Natural Resources, Construction and Maintenance occupations in Edwards County are Farming, Fishing & Forestry (94 | 6.9%), Construction & Extraction (83 | 6.1%), and Installation, Maintenance & Repair (56 | 4.1%).
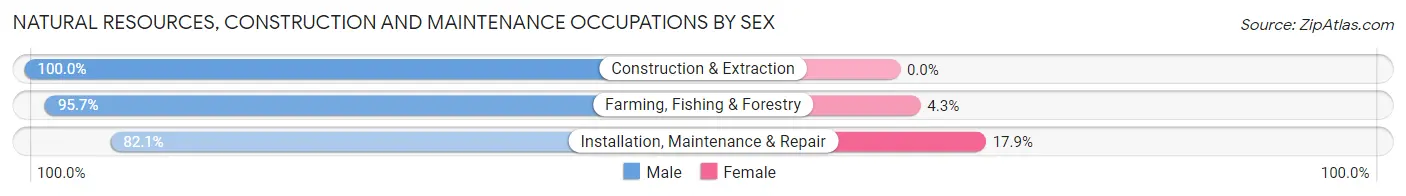
Natural Resources, Construction and Maintenance Occupations by Sex
| Occupation | Male | Female |
| Farming, Fishing & Forestry | 90 (95.7%) | 4 (4.3%) |
| Construction & Extraction | 83 (100.0%) | 0 (0.0%) |
| Installation, Maintenance & Repair | 46 (82.1%) | 10 (17.9%) |
| Total (Category) | 219 (94.0%) | 14 (6.0%) |
| Total (Overall) | 772 (56.8%) | 587 (43.2%) |
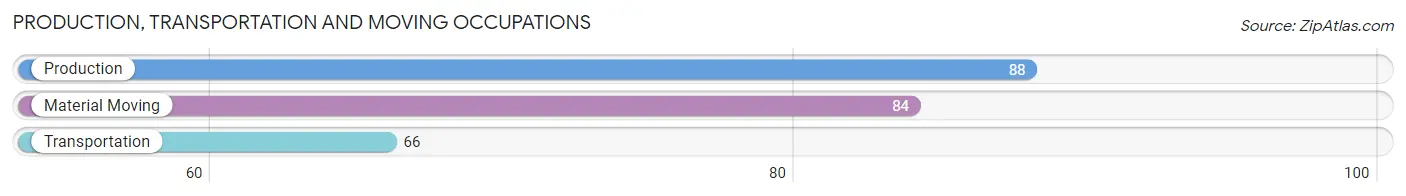
Production, Transportation and Moving Occupations
The most common Production, Transportation and Moving occupations in Edwards County are Production (88 | 6.5%), Material Moving (84 | 6.2%), and Transportation (66 | 4.9%).
Production, Transportation and Moving Occupations by Sex
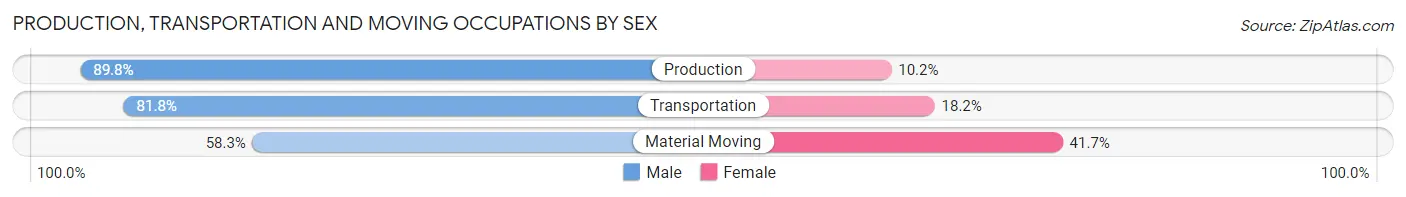
| Occupation | Male | Female |
| Production | 79 (89.8%) | 9 (10.2%) |
| Transportation | 54 (81.8%) | 12 (18.2%) |
| Material Moving | 49 (58.3%) | 35 (41.7%) |
| Total (Category) | 182 (76.5%) | 56 (23.5%) |
| Total (Overall) | 772 (56.8%) | 587 (43.2%) |
Employment Industries by Sex in Edwards County
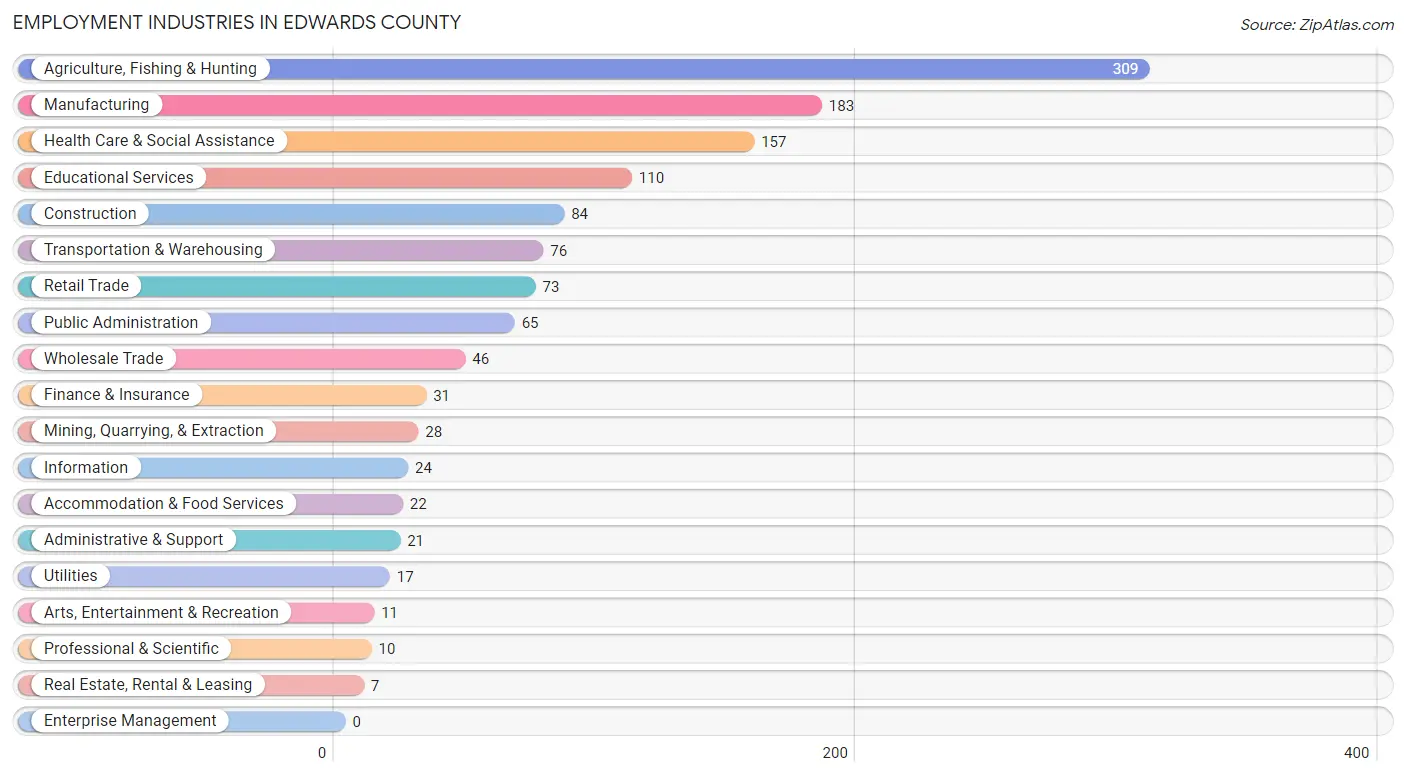
Employment Industries in Edwards County
The major employment industries in Edwards County include Agriculture, Fishing & Hunting (309 | 22.7%), Manufacturing (183 | 13.5%), Health Care & Social Assistance (157 | 11.6%), Educational Services (110 | 8.1%), and Construction (84 | 6.2%).
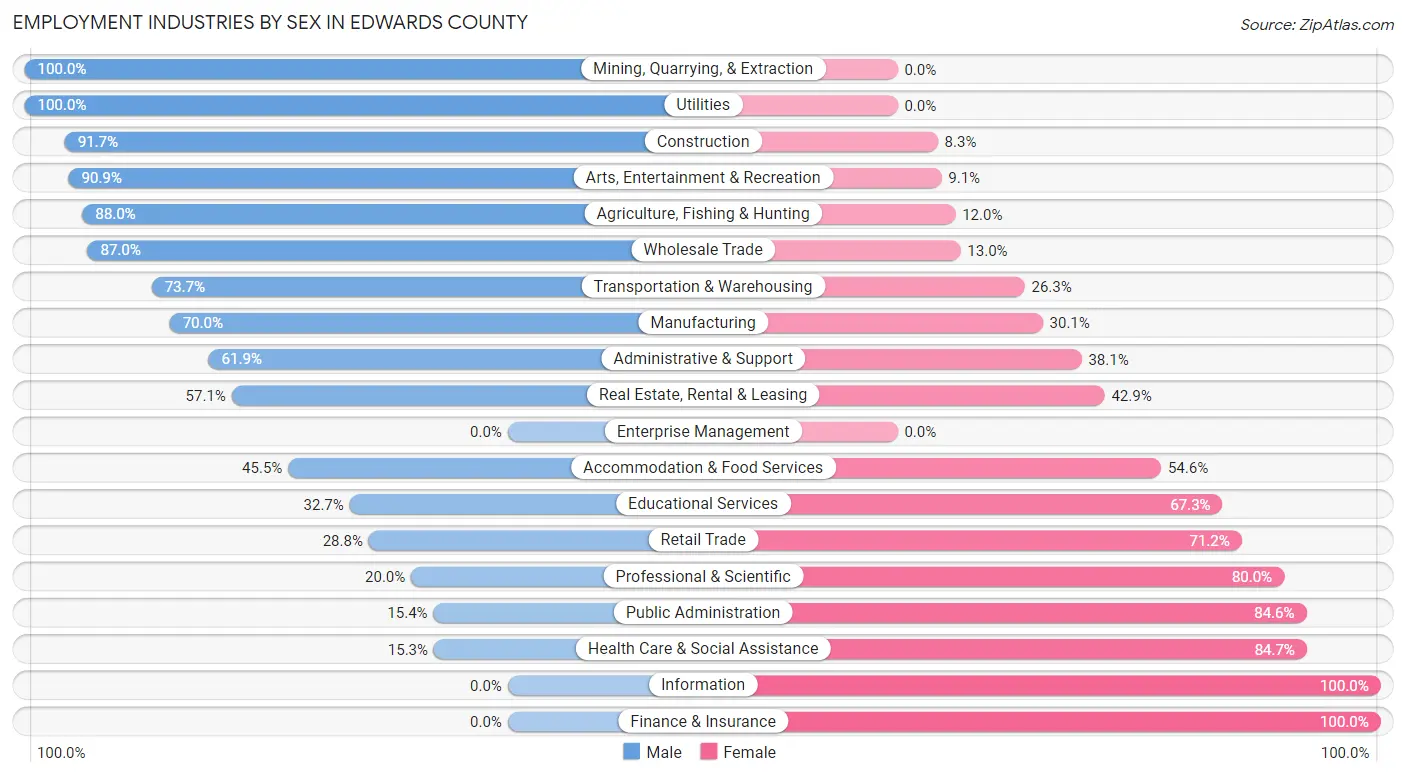
Employment Industries by Sex in Edwards County
The Edwards County industries that see more men than women are Mining, Quarrying, & Extraction (100.0%), Utilities (100.0%), and Construction (91.7%), whereas the industries that tend to have a higher number of women are Information (100.0%), Finance & Insurance (100.0%), and Health Care & Social Assistance (84.7%).
| Industry | Male | Female |
| Agriculture, Fishing & Hunting | 272 (88.0%) | 37 (12.0%) |
| Mining, Quarrying, & Extraction | 28 (100.0%) | 0 (0.0%) |
| Construction | 77 (91.7%) | 7 (8.3%) |
| Manufacturing | 128 (70.0%) | 55 (30.0%) |
| Wholesale Trade | 40 (87.0%) | 6 (13.0%) |
| Retail Trade | 21 (28.8%) | 52 (71.2%) |
| Transportation & Warehousing | 56 (73.7%) | 20 (26.3%) |
| Utilities | 17 (100.0%) | 0 (0.0%) |
| Information | 0 (0.0%) | 24 (100.0%) |
| Finance & Insurance | 0 (0.0%) | 31 (100.0%) |
| Real Estate, Rental & Leasing | 4 (57.1%) | 3 (42.9%) |
| Professional & Scientific | 2 (20.0%) | 8 (80.0%) |
| Enterprise Management | 0 (0.0%) | 0 (0.0%) |
| Administrative & Support | 13 (61.9%) | 8 (38.1%) |
| Educational Services | 36 (32.7%) | 74 (67.3%) |
| Health Care & Social Assistance | 24 (15.3%) | 133 (84.7%) |
| Arts, Entertainment & Recreation | 10 (90.9%) | 1 (9.1%) |
| Accommodation & Food Services | 10 (45.5%) | 12 (54.5%) |
| Public Administration | 10 (15.4%) | 55 (84.6%) |
| Total | 772 (56.8%) | 587 (43.2%) |
Education in Edwards County
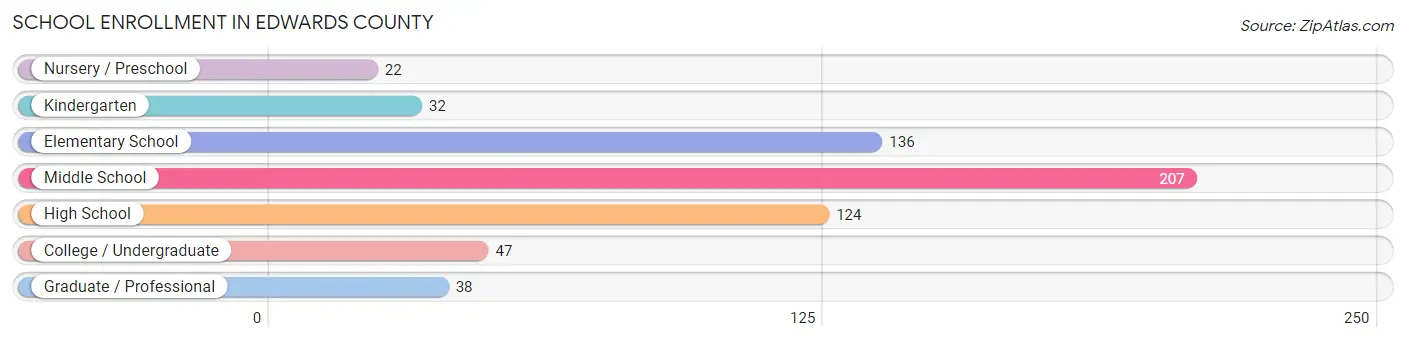
School Enrollment in Edwards County
The most common levels of schooling among the 606 students in Edwards County are middle school (207 | 34.2%), elementary school (136 | 22.4%), and high school (124 | 20.5%).
| School Level | # Students | % Students |
| Nursery / Preschool | 22 | 3.6% |
| Kindergarten | 32 | 5.3% |
| Elementary School | 136 | 22.4% |
| Middle School | 207 | 34.2% |
| High School | 124 | 20.5% |
| College / Undergraduate | 47 | 7.8% |
| Graduate / Professional | 38 | 6.3% |
| Total | 606 | 100.0% |
School Enrollment by Age by Funding Source in Edwards County
Out of a total of 606 students who are enrolled in schools in Edwards County, 51 (8.4%) attend a private institution, while the remaining 555 (91.6%) are enrolled in public schools. The age group of 35 years and over has the highest likelihood of being enrolled in private schools, with 6 (50.0% in the age bracket) enrolled. Conversely, the age group of 10 to 14 year olds has the lowest likelihood of being enrolled in a private school, with 251 (98.4% in the age bracket) attending a public institution.
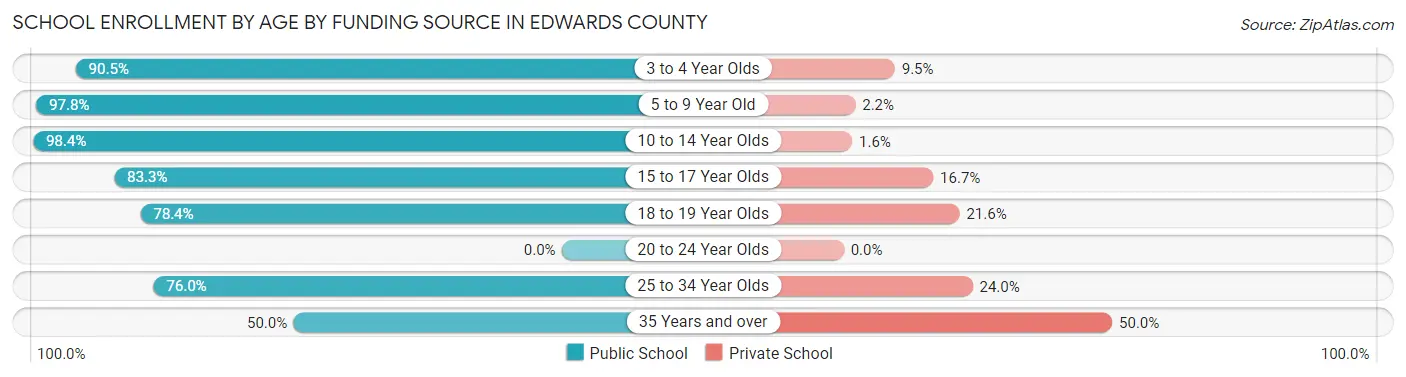
| Age Bracket | Public School | Private School |
| 3 to 4 Year Olds | 19 (90.5%) | 2 (9.5%) |
| 5 to 9 Year Old | 136 (97.8%) | 3 (2.2%) |
| 10 to 14 Year Olds | 251 (98.4%) | 4 (1.6%) |
| 15 to 17 Year Olds | 65 (83.3%) | 13 (16.7%) |
| 18 to 19 Year Olds | 40 (78.4%) | 11 (21.6%) |
| 20 to 24 Year Olds | 0 (0.0%) | 0 (0.0%) |
| 25 to 34 Year Olds | 38 (76.0%) | 12 (24.0%) |
| 35 Years and over | 6 (50.0%) | 6 (50.0%) |
| Total | 555 (91.6%) | 51 (8.4%) |
Educational Attainment by Field of Study in Edwards County
Education (112 | 28.0%), bio, nature & agricultural (55 | 13.8%), business (51 | 12.8%), science & technology (36 | 9.0%), and liberal arts & history (28 | 7.0%) are the most common fields of study among 400 individuals in Edwards County who have obtained a bachelor's degree or higher.
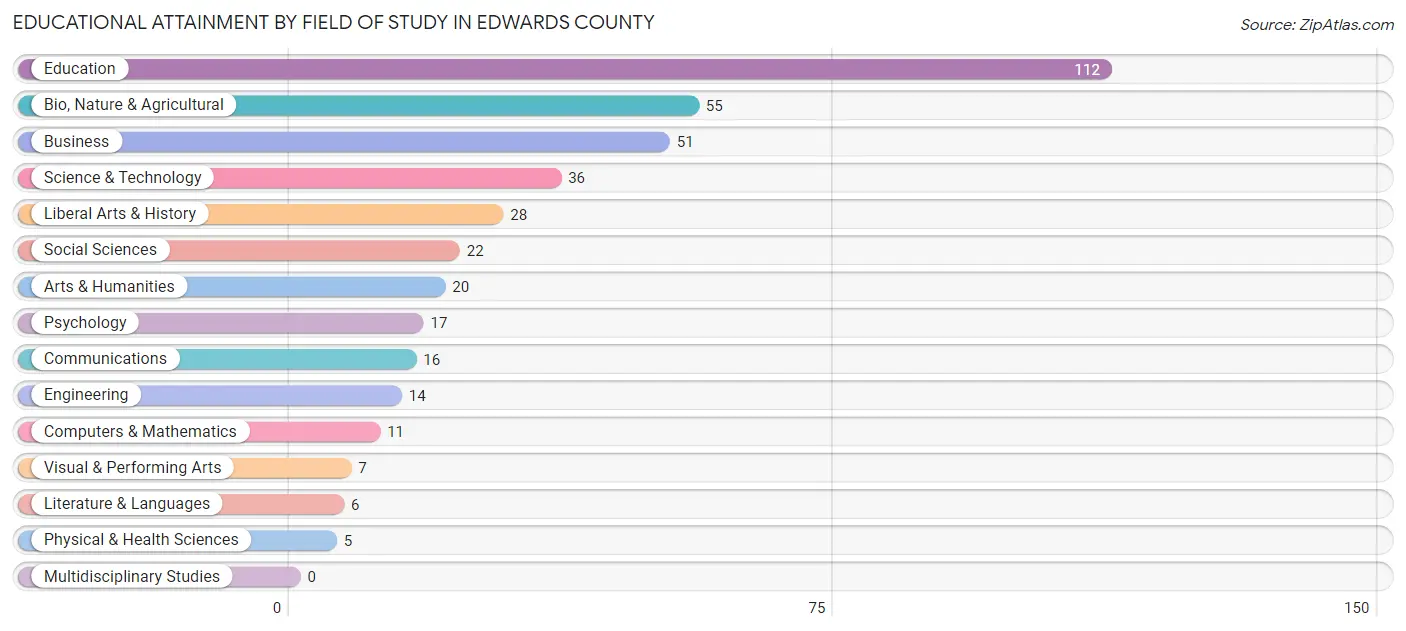
| Field of Study | # Graduates | % Graduates |
| Computers & Mathematics | 11 | 2.8% |
| Bio, Nature & Agricultural | 55 | 13.8% |
| Physical & Health Sciences | 5 | 1.3% |
| Psychology | 17 | 4.3% |
| Social Sciences | 22 | 5.5% |
| Engineering | 14 | 3.5% |
| Multidisciplinary Studies | 0 | 0.0% |
| Science & Technology | 36 | 9.0% |
| Business | 51 | 12.8% |
| Education | 112 | 28.0% |
| Literature & Languages | 6 | 1.5% |
| Liberal Arts & History | 28 | 7.0% |
| Visual & Performing Arts | 7 | 1.8% |
| Communications | 16 | 4.0% |
| Arts & Humanities | 20 | 5.0% |
| Total | 400 | 100.0% |
Transportation & Commute in Edwards County
Vehicle Availability by Sex in Edwards County
The most prevalent vehicle ownership categories in Edwards County are males with 2 vehicles (295, accounting for 38.8%) and females with 2 vehicles (247, making up 50.8%).
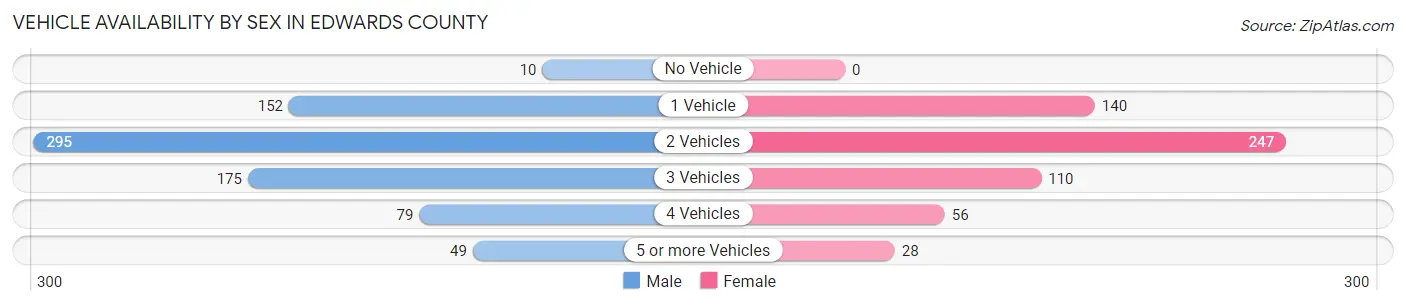
| Vehicles Available | Male | Female |
| No Vehicle | 10 (1.3%) | 0 (0.0%) |
| 1 Vehicle | 152 (20.0%) | 140 (24.1%) |
| 2 Vehicles | 295 (38.8%) | 247 (42.5%) |
| 3 Vehicles | 175 (23.0%) | 110 (18.9%) |
| 4 Vehicles | 79 (10.4%) | 56 (9.6%) |
| 5 or more Vehicles | 49 (6.5%) | 28 (4.8%) |
| Total | 760 (100.0%) | 581 (100.0%) |
Commute Time in Edwards County
The most frequently occuring commute durations in Edwards County are 5 to 9 minutes (297 commuters, 24.6%), less than 5 minutes (192 commuters, 15.9%), and 10 to 14 minutes (171 commuters, 14.2%).
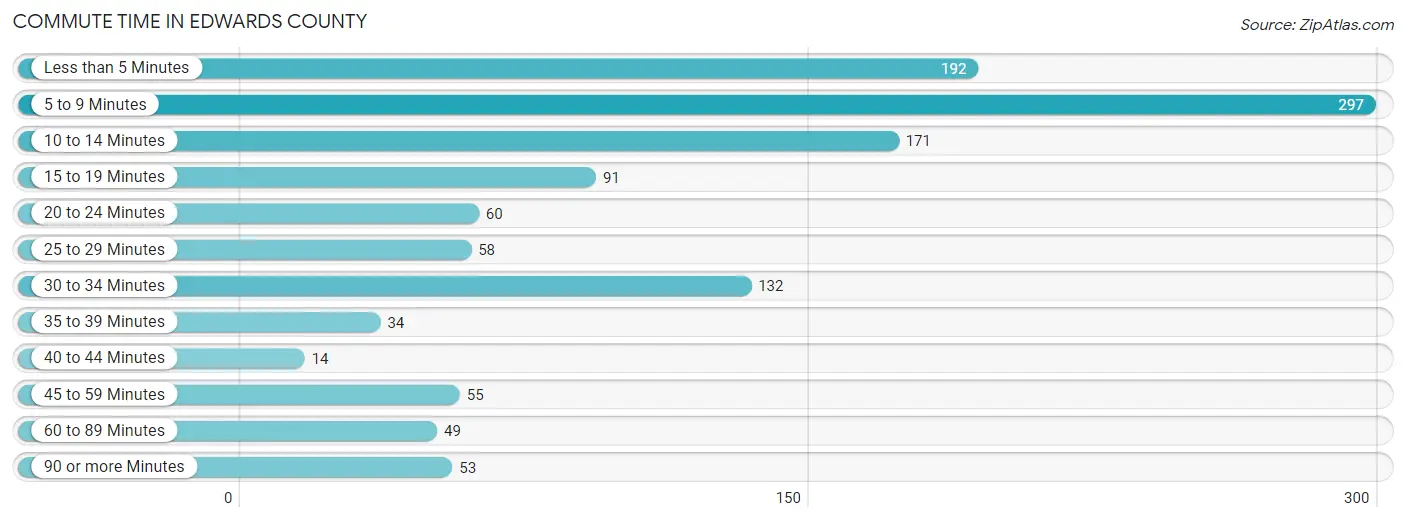
| Commute Time | # Commuters | % Commuters |
| Less than 5 Minutes | 192 | 15.9% |
| 5 to 9 Minutes | 297 | 24.6% |
| 10 to 14 Minutes | 171 | 14.2% |
| 15 to 19 Minutes | 91 | 7.5% |
| 20 to 24 Minutes | 60 | 5.0% |
| 25 to 29 Minutes | 58 | 4.8% |
| 30 to 34 Minutes | 132 | 11.0% |
| 35 to 39 Minutes | 34 | 2.8% |
| 40 to 44 Minutes | 14 | 1.2% |
| 45 to 59 Minutes | 55 | 4.6% |
| 60 to 89 Minutes | 49 | 4.1% |
| 90 or more Minutes | 53 | 4.4% |
Commute Time by Sex in Edwards County
The most common commute times in Edwards County are 5 to 9 minutes (163 commuters, 23.7%) for males and 5 to 9 minutes (134 commuters, 25.9%) for females.
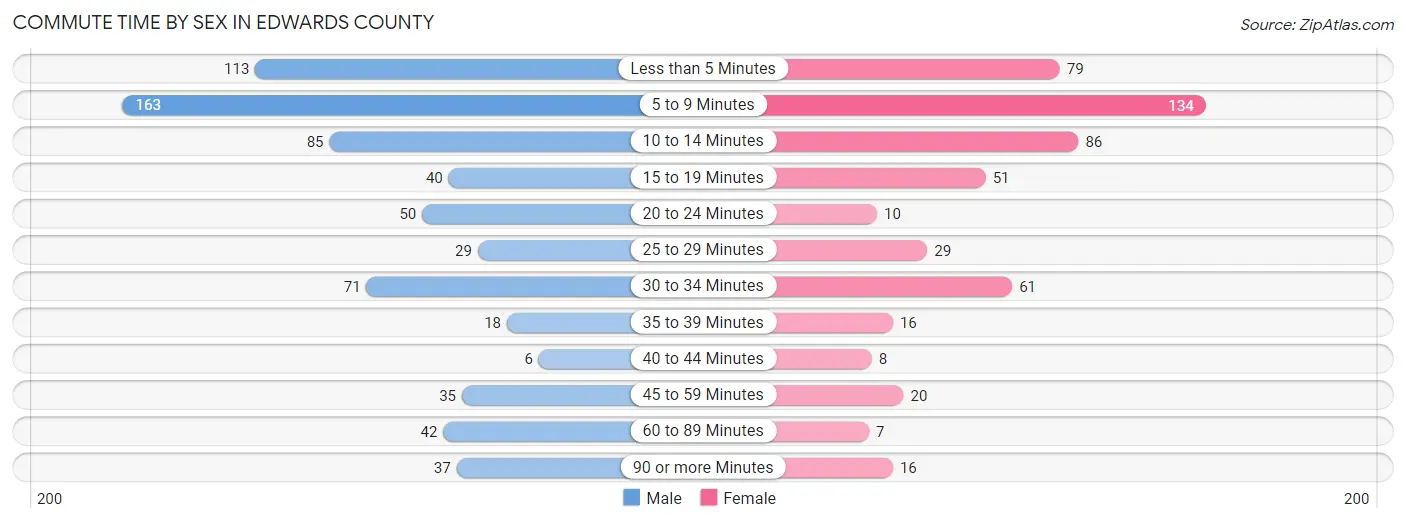
| Commute Time | Male | Female |
| Less than 5 Minutes | 113 (16.4%) | 79 (15.3%) |
| 5 to 9 Minutes | 163 (23.7%) | 134 (25.9%) |
| 10 to 14 Minutes | 85 (12.3%) | 86 (16.6%) |
| 15 to 19 Minutes | 40 (5.8%) | 51 (9.9%) |
| 20 to 24 Minutes | 50 (7.3%) | 10 (1.9%) |
| 25 to 29 Minutes | 29 (4.2%) | 29 (5.6%) |
| 30 to 34 Minutes | 71 (10.3%) | 61 (11.8%) |
| 35 to 39 Minutes | 18 (2.6%) | 16 (3.1%) |
| 40 to 44 Minutes | 6 (0.9%) | 8 (1.5%) |
| 45 to 59 Minutes | 35 (5.1%) | 20 (3.9%) |
| 60 to 89 Minutes | 42 (6.1%) | 7 (1.3%) |
| 90 or more Minutes | 37 (5.4%) | 16 (3.1%) |
Time of Departure to Work by Sex in Edwards County
The most frequent times of departure to work in Edwards County are 7:30 AM to 7:59 AM (129, 18.7%) for males and 7:30 AM to 7:59 AM (119, 23.0%) for females.
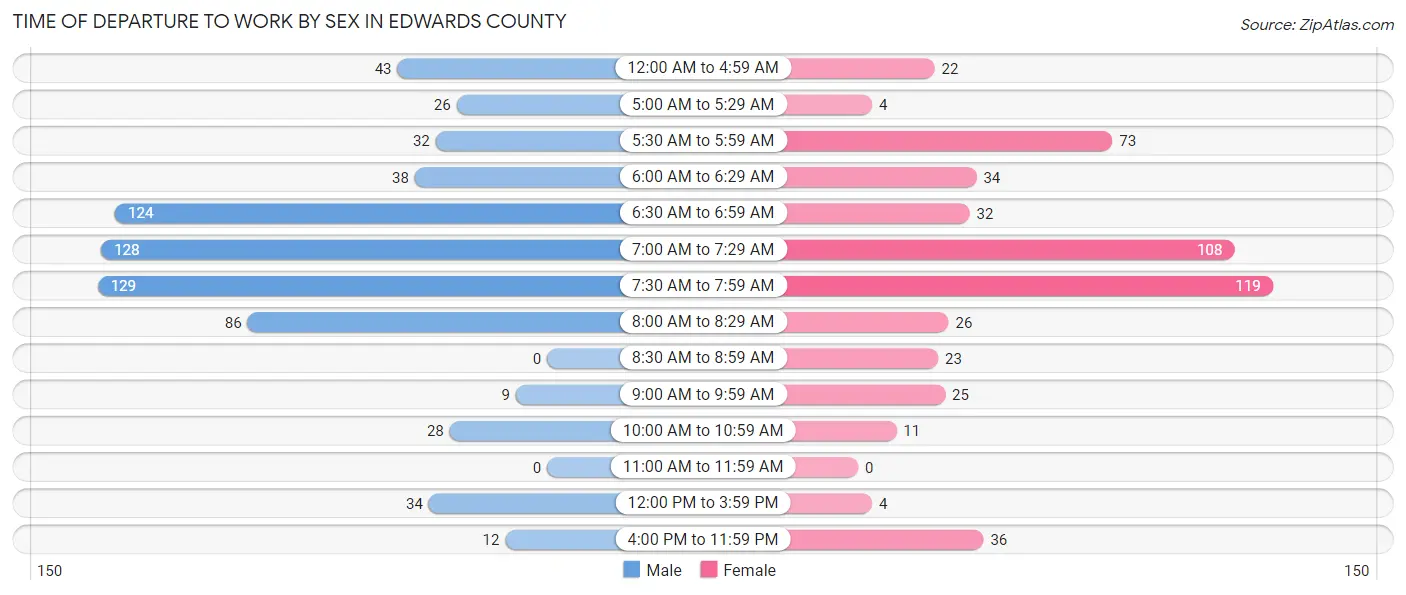
| Time of Departure | Male | Female |
| 12:00 AM to 4:59 AM | 43 (6.2%) | 22 (4.3%) |
| 5:00 AM to 5:29 AM | 26 (3.8%) | 4 (0.8%) |
| 5:30 AM to 5:59 AM | 32 (4.6%) | 73 (14.1%) |
| 6:00 AM to 6:29 AM | 38 (5.5%) | 34 (6.6%) |
| 6:30 AM to 6:59 AM | 124 (18.0%) | 32 (6.2%) |
| 7:00 AM to 7:29 AM | 128 (18.6%) | 108 (20.9%) |
| 7:30 AM to 7:59 AM | 129 (18.7%) | 119 (23.0%) |
| 8:00 AM to 8:29 AM | 86 (12.5%) | 26 (5.0%) |
| 8:30 AM to 8:59 AM | 0 (0.0%) | 23 (4.4%) |
| 9:00 AM to 9:59 AM | 9 (1.3%) | 25 (4.8%) |
| 10:00 AM to 10:59 AM | 28 (4.1%) | 11 (2.1%) |
| 11:00 AM to 11:59 AM | 0 (0.0%) | 0 (0.0%) |
| 12:00 PM to 3:59 PM | 34 (4.9%) | 4 (0.8%) |
| 4:00 PM to 11:59 PM | 12 (1.7%) | 36 (7.0%) |
| Total | 689 (100.0%) | 517 (100.0%) |
Housing Occupancy in Edwards County
Occupancy by Ownership in Edwards County
Of the total 1,225 dwellings in Edwards County, owner-occupied units account for 963 (78.6%), while renter-occupied units make up 262 (21.4%).
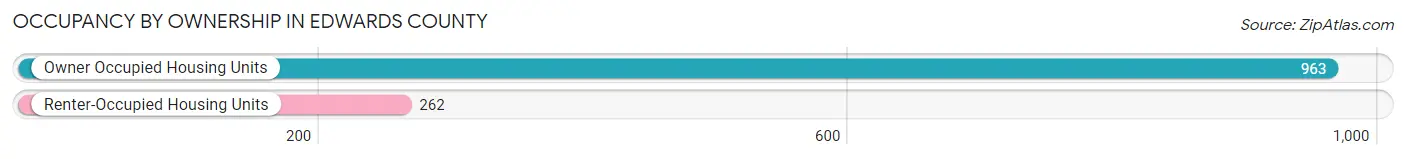
| Occupancy | # Housing Units | % Housing Units |
| Owner Occupied Housing Units | 963 | 78.6% |
| Renter-Occupied Housing Units | 262 | 21.4% |
| Total Occupied Housing Units | 1,225 | 100.0% |
Occupancy by Household Size in Edwards County
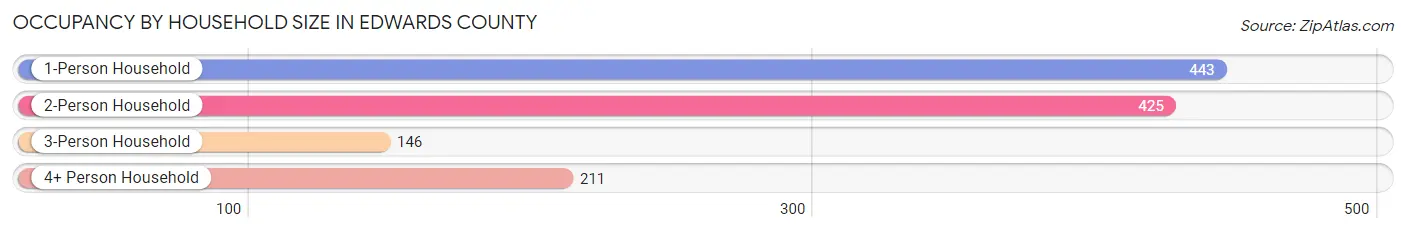
| Household Size | # Housing Units | % Housing Units |
| 1-Person Household | 443 | 36.2% |
| 2-Person Household | 425 | 34.7% |
| 3-Person Household | 146 | 11.9% |
| 4+ Person Household | 211 | 17.2% |
| Total Housing Units | 1,225 | 100.0% |
Occupancy by Ownership by Household Size in Edwards County
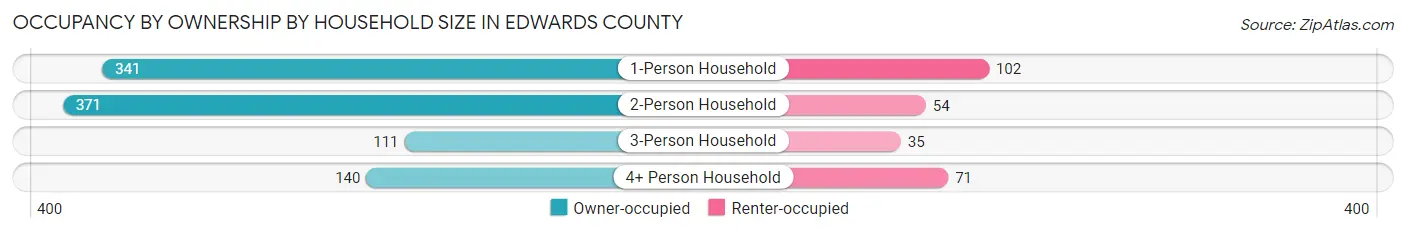
| Household Size | Owner-occupied | Renter-occupied |
| 1-Person Household | 341 (77.0%) | 102 (23.0%) |
| 2-Person Household | 371 (87.3%) | 54 (12.7%) |
| 3-Person Household | 111 (76.0%) | 35 (24.0%) |
| 4+ Person Household | 140 (66.3%) | 71 (33.7%) |
| Total Housing Units | 963 (78.6%) | 262 (21.4%) |
Occupancy by Educational Attainment in Edwards County
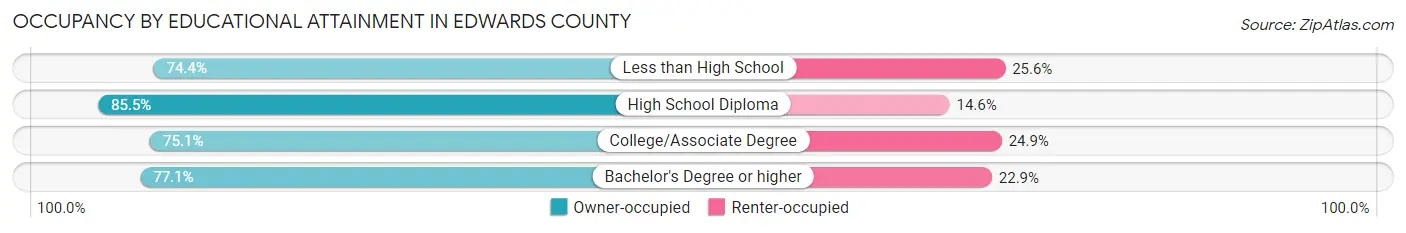
| Household Size | Owner-occupied | Renter-occupied |
| Less than High School | 128 (74.4%) | 44 (25.6%) |
| High School Diploma | 329 (85.5%) | 56 (14.5%) |
| College/Associate Degree | 338 (75.1%) | 112 (24.9%) |
| Bachelor's Degree or higher | 168 (77.1%) | 50 (22.9%) |
Occupancy by Age of Householder in Edwards County
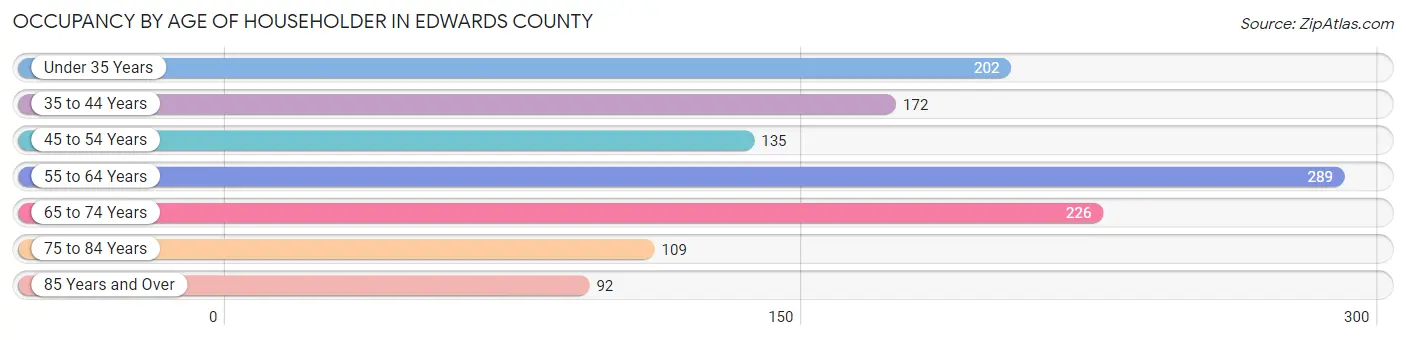
| Age Bracket | # Households | % Households |
| Under 35 Years | 202 | 16.5% |
| 35 to 44 Years | 172 | 14.0% |
| 45 to 54 Years | 135 | 11.0% |
| 55 to 64 Years | 289 | 23.6% |
| 65 to 74 Years | 226 | 18.4% |
| 75 to 84 Years | 109 | 8.9% |
| 85 Years and Over | 92 | 7.5% |
| Total | 1,225 | 100.0% |
Housing Finances in Edwards County
Median Income by Occupancy in Edwards County
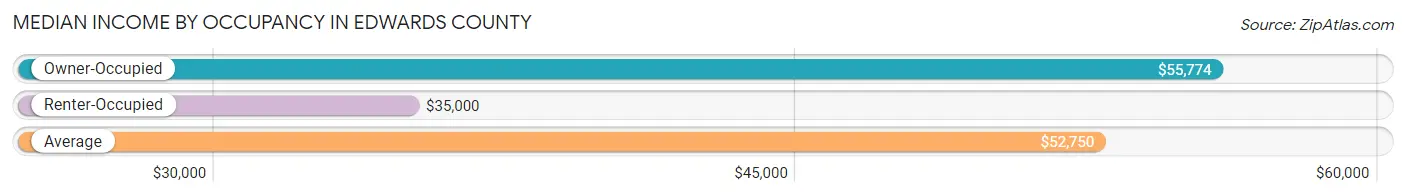
| Occupancy Type | # Households | Median Income |
| Owner-Occupied | 963 (78.6%) | $55,774 |
| Renter-Occupied | 262 (21.4%) | $35,000 |
| Average | 1,225 (100.0%) | $52,750 |
Occupancy by Householder Income Bracket in Edwards County
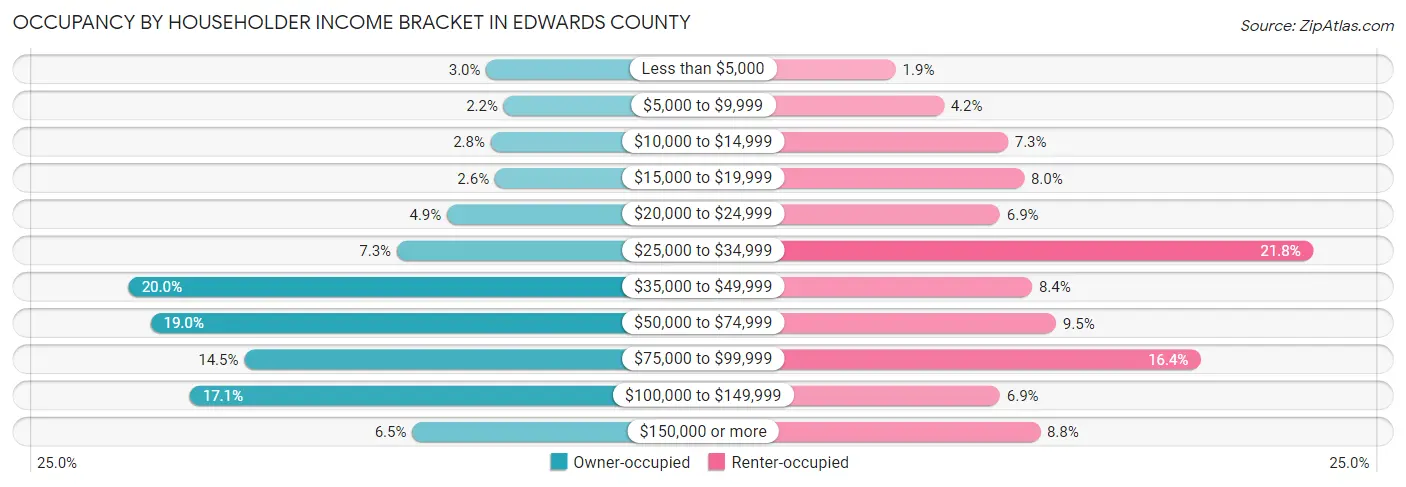
| Income Bracket | Owner-occupied | Renter-occupied |
| Less than $5,000 | 29 (3.0%) | 5 (1.9%) |
| $5,000 to $9,999 | 21 (2.2%) | 11 (4.2%) |
| $10,000 to $14,999 | 27 (2.8%) | 19 (7.2%) |
| $15,000 to $19,999 | 25 (2.6%) | 21 (8.0%) |
| $20,000 to $24,999 | 47 (4.9%) | 18 (6.9%) |
| $25,000 to $34,999 | 70 (7.3%) | 57 (21.8%) |
| $35,000 to $49,999 | 193 (20.0%) | 22 (8.4%) |
| $50,000 to $74,999 | 183 (19.0%) | 25 (9.5%) |
| $75,000 to $99,999 | 140 (14.5%) | 43 (16.4%) |
| $100,000 to $149,999 | 165 (17.1%) | 18 (6.9%) |
| $150,000 or more | 63 (6.5%) | 23 (8.8%) |
| Total | 963 (100.0%) | 262 (100.0%) |
Monthly Housing Cost Tiers in Edwards County
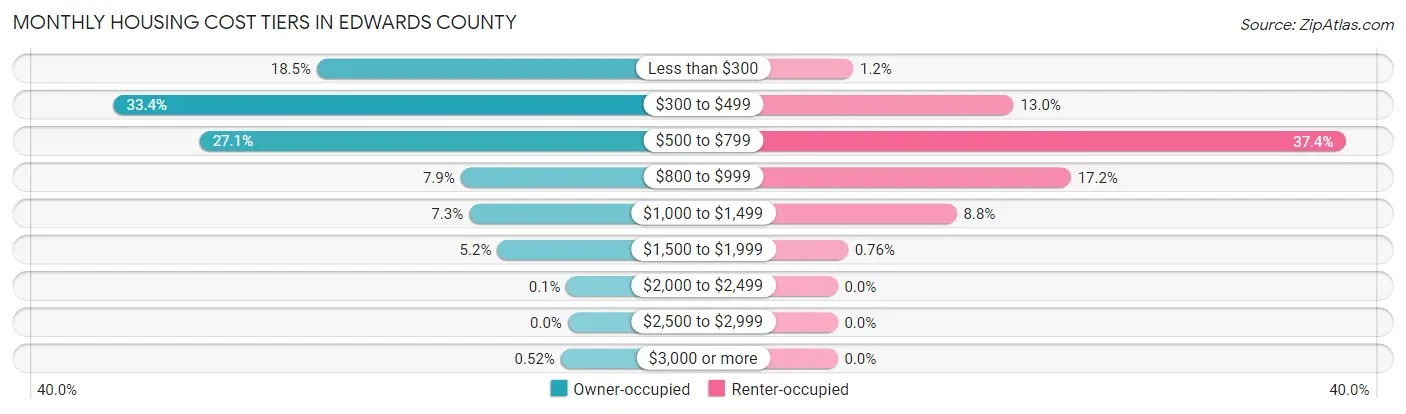
| Monthly Cost | Owner-occupied | Renter-occupied |
| Less than $300 | 178 (18.5%) | 3 (1.1%) |
| $300 to $499 | 322 (33.4%) | 34 (13.0%) |
| $500 to $799 | 261 (27.1%) | 98 (37.4%) |
| $800 to $999 | 76 (7.9%) | 45 (17.2%) |
| $1,000 to $1,499 | 70 (7.3%) | 23 (8.8%) |
| $1,500 to $1,999 | 50 (5.2%) | 2 (0.8%) |
| $2,000 to $2,499 | 1 (0.1%) | 0 (0.0%) |
| $2,500 to $2,999 | 0 (0.0%) | 0 (0.0%) |
| $3,000 or more | 5 (0.5%) | 0 (0.0%) |
| Total | 963 (100.0%) | 262 (100.0%) |
Physical Housing Characteristics in Edwards County
Housing Structures in Edwards County
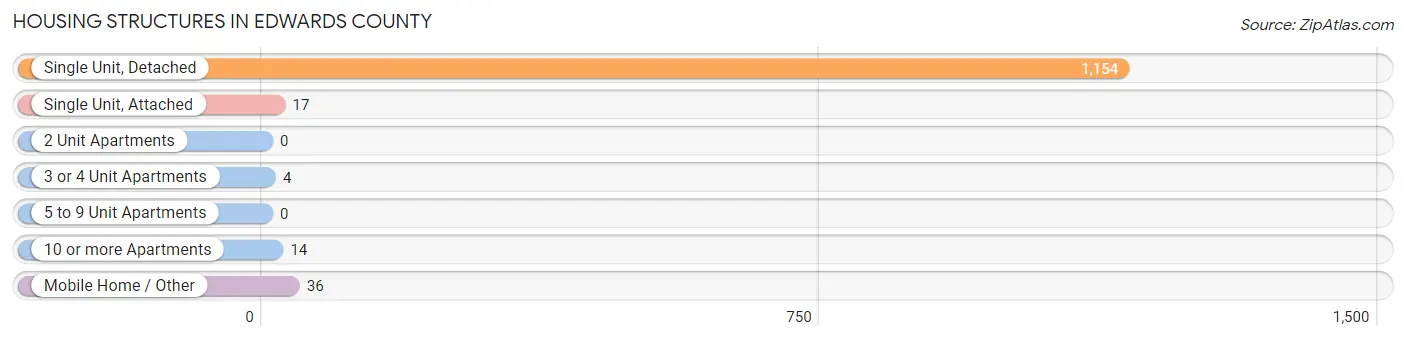
| Structure Type | # Housing Units | % Housing Units |
| Single Unit, Detached | 1,154 | 94.2% |
| Single Unit, Attached | 17 | 1.4% |
| 2 Unit Apartments | 0 | 0.0% |
| 3 or 4 Unit Apartments | 4 | 0.3% |
| 5 to 9 Unit Apartments | 0 | 0.0% |
| 10 or more Apartments | 14 | 1.1% |
| Mobile Home / Other | 36 | 2.9% |
| Total | 1,225 | 100.0% |
Housing Structures by Occupancy in Edwards County
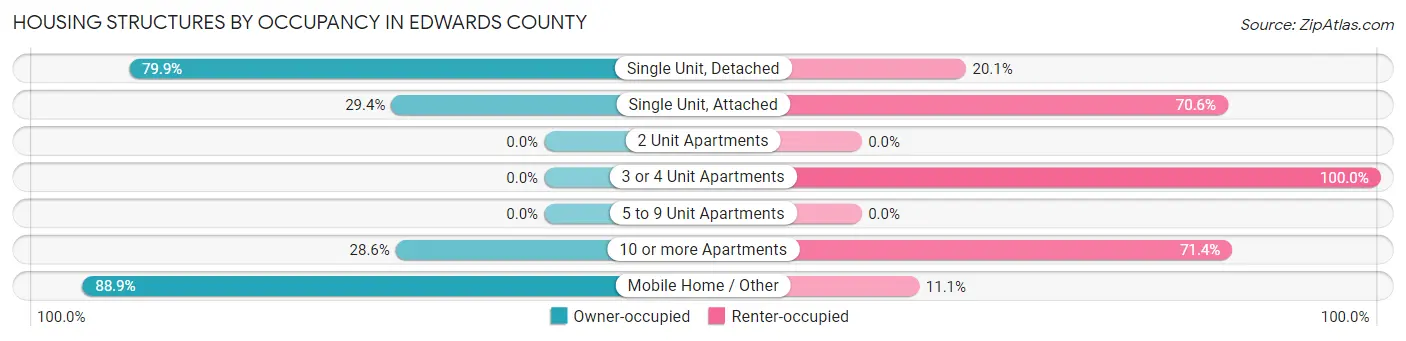
| Structure Type | Owner-occupied | Renter-occupied |
| Single Unit, Detached | 922 (79.9%) | 232 (20.1%) |
| Single Unit, Attached | 5 (29.4%) | 12 (70.6%) |
| 2 Unit Apartments | 0 (0.0%) | 0 (0.0%) |
| 3 or 4 Unit Apartments | 0 (0.0%) | 4 (100.0%) |
| 5 to 9 Unit Apartments | 0 (0.0%) | 0 (0.0%) |
| 10 or more Apartments | 4 (28.6%) | 10 (71.4%) |
| Mobile Home / Other | 32 (88.9%) | 4 (11.1%) |
| Total | 963 (78.6%) | 262 (21.4%) |
Housing Structures by Number of Rooms in Edwards County
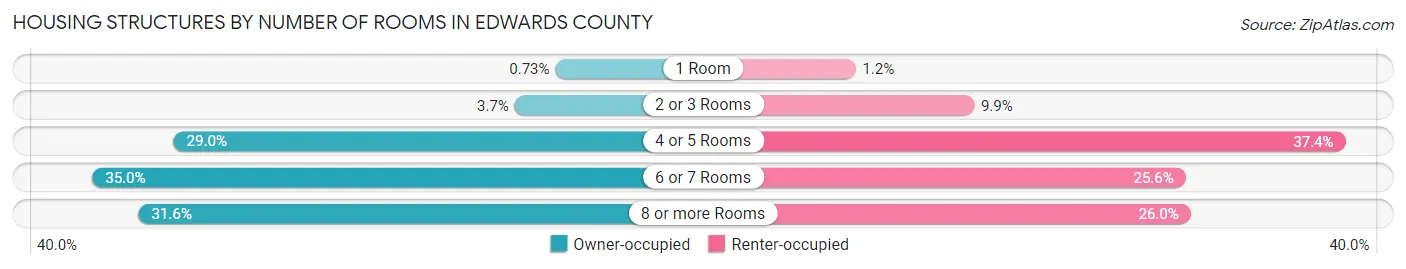
| Number of Rooms | Owner-occupied | Renter-occupied |
| 1 Room | 7 (0.7%) | 3 (1.1%) |
| 2 or 3 Rooms | 36 (3.7%) | 26 (9.9%) |
| 4 or 5 Rooms | 279 (29.0%) | 98 (37.4%) |
| 6 or 7 Rooms | 337 (35.0%) | 67 (25.6%) |
| 8 or more Rooms | 304 (31.6%) | 68 (26.0%) |
| Total | 963 (100.0%) | 262 (100.0%) |
Housing Structure by Heating Type in Edwards County
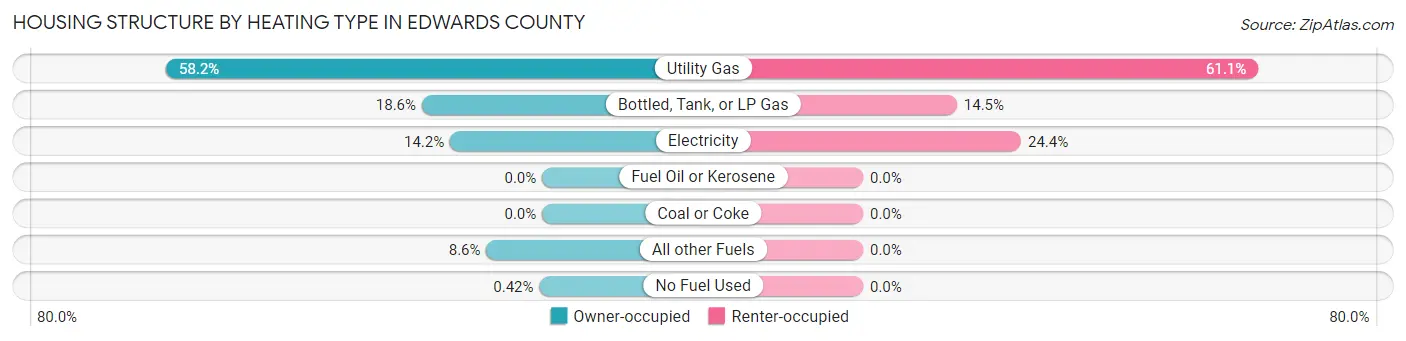
| Heating Type | Owner-occupied | Renter-occupied |
| Utility Gas | 560 (58.2%) | 160 (61.1%) |
| Bottled, Tank, or LP Gas | 179 (18.6%) | 38 (14.5%) |
| Electricity | 137 (14.2%) | 64 (24.4%) |
| Fuel Oil or Kerosene | 0 (0.0%) | 0 (0.0%) |
| Coal or Coke | 0 (0.0%) | 0 (0.0%) |
| All other Fuels | 83 (8.6%) | 0 (0.0%) |
| No Fuel Used | 4 (0.4%) | 0 (0.0%) |
| Total | 963 (100.0%) | 262 (100.0%) |
Household Vehicle Usage in Edwards County
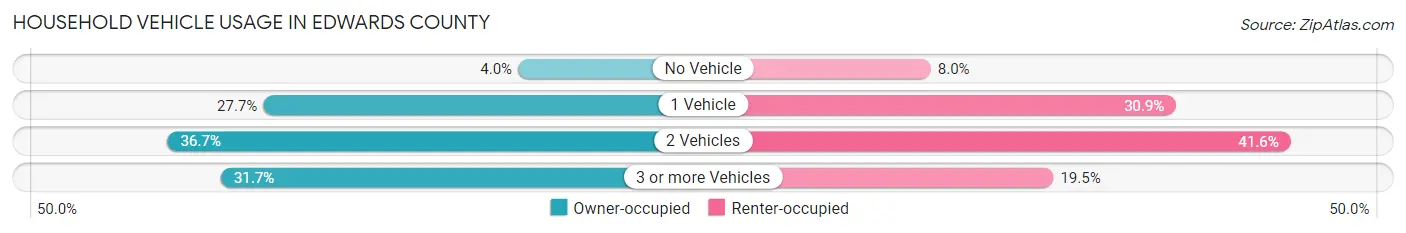
| Vehicles per Household | Owner-occupied | Renter-occupied |
| No Vehicle | 38 (4.0%) | 21 (8.0%) |
| 1 Vehicle | 267 (27.7%) | 81 (30.9%) |
| 2 Vehicles | 353 (36.7%) | 109 (41.6%) |
| 3 or more Vehicles | 305 (31.7%) | 51 (19.5%) |
| Total | 963 (100.0%) | 262 (100.0%) |
Real Estate & Mortgages in Edwards County
Real Estate and Mortgage Overview in Edwards County
| Characteristic | Without Mortgage | With Mortgage |
| Housing Units | 716 | 247 |
| Median Property Value | $54,100 | $78,300 |
| Median Household Income | $51,346 | $27 |
| Monthly Housing Costs | $422 | $1 |
| Real Estate Taxes | $1,056 | $20 |
Property Value by Mortgage Status in Edwards County
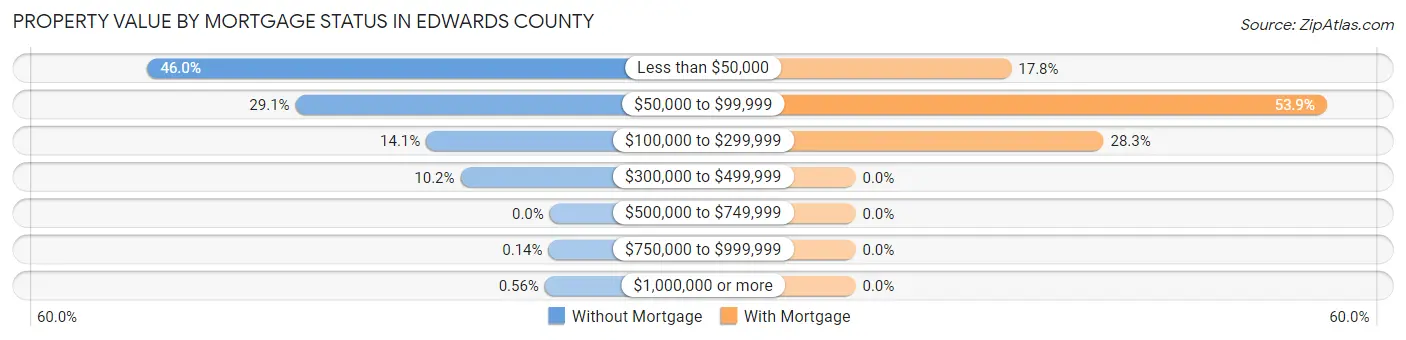
| Property Value | Without Mortgage | With Mortgage |
| Less than $50,000 | 329 (46.0%) | 44 (17.8%) |
| $50,000 to $99,999 | 208 (29.0%) | 133 (53.8%) |
| $100,000 to $299,999 | 101 (14.1%) | 70 (28.3%) |
| $300,000 to $499,999 | 73 (10.2%) | 0 (0.0%) |
| $500,000 to $749,999 | 0 (0.0%) | 0 (0.0%) |
| $750,000 to $999,999 | 1 (0.1%) | 0 (0.0%) |
| $1,000,000 or more | 4 (0.6%) | 0 (0.0%) |
| Total | 716 (100.0%) | 247 (100.0%) |
Household Income by Mortgage Status in Edwards County
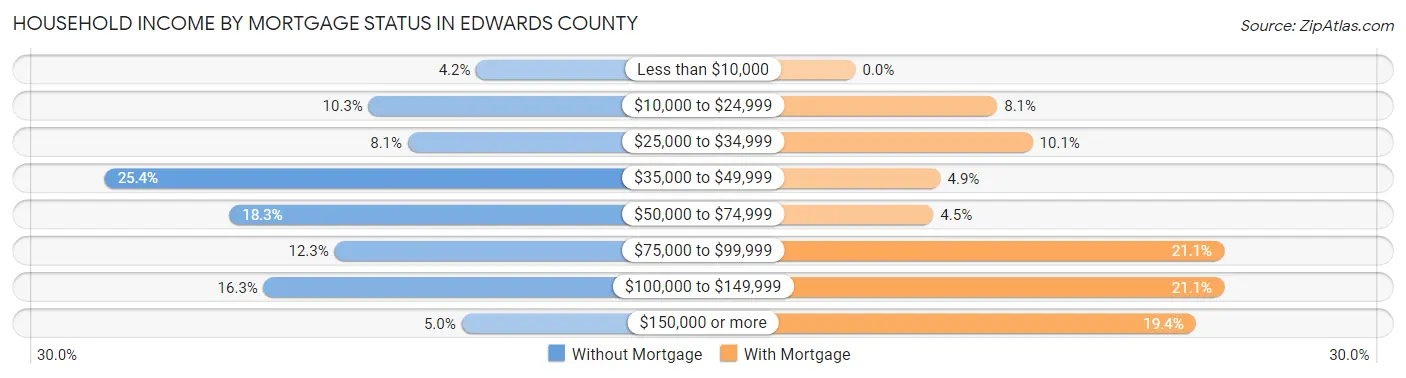
| Household Income | Without Mortgage | With Mortgage |
| Less than $10,000 | 30 (4.2%) | 0 (0.0%) |
| $10,000 to $24,999 | 74 (10.3%) | 20 (8.1%) |
| $25,000 to $34,999 | 58 (8.1%) | 25 (10.1%) |
| $35,000 to $49,999 | 182 (25.4%) | 12 (4.9%) |
| $50,000 to $74,999 | 131 (18.3%) | 11 (4.4%) |
| $75,000 to $99,999 | 88 (12.3%) | 52 (21.0%) |
| $100,000 to $149,999 | 117 (16.3%) | 52 (21.0%) |
| $150,000 or more | 36 (5.0%) | 48 (19.4%) |
| Total | 716 (100.0%) | 247 (100.0%) |
Property Value to Household Income Ratio in Edwards County
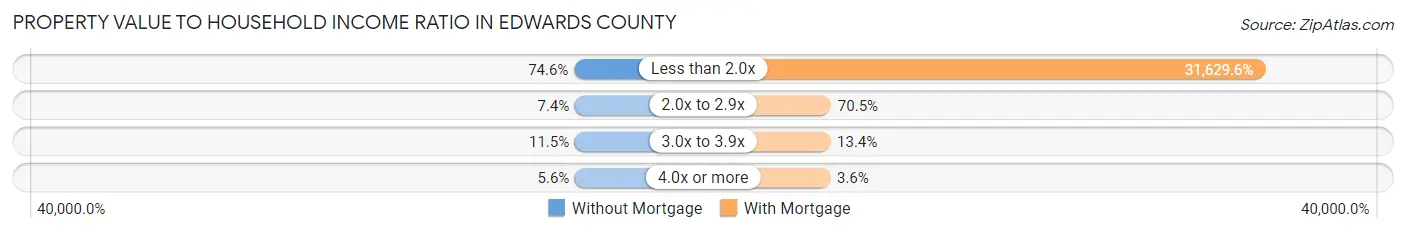
| Value-to-Income Ratio | Without Mortgage | With Mortgage |
| Less than 2.0x | 534 (74.6%) | 78,125 (31,629.6%) |
| 2.0x to 2.9x | 53 (7.4%) | 174 (70.5%) |
| 3.0x to 3.9x | 82 (11.5%) | 33 (13.4%) |
| 4.0x or more | 40 (5.6%) | 9 (3.6%) |
| Total | 716 (100.0%) | 247 (100.0%) |
Real Estate Taxes by Mortgage Status in Edwards County
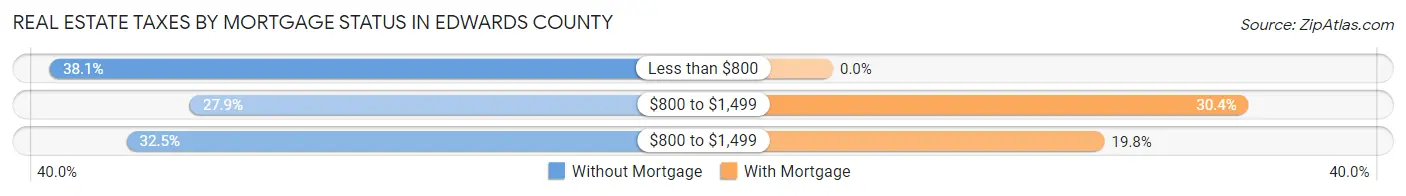
| Property Taxes | Without Mortgage | With Mortgage |
| Less than $800 | 273 (38.1%) | 0 (0.0%) |
| $800 to $1,499 | 200 (27.9%) | 75 (30.4%) |
| $800 to $1,499 | 233 (32.5%) | 49 (19.8%) |
| Total | 716 (100.0%) | 247 (100.0%) |
Health & Disability in Edwards County
Health Insurance Coverage by Age in Edwards County
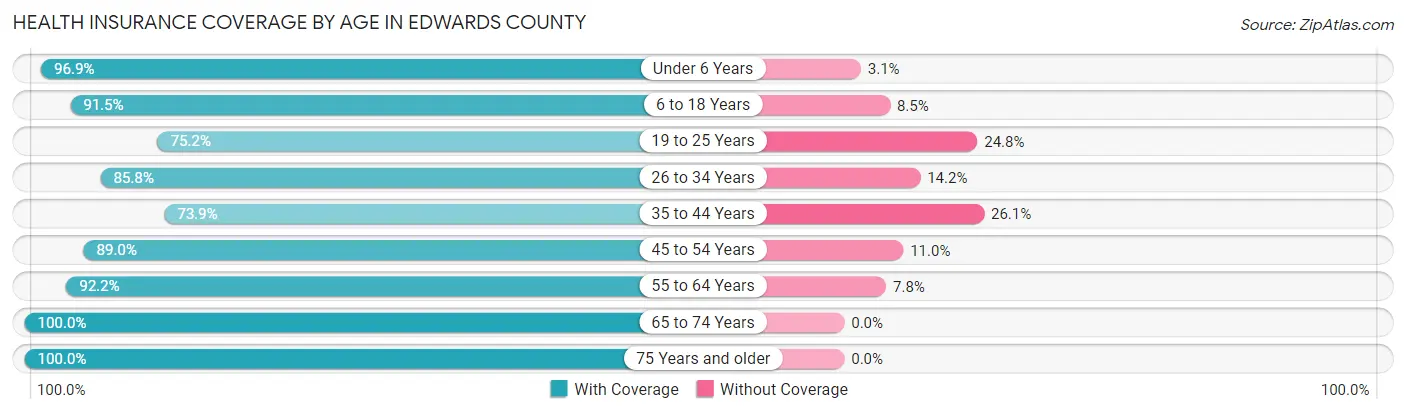
| Age Bracket | With Coverage | Without Coverage |
| Under 6 Years | 188 (96.9%) | 6 (3.1%) |
| 6 to 18 Years | 440 (91.5%) | 41 (8.5%) |
| 19 to 25 Years | 94 (75.2%) | 31 (24.8%) |
| 26 to 34 Years | 291 (85.8%) | 48 (14.2%) |
| 35 to 44 Years | 227 (73.9%) | 80 (26.1%) |
| 45 to 54 Years | 243 (89.0%) | 30 (11.0%) |
| 55 to 64 Years | 438 (92.2%) | 37 (7.8%) |
| 65 to 74 Years | 327 (100.0%) | 0 (0.0%) |
| 75 Years and older | 254 (100.0%) | 0 (0.0%) |
| Total | 2,502 (90.2%) | 273 (9.8%) |
Health Insurance Coverage by Citizenship Status in Edwards County
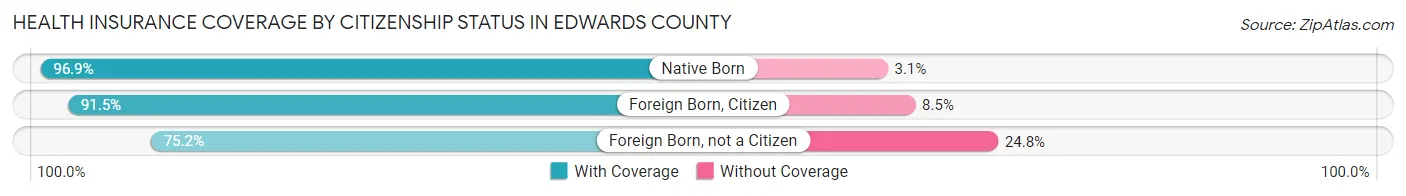
| Citizenship Status | With Coverage | Without Coverage |
| Native Born | 188 (96.9%) | 6 (3.1%) |
| Foreign Born, Citizen | 440 (91.5%) | 41 (8.5%) |
| Foreign Born, not a Citizen | 94 (75.2%) | 31 (24.8%) |
Health Insurance Coverage by Household Income in Edwards County
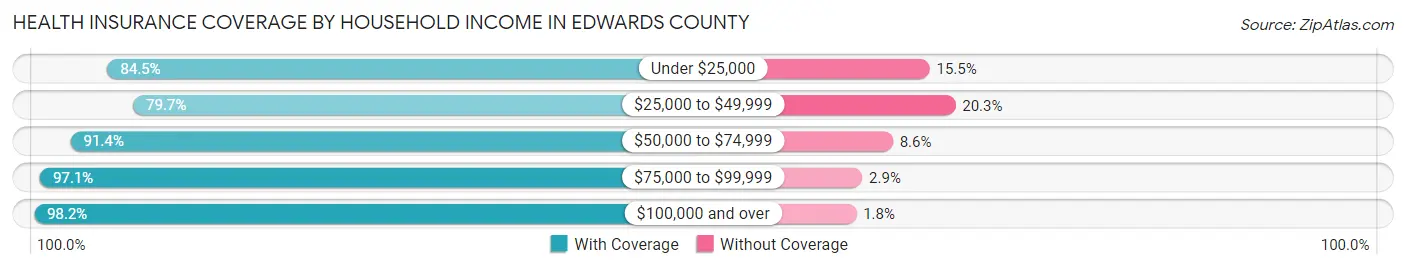
| Household Income | With Coverage | Without Coverage |
| Under $25,000 | 256 (84.5%) | 47 (15.5%) |
| $25,000 to $49,999 | 600 (79.7%) | 153 (20.3%) |
| $50,000 to $74,999 | 488 (91.4%) | 46 (8.6%) |
| $75,000 to $99,999 | 539 (97.1%) | 16 (2.9%) |
| $100,000 and over | 615 (98.2%) | 11 (1.8%) |
Public vs Private Health Insurance Coverage by Age in Edwards County
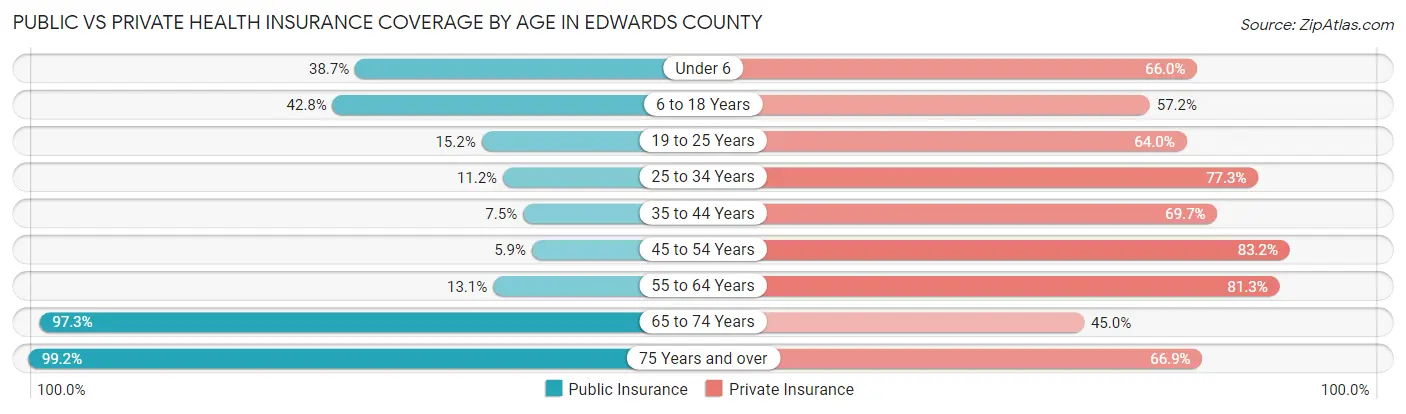
| Age Bracket | Public Insurance | Private Insurance |
| Under 6 | 75 (38.7%) | 128 (66.0%) |
| 6 to 18 Years | 206 (42.8%) | 275 (57.2%) |
| 19 to 25 Years | 19 (15.2%) | 80 (64.0%) |
| 25 to 34 Years | 38 (11.2%) | 262 (77.3%) |
| 35 to 44 Years | 23 (7.5%) | 214 (69.7%) |
| 45 to 54 Years | 16 (5.9%) | 227 (83.2%) |
| 55 to 64 Years | 62 (13.1%) | 386 (81.3%) |
| 65 to 74 Years | 318 (97.3%) | 147 (45.0%) |
| 75 Years and over | 252 (99.2%) | 170 (66.9%) |
| Total | 1,009 (36.4%) | 1,889 (68.1%) |
Disability Status by Sex by Age in Edwards County
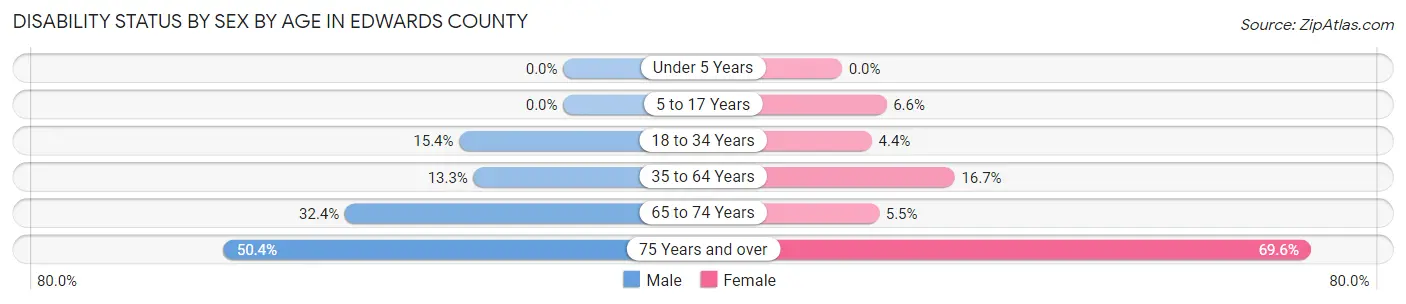
| Age Bracket | Male | Female |
| Under 5 Years | 0 (0.0%) | 0 (0.0%) |
| 5 to 17 Years | 0 (0.0%) | 17 (6.6%) |
| 18 to 34 Years | 42 (15.4%) | 10 (4.4%) |
| 35 to 64 Years | 68 (13.3%) | 91 (16.7%) |
| 65 to 74 Years | 47 (32.4%) | 10 (5.5%) |
| 75 Years and over | 60 (50.4%) | 94 (69.6%) |
Disability Class by Sex by Age in Edwards County
Disability Class: Hearing Difficulty
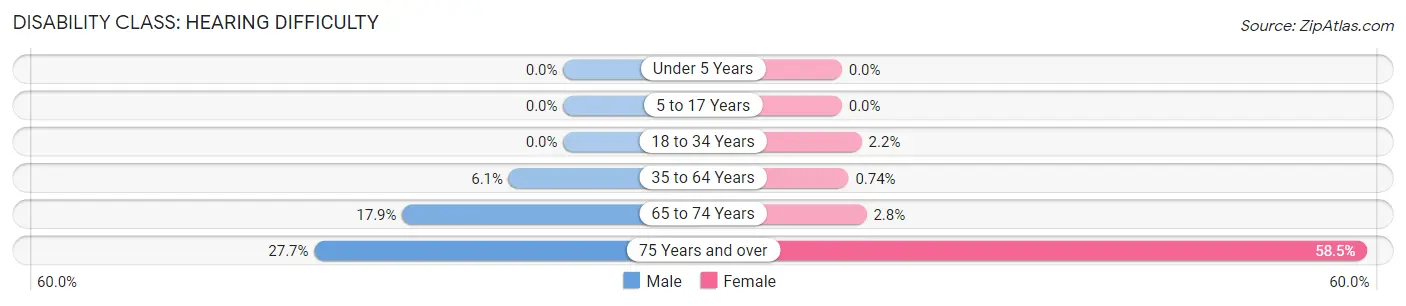
| Age Bracket | Male | Female |
| Under 5 Years | 0 (0.0%) | 0 (0.0%) |
| 5 to 17 Years | 0 (0.0%) | 0 (0.0%) |
| 18 to 34 Years | 0 (0.0%) | 5 (2.2%) |
| 35 to 64 Years | 31 (6.1%) | 4 (0.7%) |
| 65 to 74 Years | 26 (17.9%) | 5 (2.8%) |
| 75 Years and over | 33 (27.7%) | 79 (58.5%) |
Disability Class: Vision Difficulty
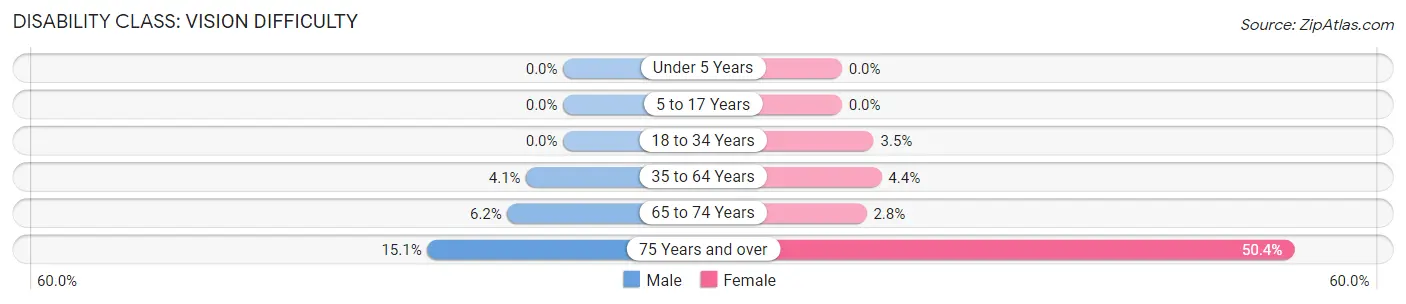
| Age Bracket | Male | Female |
| Under 5 Years | 0 (0.0%) | 0 (0.0%) |
| 5 to 17 Years | 0 (0.0%) | 0 (0.0%) |
| 18 to 34 Years | 0 (0.0%) | 8 (3.5%) |
| 35 to 64 Years | 21 (4.1%) | 24 (4.4%) |
| 65 to 74 Years | 9 (6.2%) | 5 (2.8%) |
| 75 Years and over | 18 (15.1%) | 68 (50.4%) |
Disability Class: Cognitive Difficulty
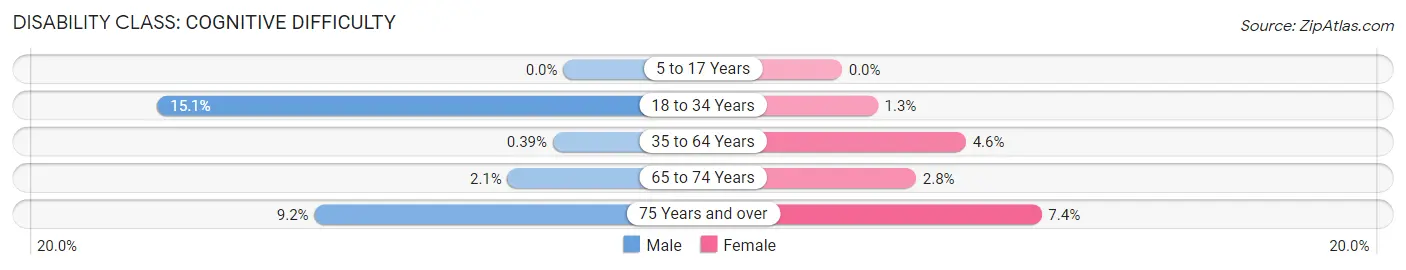
| Age Bracket | Male | Female |
| 5 to 17 Years | 0 (0.0%) | 0 (0.0%) |
| 18 to 34 Years | 41 (15.1%) | 3 (1.3%) |
| 35 to 64 Years | 2 (0.4%) | 25 (4.6%) |
| 65 to 74 Years | 3 (2.1%) | 5 (2.8%) |
| 75 Years and over | 11 (9.2%) | 10 (7.4%) |
Disability Class: Ambulatory Difficulty
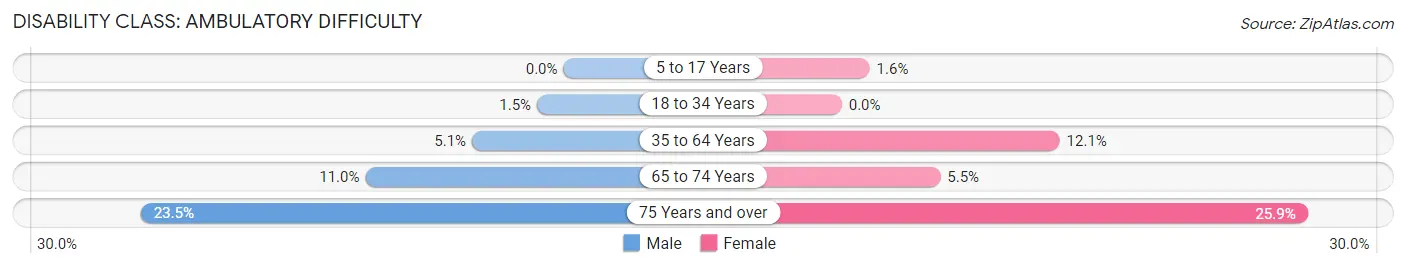
| Age Bracket | Male | Female |
| 5 to 17 Years | 0 (0.0%) | 4 (1.5%) |
| 18 to 34 Years | 4 (1.5%) | 0 (0.0%) |
| 35 to 64 Years | 26 (5.1%) | 66 (12.1%) |
| 65 to 74 Years | 16 (11.0%) | 10 (5.5%) |
| 75 Years and over | 28 (23.5%) | 35 (25.9%) |
Disability Class: Self-Care Difficulty
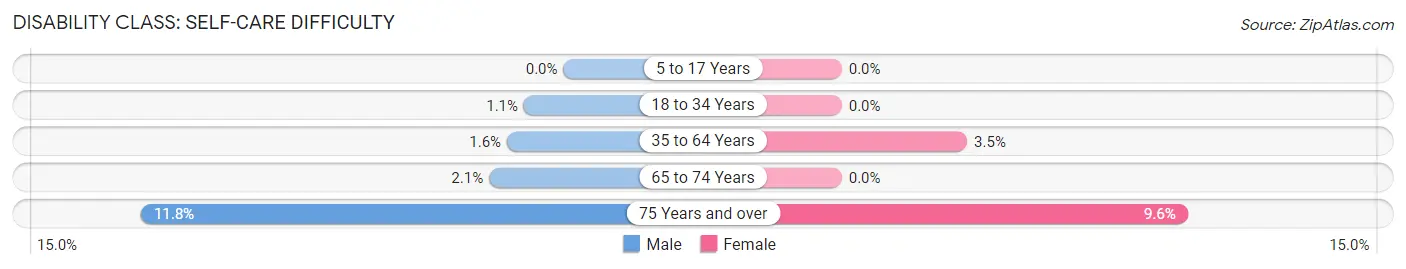
| Age Bracket | Male | Female |
| 5 to 17 Years | 0 (0.0%) | 0 (0.0%) |
| 18 to 34 Years | 3 (1.1%) | 0 (0.0%) |
| 35 to 64 Years | 8 (1.6%) | 19 (3.5%) |
| 65 to 74 Years | 3 (2.1%) | 0 (0.0%) |
| 75 Years and over | 14 (11.8%) | 13 (9.6%) |
Technology Access in Edwards County
Computing Device Access in Edwards County
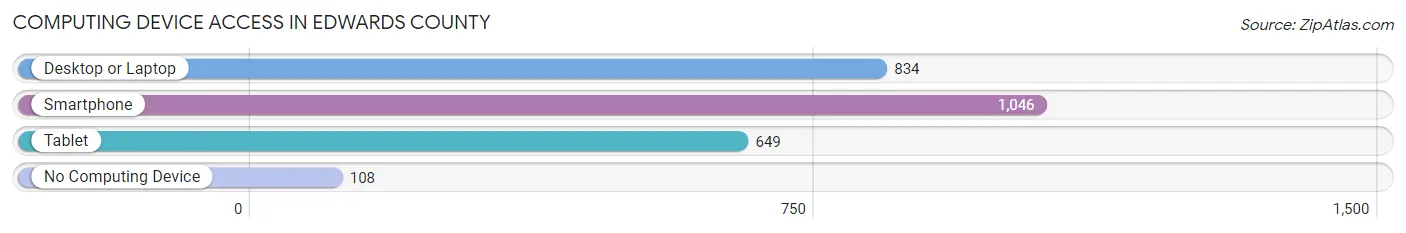
| Device Type | # Households | % Households |
| Desktop or Laptop | 834 | 68.1% |
| Smartphone | 1,046 | 85.4% |
| Tablet | 649 | 53.0% |
| No Computing Device | 108 | 8.8% |
| Total | 1,225 | 100.0% |
Internet Access in Edwards County
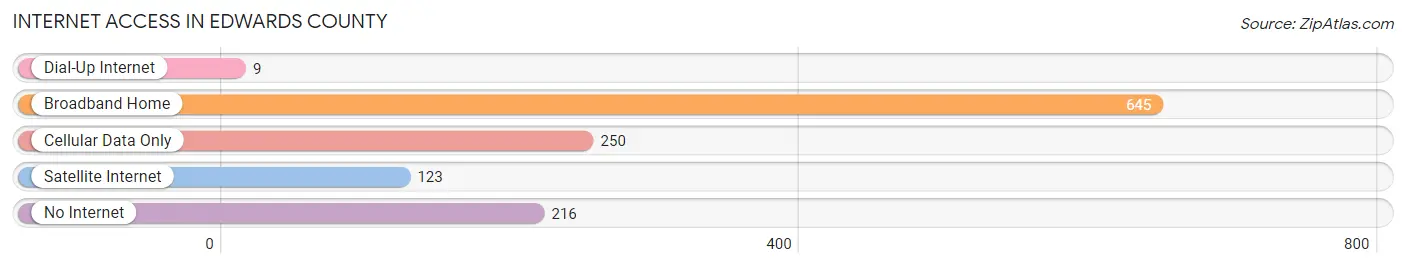
| Internet Type | # Households | % Households |
| Dial-Up Internet | 9 | 0.7% |
| Broadband Home | 645 | 52.6% |
| Cellular Data Only | 250 | 20.4% |
| Satellite Internet | 123 | 10.0% |
| No Internet | 216 | 17.6% |
| Total | 1,225 | 100.0% |
Edwards County Summary
Edwards County is located in the southwestern corner of Kansas, and is bordered by Pawnee County to the north, Stafford County to the east, Pratt County to the south, and Clark County to the west. The county seat is Kinsley, and the county has a total area of 876 square miles, of which 875 square miles is land and 1 square mile is water. As of the 2010 census, the population was 2,831, making it the second least populous county in Kansas.
History
Edwards County was established in 1874 and named after John Edwards, a prominent early settler. The first settlers arrived in the area in the late 1860s, and the county was officially organized in 1874. The county seat was originally located in Lewis, but was moved to Kinsley in 1876.
The county was largely agricultural in its early years, with wheat, corn, and sorghum being the main crops. The Santa Fe Railroad arrived in the county in 1887, and the town of Kinsley quickly became a major shipping point for grain and livestock. The county also had a thriving cattle industry, and by the early 1900s, the county was home to several large ranches.
Geography
Edwards County is located in the southwestern corner of Kansas, and is bordered by Pawnee County to the north, Stafford County to the east, Pratt County to the south, and Clark County to the west. The county has a total area of 876 square miles, of which 875 square miles is land and 1 square mile is water.
The county is mostly flat, with some rolling hills in the eastern part of the county. The Arkansas River flows through the county, and there are several small lakes and ponds scattered throughout the county. The county is mostly covered in grassland, with some areas of cropland and woodlands.
Economy
The economy of Edwards County is largely based on agriculture. The county is home to several large farms and ranches, and the main crops grown in the county are wheat, corn, sorghum, and hay. The county also has a thriving cattle industry, and is home to several large feedlots.
The county also has a small manufacturing sector, with several small factories producing a variety of products, including furniture, clothing, and food products. The county also has a small tourism industry, with several attractions, including the Edwards County Historical Museum and the Kinsley Public Library.
Demographics
As of the 2010 census, there were 2,831 people, 1,093 households, and 745 families living in the county. The population density was 3.2 people per square mile. The racial makeup of the county was 95.2% White, 0.7% Black or African American, 0.7% Native American, 0.2% Asian, 0.1% Pacific Islander, 1.7% from other races, and 1.4% from two or more races. Hispanic or Latino of any race were 4.2% of the population.
The median income for a household in the county was $37,917, and the median income for a family was $45,938. The per capita income for the county was $17,945. About 11.2% of families and 14.2% of the population were below the poverty line, including 17.2% of those under age 18 and 11.2% of those age 65 or over.
Common Questions
What is Per Capita Income in Edwards County?
Per Capita income in Edwards County is $31,368.
What is the Median Family Income in Edwards County?
Median Family Income in Edwards County is $76,989.
What is the Median Household income in Edwards County?
Median Household Income in Edwards County is $52,750.
What is Income or Wage Gap in Edwards County?
Income or Wage Gap in Edwards County is 32.8%.
Women in Edwards County earn 67.2 cents for every dollar earned by a man.
What is Inequality or Gini Index in Edwards County?
Inequality or Gini Index in Edwards County is 0.42.
What is the Total Population of Edwards County?
Total Population of Edwards County is 2,849.
What is the Total Male Population of Edwards County?
Total Male Population of Edwards County is 1,404.
What is the Total Female Population of Edwards County?
Total Female Population of Edwards County is 1,445.
What is the Ratio of Males per 100 Females in Edwards County?
There are 97.16 Males per 100 Females in Edwards County.
What is the Ratio of Females per 100 Males in Edwards County?
There are 102.92 Females per 100 Males in Edwards County.
What is the Median Population Age in Edwards County?
Median Population Age in Edwards County is 43.8 Years.
What is the Average Family Size in Edwards County
Average Family Size in Edwards County is 2.9 People.
What is the Average Household Size in Edwards County
Average Household Size in Edwards County is 2.3 People.
How Large is the Labor Force in Edwards County?
There are 1,415 People in the Labor Forcein in Edwards County.
What is the Percentage of People in the Labor Force in Edwards County?
62.2% of People are in the Labor Force in Edwards County.
What is the Unemployment Rate in Edwards County?
Unemployment Rate in Edwards County is 3.9%.