Doniphan County, KS Map & Demographics
Doniphan County Map
Doniphan County Overview
$31,314
PER CAPITA INCOME
$81,755
AVG FAMILY INCOME
$66,358
AVG HOUSEHOLD INCOME
35.4%
WAGE / INCOME GAP [ % ]
64.6¢/ $1
WAGE / INCOME GAP [ $ ]
0.42
INEQUALITY / GINI INDEX
7,501
TOTAL POPULATION
3,884
MALE POPULATION
3,617
FEMALE POPULATION
107.38
MALES / 100 FEMALES
93.13
FEMALES / 100 MALES
41.9
MEDIAN AGE
3.0
AVG FAMILY SIZE
2.5
AVG HOUSEHOLD SIZE
3,787
LABOR FORCE [ PEOPLE ]
60.8%
PERCENT IN LABOR FORCE
1.6%
UNEMPLOYMENT RATE
Income in Doniphan County
Income Overview in Doniphan County
Per Capita Income in Doniphan County is $31,314, while median incomes of families and households are $81,755 and $66,358 respectively.
| Characteristic | Number | Measure |
| Per Capita Income | 7,501 | $31,314 |
| Median Family Income | 1,873 | $81,755 |
| Mean Family Income | 1,873 | $90,152 |
| Median Household Income | 2,735 | $66,358 |
| Mean Household Income | 2,735 | $77,632 |
| Income Deficit | 1,873 | $0 |
| Wage / Income Gap (%) | 7,501 | 35.41% |
| Wage / Income Gap ($) | 7,501 | 64.59¢ per $1 |
| Gini / Inequality Index | 7,501 | 0.42 |
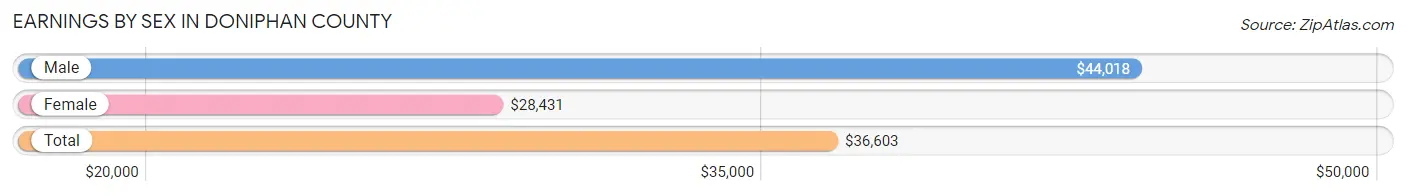
Earnings by Sex in Doniphan County
Average Earnings in Doniphan County are $36,603, $44,018 for men and $28,431 for women, a difference of 35.4%.
| Sex | Number | Average Earnings |
| Male | 2,197 (52.6%) | $44,018 |
| Female | 1,976 (47.3%) | $28,431 |
| Total | 4,173 (100.0%) | $36,603 |
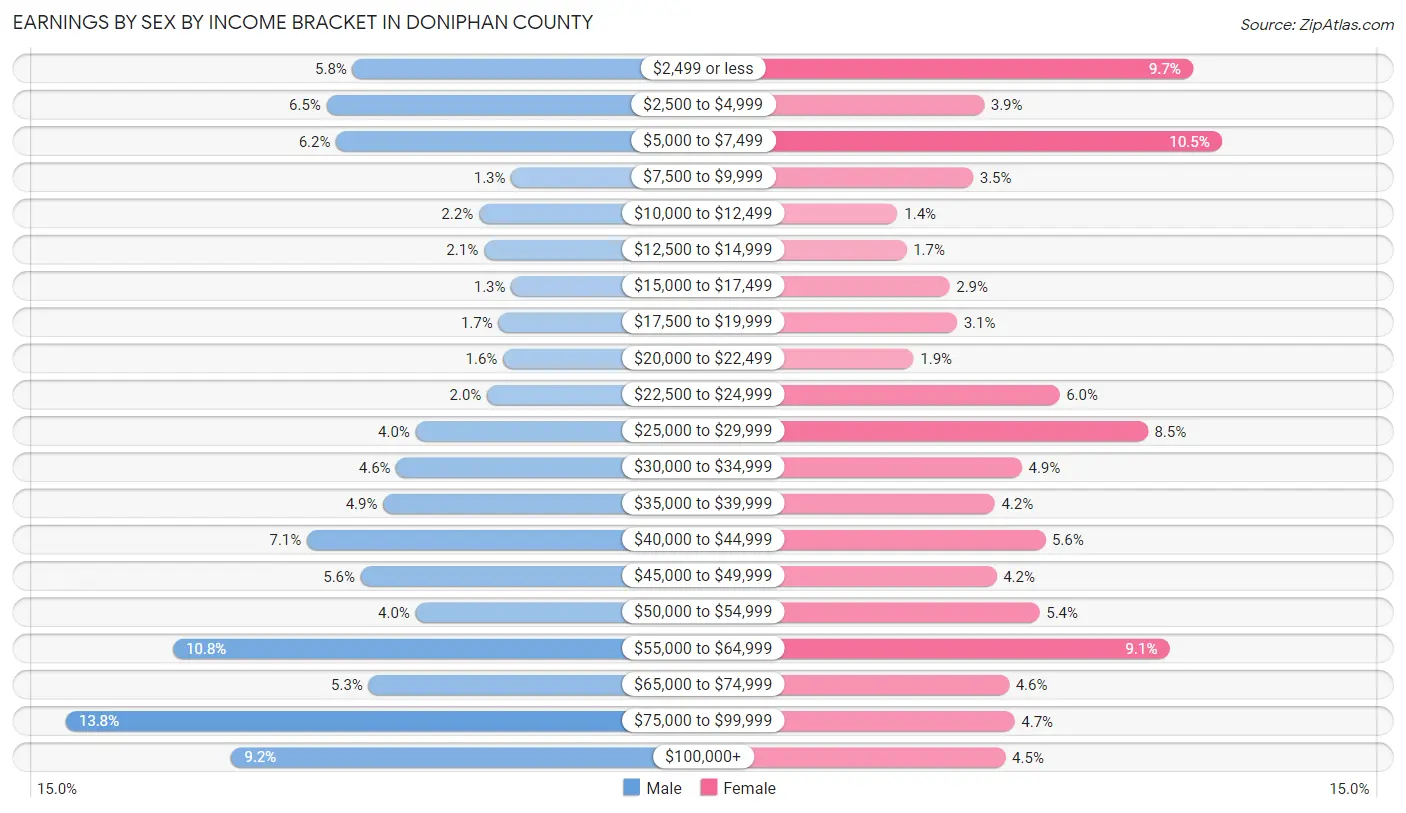
Earnings by Sex by Income Bracket in Doniphan County
The most common earnings brackets in Doniphan County are $75,000 to $99,999 for men (304 | 13.8%) and $5,000 to $7,499 for women (208 | 10.5%).
| Income | Male | Female |
| $2,499 or less | 127 (5.8%) | 192 (9.7%) |
| $2,500 to $4,999 | 143 (6.5%) | 76 (3.8%) |
| $5,000 to $7,499 | 137 (6.2%) | 208 (10.5%) |
| $7,500 to $9,999 | 29 (1.3%) | 70 (3.5%) |
| $10,000 to $12,499 | 49 (2.2%) | 28 (1.4%) |
| $12,500 to $14,999 | 46 (2.1%) | 33 (1.7%) |
| $15,000 to $17,499 | 29 (1.3%) | 57 (2.9%) |
| $17,500 to $19,999 | 37 (1.7%) | 61 (3.1%) |
| $20,000 to $22,499 | 34 (1.5%) | 37 (1.9%) |
| $22,500 to $24,999 | 44 (2.0%) | 118 (6.0%) |
| $25,000 to $29,999 | 88 (4.0%) | 167 (8.5%) |
| $30,000 to $34,999 | 100 (4.5%) | 97 (4.9%) |
| $35,000 to $39,999 | 108 (4.9%) | 82 (4.2%) |
| $40,000 to $44,999 | 155 (7.1%) | 110 (5.6%) |
| $45,000 to $49,999 | 122 (5.6%) | 83 (4.2%) |
| $50,000 to $54,999 | 88 (4.0%) | 107 (5.4%) |
| $55,000 to $64,999 | 238 (10.8%) | 179 (9.1%) |
| $65,000 to $74,999 | 117 (5.3%) | 90 (4.5%) |
| $75,000 to $99,999 | 304 (13.8%) | 93 (4.7%) |
| $100,000+ | 202 (9.2%) | 88 (4.4%) |
| Total | 2,197 (100.0%) | 1,976 (100.0%) |
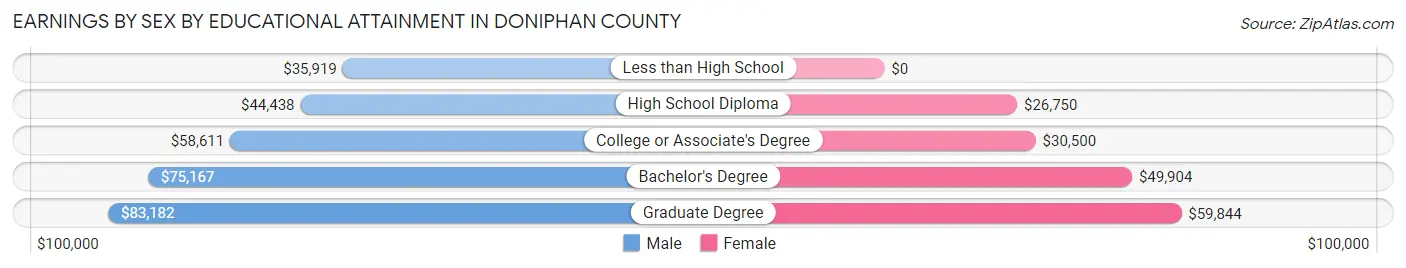
Earnings by Sex by Educational Attainment in Doniphan County
Average earnings in Doniphan County are $54,055 for men and $34,729 for women, a difference of 35.7%. Men with an educational attainment of graduate degree enjoy the highest average annual earnings of $83,182, while those with less than high school education earn the least with $35,919. Women with an educational attainment of graduate degree earn the most with the average annual earnings of $59,844, while those with high school diploma education have the smallest earnings of $26,750.
| Educational Attainment | Male Income | Female Income |
| Less than High School | $35,919 | $0 |
| High School Diploma | $44,438 | $26,750 |
| College or Associate's Degree | $58,611 | $30,500 |
| Bachelor's Degree | $75,167 | $49,904 |
| Graduate Degree | $83,182 | $59,844 |
| Total | $54,055 | $34,729 |
Family Income in Doniphan County
Family Income Brackets in Doniphan County
According to the Doniphan County family income data, there are 410 families falling into the $100,000 to $149,999 income range, which is the most common income bracket and makes up 21.9% of all families. Conversely, the $10,000 to $14,999 income bracket is the least frequent group with only 7 families (0.4%) belonging to this category.
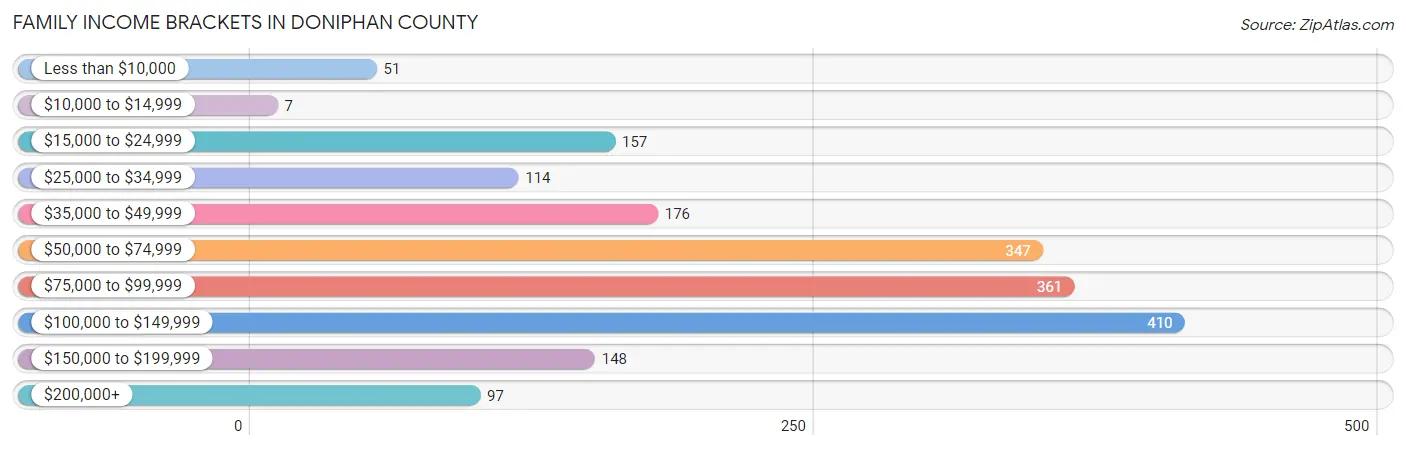
| Income Bracket | # Families | % Families |
| Less than $10,000 | 51 | 2.7% |
| $10,000 to $14,999 | 7 | 0.4% |
| $15,000 to $24,999 | 157 | 8.4% |
| $25,000 to $34,999 | 114 | 6.1% |
| $35,000 to $49,999 | 176 | 9.4% |
| $50,000 to $74,999 | 347 | 18.5% |
| $75,000 to $99,999 | 361 | 19.3% |
| $100,000 to $149,999 | 410 | 21.9% |
| $150,000 to $199,999 | 148 | 7.9% |
| $200,000+ | 97 | 5.2% |
Family Income by Famaliy Size in Doniphan County
5-person families (174 | 9.3%) account for the highest median family income in Doniphan County with $105,682 per family, while 2-person families (995 | 53.1%) have the highest median income of $35,304 per family member.
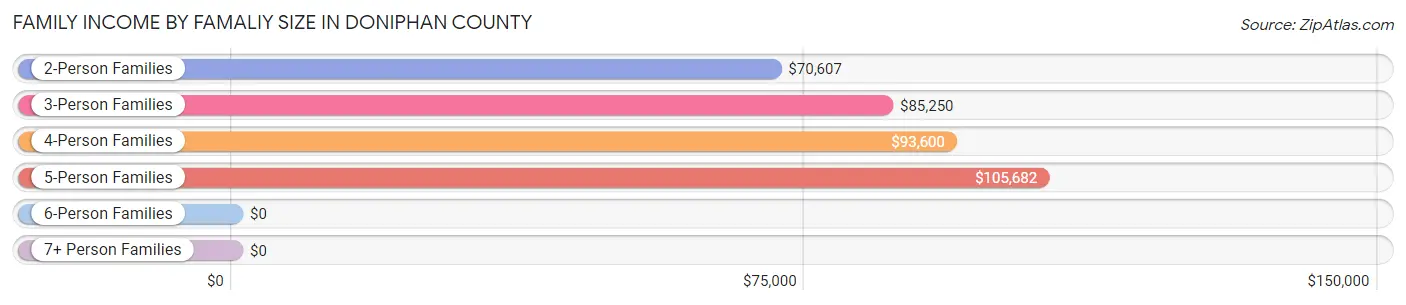
| Income Bracket | # Families | Median Income |
| 2-Person Families | 995 (53.1%) | $70,607 |
| 3-Person Families | 335 (17.9%) | $85,250 |
| 4-Person Families | 304 (16.2%) | $93,600 |
| 5-Person Families | 174 (9.3%) | $105,682 |
| 6-Person Families | 58 (3.1%) | $0 |
| 7+ Person Families | 7 (0.4%) | $0 |
| Total | 1,873 (100.0%) | $81,755 |
Family Income by Number of Earners in Doniphan County
The median family income in Doniphan County is $81,755, with families comprising 3+ earners (273) having the highest median family income of $115,139, while families with no earners (244) have the lowest median family income of $47,917, accounting for 14.6% and 13.0% of families, respectively.
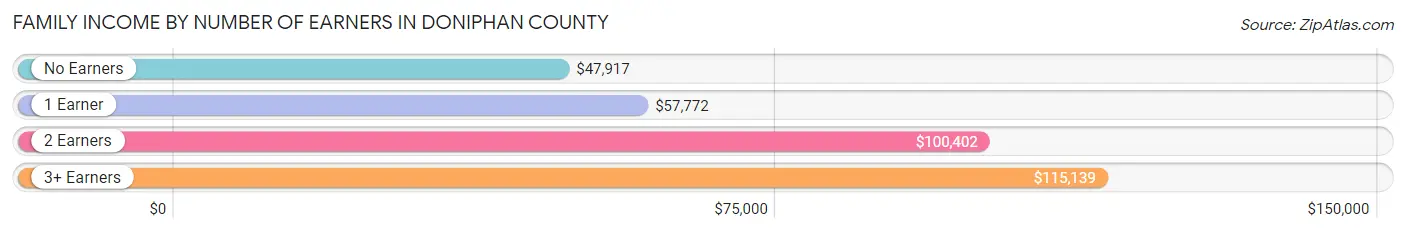
| Number of Earners | # Families | Median Income |
| No Earners | 244 (13.0%) | $47,917 |
| 1 Earner | 649 (34.6%) | $57,772 |
| 2 Earners | 707 (37.8%) | $100,402 |
| 3+ Earners | 273 (14.6%) | $115,139 |
| Total | 1,873 (100.0%) | $81,755 |
Household Income in Doniphan County
Household Income Brackets in Doniphan County
With 470 households falling in the category, the $100,000 to $149,999 income range is the most frequent in Doniphan County, accounting for 17.2% of all households. In contrast, only 77 households (2.8%) fall into the $10,000 to $14,999 income bracket, making it the least populous group.
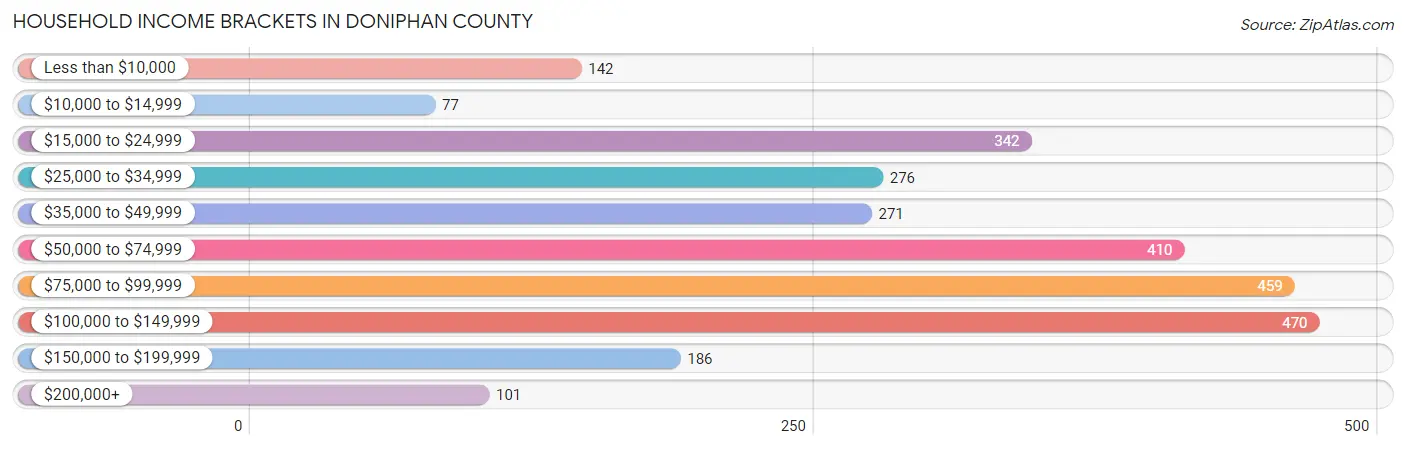
| Income Bracket | # Households | % Households |
| Less than $10,000 | 142 | 5.2% |
| $10,000 to $14,999 | 77 | 2.8% |
| $15,000 to $24,999 | 342 | 12.5% |
| $25,000 to $34,999 | 276 | 10.1% |
| $35,000 to $49,999 | 271 | 9.9% |
| $50,000 to $74,999 | 410 | 15.0% |
| $75,000 to $99,999 | 459 | 16.8% |
| $100,000 to $149,999 | 470 | 17.2% |
| $150,000 to $199,999 | 186 | 6.8% |
| $200,000+ | 101 | 3.7% |
Household Income by Householder Age in Doniphan County
The median household income in Doniphan County is $66,358, with the highest median household income of $98,269 found in the 25 to 44 years age bracket for the primary householder. A total of 704 households (25.7%) fall into this category. Meanwhile, the 65+ years age bracket for the primary householder has the lowest median household income of $38,047, with 987 households (36.1%) in this group.
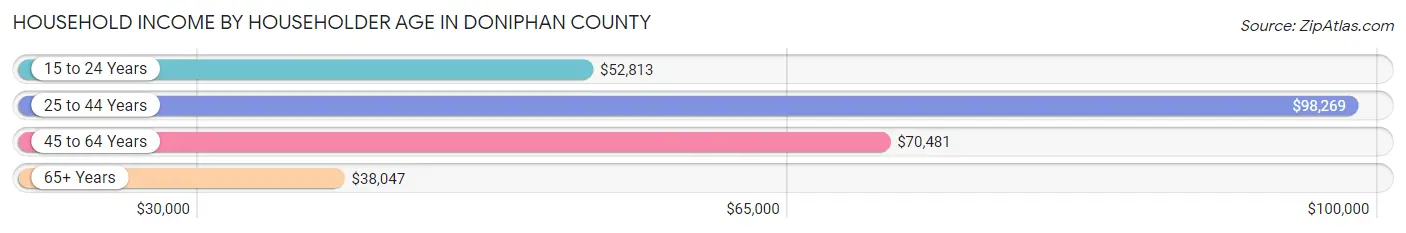
| Income Bracket | # Households | Median Income |
| 15 to 24 Years | 77 (2.8%) | $52,813 |
| 25 to 44 Years | 704 (25.7%) | $98,269 |
| 45 to 64 Years | 967 (35.4%) | $70,481 |
| 65+ Years | 987 (36.1%) | $38,047 |
| Total | 2,735 (100.0%) | $66,358 |
Poverty in Doniphan County
Income Below Poverty by Sex and Age in Doniphan County
With 8.6% poverty level for males and 14.3% for females among the residents of Doniphan County, 5 year old males and 65 to 74 year old females are the most vulnerable to poverty, with 11 males (16.4%) and 134 females (34.6%) in their respective age groups living below the poverty level.
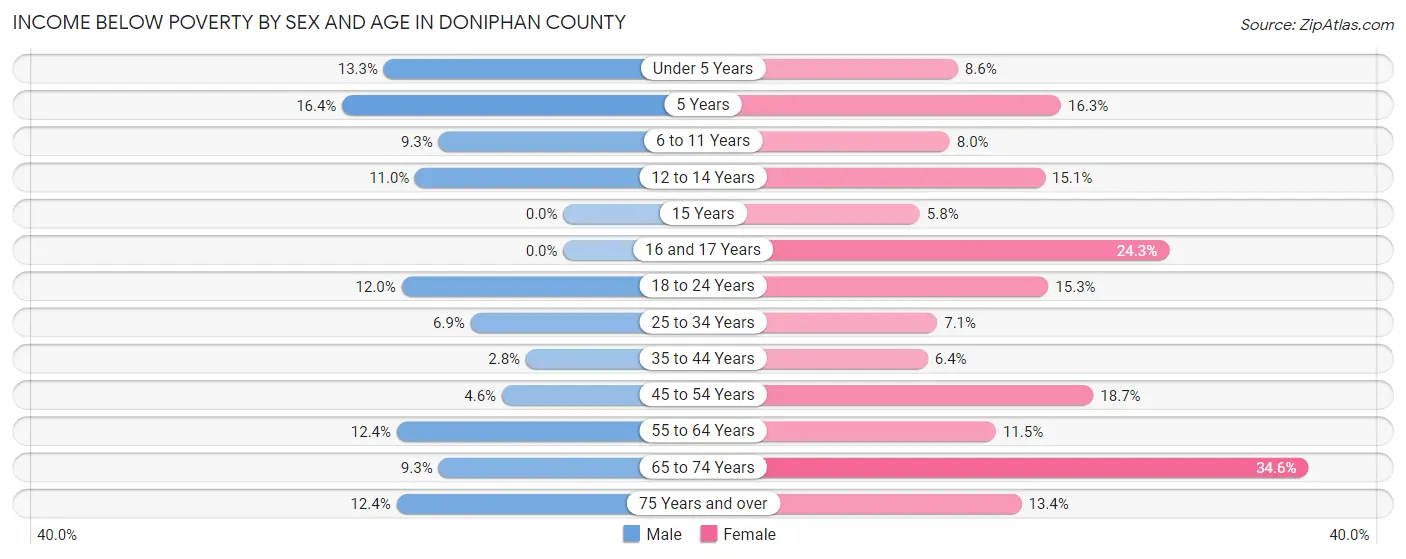
| Age Bracket | Male | Female |
| Under 5 Years | 24 (13.3%) | 15 (8.6%) |
| 5 Years | 11 (16.4%) | 7 (16.3%) |
| 6 to 11 Years | 20 (9.3%) | 21 (8.0%) |
| 12 to 14 Years | 11 (11.0%) | 16 (15.1%) |
| 15 Years | 0 (0.0%) | 4 (5.8%) |
| 16 and 17 Years | 0 (0.0%) | 17 (24.3%) |
| 18 to 24 Years | 34 (12.0%) | 27 (15.3%) |
| 25 to 34 Years | 26 (6.9%) | 27 (7.1%) |
| 35 to 44 Years | 11 (2.8%) | 26 (6.4%) |
| 45 to 54 Years | 19 (4.6%) | 82 (18.7%) |
| 55 to 64 Years | 65 (12.4%) | 57 (11.5%) |
| 65 to 74 Years | 42 (9.3%) | 134 (34.6%) |
| 75 Years and over | 29 (12.4%) | 43 (13.4%) |
| Total | 292 (8.6%) | 476 (14.3%) |
Income Above Poverty by Sex and Age in Doniphan County
According to the poverty statistics in Doniphan County, males aged 15 years and females aged 15 years are the age groups that are most secure financially, with 100.0% of males and 94.2% of females in these age groups living above the poverty line.
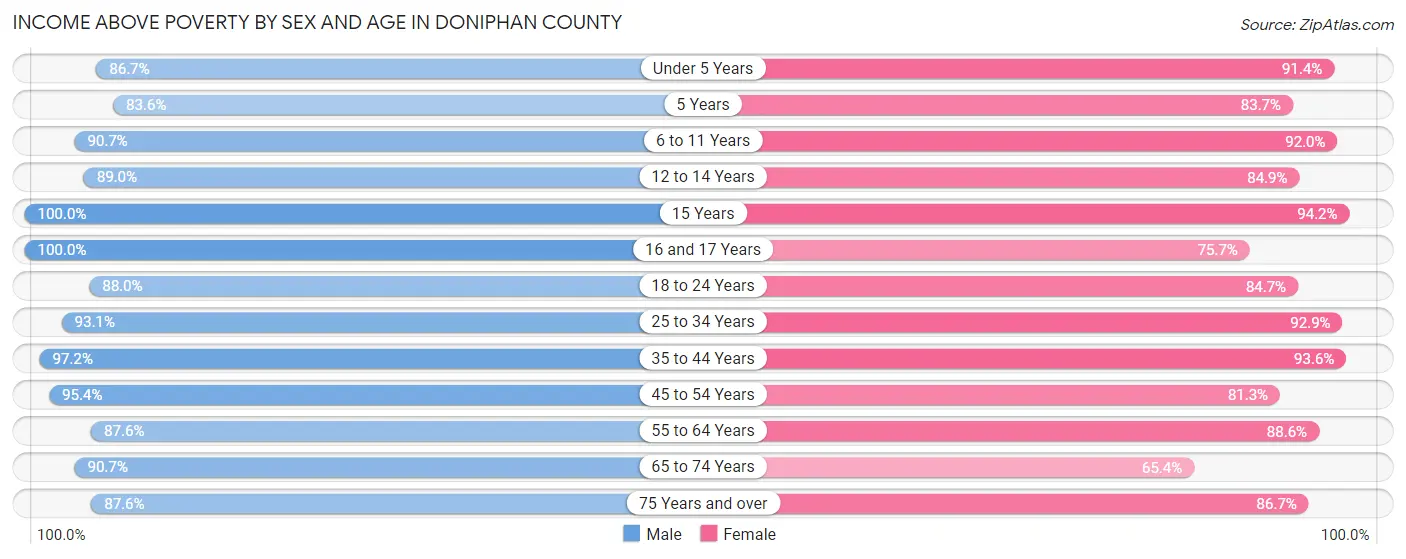
| Age Bracket | Male | Female |
| Under 5 Years | 156 (86.7%) | 159 (91.4%) |
| 5 Years | 56 (83.6%) | 36 (83.7%) |
| 6 to 11 Years | 196 (90.7%) | 241 (92.0%) |
| 12 to 14 Years | 89 (89.0%) | 90 (84.9%) |
| 15 Years | 17 (100.0%) | 65 (94.2%) |
| 16 and 17 Years | 116 (100.0%) | 53 (75.7%) |
| 18 to 24 Years | 249 (88.0%) | 149 (84.7%) |
| 25 to 34 Years | 352 (93.1%) | 354 (92.9%) |
| 35 to 44 Years | 385 (97.2%) | 381 (93.6%) |
| 45 to 54 Years | 398 (95.4%) | 357 (81.3%) |
| 55 to 64 Years | 461 (87.6%) | 441 (88.5%) |
| 65 to 74 Years | 411 (90.7%) | 253 (65.4%) |
| 75 Years and over | 205 (87.6%) | 279 (86.7%) |
| Total | 3,091 (91.4%) | 2,858 (85.7%) |
Income Below Poverty Among Married-Couple Families in Doniphan County
The poverty statistics for married-couple families in Doniphan County show that 12.2% or 186 of the total 1,518 families live below the poverty line. Families with 5 or more children have the highest poverty rate of 100.0%, comprising of 7 families. On the other hand, families with 1 or 2 children have the lowest poverty rate of 2.9%, which includes 11 families.
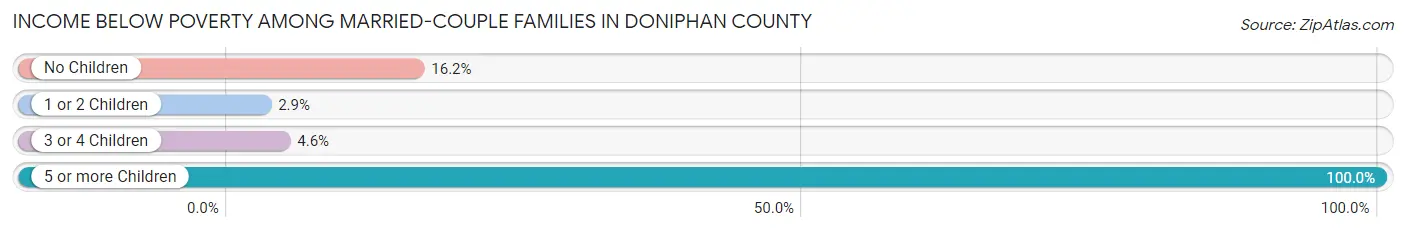
| Children | Above Poverty | Below Poverty |
| No Children | 837 (83.8%) | 162 (16.2%) |
| 1 or 2 Children | 369 (97.1%) | 11 (2.9%) |
| 3 or 4 Children | 126 (95.5%) | 6 (4.5%) |
| 5 or more Children | 0 (0.0%) | 7 (100.0%) |
| Total | 1,332 (87.7%) | 186 (12.2%) |
Income Below Poverty Among Single-Parent Households in Doniphan County
According to the poverty data in Doniphan County, 2.6% or 3 single-father households and 14.5% or 35 single-mother households are living below the poverty line. Among single-father households, those with no children have the highest poverty rate, with 3 households (7.1%) experiencing poverty. Likewise, among single-mother households, those with 3 or 4 children have the highest poverty rate, with 7 households (63.6%) falling below the poverty line.
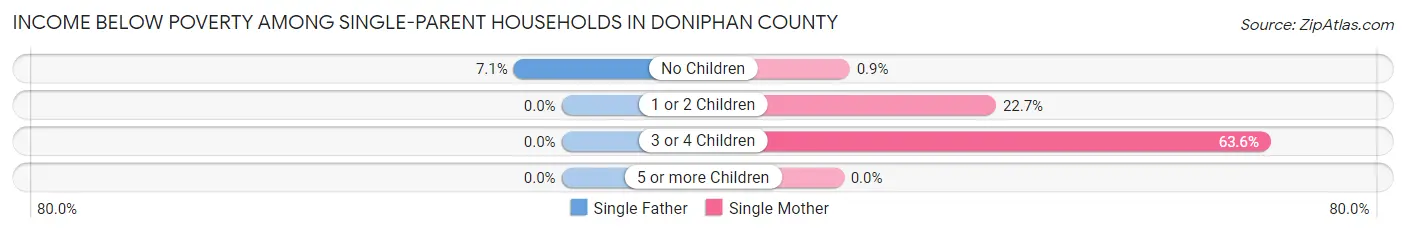
| Children | Single Father | Single Mother |
| No Children | 3 (7.1%) | 1 (0.9%) |
| 1 or 2 Children | 0 (0.0%) | 27 (22.7%) |
| 3 or 4 Children | 0 (0.0%) | 7 (63.6%) |
| 5 or more Children | 0 (0.0%) | 0 (0.0%) |
| Total | 3 (2.6%) | 35 (14.5%) |
Income Below Poverty Among Married-Couple vs Single-Parent Households in Doniphan County
The poverty data for Doniphan County shows that 186 of the married-couple family households (12.2%) and 38 of the single-parent households (10.7%) are living below the poverty level. Within the married-couple family households, those with 5 or more children have the highest poverty rate, with 7 households (100.0%) falling below the poverty line. Among the single-parent households, those with 3 or 4 children have the highest poverty rate, with 7 household (63.6%) living below poverty.
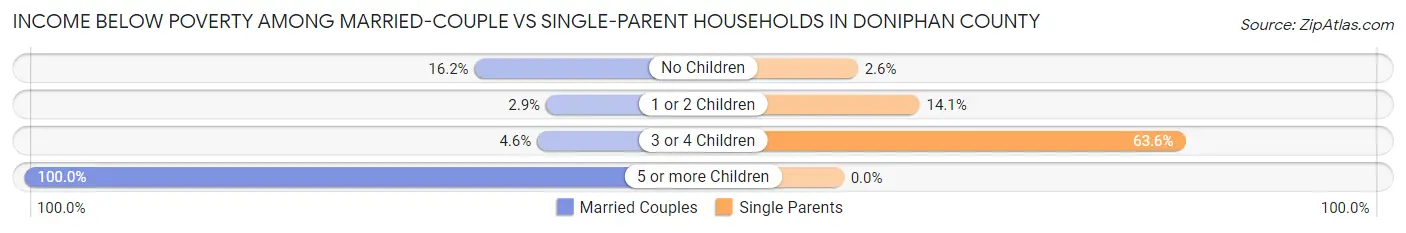
| Children | Married-Couple Families | Single-Parent Households |
| No Children | 162 (16.2%) | 4 (2.6%) |
| 1 or 2 Children | 11 (2.9%) | 27 (14.1%) |
| 3 or 4 Children | 6 (4.5%) | 7 (63.6%) |
| 5 or more Children | 7 (100.0%) | 0 (0.0%) |
| Total | 186 (12.2%) | 38 (10.7%) |
Race in Doniphan County
The most populous races in Doniphan County are White / Caucasian (6,830 | 91.0%), Black / African American (361 | 4.8%), and Two or more Races (240 | 3.2%).
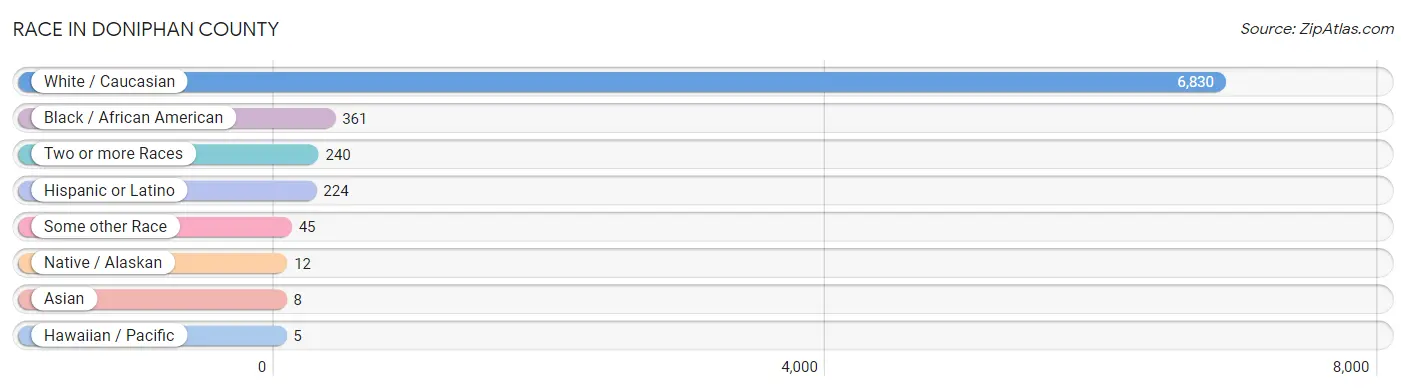
| Race | # Population | % Population |
| Asian | 8 | 0.1% |
| Black / African American | 361 | 4.8% |
| Hawaiian / Pacific | 5 | 0.1% |
| Hispanic or Latino | 224 | 3.0% |
| Native / Alaskan | 12 | 0.2% |
| White / Caucasian | 6,830 | 91.0% |
| Two or more Races | 240 | 3.2% |
| Some other Race | 45 | 0.6% |
| Total | 7,501 | 100.0% |
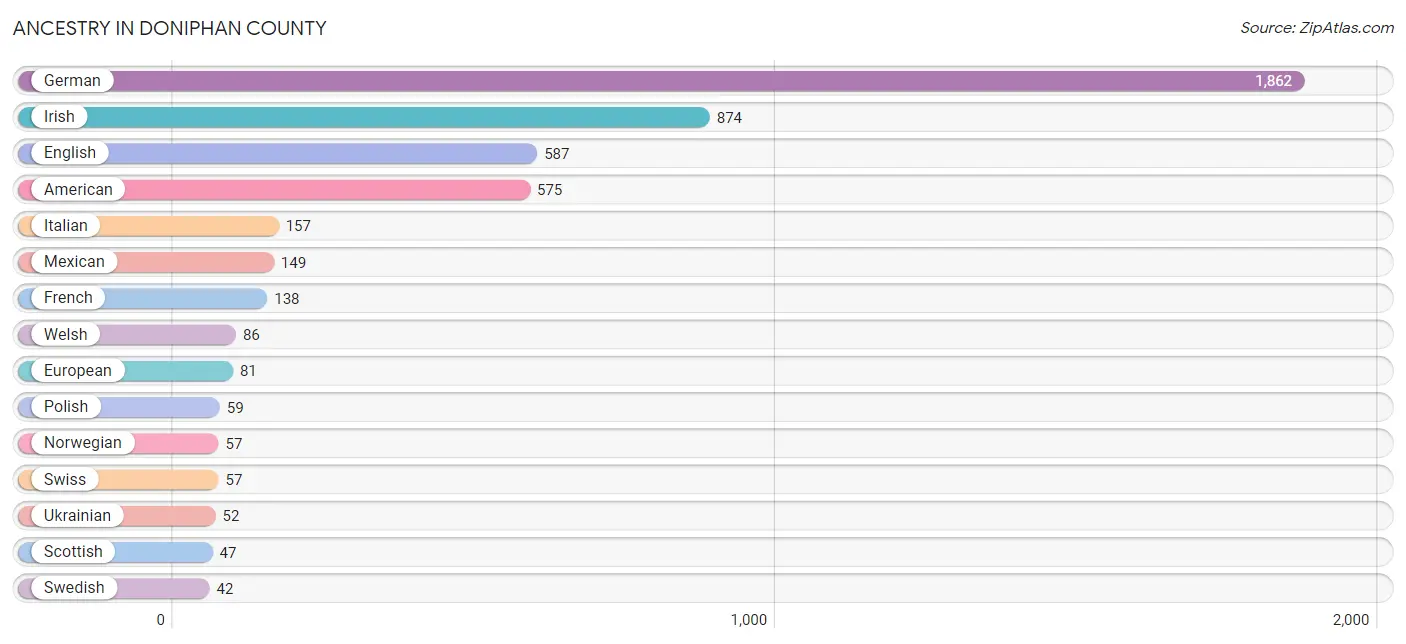
Ancestry in Doniphan County
The most populous ancestries reported in Doniphan County are German (1,862 | 24.8%), Irish (874 | 11.7%), English (587 | 7.8%), American (575 | 7.7%), and Italian (157 | 2.1%), together accounting for 54.1% of all Doniphan County residents.
| Ancestry | # Population | % Population |
| American | 575 | 7.7% |
| Arab | 9 | 0.1% |
| Australian | 11 | 0.2% |
| Bangladeshi | 1 | 0.0% |
| British | 38 | 0.5% |
| Central American | 5 | 0.1% |
| Central American Indian | 2 | 0.0% |
| Cherokee | 26 | 0.4% |
| Chilean | 2 | 0.0% |
| Chippewa | 2 | 0.0% |
| Choctaw | 1 | 0.0% |
| Czech | 6 | 0.1% |
| Danish | 34 | 0.4% |
| Delaware | 2 | 0.0% |
| Dominican | 33 | 0.4% |
| Dutch | 32 | 0.4% |
| Eastern European | 7 | 0.1% |
| English | 587 | 7.8% |
| European | 81 | 1.1% |
| French | 138 | 1.8% |
| French Canadian | 12 | 0.2% |
| German | 1,862 | 24.8% |
| Indian (Asian) | 7 | 0.1% |
| Iranian | 11 | 0.2% |
| Irish | 874 | 11.7% |
| Italian | 157 | 2.1% |
| Jamaican | 2 | 0.0% |
| Mexican | 149 | 2.0% |
| Native Hawaiian | 5 | 0.1% |
| Nigerian | 20 | 0.3% |
| Northern European | 5 | 0.1% |
| Norwegian | 57 | 0.8% |
| Osage | 31 | 0.4% |
| Panamanian | 5 | 0.1% |
| Pennsylvania German | 7 | 0.1% |
| Polish | 59 | 0.8% |
| Potawatomi | 4 | 0.1% |
| Puerto Rican | 31 | 0.4% |
| Russian | 36 | 0.5% |
| Scandinavian | 6 | 0.1% |
| Scotch-Irish | 40 | 0.5% |
| Scottish | 47 | 0.6% |
| Seminole | 4 | 0.1% |
| Sioux | 26 | 0.4% |
| Slavic | 7 | 0.1% |
| South American | 2 | 0.0% |
| Spaniard | 4 | 0.1% |
| Subsaharan African | 20 | 0.3% |
| Swedish | 42 | 0.6% |
| Swiss | 57 | 0.8% |
| Ukrainian | 52 | 0.7% |
| Welsh | 86 | 1.1% | View All 52 Rows |
Immigrants in Doniphan County
The most numerous immigrant groups reported in Doniphan County came from Latin America (46 | 0.6%), South America (38 | 0.5%), Asia (27 | 0.4%), Europe (21 | 0.3%), and Eastern Europe (17 | 0.2%), together accounting for 2.0% of all Doniphan County residents.
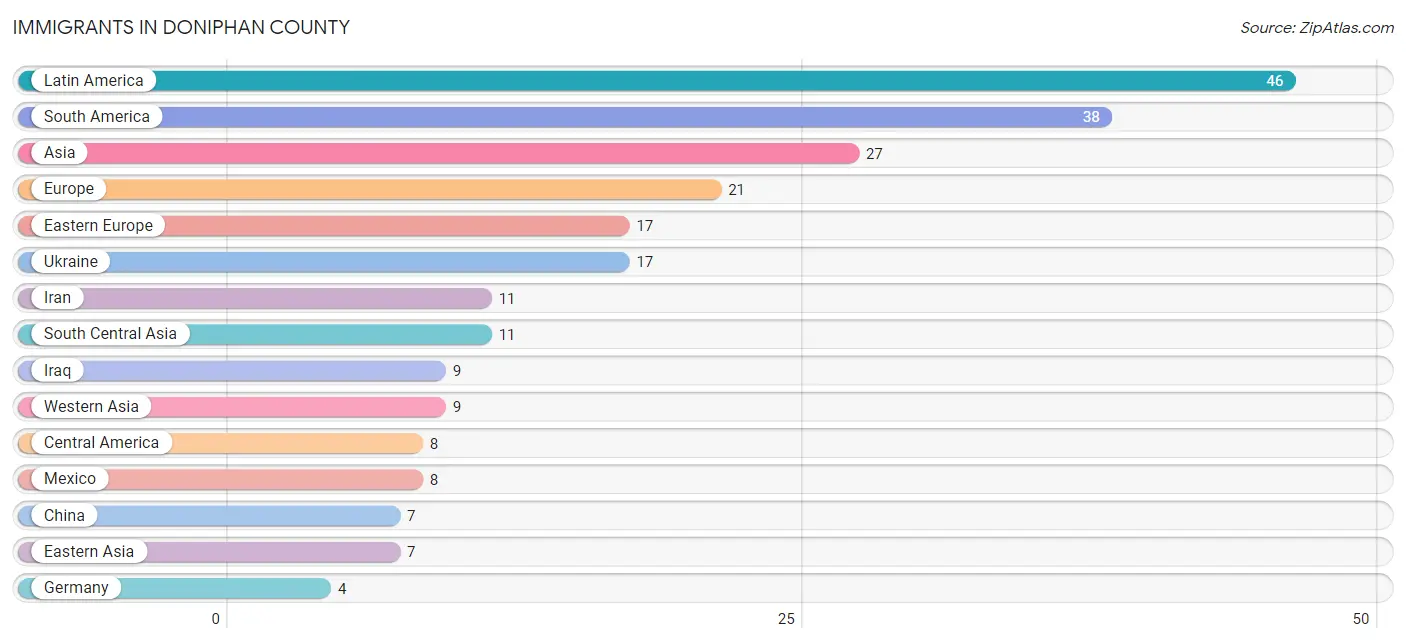
| Immigration Origin | # Population | % Population |
| Asia | 27 | 0.4% |
| Central America | 8 | 0.1% |
| China | 7 | 0.1% |
| Eastern Asia | 7 | 0.1% |
| Eastern Europe | 17 | 0.2% |
| Europe | 21 | 0.3% |
| Germany | 4 | 0.1% |
| Iran | 11 | 0.2% |
| Iraq | 9 | 0.1% |
| Latin America | 46 | 0.6% |
| Mexico | 8 | 0.1% |
| South America | 38 | 0.5% |
| South Central Asia | 11 | 0.2% |
| Ukraine | 17 | 0.2% |
| Western Asia | 9 | 0.1% |
| Western Europe | 4 | 0.1% | View All 16 Rows |
Sex and Age in Doniphan County
Sex and Age in Doniphan County
The most populous age groups in Doniphan County are 15 to 19 Years (470 | 12.1%) for men and 15 to 19 Years (341 | 9.4%) for women.
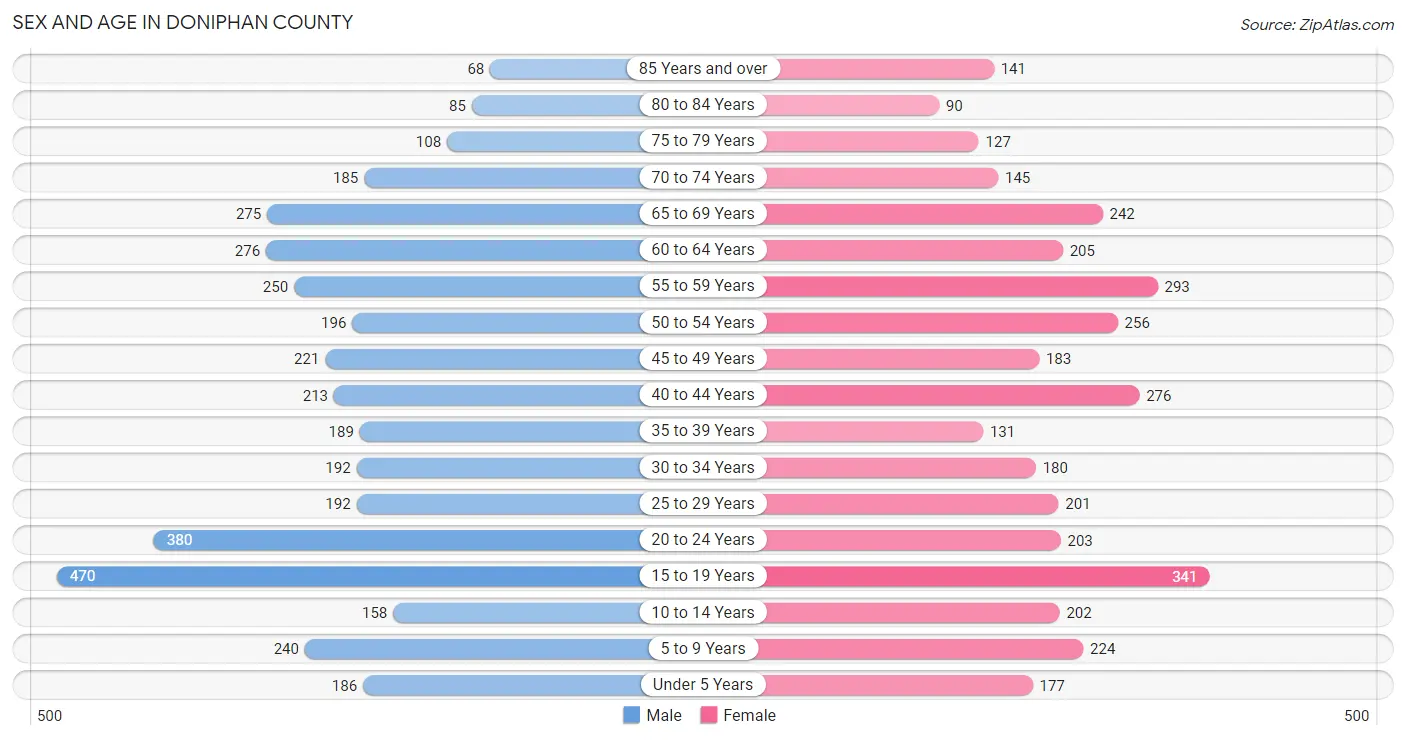
| Age Bracket | Male | Female |
| Under 5 Years | 186 (4.8%) | 177 (4.9%) |
| 5 to 9 Years | 240 (6.2%) | 224 (6.2%) |
| 10 to 14 Years | 158 (4.1%) | 202 (5.6%) |
| 15 to 19 Years | 470 (12.1%) | 341 (9.4%) |
| 20 to 24 Years | 380 (9.8%) | 203 (5.6%) |
| 25 to 29 Years | 192 (4.9%) | 201 (5.6%) |
| 30 to 34 Years | 192 (4.9%) | 180 (5.0%) |
| 35 to 39 Years | 189 (4.9%) | 131 (3.6%) |
| 40 to 44 Years | 213 (5.5%) | 276 (7.6%) |
| 45 to 49 Years | 221 (5.7%) | 183 (5.1%) |
| 50 to 54 Years | 196 (5.1%) | 256 (7.1%) |
| 55 to 59 Years | 250 (6.4%) | 293 (8.1%) |
| 60 to 64 Years | 276 (7.1%) | 205 (5.7%) |
| 65 to 69 Years | 275 (7.1%) | 242 (6.7%) |
| 70 to 74 Years | 185 (4.8%) | 145 (4.0%) |
| 75 to 79 Years | 108 (2.8%) | 127 (3.5%) |
| 80 to 84 Years | 85 (2.2%) | 90 (2.5%) |
| 85 Years and over | 68 (1.8%) | 141 (3.9%) |
| Total | 3,884 (100.0%) | 3,617 (100.0%) |
Families and Households in Doniphan County
Median Family Size in Doniphan County
The median family size in Doniphan County is 2.99 persons per family, with single female/mother families (241 | 12.9%) accounting for the largest median family size of 3.22 persons per family. On the other hand, single male/father families (114 | 6.1%) represent the smallest median family size with 2.58 persons per family.
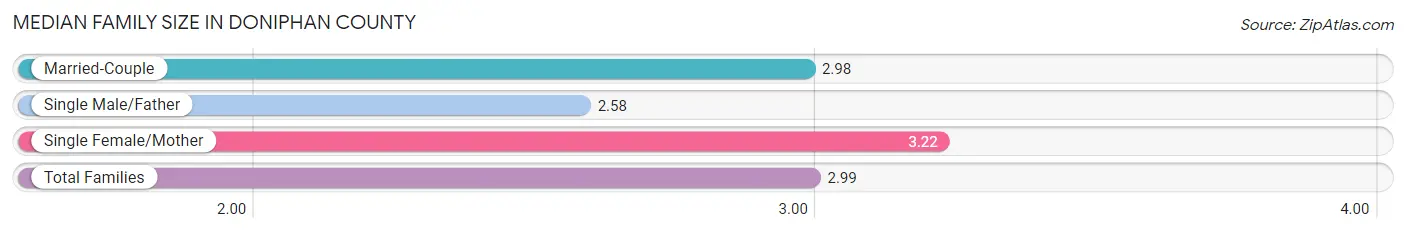
| Family Type | # Families | Family Size |
| Married-Couple | 1,518 (81.0%) | 2.98 |
| Single Male/Father | 114 (6.1%) | 2.58 |
| Single Female/Mother | 241 (12.9%) | 3.22 |
| Total Families | 1,873 (100.0%) | 2.99 |
Median Household Size in Doniphan County
The median household size in Doniphan County is 2.47 persons per household, with single female/mother households (241 | 8.8%) accounting for the largest median household size of 3.37 persons per household. non-family households (862 | 31.5%) represent the smallest median household size with 1.15 persons per household.
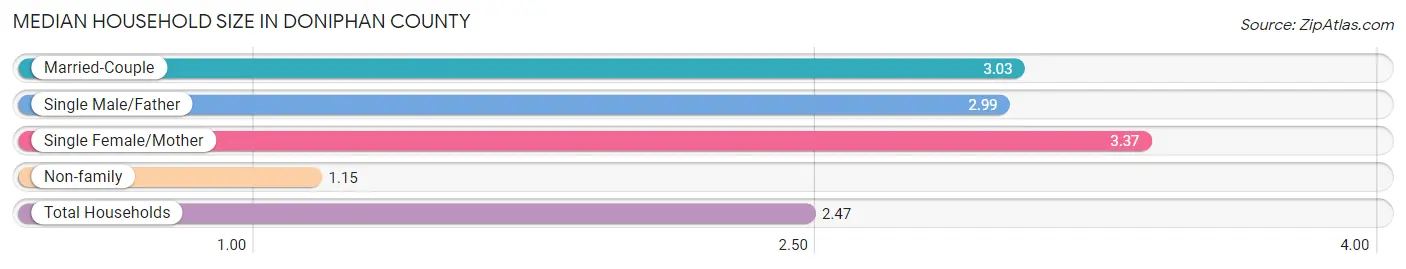
| Household Type | # Households | Household Size |
| Married-Couple | 1,518 (55.5%) | 3.03 |
| Single Male/Father | 114 (4.2%) | 2.99 |
| Single Female/Mother | 241 (8.8%) | 3.37 |
| Non-family | 862 (31.5%) | 1.15 |
| Total Households | 2,735 (100.0%) | 2.47 |
Household Size by Marriage Status in Doniphan County
Out of a total of 2,735 households in Doniphan County, 1,873 (68.5%) are family households, while 862 (31.5%) are nonfamily households. The most numerous type of family households are 2-person households, comprising 964, and the most common type of nonfamily households are 1-person households, comprising 761.
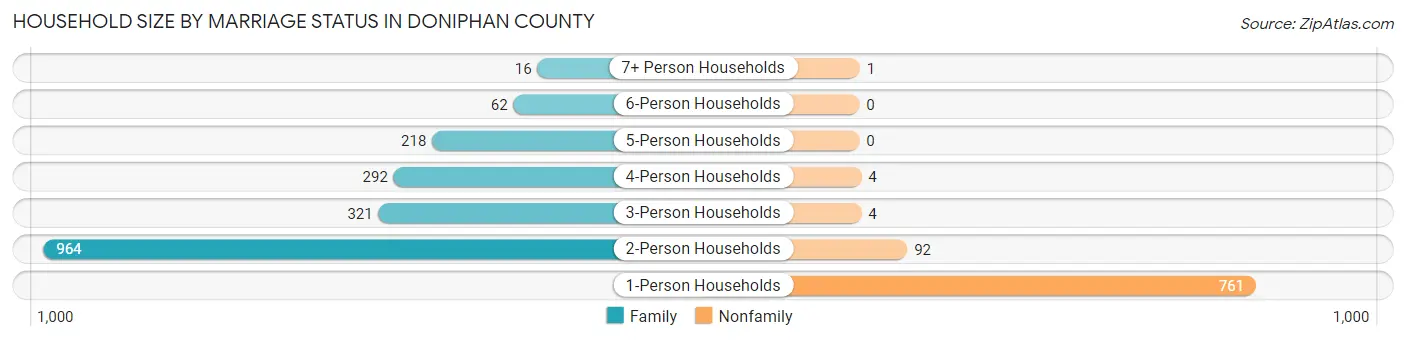
| Household Size | Family Households | Nonfamily Households |
| 1-Person Households | - | 761 (27.8%) |
| 2-Person Households | 964 (35.2%) | 92 (3.4%) |
| 3-Person Households | 321 (11.7%) | 4 (0.2%) |
| 4-Person Households | 292 (10.7%) | 4 (0.2%) |
| 5-Person Households | 218 (8.0%) | 0 (0.0%) |
| 6-Person Households | 62 (2.3%) | 0 (0.0%) |
| 7+ Person Households | 16 (0.6%) | 1 (0.0%) |
| Total | 1,873 (68.5%) | 862 (31.5%) |
Female Fertility in Doniphan County
Fertility by Age in Doniphan County
Average fertility rate in Doniphan County is 54.0 births per 1,000 women. Women in the age bracket of 20 to 34 years have the highest fertility rate with 140.0 births per 1,000 women. Women in the age bracket of 20 to 34 years acount for 97.6% of all women with births.
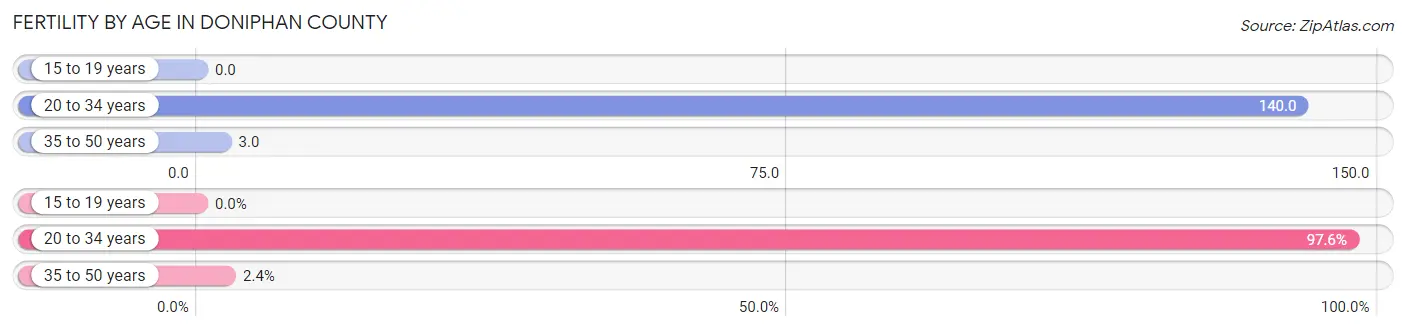
| Age Bracket | Women with Births | Births / 1,000 Women |
| 15 to 19 years | 0 (0.0%) | 0.0 |
| 20 to 34 years | 82 (97.6%) | 140.0 |
| 35 to 50 years | 2 (2.4%) | 3.0 |
| Total | 84 (100.0%) | 54.0 |
Fertility by Age by Marriage Status in Doniphan County
78.6% of women with births (84) in Doniphan County are married. The highest percentage of unmarried women with births falls into 20 to 34 years age bracket with 22.0% of them unmarried at the time of birth, while the lowest percentage of unmarried women with births belong to 35 to 50 years age bracket with 0.0% of them unmarried.
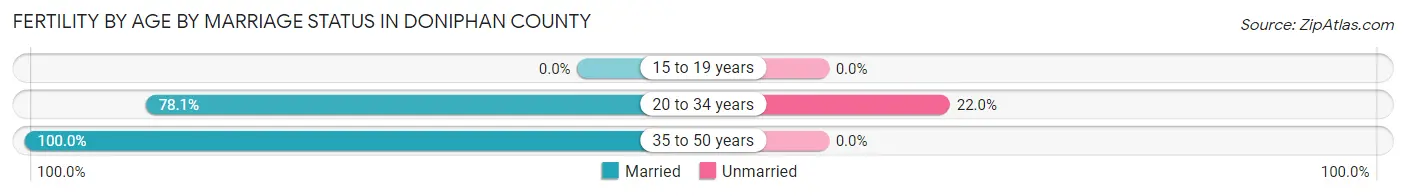
| Age Bracket | Married | Unmarried |
| 15 to 19 years | 0 (0.0%) | 0 (0.0%) |
| 20 to 34 years | 64 (78.0%) | 18 (22.0%) |
| 35 to 50 years | 2 (100.0%) | 0 (0.0%) |
| Total | 66 (78.6%) | 18 (21.4%) |
Fertility by Education in Doniphan County
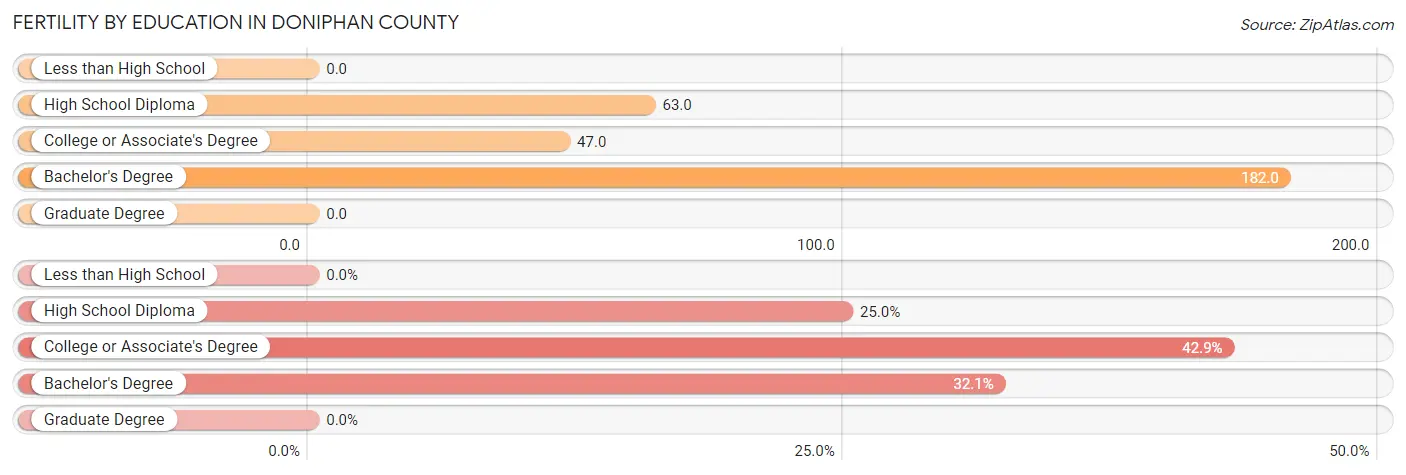
| Educational Attainment | Women with Births | Births / 1,000 Women |
| Less than High School | 0 (0.0%) | 0.0 |
| High School Diploma | 21 (25.0%) | 63.0 |
| College or Associate's Degree | 36 (42.9%) | 47.0 |
| Bachelor's Degree | 27 (32.1%) | 182.0 |
| Graduate Degree | 0 (0.0%) | 0.0 |
| Total | 84 (100.0%) | 54.0 |
Fertility by Education by Marriage Status in Doniphan County
21.4% of women with births in Doniphan County are unmarried. Women with the educational attainment of bachelor's degree are most likely to be married with 92.6% of them married at childbirth, while women with the educational attainment of high school diploma are least likely to be married with 28.6% of them unmarried at childbirth.
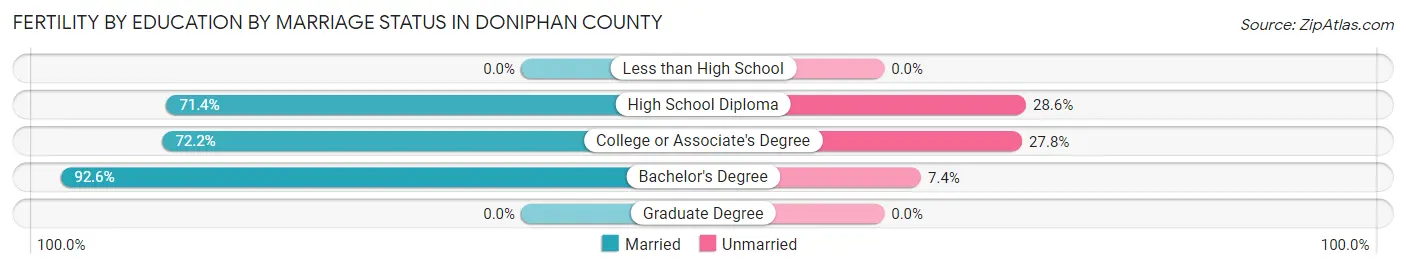
| Educational Attainment | Married | Unmarried |
| Less than High School | 0 (0.0%) | 0 (0.0%) |
| High School Diploma | 15 (71.4%) | 6 (28.6%) |
| College or Associate's Degree | 26 (72.2%) | 10 (27.8%) |
| Bachelor's Degree | 25 (92.6%) | 2 (7.4%) |
| Graduate Degree | 0 (0.0%) | 0 (0.0%) |
| Total | 66 (78.6%) | 18 (21.4%) |
Employment Characteristics in Doniphan County
Employment by Class of Employer in Doniphan County
Among the 3,677 employed individuals in Doniphan County, private company employees (2,404 | 65.4%), local government employees (347 | 9.4%), and not-for-profit organizations (321 | 8.7%) make up the most common classes of employment.
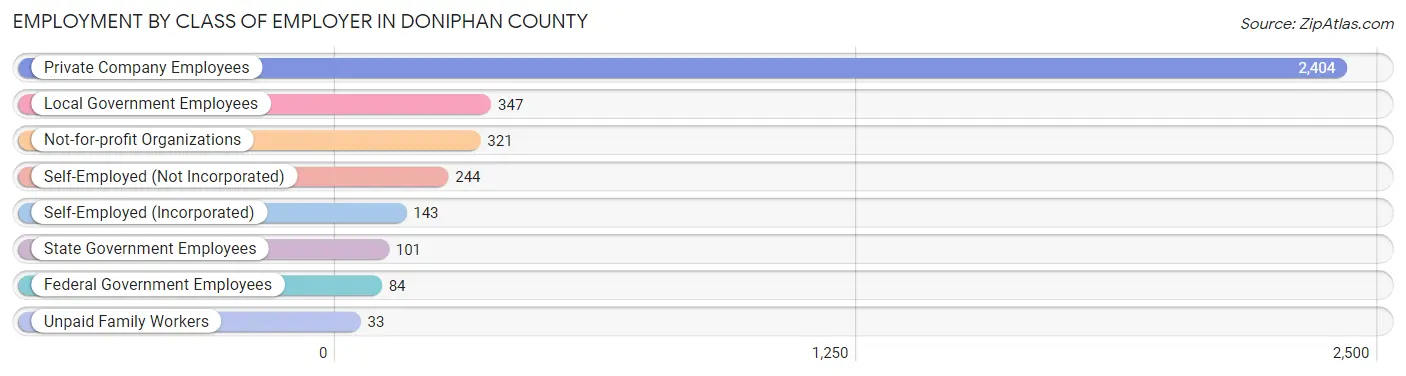
| Employer Class | # Employees | % Employees |
| Private Company Employees | 2,404 | 65.4% |
| Self-Employed (Incorporated) | 143 | 3.9% |
| Self-Employed (Not Incorporated) | 244 | 6.6% |
| Not-for-profit Organizations | 321 | 8.7% |
| Local Government Employees | 347 | 9.4% |
| State Government Employees | 101 | 2.8% |
| Federal Government Employees | 84 | 2.3% |
| Unpaid Family Workers | 33 | 0.9% |
| Total | 3,677 | 100.0% |
Employment Status by Age in Doniphan County
According to the labor force statistics for Doniphan County, out of the total population over 16 years of age (6,228), 60.8% or 3,787 individuals are in the labor force, with 1.6% or 61 of them unemployed. The age group with the highest labor force participation rate is 35 to 44 years, with 92.7% or 750 individuals in the labor force. Within the labor force, the 16 to 19 years age range has the highest percentage of unemployed individuals, with 10.3% or 23 of them being unemployed.
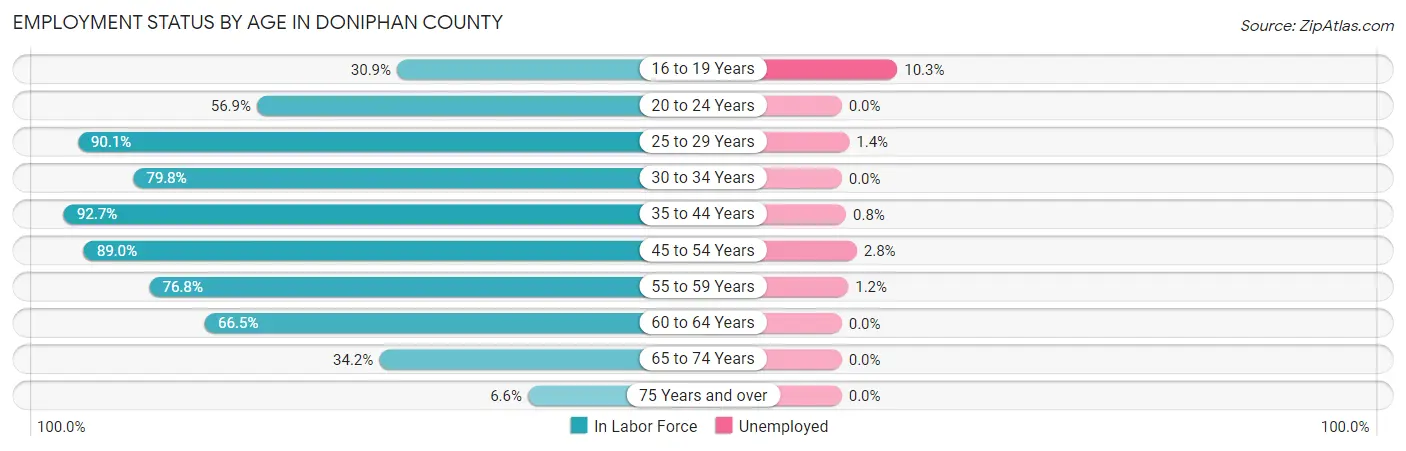
| Age Bracket | In Labor Force | Unemployed |
| 16 to 19 Years | 224 (30.9%) | 23 (10.3%) |
| 20 to 24 Years | 332 (56.9%) | 0 (0.0%) |
| 25 to 29 Years | 354 (90.1%) | 5 (1.4%) |
| 30 to 34 Years | 297 (79.8%) | 0 (0.0%) |
| 35 to 44 Years | 750 (92.7%) | 6 (0.8%) |
| 45 to 54 Years | 762 (89.0%) | 21 (2.8%) |
| 55 to 59 Years | 417 (76.8%) | 5 (1.2%) |
| 60 to 64 Years | 320 (66.5%) | 0 (0.0%) |
| 65 to 74 Years | 290 (34.2%) | 0 (0.0%) |
| 75 Years and over | 41 (6.6%) | 0 (0.0%) |
| Total | 3,787 (60.8%) | 61 (1.6%) |
Employment Status by Educational Attainment in Doniphan County
According to labor force statistics for Doniphan County, 84.0% of individuals (2,901) out of the total population between 25 and 64 years of age (3,454) are in the labor force, with 1.3% or 38 of them being unemployed. The group with the highest labor force participation rate are those with the educational attainment of bachelor's degree or higher, with 96.6% or 626 individuals in the labor force. Within the labor force, individuals with college / associate degree education have the highest percentage of unemployment, with 1.9% or 24 of them being unemployed.
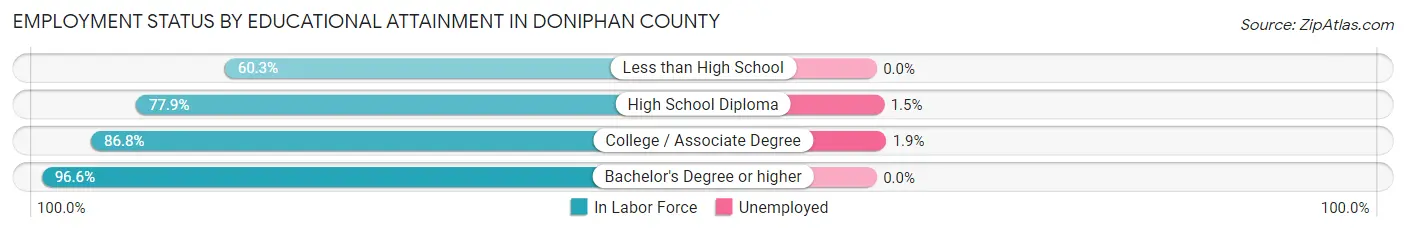
| Educational Attainment | In Labor Force | Unemployed |
| Less than High School | 143 (60.3%) | 0 (0.0%) |
| High School Diploma | 860 (77.9%) | 17 (1.5%) |
| College / Associate Degree | 1,272 (86.8%) | 28 (1.9%) |
| Bachelor's Degree or higher | 626 (96.6%) | 0 (0.0%) |
| Total | 2,901 (84.0%) | 45 (1.3%) |
Employment Occupations by Sex in Doniphan County
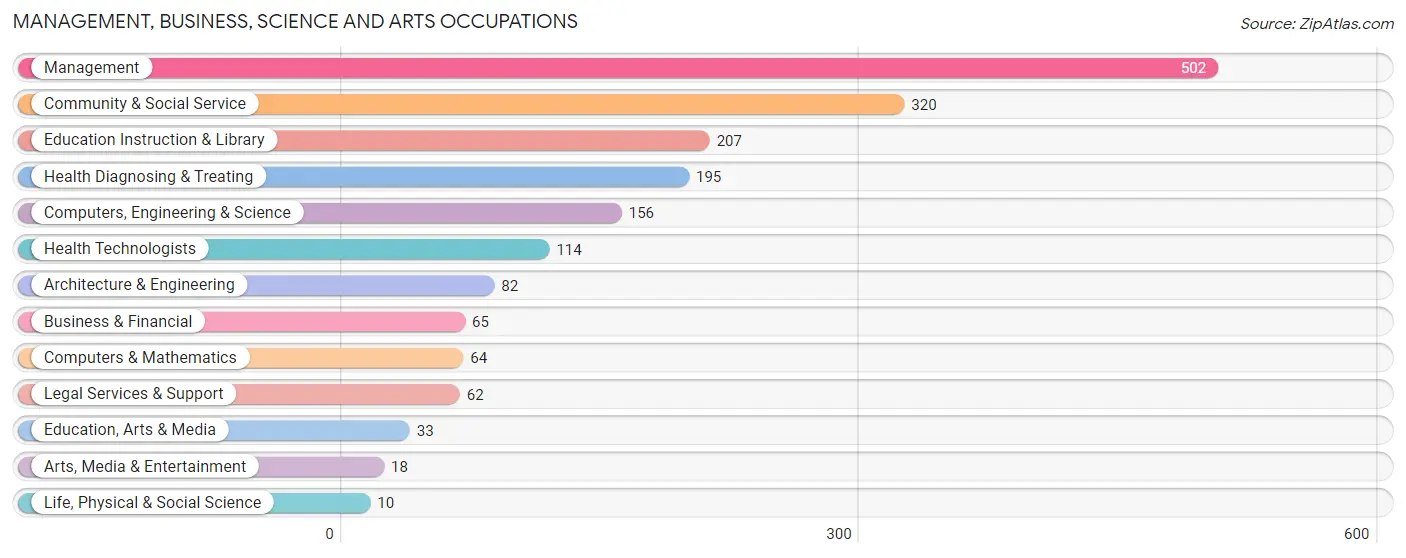
Management, Business, Science and Arts Occupations
The most common Management, Business, Science and Arts occupations in Doniphan County are Management (502 | 13.5%), Community & Social Service (320 | 8.6%), Education Instruction & Library (207 | 5.6%), Health Diagnosing & Treating (195 | 5.2%), and Computers, Engineering & Science (156 | 4.2%).
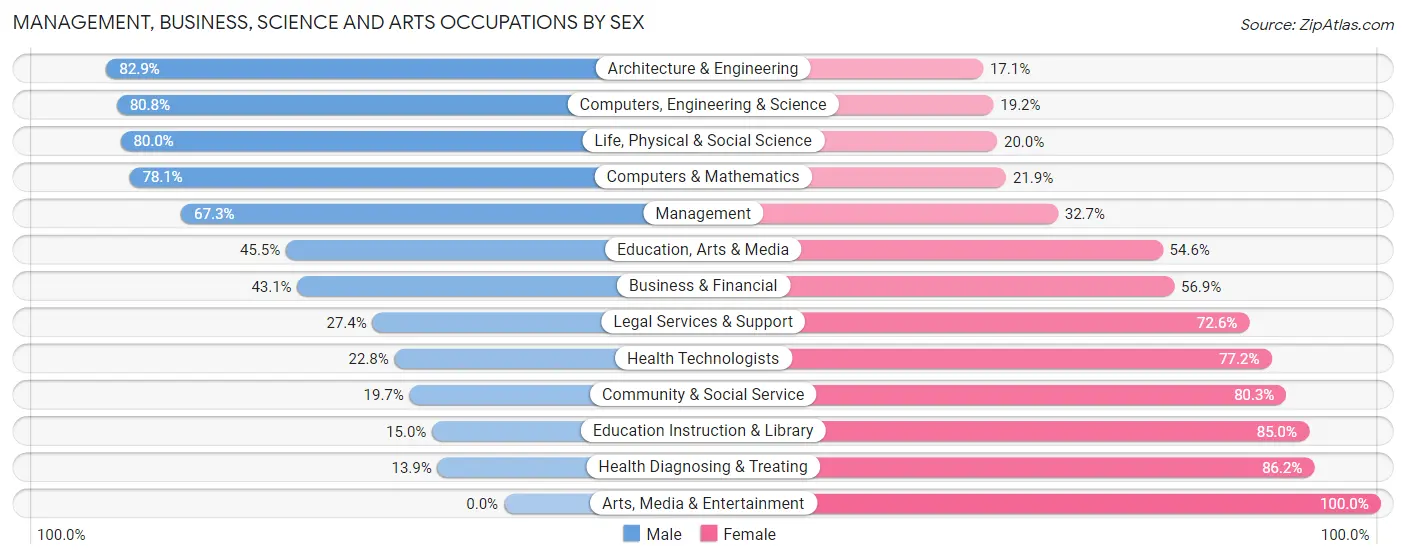
Management, Business, Science and Arts Occupations by Sex
Within the Management, Business, Science and Arts occupations in Doniphan County, the most male-oriented occupations are Architecture & Engineering (82.9%), Computers, Engineering & Science (80.8%), and Life, Physical & Social Science (80.0%), while the most female-oriented occupations are Arts, Media & Entertainment (100.0%), Health Diagnosing & Treating (86.2%), and Education Instruction & Library (85.0%).
| Occupation | Male | Female |
| Management | 338 (67.3%) | 164 (32.7%) |
| Business & Financial | 28 (43.1%) | 37 (56.9%) |
| Computers, Engineering & Science | 126 (80.8%) | 30 (19.2%) |
| Computers & Mathematics | 50 (78.1%) | 14 (21.9%) |
| Architecture & Engineering | 68 (82.9%) | 14 (17.1%) |
| Life, Physical & Social Science | 8 (80.0%) | 2 (20.0%) |
| Community & Social Service | 63 (19.7%) | 257 (80.3%) |
| Education, Arts & Media | 15 (45.5%) | 18 (54.5%) |
| Legal Services & Support | 17 (27.4%) | 45 (72.6%) |
| Education Instruction & Library | 31 (15.0%) | 176 (85.0%) |
| Arts, Media & Entertainment | 0 (0.0%) | 18 (100.0%) |
| Health Diagnosing & Treating | 27 (13.9%) | 168 (86.2%) |
| Health Technologists | 26 (22.8%) | 88 (77.2%) |
| Total (Category) | 582 (47.0%) | 656 (53.0%) |
| Total (Overall) | 1,949 (52.4%) | 1,772 (47.6%) |
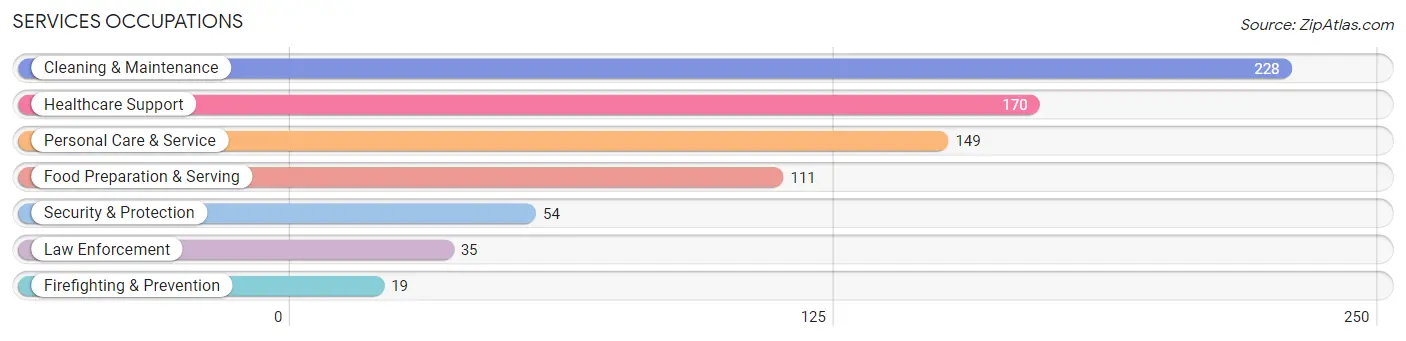
Services Occupations
The most common Services occupations in Doniphan County are Cleaning & Maintenance (228 | 6.1%), Healthcare Support (170 | 4.6%), Personal Care & Service (149 | 4.0%), Food Preparation & Serving (111 | 3.0%), and Security & Protection (54 | 1.5%).
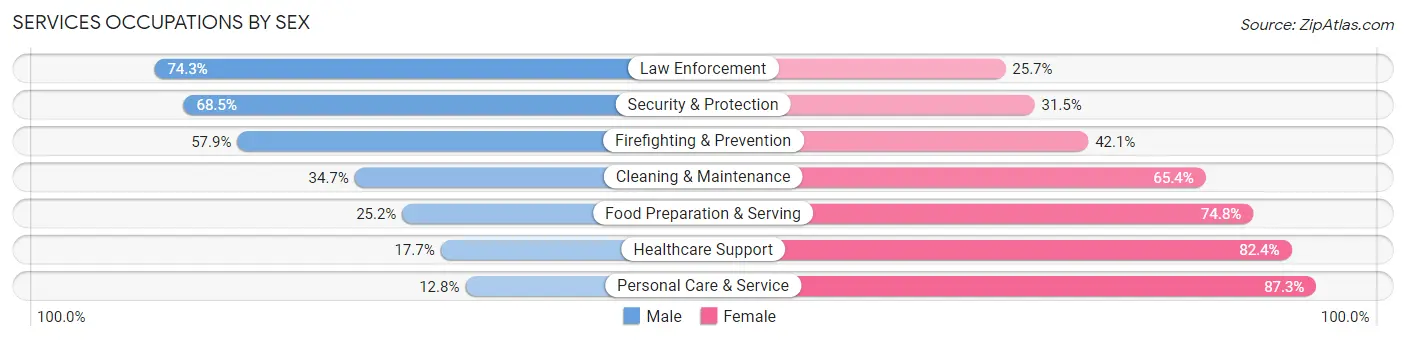
Services Occupations by Sex
Within the Services occupations in Doniphan County, the most male-oriented occupations are Law Enforcement (74.3%), Security & Protection (68.5%), and Firefighting & Prevention (57.9%), while the most female-oriented occupations are Personal Care & Service (87.3%), Healthcare Support (82.4%), and Food Preparation & Serving (74.8%).
| Occupation | Male | Female |
| Healthcare Support | 30 (17.6%) | 140 (82.4%) |
| Security & Protection | 37 (68.5%) | 17 (31.5%) |
| Firefighting & Prevention | 11 (57.9%) | 8 (42.1%) |
| Law Enforcement | 26 (74.3%) | 9 (25.7%) |
| Food Preparation & Serving | 28 (25.2%) | 83 (74.8%) |
| Cleaning & Maintenance | 79 (34.6%) | 149 (65.3%) |
| Personal Care & Service | 19 (12.8%) | 130 (87.3%) |
| Total (Category) | 193 (27.1%) | 519 (72.9%) |
| Total (Overall) | 1,949 (52.4%) | 1,772 (47.6%) |
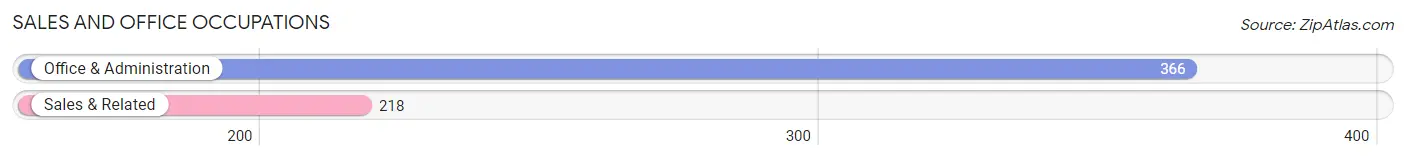
Sales and Office Occupations
The most common Sales and Office occupations in Doniphan County are Office & Administration (366 | 9.8%), and Sales & Related (218 | 5.9%).
Sales and Office Occupations by Sex
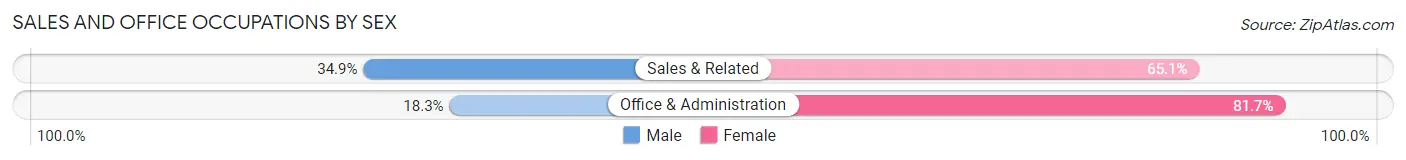
| Occupation | Male | Female |
| Sales & Related | 76 (34.9%) | 142 (65.1%) |
| Office & Administration | 67 (18.3%) | 299 (81.7%) |
| Total (Category) | 143 (24.5%) | 441 (75.5%) |
| Total (Overall) | 1,949 (52.4%) | 1,772 (47.6%) |
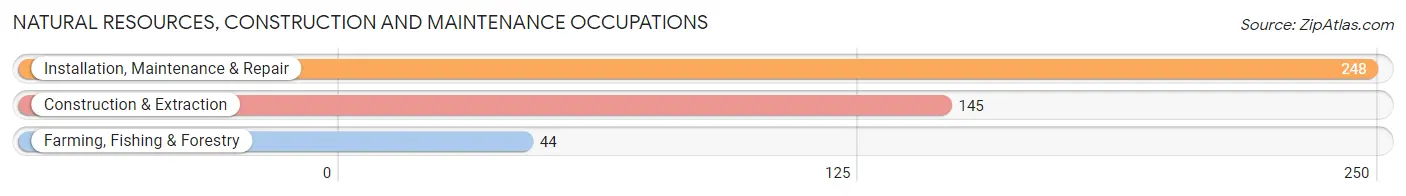
Natural Resources, Construction and Maintenance Occupations
The most common Natural Resources, Construction and Maintenance occupations in Doniphan County are Installation, Maintenance & Repair (248 | 6.7%), Construction & Extraction (145 | 3.9%), and Farming, Fishing & Forestry (44 | 1.2%).
Natural Resources, Construction and Maintenance Occupations by Sex
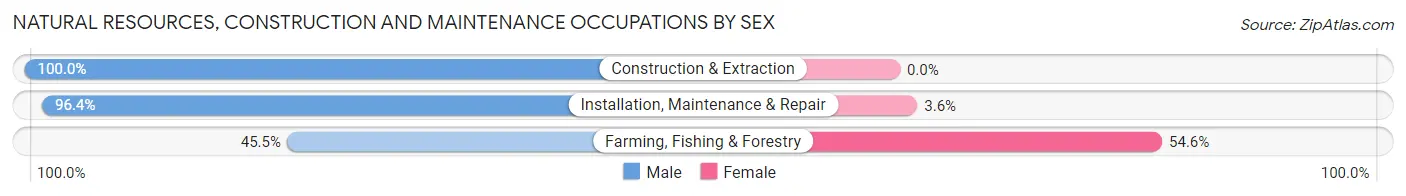
| Occupation | Male | Female |
| Farming, Fishing & Forestry | 20 (45.5%) | 24 (54.5%) |
| Construction & Extraction | 145 (100.0%) | 0 (0.0%) |
| Installation, Maintenance & Repair | 239 (96.4%) | 9 (3.6%) |
| Total (Category) | 404 (92.4%) | 33 (7.5%) |
| Total (Overall) | 1,949 (52.4%) | 1,772 (47.6%) |
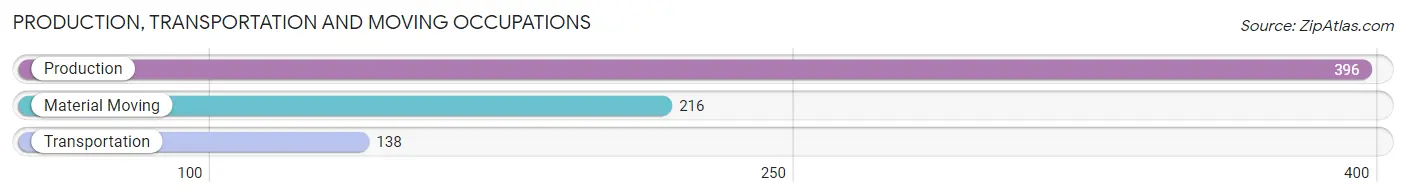
Production, Transportation and Moving Occupations
The most common Production, Transportation and Moving occupations in Doniphan County are Production (396 | 10.6%), Material Moving (216 | 5.8%), and Transportation (138 | 3.7%).
Production, Transportation and Moving Occupations by Sex
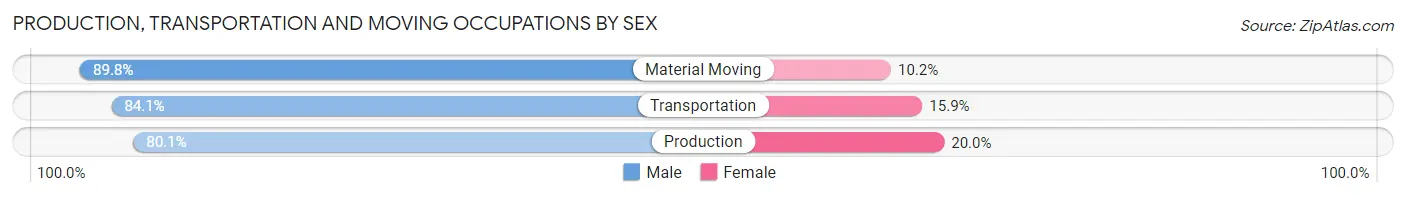
| Occupation | Male | Female |
| Production | 317 (80.0%) | 79 (20.0%) |
| Transportation | 116 (84.1%) | 22 (15.9%) |
| Material Moving | 194 (89.8%) | 22 (10.2%) |
| Total (Category) | 627 (83.6%) | 123 (16.4%) |
| Total (Overall) | 1,949 (52.4%) | 1,772 (47.6%) |
Employment Industries by Sex in Doniphan County
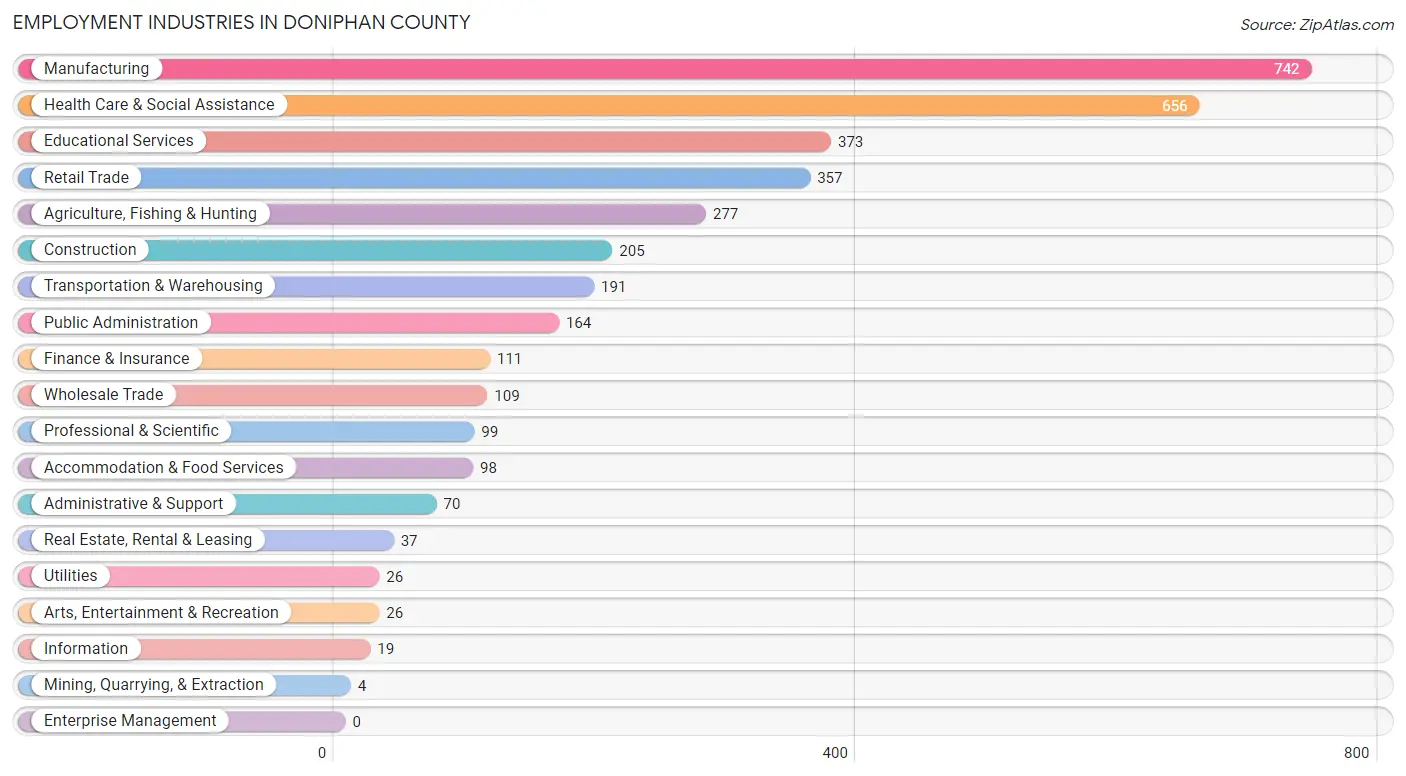
Employment Industries in Doniphan County
The major employment industries in Doniphan County include Manufacturing (742 | 19.9%), Health Care & Social Assistance (656 | 17.6%), Educational Services (373 | 10.0%), Retail Trade (357 | 9.6%), and Agriculture, Fishing & Hunting (277 | 7.4%).
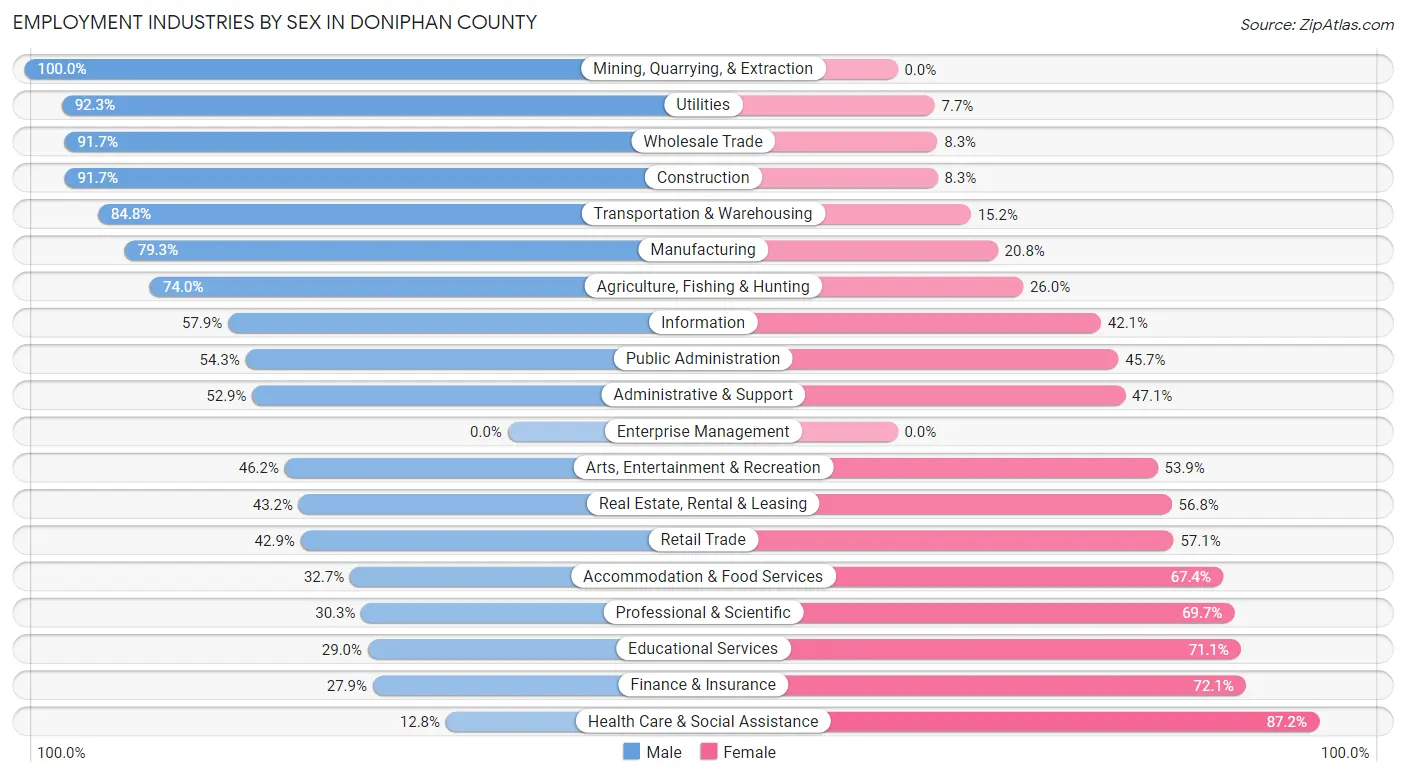
Employment Industries by Sex in Doniphan County
The Doniphan County industries that see more men than women are Mining, Quarrying, & Extraction (100.0%), Utilities (92.3%), and Wholesale Trade (91.7%), whereas the industries that tend to have a higher number of women are Health Care & Social Assistance (87.2%), Finance & Insurance (72.1%), and Educational Services (71.1%).
| Industry | Male | Female |
| Agriculture, Fishing & Hunting | 205 (74.0%) | 72 (26.0%) |
| Mining, Quarrying, & Extraction | 4 (100.0%) | 0 (0.0%) |
| Construction | 188 (91.7%) | 17 (8.3%) |
| Manufacturing | 588 (79.2%) | 154 (20.7%) |
| Wholesale Trade | 100 (91.7%) | 9 (8.3%) |
| Retail Trade | 153 (42.9%) | 204 (57.1%) |
| Transportation & Warehousing | 162 (84.8%) | 29 (15.2%) |
| Utilities | 24 (92.3%) | 2 (7.7%) |
| Information | 11 (57.9%) | 8 (42.1%) |
| Finance & Insurance | 31 (27.9%) | 80 (72.1%) |
| Real Estate, Rental & Leasing | 16 (43.2%) | 21 (56.8%) |
| Professional & Scientific | 30 (30.3%) | 69 (69.7%) |
| Enterprise Management | 0 (0.0%) | 0 (0.0%) |
| Administrative & Support | 37 (52.9%) | 33 (47.1%) |
| Educational Services | 108 (28.9%) | 265 (71.1%) |
| Health Care & Social Assistance | 84 (12.8%) | 572 (87.2%) |
| Arts, Entertainment & Recreation | 12 (46.2%) | 14 (53.8%) |
| Accommodation & Food Services | 32 (32.7%) | 66 (67.3%) |
| Public Administration | 89 (54.3%) | 75 (45.7%) |
| Total | 1,949 (52.4%) | 1,772 (47.6%) |
Education in Doniphan County
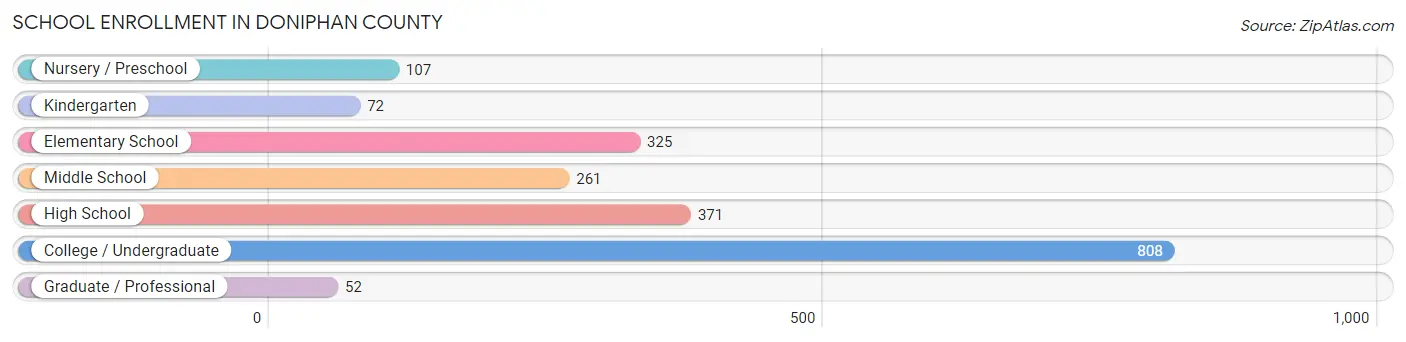
School Enrollment in Doniphan County
The most common levels of schooling among the 1,996 students in Doniphan County are college / undergraduate (808 | 40.5%), high school (371 | 18.6%), and elementary school (325 | 16.3%).
| School Level | # Students | % Students |
| Nursery / Preschool | 107 | 5.4% |
| Kindergarten | 72 | 3.6% |
| Elementary School | 325 | 16.3% |
| Middle School | 261 | 13.1% |
| High School | 371 | 18.6% |
| College / Undergraduate | 808 | 40.5% |
| Graduate / Professional | 52 | 2.6% |
| Total | 1,996 | 100.0% |
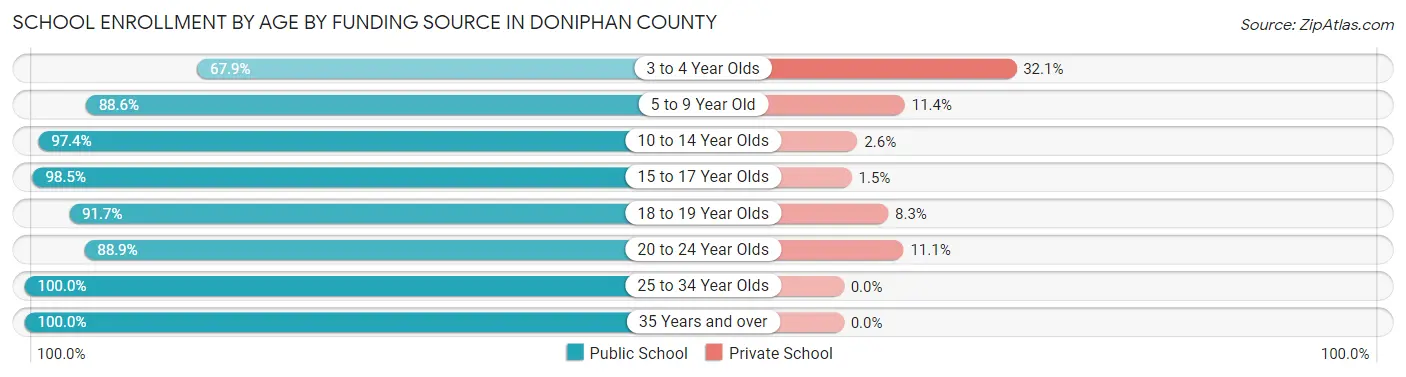
School Enrollment by Age by Funding Source in Doniphan County
Out of a total of 1,996 students who are enrolled in schools in Doniphan County, 152 (7.6%) attend a private institution, while the remaining 1,844 (92.4%) are enrolled in public schools. The age group of 3 to 4 year olds has the highest likelihood of being enrolled in private schools, with 9 (32.1% in the age bracket) enrolled. Conversely, the age group of 25 to 34 year olds has the lowest likelihood of being enrolled in a private school, with 42 (100.0% in the age bracket) attending a public institution.
| Age Bracket | Public School | Private School |
| 3 to 4 Year Olds | 19 (67.9%) | 9 (32.1%) |
| 5 to 9 Year Old | 389 (88.6%) | 50 (11.4%) |
| 10 to 14 Year Olds | 343 (97.4%) | 9 (2.6%) |
| 15 to 17 Year Olds | 268 (98.5%) | 4 (1.5%) |
| 18 to 19 Year Olds | 454 (91.7%) | 41 (8.3%) |
| 20 to 24 Year Olds | 303 (88.9%) | 38 (11.1%) |
| 25 to 34 Year Olds | 42 (100.0%) | 0 (0.0%) |
| 35 Years and over | 27 (100.0%) | 0 (0.0%) |
| Total | 1,844 (92.4%) | 152 (7.6%) |
Educational Attainment by Field of Study in Doniphan County
Education (282 | 28.6%), business (154 | 15.6%), science & technology (153 | 15.5%), bio, nature & agricultural (123 | 12.5%), and social sciences (59 | 6.0%) are the most common fields of study among 987 individuals in Doniphan County who have obtained a bachelor's degree or higher.
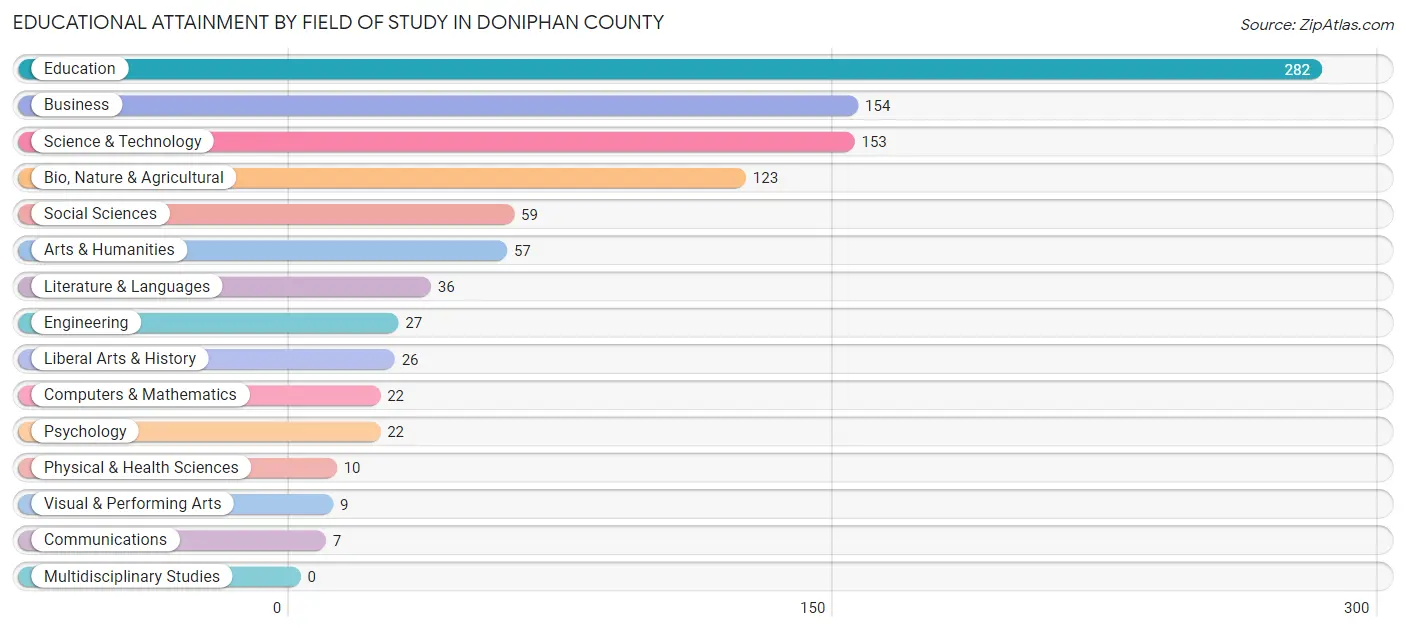
| Field of Study | # Graduates | % Graduates |
| Computers & Mathematics | 22 | 2.2% |
| Bio, Nature & Agricultural | 123 | 12.5% |
| Physical & Health Sciences | 10 | 1.0% |
| Psychology | 22 | 2.2% |
| Social Sciences | 59 | 6.0% |
| Engineering | 27 | 2.7% |
| Multidisciplinary Studies | 0 | 0.0% |
| Science & Technology | 153 | 15.5% |
| Business | 154 | 15.6% |
| Education | 282 | 28.6% |
| Literature & Languages | 36 | 3.6% |
| Liberal Arts & History | 26 | 2.6% |
| Visual & Performing Arts | 9 | 0.9% |
| Communications | 7 | 0.7% |
| Arts & Humanities | 57 | 5.8% |
| Total | 987 | 100.0% |
Transportation & Commute in Doniphan County
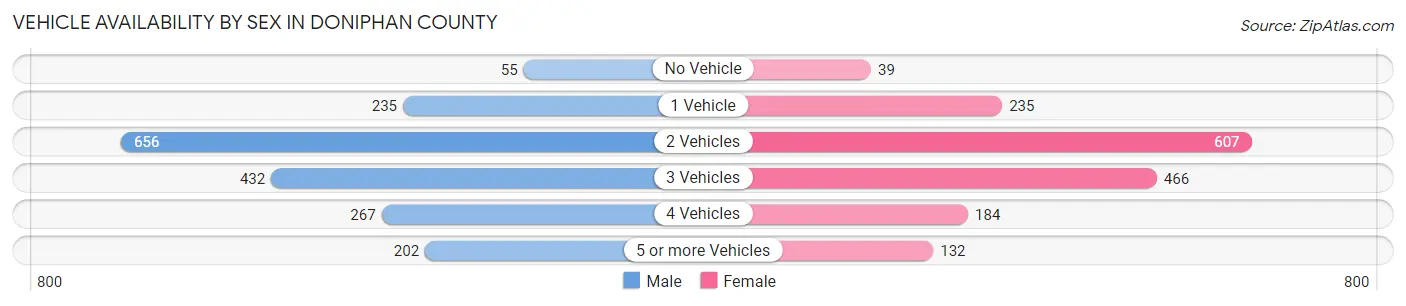
Vehicle Availability by Sex in Doniphan County
The most prevalent vehicle ownership categories in Doniphan County are males with 2 vehicles (656, accounting for 35.5%) and females with 2 vehicles (607, making up 39.5%).
| Vehicles Available | Male | Female |
| No Vehicle | 55 (3.0%) | 39 (2.4%) |
| 1 Vehicle | 235 (12.7%) | 235 (14.1%) |
| 2 Vehicles | 656 (35.5%) | 607 (36.5%) |
| 3 Vehicles | 432 (23.4%) | 466 (28.0%) |
| 4 Vehicles | 267 (14.5%) | 184 (11.1%) |
| 5 or more Vehicles | 202 (10.9%) | 132 (7.9%) |
| Total | 1,847 (100.0%) | 1,663 (100.0%) |
Commute Time in Doniphan County
The most frequently occuring commute durations in Doniphan County are 15 to 19 minutes (590 commuters, 17.3%), 5 to 9 minutes (521 commuters, 15.3%), and 20 to 24 minutes (507 commuters, 14.9%).
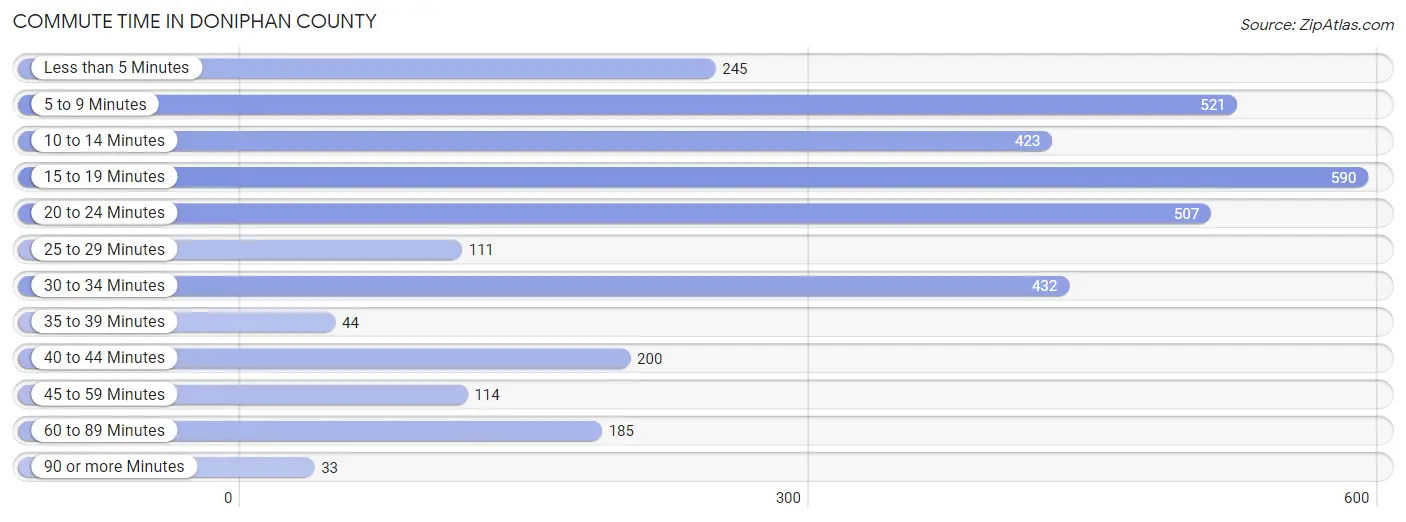
| Commute Time | # Commuters | % Commuters |
| Less than 5 Minutes | 245 | 7.2% |
| 5 to 9 Minutes | 521 | 15.3% |
| 10 to 14 Minutes | 423 | 12.4% |
| 15 to 19 Minutes | 590 | 17.3% |
| 20 to 24 Minutes | 507 | 14.9% |
| 25 to 29 Minutes | 111 | 3.3% |
| 30 to 34 Minutes | 432 | 12.7% |
| 35 to 39 Minutes | 44 | 1.3% |
| 40 to 44 Minutes | 200 | 5.9% |
| 45 to 59 Minutes | 114 | 3.4% |
| 60 to 89 Minutes | 185 | 5.4% |
| 90 or more Minutes | 33 | 1.0% |
Commute Time by Sex in Doniphan County
The most common commute times in Doniphan County are 5 to 9 minutes (314 commuters, 17.4%) for males and 15 to 19 minutes (277 commuters, 17.3%) for females.
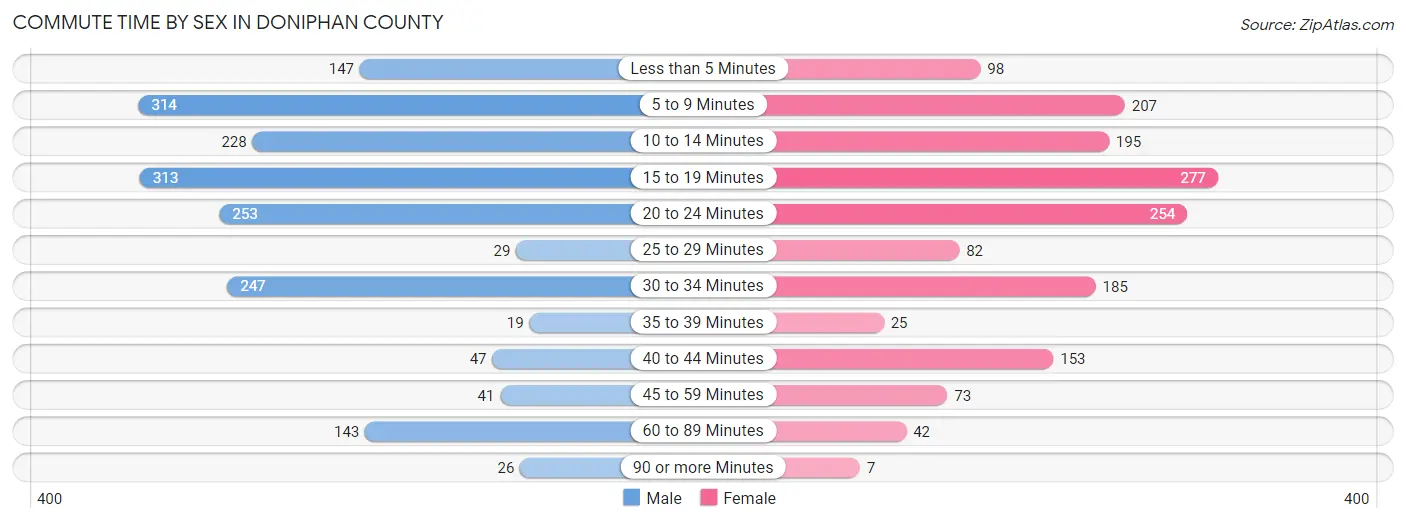
| Commute Time | Male | Female |
| Less than 5 Minutes | 147 (8.1%) | 98 (6.1%) |
| 5 to 9 Minutes | 314 (17.4%) | 207 (13.0%) |
| 10 to 14 Minutes | 228 (12.6%) | 195 (12.2%) |
| 15 to 19 Minutes | 313 (17.3%) | 277 (17.3%) |
| 20 to 24 Minutes | 253 (14.0%) | 254 (15.9%) |
| 25 to 29 Minutes | 29 (1.6%) | 82 (5.1%) |
| 30 to 34 Minutes | 247 (13.7%) | 185 (11.6%) |
| 35 to 39 Minutes | 19 (1.1%) | 25 (1.6%) |
| 40 to 44 Minutes | 47 (2.6%) | 153 (9.6%) |
| 45 to 59 Minutes | 41 (2.3%) | 73 (4.6%) |
| 60 to 89 Minutes | 143 (7.9%) | 42 (2.6%) |
| 90 or more Minutes | 26 (1.4%) | 7 (0.4%) |
Time of Departure to Work by Sex in Doniphan County
The most frequent times of departure to work in Doniphan County are 6:30 AM to 6:59 AM (303, 16.8%) for males and 7:30 AM to 7:59 AM (411, 25.7%) for females.
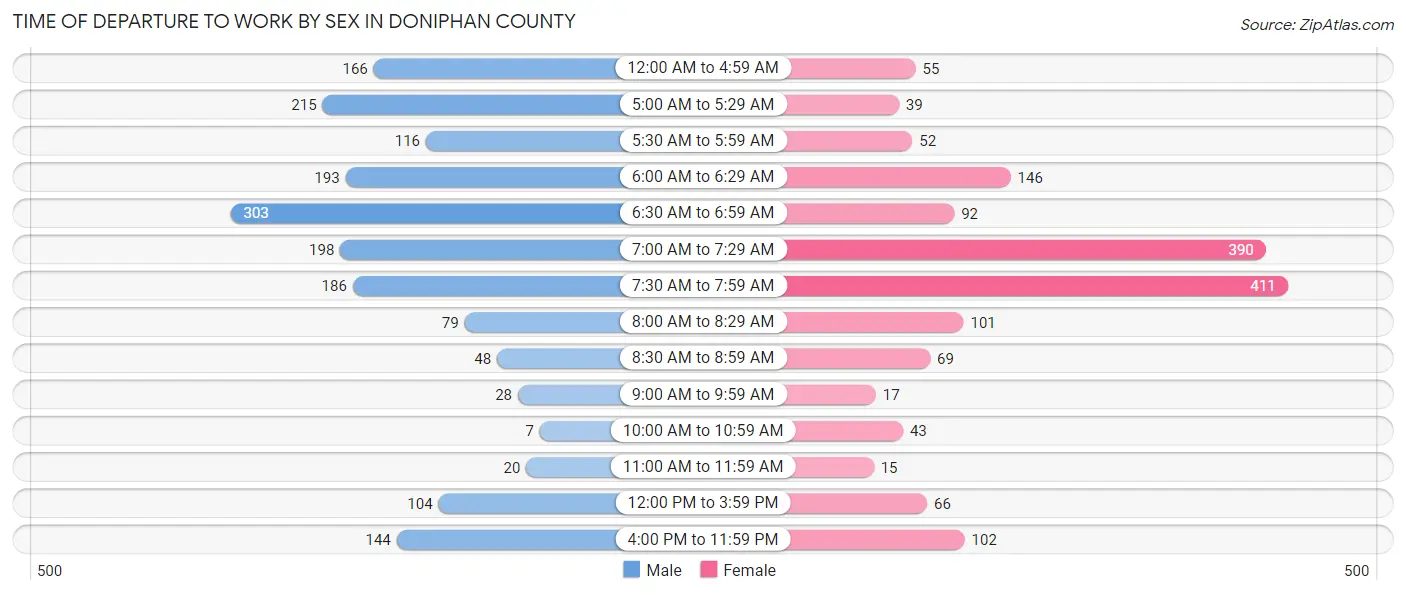
| Time of Departure | Male | Female |
| 12:00 AM to 4:59 AM | 166 (9.2%) | 55 (3.4%) |
| 5:00 AM to 5:29 AM | 215 (11.9%) | 39 (2.4%) |
| 5:30 AM to 5:59 AM | 116 (6.4%) | 52 (3.3%) |
| 6:00 AM to 6:29 AM | 193 (10.7%) | 146 (9.1%) |
| 6:30 AM to 6:59 AM | 303 (16.8%) | 92 (5.8%) |
| 7:00 AM to 7:29 AM | 198 (11.0%) | 390 (24.4%) |
| 7:30 AM to 7:59 AM | 186 (10.3%) | 411 (25.7%) |
| 8:00 AM to 8:29 AM | 79 (4.4%) | 101 (6.3%) |
| 8:30 AM to 8:59 AM | 48 (2.7%) | 69 (4.3%) |
| 9:00 AM to 9:59 AM | 28 (1.5%) | 17 (1.1%) |
| 10:00 AM to 10:59 AM | 7 (0.4%) | 43 (2.7%) |
| 11:00 AM to 11:59 AM | 20 (1.1%) | 15 (0.9%) |
| 12:00 PM to 3:59 PM | 104 (5.8%) | 66 (4.1%) |
| 4:00 PM to 11:59 PM | 144 (8.0%) | 102 (6.4%) |
| Total | 1,807 (100.0%) | 1,598 (100.0%) |
Housing Occupancy in Doniphan County
Occupancy by Ownership in Doniphan County
Of the total 2,735 dwellings in Doniphan County, owner-occupied units account for 2,190 (80.1%), while renter-occupied units make up 545 (19.9%).
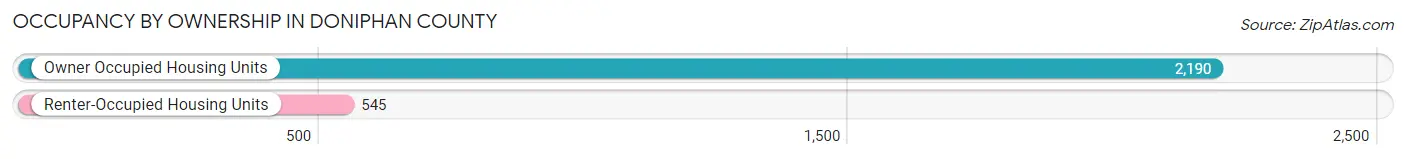
| Occupancy | # Housing Units | % Housing Units |
| Owner Occupied Housing Units | 2,190 | 80.1% |
| Renter-Occupied Housing Units | 545 | 19.9% |
| Total Occupied Housing Units | 2,735 | 100.0% |
Occupancy by Household Size in Doniphan County
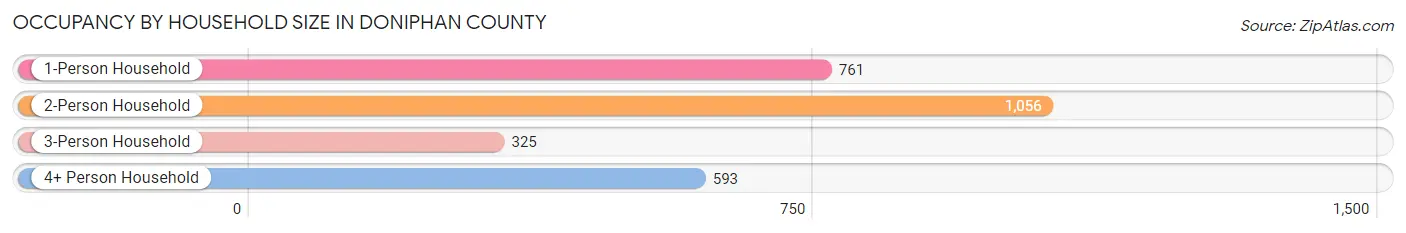
| Household Size | # Housing Units | % Housing Units |
| 1-Person Household | 761 | 27.8% |
| 2-Person Household | 1,056 | 38.6% |
| 3-Person Household | 325 | 11.9% |
| 4+ Person Household | 593 | 21.7% |
| Total Housing Units | 2,735 | 100.0% |
Occupancy by Ownership by Household Size in Doniphan County
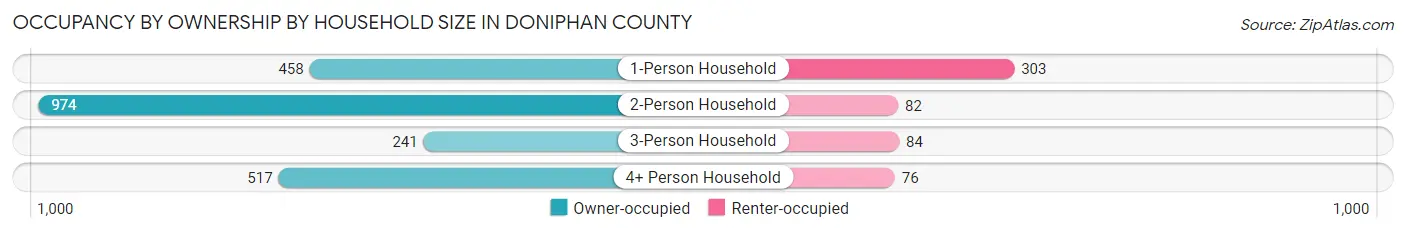
| Household Size | Owner-occupied | Renter-occupied |
| 1-Person Household | 458 (60.2%) | 303 (39.8%) |
| 2-Person Household | 974 (92.2%) | 82 (7.8%) |
| 3-Person Household | 241 (74.2%) | 84 (25.9%) |
| 4+ Person Household | 517 (87.2%) | 76 (12.8%) |
| Total Housing Units | 2,190 (80.1%) | 545 (19.9%) |
Occupancy by Educational Attainment in Doniphan County
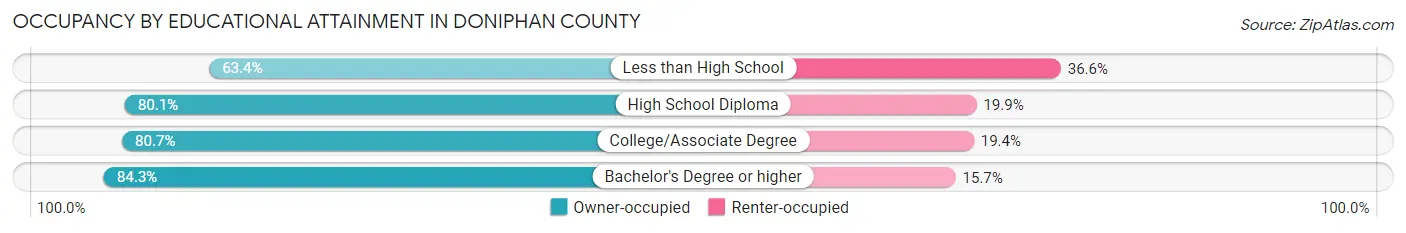
| Household Size | Owner-occupied | Renter-occupied |
| Less than High School | 116 (63.4%) | 67 (36.6%) |
| High School Diploma | 717 (80.1%) | 178 (19.9%) |
| College/Associate Degree | 875 (80.6%) | 210 (19.4%) |
| Bachelor's Degree or higher | 482 (84.3%) | 90 (15.7%) |
Occupancy by Age of Householder in Doniphan County
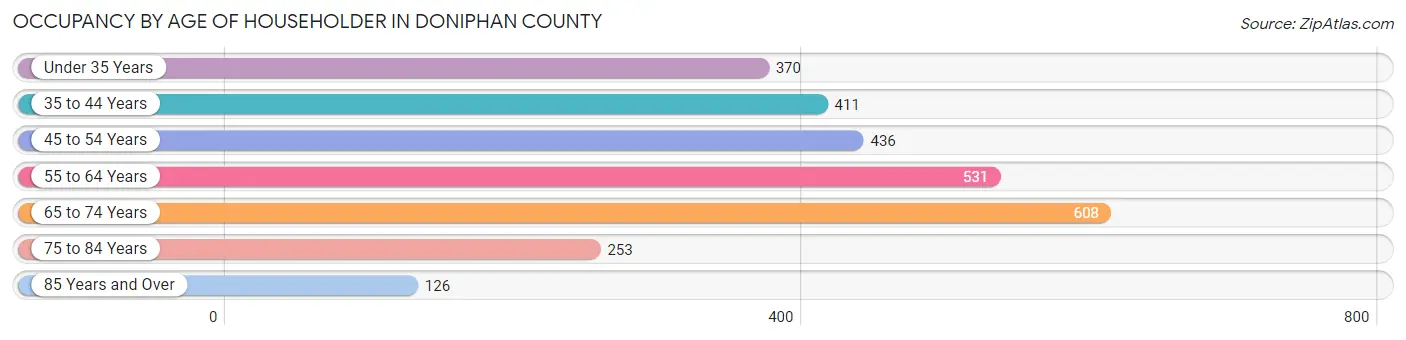
| Age Bracket | # Households | % Households |
| Under 35 Years | 370 | 13.5% |
| 35 to 44 Years | 411 | 15.0% |
| 45 to 54 Years | 436 | 15.9% |
| 55 to 64 Years | 531 | 19.4% |
| 65 to 74 Years | 608 | 22.2% |
| 75 to 84 Years | 253 | 9.2% |
| 85 Years and Over | 126 | 4.6% |
| Total | 2,735 | 100.0% |
Housing Finances in Doniphan County
Median Income by Occupancy in Doniphan County
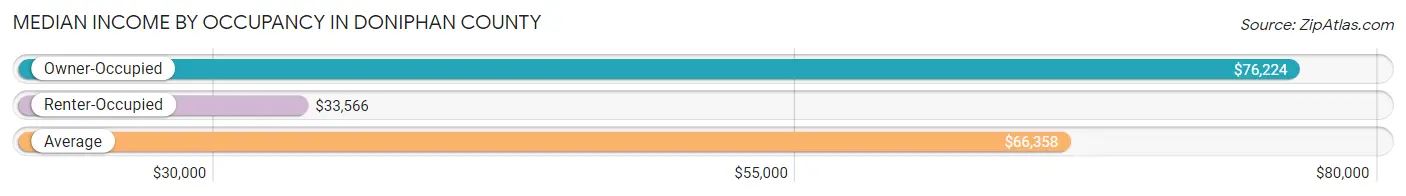
| Occupancy Type | # Households | Median Income |
| Owner-Occupied | 2,190 (80.1%) | $76,224 |
| Renter-Occupied | 545 (19.9%) | $33,566 |
| Average | 2,735 (100.0%) | $66,358 |
Occupancy by Householder Income Bracket in Doniphan County
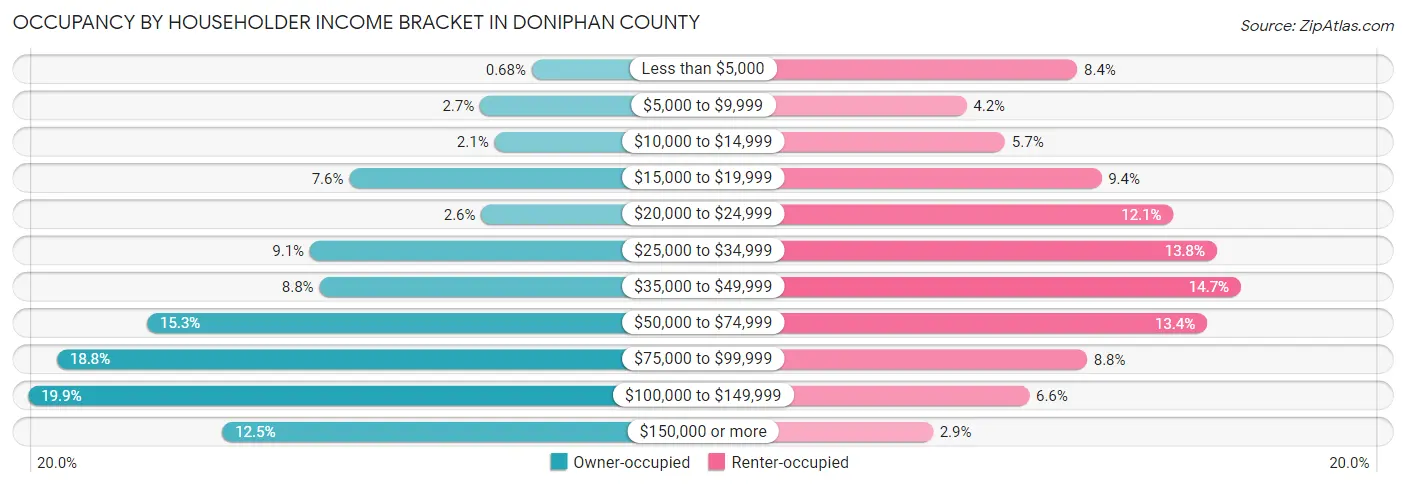
| Income Bracket | Owner-occupied | Renter-occupied |
| Less than $5,000 | 15 (0.7%) | 46 (8.4%) |
| $5,000 to $9,999 | 58 (2.6%) | 23 (4.2%) |
| $10,000 to $14,999 | 46 (2.1%) | 31 (5.7%) |
| $15,000 to $19,999 | 167 (7.6%) | 51 (9.4%) |
| $20,000 to $24,999 | 57 (2.6%) | 66 (12.1%) |
| $25,000 to $34,999 | 200 (9.1%) | 75 (13.8%) |
| $35,000 to $49,999 | 192 (8.8%) | 80 (14.7%) |
| $50,000 to $74,999 | 336 (15.3%) | 73 (13.4%) |
| $75,000 to $99,999 | 411 (18.8%) | 48 (8.8%) |
| $100,000 to $149,999 | 435 (19.9%) | 36 (6.6%) |
| $150,000 or more | 273 (12.5%) | 16 (2.9%) |
| Total | 2,190 (100.0%) | 545 (100.0%) |
Monthly Housing Cost Tiers in Doniphan County
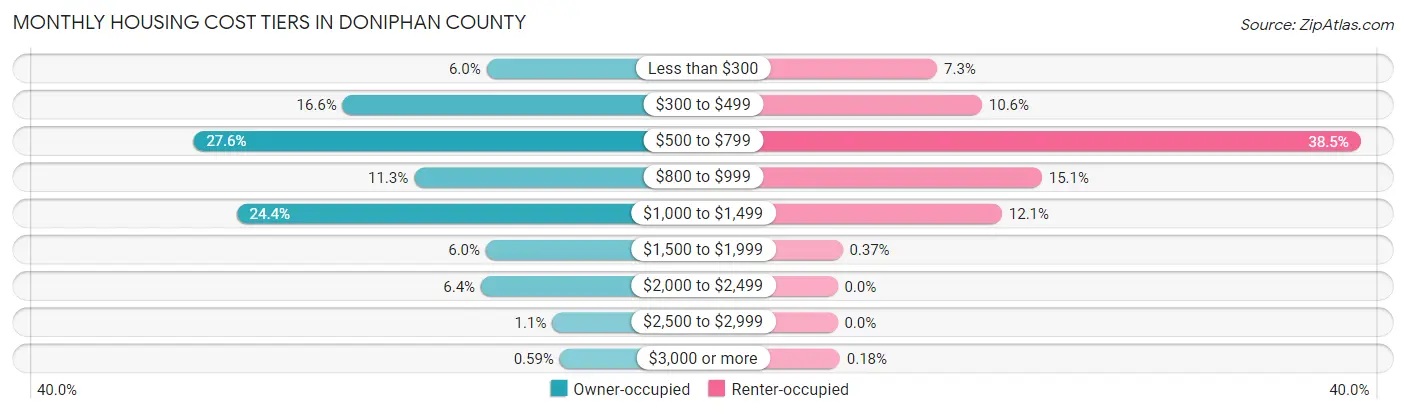
| Monthly Cost | Owner-occupied | Renter-occupied |
| Less than $300 | 131 (6.0%) | 40 (7.3%) |
| $300 to $499 | 363 (16.6%) | 58 (10.6%) |
| $500 to $799 | 604 (27.6%) | 210 (38.5%) |
| $800 to $999 | 248 (11.3%) | 82 (15.0%) |
| $1,000 to $1,499 | 534 (24.4%) | 66 (12.1%) |
| $1,500 to $1,999 | 132 (6.0%) | 2 (0.4%) |
| $2,000 to $2,499 | 140 (6.4%) | 0 (0.0%) |
| $2,500 to $2,999 | 25 (1.1%) | 0 (0.0%) |
| $3,000 or more | 13 (0.6%) | 1 (0.2%) |
| Total | 2,190 (100.0%) | 545 (100.0%) |
Physical Housing Characteristics in Doniphan County
Housing Structures in Doniphan County
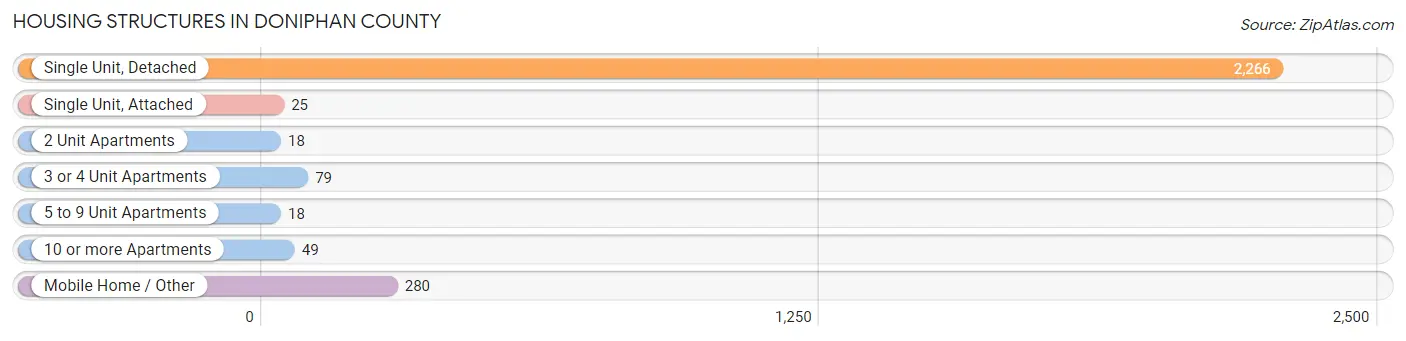
| Structure Type | # Housing Units | % Housing Units |
| Single Unit, Detached | 2,266 | 82.9% |
| Single Unit, Attached | 25 | 0.9% |
| 2 Unit Apartments | 18 | 0.7% |
| 3 or 4 Unit Apartments | 79 | 2.9% |
| 5 to 9 Unit Apartments | 18 | 0.7% |
| 10 or more Apartments | 49 | 1.8% |
| Mobile Home / Other | 280 | 10.2% |
| Total | 2,735 | 100.0% |
Housing Structures by Occupancy in Doniphan County
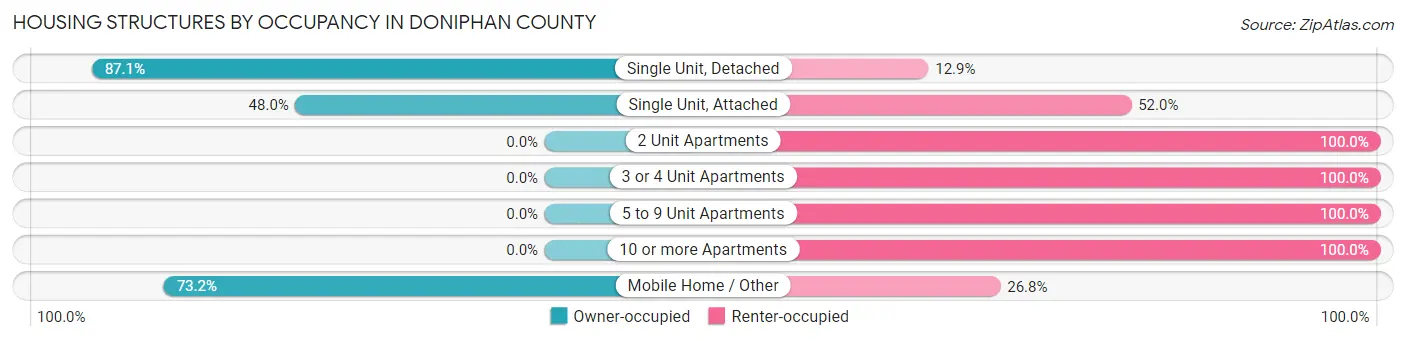
| Structure Type | Owner-occupied | Renter-occupied |
| Single Unit, Detached | 1,973 (87.1%) | 293 (12.9%) |
| Single Unit, Attached | 12 (48.0%) | 13 (52.0%) |
| 2 Unit Apartments | 0 (0.0%) | 18 (100.0%) |
| 3 or 4 Unit Apartments | 0 (0.0%) | 79 (100.0%) |
| 5 to 9 Unit Apartments | 0 (0.0%) | 18 (100.0%) |
| 10 or more Apartments | 0 (0.0%) | 49 (100.0%) |
| Mobile Home / Other | 205 (73.2%) | 75 (26.8%) |
| Total | 2,190 (80.1%) | 545 (19.9%) |
Housing Structures by Number of Rooms in Doniphan County
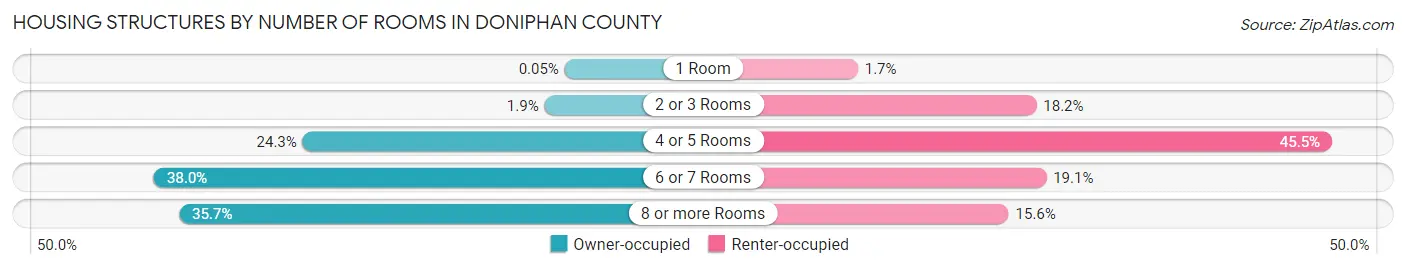
| Number of Rooms | Owner-occupied | Renter-occupied |
| 1 Room | 1 (0.1%) | 9 (1.7%) |
| 2 or 3 Rooms | 42 (1.9%) | 99 (18.2%) |
| 4 or 5 Rooms | 532 (24.3%) | 248 (45.5%) |
| 6 or 7 Rooms | 833 (38.0%) | 104 (19.1%) |
| 8 or more Rooms | 782 (35.7%) | 85 (15.6%) |
| Total | 2,190 (100.0%) | 545 (100.0%) |
Housing Structure by Heating Type in Doniphan County
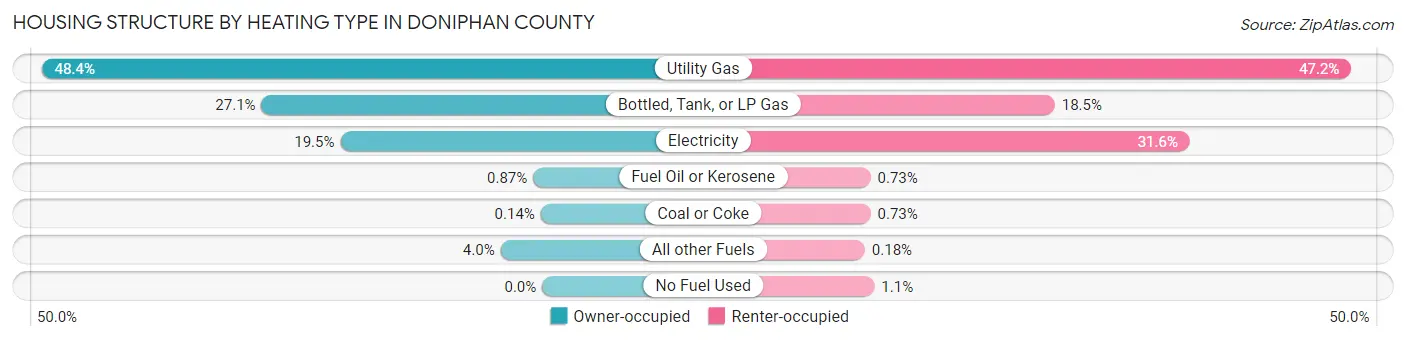
| Heating Type | Owner-occupied | Renter-occupied |
| Utility Gas | 1,059 (48.4%) | 257 (47.2%) |
| Bottled, Tank, or LP Gas | 594 (27.1%) | 101 (18.5%) |
| Electricity | 427 (19.5%) | 172 (31.6%) |
| Fuel Oil or Kerosene | 19 (0.9%) | 4 (0.7%) |
| Coal or Coke | 3 (0.1%) | 4 (0.7%) |
| All other Fuels | 88 (4.0%) | 1 (0.2%) |
| No Fuel Used | 0 (0.0%) | 6 (1.1%) |
| Total | 2,190 (100.0%) | 545 (100.0%) |
Household Vehicle Usage in Doniphan County
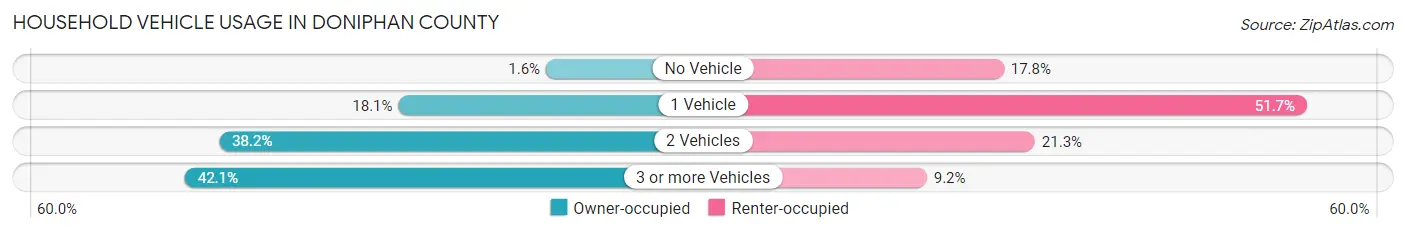
| Vehicles per Household | Owner-occupied | Renter-occupied |
| No Vehicle | 35 (1.6%) | 97 (17.8%) |
| 1 Vehicle | 397 (18.1%) | 282 (51.7%) |
| 2 Vehicles | 837 (38.2%) | 116 (21.3%) |
| 3 or more Vehicles | 921 (42.0%) | 50 (9.2%) |
| Total | 2,190 (100.0%) | 545 (100.0%) |
Real Estate & Mortgages in Doniphan County
Real Estate and Mortgage Overview in Doniphan County
| Characteristic | Without Mortgage | With Mortgage |
| Housing Units | 1,228 | 962 |
| Median Property Value | $107,800 | $128,900 |
| Median Household Income | $63,529 | $150 |
| Monthly Housing Costs | $597 | $13 |
| Real Estate Taxes | $1,273 | $24 |
Property Value by Mortgage Status in Doniphan County
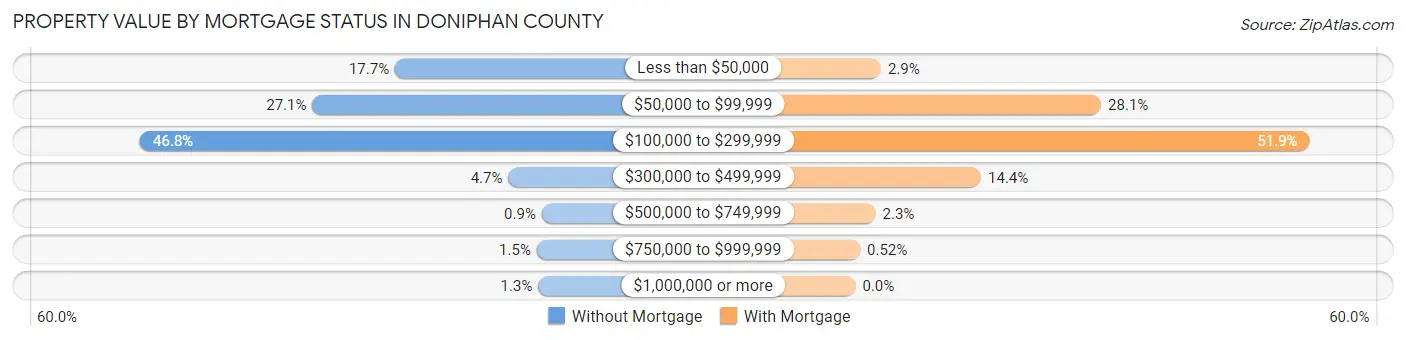
| Property Value | Without Mortgage | With Mortgage |
| Less than $50,000 | 217 (17.7%) | 28 (2.9%) |
| $50,000 to $99,999 | 333 (27.1%) | 270 (28.1%) |
| $100,000 to $299,999 | 575 (46.8%) | 499 (51.9%) |
| $300,000 to $499,999 | 58 (4.7%) | 138 (14.3%) |
| $500,000 to $749,999 | 11 (0.9%) | 22 (2.3%) |
| $750,000 to $999,999 | 18 (1.5%) | 5 (0.5%) |
| $1,000,000 or more | 16 (1.3%) | 0 (0.0%) |
| Total | 1,228 (100.0%) | 962 (100.0%) |
Household Income by Mortgage Status in Doniphan County
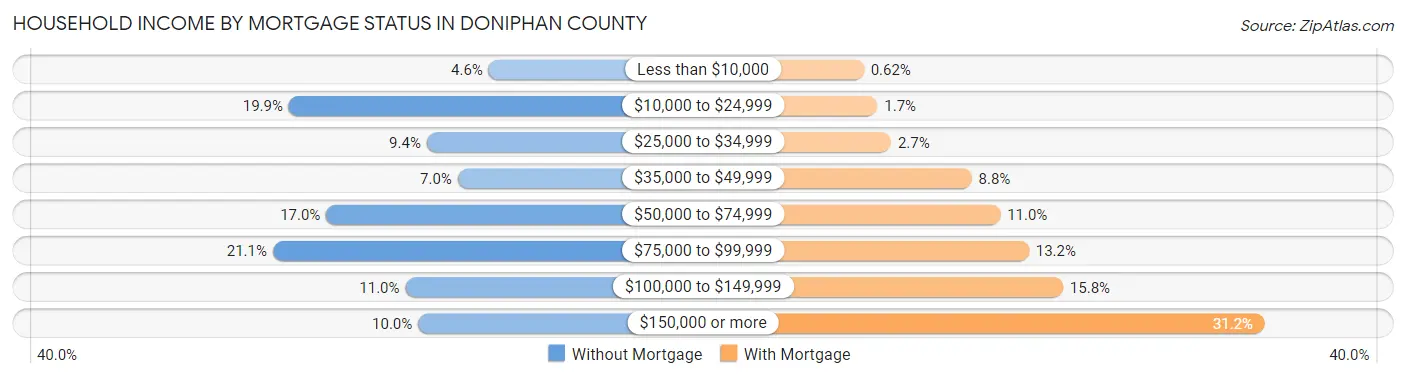
| Household Income | Without Mortgage | With Mortgage |
| Less than $10,000 | 57 (4.6%) | 6 (0.6%) |
| $10,000 to $24,999 | 244 (19.9%) | 16 (1.7%) |
| $25,000 to $34,999 | 115 (9.4%) | 26 (2.7%) |
| $35,000 to $49,999 | 86 (7.0%) | 85 (8.8%) |
| $50,000 to $74,999 | 209 (17.0%) | 106 (11.0%) |
| $75,000 to $99,999 | 259 (21.1%) | 127 (13.2%) |
| $100,000 to $149,999 | 135 (11.0%) | 152 (15.8%) |
| $150,000 or more | 123 (10.0%) | 300 (31.2%) |
| Total | 1,228 (100.0%) | 962 (100.0%) |
Property Value to Household Income Ratio in Doniphan County
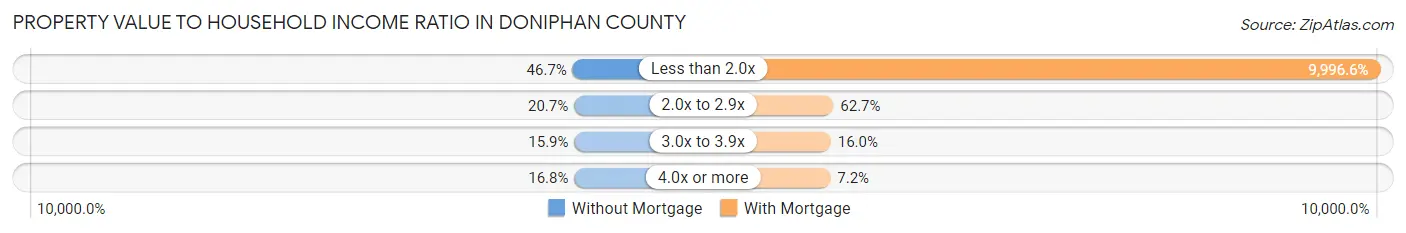
| Value-to-Income Ratio | Without Mortgage | With Mortgage |
| Less than 2.0x | 573 (46.7%) | 96,167 (9,996.6%) |
| 2.0x to 2.9x | 254 (20.7%) | 603 (62.7%) |
| 3.0x to 3.9x | 195 (15.9%) | 154 (16.0%) |
| 4.0x or more | 206 (16.8%) | 69 (7.2%) |
| Total | 1,228 (100.0%) | 962 (100.0%) |
Real Estate Taxes by Mortgage Status in Doniphan County
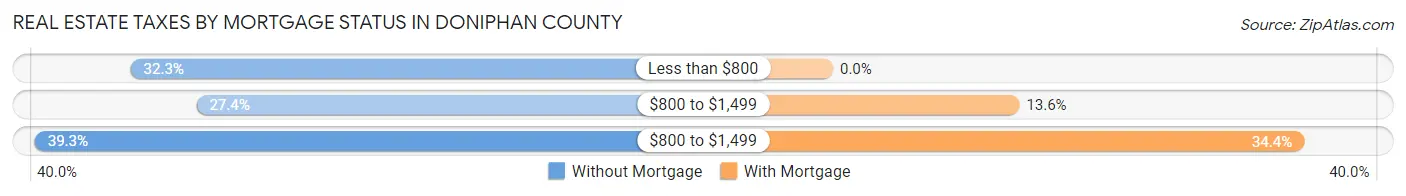
| Property Taxes | Without Mortgage | With Mortgage |
| Less than $800 | 396 (32.3%) | 0 (0.0%) |
| $800 to $1,499 | 337 (27.4%) | 131 (13.6%) |
| $800 to $1,499 | 482 (39.3%) | 331 (34.4%) |
| Total | 1,228 (100.0%) | 962 (100.0%) |
Health & Disability in Doniphan County
Health Insurance Coverage by Age in Doniphan County
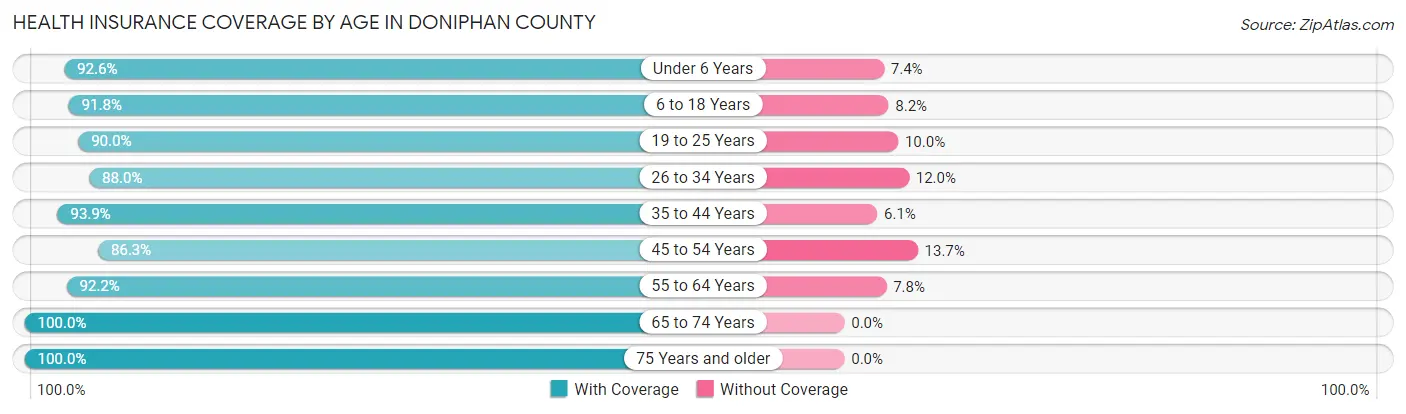
| Age Bracket | With Coverage | Without Coverage |
| Under 6 Years | 439 (92.6%) | 35 (7.4%) |
| 6 to 18 Years | 1,116 (91.8%) | 100 (8.2%) |
| 19 to 25 Years | 890 (90.0%) | 99 (10.0%) |
| 26 to 34 Years | 571 (88.0%) | 78 (12.0%) |
| 35 to 44 Years | 751 (93.9%) | 49 (6.1%) |
| 45 to 54 Years | 739 (86.3%) | 117 (13.7%) |
| 55 to 64 Years | 944 (92.2%) | 80 (7.8%) |
| 65 to 74 Years | 840 (100.0%) | 0 (0.0%) |
| 75 Years and older | 556 (100.0%) | 0 (0.0%) |
| Total | 6,846 (92.5%) | 558 (7.5%) |
Health Insurance Coverage by Citizenship Status in Doniphan County
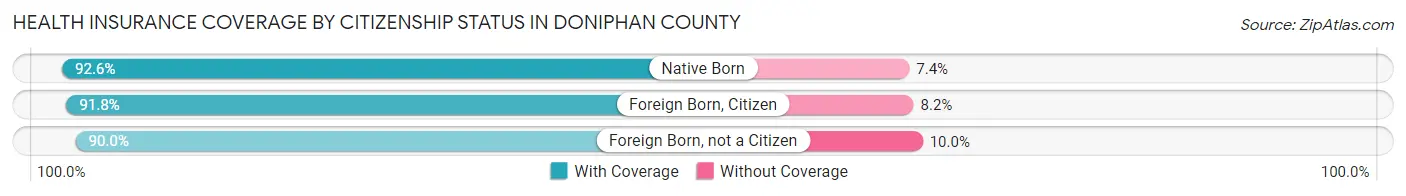
| Citizenship Status | With Coverage | Without Coverage |
| Native Born | 439 (92.6%) | 35 (7.4%) |
| Foreign Born, Citizen | 1,116 (91.8%) | 100 (8.2%) |
| Foreign Born, not a Citizen | 890 (90.0%) | 99 (10.0%) |
Health Insurance Coverage by Household Income in Doniphan County
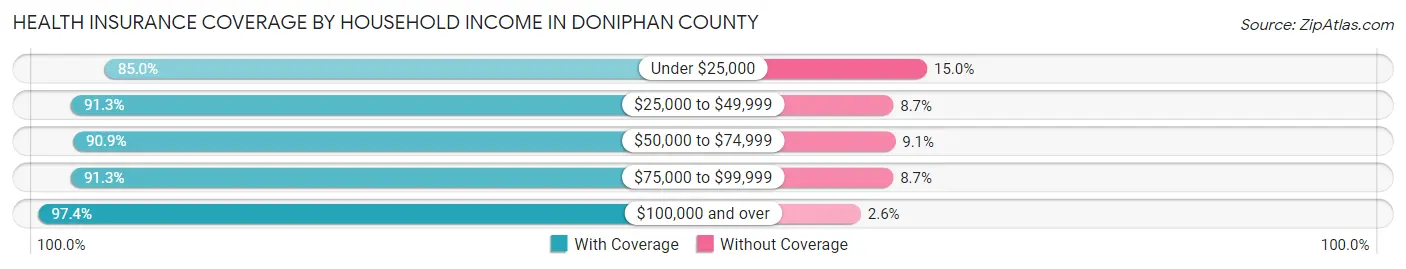
| Household Income | With Coverage | Without Coverage |
| Under $25,000 | 689 (85.0%) | 122 (15.0%) |
| $25,000 to $49,999 | 1,079 (91.3%) | 103 (8.7%) |
| $50,000 to $74,999 | 951 (90.9%) | 95 (9.1%) |
| $75,000 to $99,999 | 1,060 (91.3%) | 101 (8.7%) |
| $100,000 and over | 2,481 (97.4%) | 67 (2.6%) |
Public vs Private Health Insurance Coverage by Age in Doniphan County
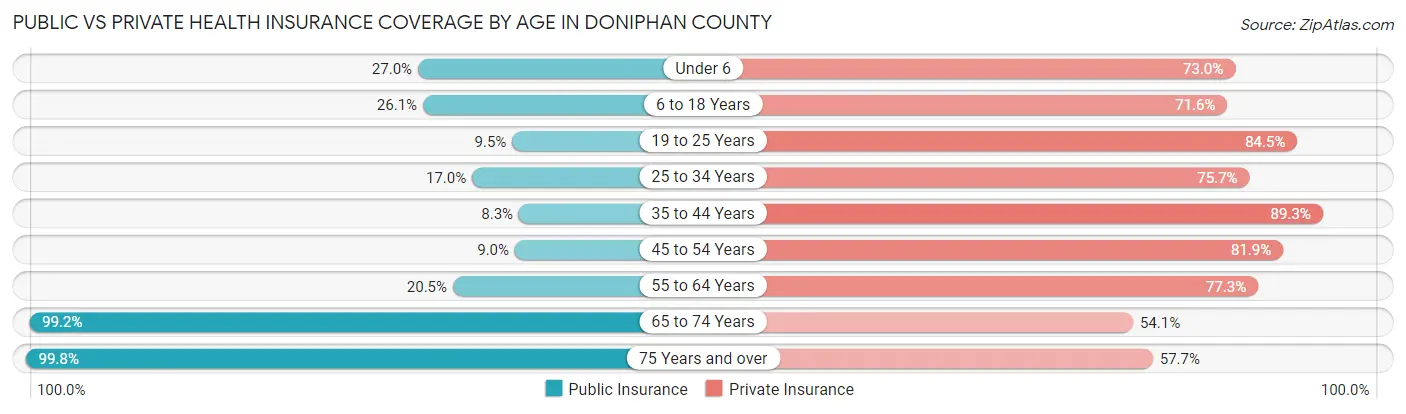
| Age Bracket | Public Insurance | Private Insurance |
| Under 6 | 128 (27.0%) | 346 (73.0%) |
| 6 to 18 Years | 317 (26.1%) | 870 (71.6%) |
| 19 to 25 Years | 94 (9.5%) | 836 (84.5%) |
| 25 to 34 Years | 110 (17.0%) | 491 (75.6%) |
| 35 to 44 Years | 66 (8.3%) | 714 (89.2%) |
| 45 to 54 Years | 77 (9.0%) | 701 (81.9%) |
| 55 to 64 Years | 210 (20.5%) | 791 (77.2%) |
| 65 to 74 Years | 833 (99.2%) | 454 (54.0%) |
| 75 Years and over | 555 (99.8%) | 321 (57.7%) |
| Total | 2,390 (32.3%) | 5,524 (74.6%) |
Disability Status by Sex by Age in Doniphan County
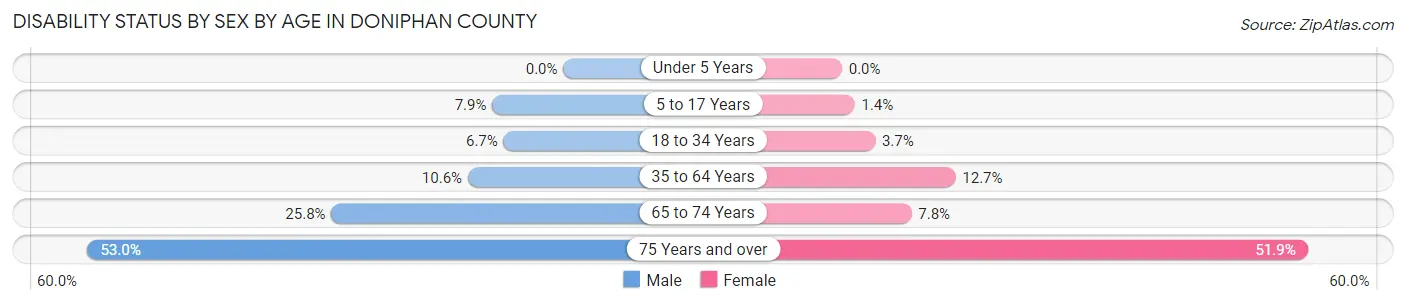
| Age Bracket | Male | Female |
| Under 5 Years | 0 (0.0%) | 0 (0.0%) |
| 5 to 17 Years | 42 (7.9%) | 8 (1.4%) |
| 18 to 34 Years | 72 (6.7%) | 29 (3.7%) |
| 35 to 64 Years | 142 (10.6%) | 170 (12.7%) |
| 65 to 74 Years | 117 (25.8%) | 30 (7.7%) |
| 75 Years and over | 124 (53.0%) | 167 (51.9%) |
Disability Class by Sex by Age in Doniphan County
Disability Class: Hearing Difficulty
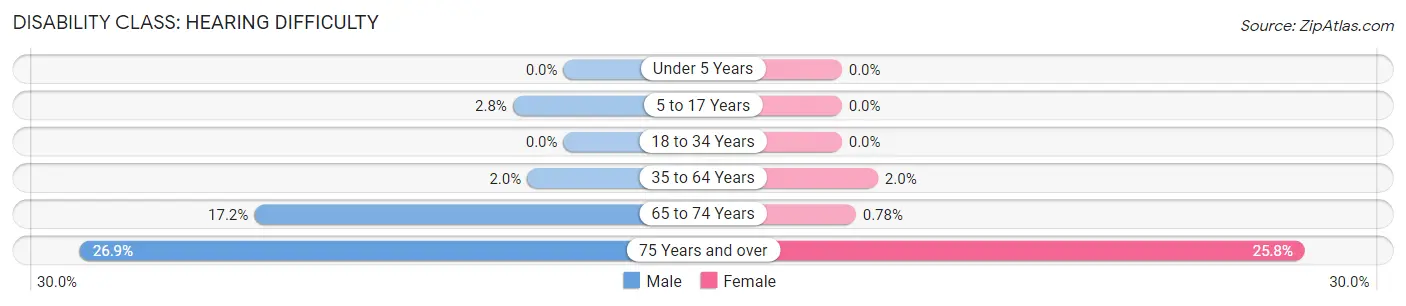
| Age Bracket | Male | Female |
| Under 5 Years | 0 (0.0%) | 0 (0.0%) |
| 5 to 17 Years | 15 (2.8%) | 0 (0.0%) |
| 18 to 34 Years | 0 (0.0%) | 0 (0.0%) |
| 35 to 64 Years | 27 (2.0%) | 27 (2.0%) |
| 65 to 74 Years | 78 (17.2%) | 3 (0.8%) |
| 75 Years and over | 63 (26.9%) | 83 (25.8%) |
Disability Class: Vision Difficulty
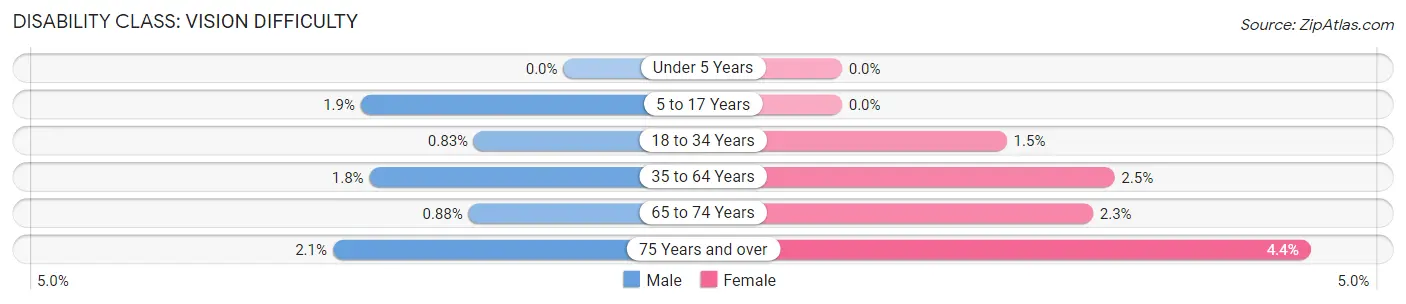
| Age Bracket | Male | Female |
| Under 5 Years | 0 (0.0%) | 0 (0.0%) |
| 5 to 17 Years | 10 (1.9%) | 0 (0.0%) |
| 18 to 34 Years | 9 (0.8%) | 12 (1.5%) |
| 35 to 64 Years | 24 (1.8%) | 34 (2.5%) |
| 65 to 74 Years | 4 (0.9%) | 9 (2.3%) |
| 75 Years and over | 5 (2.1%) | 14 (4.3%) |
Disability Class: Cognitive Difficulty
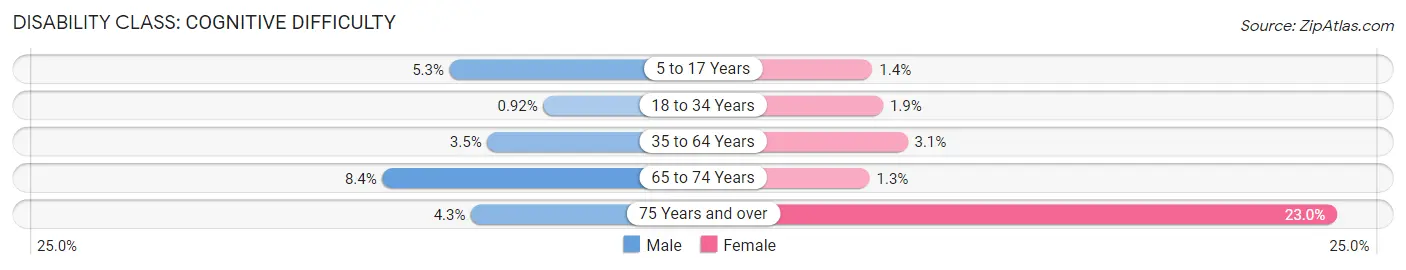
| Age Bracket | Male | Female |
| 5 to 17 Years | 28 (5.3%) | 8 (1.4%) |
| 18 to 34 Years | 10 (0.9%) | 15 (1.9%) |
| 35 to 64 Years | 47 (3.5%) | 41 (3.0%) |
| 65 to 74 Years | 38 (8.4%) | 5 (1.3%) |
| 75 Years and over | 10 (4.3%) | 74 (23.0%) |
Disability Class: Ambulatory Difficulty
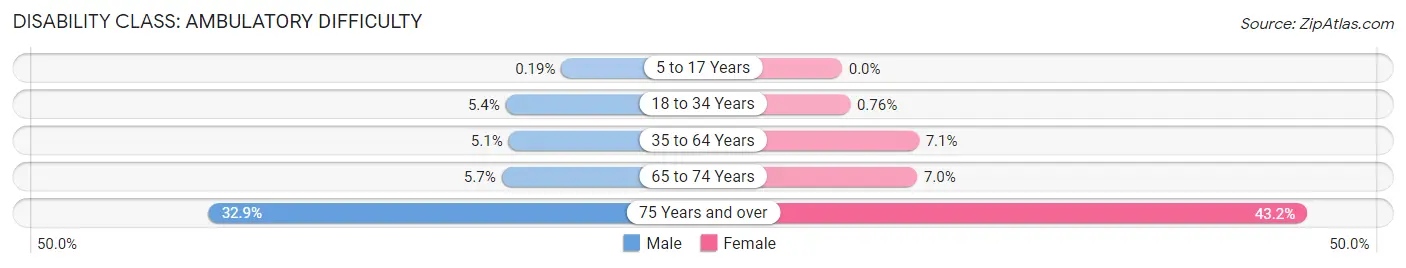
| Age Bracket | Male | Female |
| 5 to 17 Years | 1 (0.2%) | 0 (0.0%) |
| 18 to 34 Years | 58 (5.4%) | 6 (0.8%) |
| 35 to 64 Years | 68 (5.1%) | 96 (7.1%) |
| 65 to 74 Years | 26 (5.7%) | 27 (7.0%) |
| 75 Years and over | 77 (32.9%) | 139 (43.2%) |
Disability Class: Self-Care Difficulty
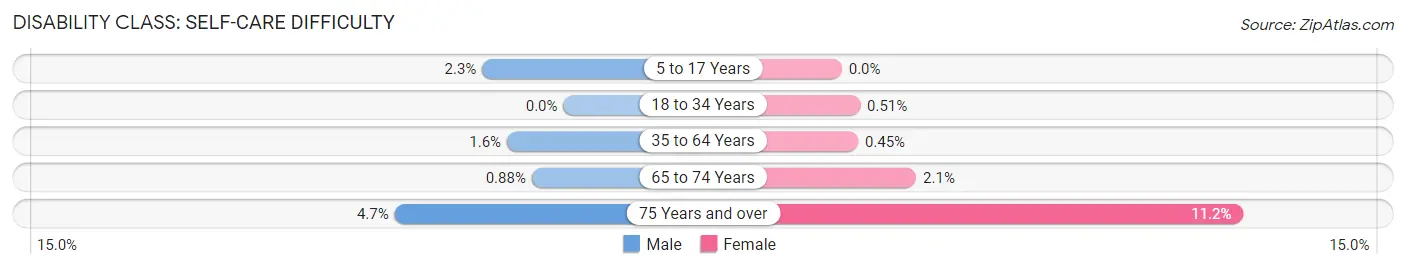
| Age Bracket | Male | Female |
| 5 to 17 Years | 12 (2.3%) | 0 (0.0%) |
| 18 to 34 Years | 0 (0.0%) | 4 (0.5%) |
| 35 to 64 Years | 21 (1.6%) | 6 (0.4%) |
| 65 to 74 Years | 4 (0.9%) | 8 (2.1%) |
| 75 Years and over | 11 (4.7%) | 36 (11.2%) |
Technology Access in Doniphan County
Computing Device Access in Doniphan County
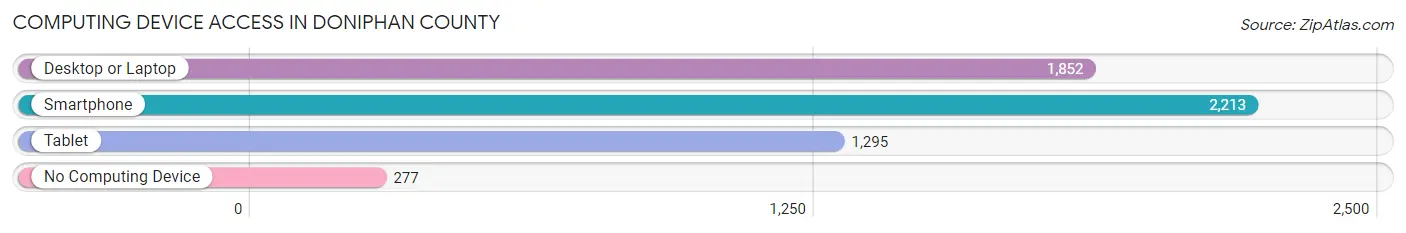
| Device Type | # Households | % Households |
| Desktop or Laptop | 1,852 | 67.7% |
| Smartphone | 2,213 | 80.9% |
| Tablet | 1,295 | 47.3% |
| No Computing Device | 277 | 10.1% |
| Total | 2,735 | 100.0% |
Internet Access in Doniphan County
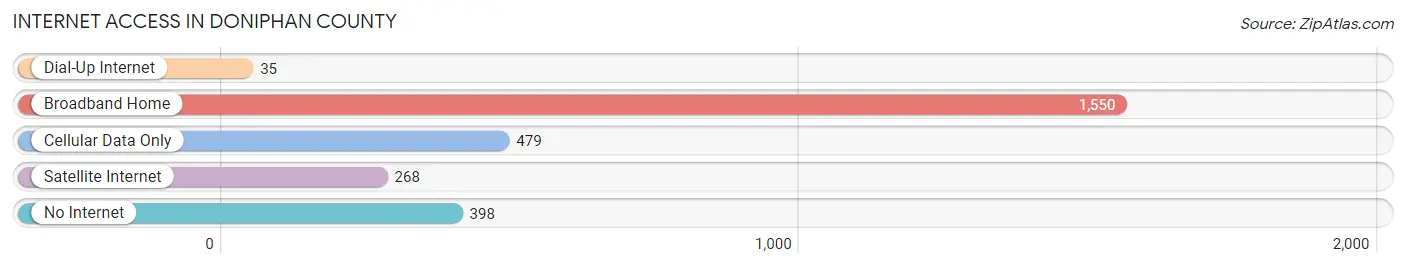
| Internet Type | # Households | % Households |
| Dial-Up Internet | 35 | 1.3% |
| Broadband Home | 1,550 | 56.7% |
| Cellular Data Only | 479 | 17.5% |
| Satellite Internet | 268 | 9.8% |
| No Internet | 398 | 14.5% |
| Total | 2,735 | 100.0% |
Doniphan County Summary
Doniphan County is located in the northeast corner of Kansas, and is bordered by Nebraska to the north, Missouri to the east, and Atchison and Brown counties to the south and west, respectively. The county seat is Troy, and the county is named after Alexander Doniphan, a prominent Missouri lawyer and military leader. Doniphan County covers an area of 576 square miles and has a population of 7,945, according to the 2010 census.
Doniphan County was established in 1855 and was one of the original 33 counties in the state of Kansas. The county was named after Alexander Doniphan, a prominent Missouri lawyer and military leader. The county was originally part of the Shawnee Indian Reservation, and the first settlers arrived in the area in the early 1850s.
The economy of Doniphan County is largely based on agriculture, with corn, soybeans, and wheat being the main crops. Other industries include manufacturing, retail, and tourism. The county is home to several small towns, including Troy, White Cloud, and Elwood.
Geographically, Doniphan County is located in the northeast corner of Kansas, and is bordered by Nebraska to the north, Missouri to the east, and Atchison and Brown counties to the south and west, respectively. The county is located in the Missouri River Valley, and is characterized by rolling hills and fertile soil. The county is home to several rivers, including the Missouri, Kansas, and Big Nemaha.
Demographically, Doniphan County is predominantly white, with a population of 7,945, according to the 2010 census. The median household income is $45,845, and the median age is 41.7 years. The county is home to several small towns, including Troy, White Cloud, and Elwood.
Doniphan County has a rich history, and was home to several Native American tribes, including the Shawnee, Pawnee, and Omaha. The county was established in 1855 and was one of the original 33 counties in the state of Kansas. The county was named after Alexander Doniphan, a prominent Missouri lawyer and military leader. The county was originally part of the Shawnee Indian Reservation, and the first settlers arrived in the area in the early 1850s.
Doniphan County is a great place to live, work, and play. The county is home to several small towns, and is a great place to raise a family. The county is also home to several parks and recreational areas, including the Doniphan County State Park, which offers camping, fishing, and hiking. The county is also home to several historical sites, including the Doniphan County Courthouse, which was built in 1856.
Doniphan County is a great place to live, work, and play. The county is home to several small towns, and is a great place to raise a family. The county is also home to several parks and recreational areas, including the Doniphan County State Park, which offers camping, fishing, and hiking. The county is also home to several historical sites, including the Doniphan County Courthouse, which was built in 1856. The county is also home to several businesses, including manufacturing, retail, and tourism. The county is also home to several educational institutions, including the Doniphan County Community College.
Doniphan County is a great place to live, work, and play. The county is home to several small towns, and is a great place to raise a family. The county is also home to several parks and recreational areas, including the Doniphan County State Park, which offers camping, fishing, and hiking. The county is also home to several historical sites, including the Doniphan County Courthouse, which was built in 1856. The county is also home to several businesses, including manufacturing, retail, and tourism. The county is also home to several educational institutions, including the Doniphan County Community College. The county is also home to several cultural and entertainment venues, including the Doniphan County Fairgrounds, which hosts a variety of events throughout the year.
Common Questions
What is Per Capita Income in Doniphan County?
Per Capita income in Doniphan County is $31,314.
What is the Median Family Income in Doniphan County?
Median Family Income in Doniphan County is $81,755.
What is the Median Household income in Doniphan County?
Median Household Income in Doniphan County is $66,358.
What is Income or Wage Gap in Doniphan County?
Income or Wage Gap in Doniphan County is 35.4%.
Women in Doniphan County earn 64.6 cents for every dollar earned by a man.
What is Inequality or Gini Index in Doniphan County?
Inequality or Gini Index in Doniphan County is 0.42.
What is the Total Population of Doniphan County?
Total Population of Doniphan County is 7,501.
What is the Total Male Population of Doniphan County?
Total Male Population of Doniphan County is 3,884.
What is the Total Female Population of Doniphan County?
Total Female Population of Doniphan County is 3,617.
What is the Ratio of Males per 100 Females in Doniphan County?
There are 107.38 Males per 100 Females in Doniphan County.
What is the Ratio of Females per 100 Males in Doniphan County?
There are 93.13 Females per 100 Males in Doniphan County.
What is the Median Population Age in Doniphan County?
Median Population Age in Doniphan County is 41.9 Years.
What is the Average Family Size in Doniphan County
Average Family Size in Doniphan County is 3.0 People.
What is the Average Household Size in Doniphan County
Average Household Size in Doniphan County is 2.5 People.
How Large is the Labor Force in Doniphan County?
There are 3,787 People in the Labor Forcein in Doniphan County.
What is the Percentage of People in the Labor Force in Doniphan County?
60.8% of People are in the Labor Force in Doniphan County.
What is the Unemployment Rate in Doniphan County?
Unemployment Rate in Doniphan County is 1.6%.