Decatur County, KS Map & Demographics
Decatur County Map
Decatur County Overview
$33,767
PER CAPITA INCOME
$71,300
AVG FAMILY INCOME
$49,412
AVG HOUSEHOLD INCOME
46.1%
WAGE / INCOME GAP [ % ]
53.9¢/ $1
WAGE / INCOME GAP [ $ ]
0.43
INEQUALITY / GINI INDEX
2,771
TOTAL POPULATION
1,407
MALE POPULATION
1,364
FEMALE POPULATION
103.15
MALES / 100 FEMALES
96.94
FEMALES / 100 MALES
50.6
MEDIAN AGE
2.8
AVG FAMILY SIZE
2.1
AVG HOUSEHOLD SIZE
1,376
LABOR FORCE [ PEOPLE ]
60.9%
PERCENT IN LABOR FORCE
4.9%
UNEMPLOYMENT RATE
Decatur County Area Codes
Income in Decatur County
Income Overview in Decatur County
Per Capita Income in Decatur County is $33,767, while median incomes of families and households are $71,300 and $49,412 respectively.
| Characteristic | Number | Measure |
| Per Capita Income | 2,771 | $33,767 |
| Median Family Income | 714 | $71,300 |
| Mean Family Income | 714 | $90,389 |
| Median Household Income | 1,324 | $49,412 |
| Mean Household Income | 1,324 | $67,705 |
| Income Deficit | 714 | $0 |
| Wage / Income Gap (%) | 2,771 | 46.11% |
| Wage / Income Gap ($) | 2,771 | 53.89¢ per $1 |
| Gini / Inequality Index | 2,771 | 0.43 |
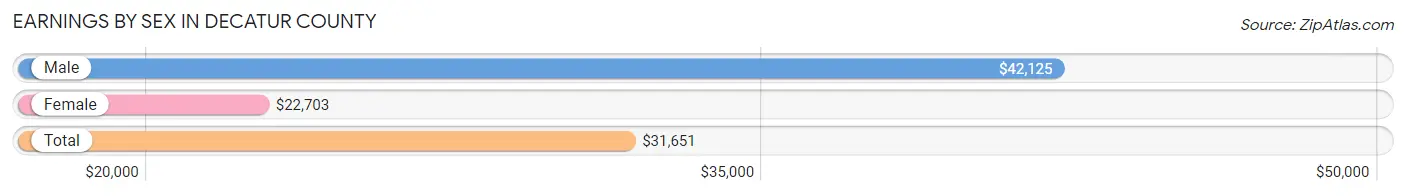
Earnings by Sex in Decatur County
Average Earnings in Decatur County are $31,651, $42,125 for men and $22,703 for women, a difference of 46.1%.
| Sex | Number | Average Earnings |
| Male | 805 (53.5%) | $42,125 |
| Female | 699 (46.5%) | $22,703 |
| Total | 1,504 (100.0%) | $31,651 |
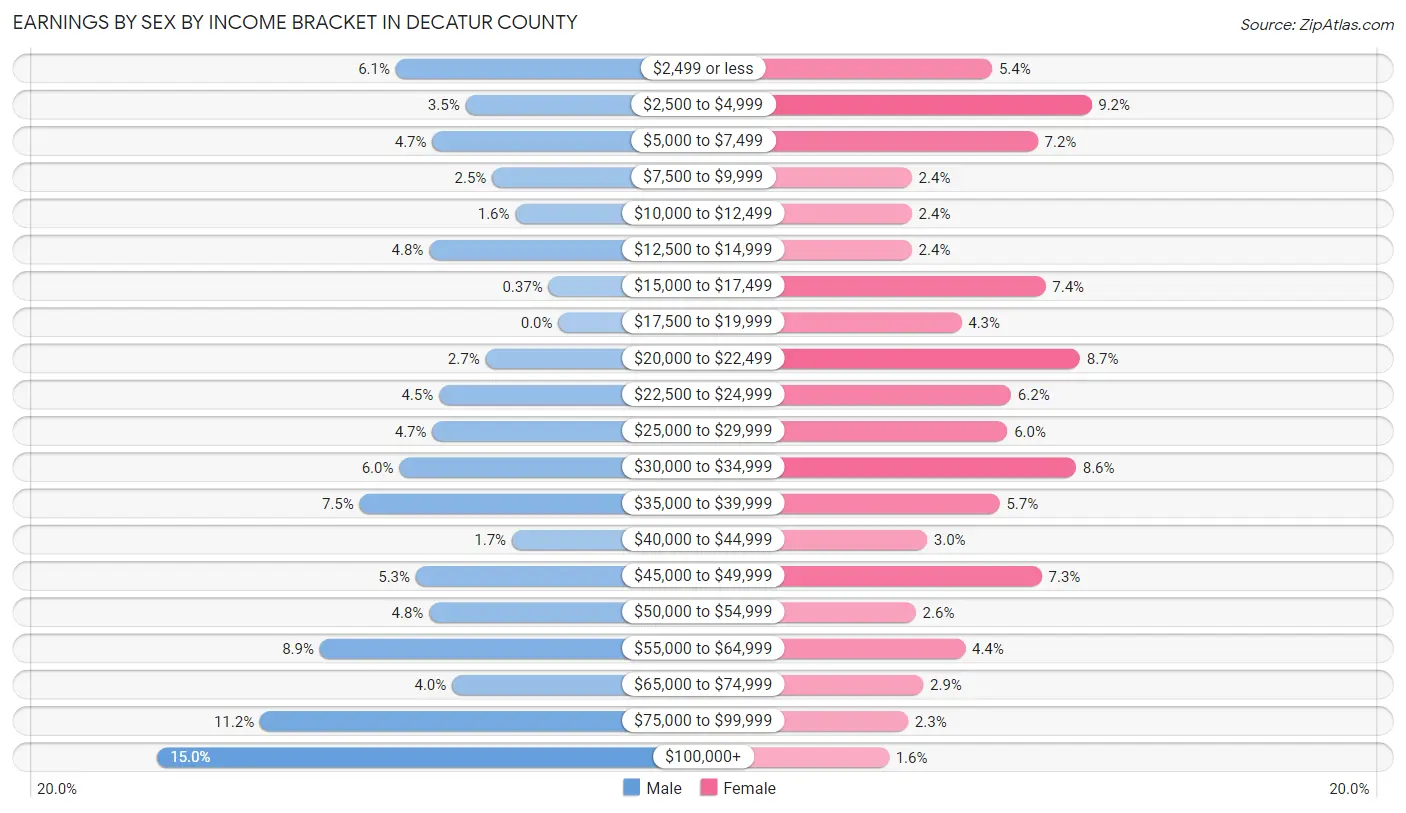
Earnings by Sex by Income Bracket in Decatur County
The most common earnings brackets in Decatur County are $100,000+ for men (121 | 15.0%) and $2,500 to $4,999 for women (64 | 9.2%).
| Income | Male | Female |
| $2,499 or less | 49 (6.1%) | 38 (5.4%) |
| $2,500 to $4,999 | 28 (3.5%) | 64 (9.2%) |
| $5,000 to $7,499 | 38 (4.7%) | 50 (7.1%) |
| $7,500 to $9,999 | 20 (2.5%) | 17 (2.4%) |
| $10,000 to $12,499 | 13 (1.6%) | 17 (2.4%) |
| $12,500 to $14,999 | 39 (4.8%) | 17 (2.4%) |
| $15,000 to $17,499 | 3 (0.4%) | 52 (7.4%) |
| $17,500 to $19,999 | 0 (0.0%) | 30 (4.3%) |
| $20,000 to $22,499 | 22 (2.7%) | 61 (8.7%) |
| $22,500 to $24,999 | 36 (4.5%) | 43 (6.1%) |
| $25,000 to $29,999 | 38 (4.7%) | 42 (6.0%) |
| $30,000 to $34,999 | 48 (6.0%) | 60 (8.6%) |
| $35,000 to $39,999 | 60 (7.4%) | 40 (5.7%) |
| $40,000 to $44,999 | 14 (1.7%) | 21 (3.0%) |
| $45,000 to $49,999 | 43 (5.3%) | 51 (7.3%) |
| $50,000 to $54,999 | 39 (4.8%) | 18 (2.6%) |
| $55,000 to $64,999 | 72 (8.9%) | 31 (4.4%) |
| $65,000 to $74,999 | 32 (4.0%) | 20 (2.9%) |
| $75,000 to $99,999 | 90 (11.2%) | 16 (2.3%) |
| $100,000+ | 121 (15.0%) | 11 (1.6%) |
| Total | 805 (100.0%) | 699 (100.0%) |
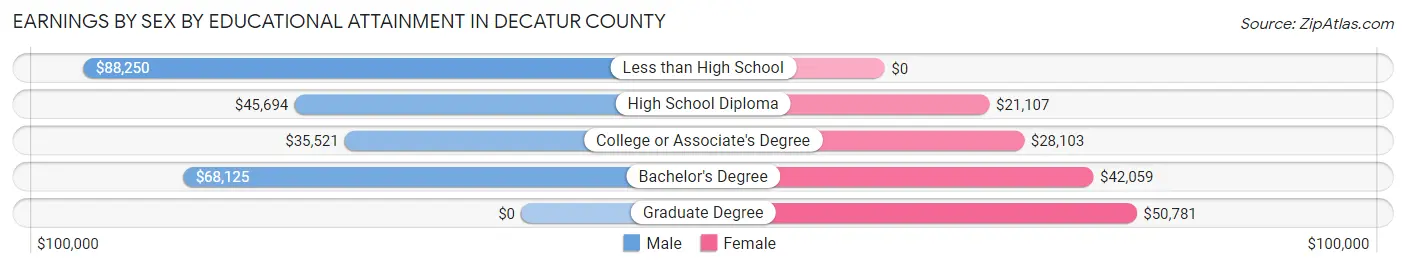
Earnings by Sex by Educational Attainment in Decatur County
Average earnings in Decatur County are $45,492 for men and $24,157 for women, a difference of 46.9%. Men with an educational attainment of less than high school enjoy the highest average annual earnings of $88,250, while those with college or associate's degree education earn the least with $35,521. Women with an educational attainment of graduate degree earn the most with the average annual earnings of $50,781, while those with high school diploma education have the smallest earnings of $21,107.
| Educational Attainment | Male Income | Female Income |
| Less than High School | $88,250 | $0 |
| High School Diploma | $45,694 | $21,107 |
| College or Associate's Degree | $35,521 | $28,103 |
| Bachelor's Degree | $68,125 | $42,059 |
| Graduate Degree | - | - |
| Total | $45,492 | $24,157 |
Family Income in Decatur County
Family Income Brackets in Decatur County
According to the Decatur County family income data, there are 125 families falling into the $100,000 to $149,999 income range, which is the most common income bracket and makes up 17.5% of all families. Conversely, the $10,000 to $14,999 income bracket is the least frequent group with only 6 families (0.8%) belonging to this category.
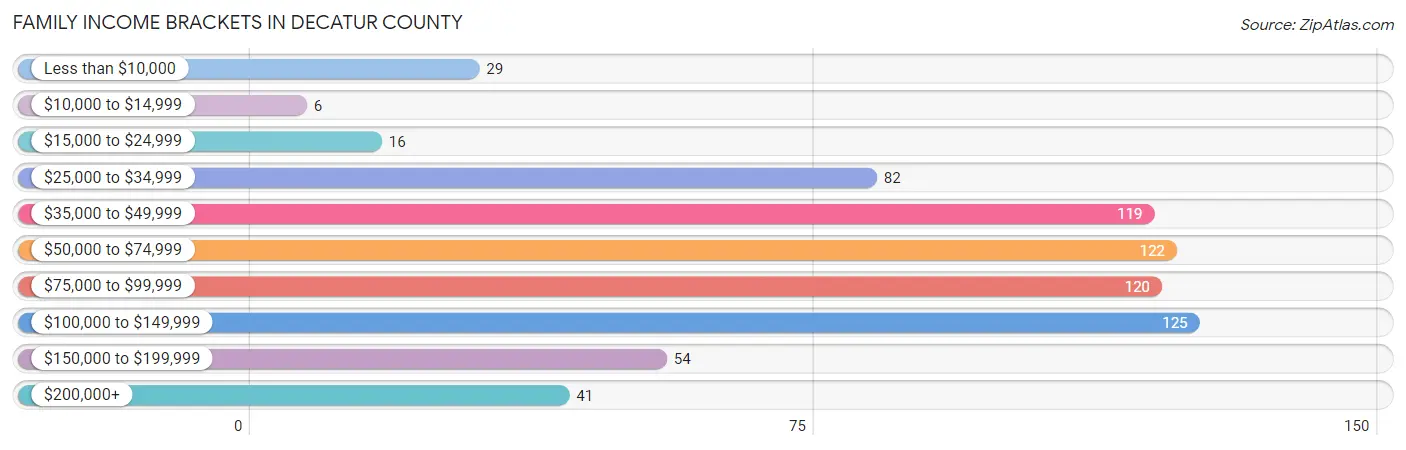
| Income Bracket | # Families | % Families |
| Less than $10,000 | 29 | 4.1% |
| $10,000 to $14,999 | 6 | 0.8% |
| $15,000 to $24,999 | 16 | 2.2% |
| $25,000 to $34,999 | 82 | 11.5% |
| $35,000 to $49,999 | 119 | 16.7% |
| $50,000 to $74,999 | 122 | 17.1% |
| $75,000 to $99,999 | 120 | 16.8% |
| $100,000 to $149,999 | 125 | 17.5% |
| $150,000 to $199,999 | 54 | 7.6% |
| $200,000+ | 41 | 5.7% |
Family Income by Famaliy Size in Decatur County
5-person families (52 | 7.3%) account for the highest median family income in Decatur County with $117,941 per family, while 2-person families (482 | 67.5%) have the highest median income of $35,400 per family member.
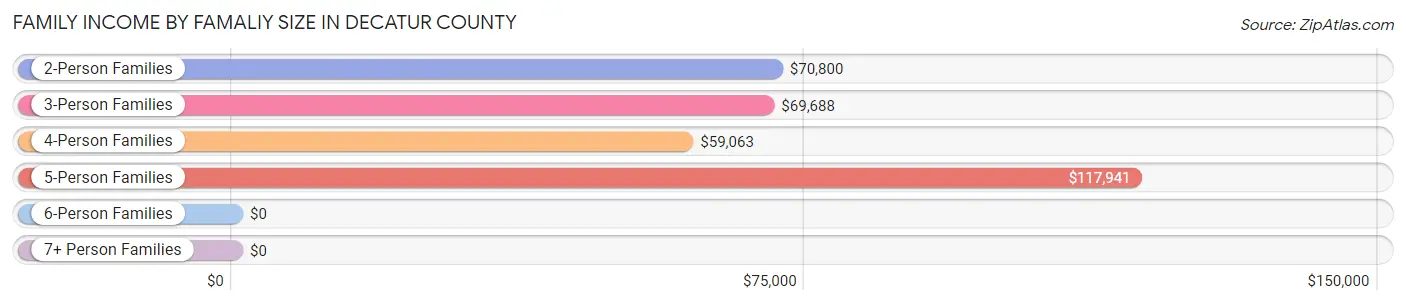
| Income Bracket | # Families | Median Income |
| 2-Person Families | 482 (67.5%) | $70,800 |
| 3-Person Families | 88 (12.3%) | $69,688 |
| 4-Person Families | 91 (12.8%) | $59,063 |
| 5-Person Families | 52 (7.3%) | $117,941 |
| 6-Person Families | 1 (0.1%) | $0 |
| 7+ Person Families | 0 (0.0%) | $0 |
| Total | 714 (100.0%) | $71,300 |
Family Income by Number of Earners in Decatur County
The median family income in Decatur County is $71,300, with families comprising 3+ earners (20) having the highest median family income of $98,750, while families with 1 earner (235) have the lowest median family income of $47,986, accounting for 2.8% and 32.9% of families, respectively.
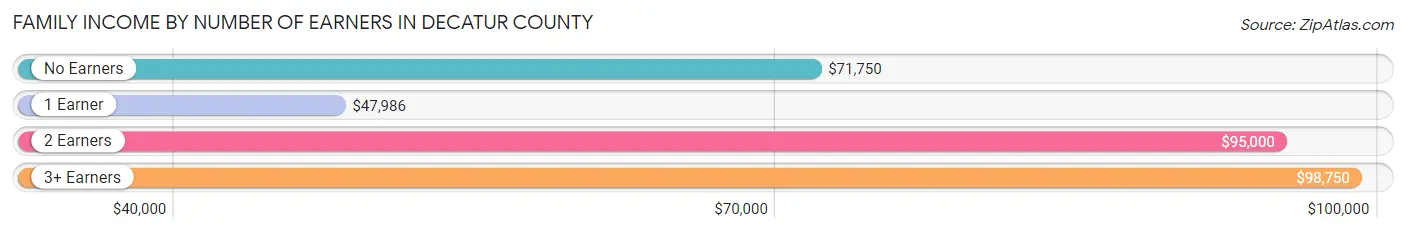
| Number of Earners | # Families | Median Income |
| No Earners | 107 (15.0%) | $71,750 |
| 1 Earner | 235 (32.9%) | $47,986 |
| 2 Earners | 352 (49.3%) | $95,000 |
| 3+ Earners | 20 (2.8%) | $98,750 |
| Total | 714 (100.0%) | $71,300 |
Household Income in Decatur County
Household Income Brackets in Decatur County
With 249 households falling in the category, the $35,000 to $49,999 income range is the most frequent in Decatur County, accounting for 18.8% of all households. In contrast, only 41 households (3.1%) fall into the $200,000+ income bracket, making it the least populous group.
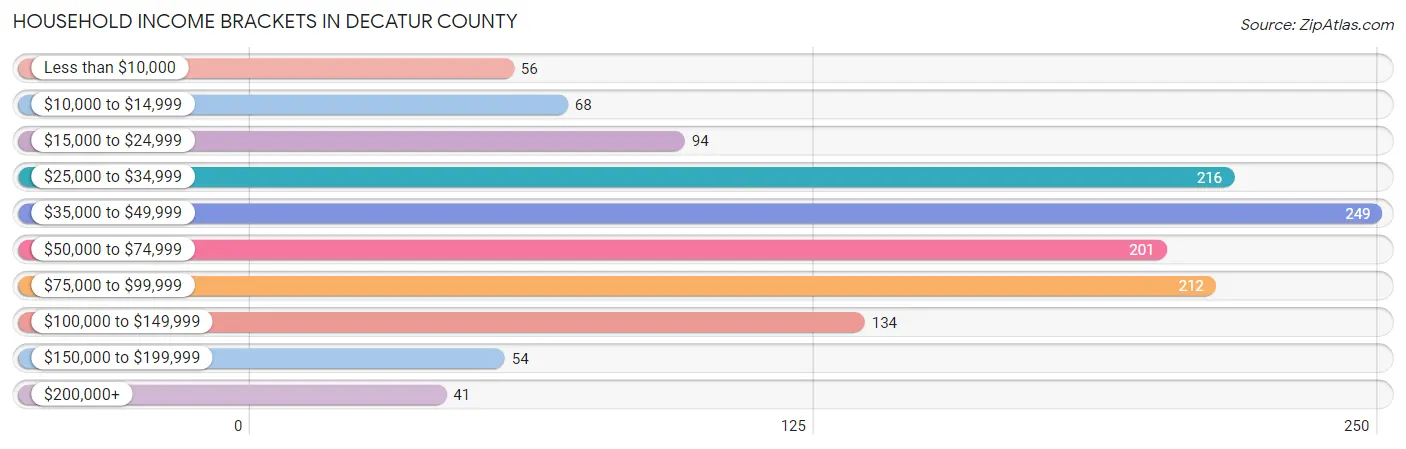
| Income Bracket | # Households | % Households |
| Less than $10,000 | 56 | 4.2% |
| $10,000 to $14,999 | 68 | 5.1% |
| $15,000 to $24,999 | 94 | 7.1% |
| $25,000 to $34,999 | 216 | 16.3% |
| $35,000 to $49,999 | 249 | 18.8% |
| $50,000 to $74,999 | 201 | 15.2% |
| $75,000 to $99,999 | 212 | 16.0% |
| $100,000 to $149,999 | 134 | 10.1% |
| $150,000 to $199,999 | 54 | 4.1% |
| $200,000+ | 41 | 3.1% |
Household Income by Householder Age in Decatur County
The median household income in Decatur County is $49,412, with the highest median household income of $68,333 found in the 25 to 44 years age bracket for the primary householder. A total of 316 households (23.9%) fall into this category. Meanwhile, the 65+ years age bracket for the primary householder has the lowest median household income of $39,962, with 561 households (42.4%) in this group.
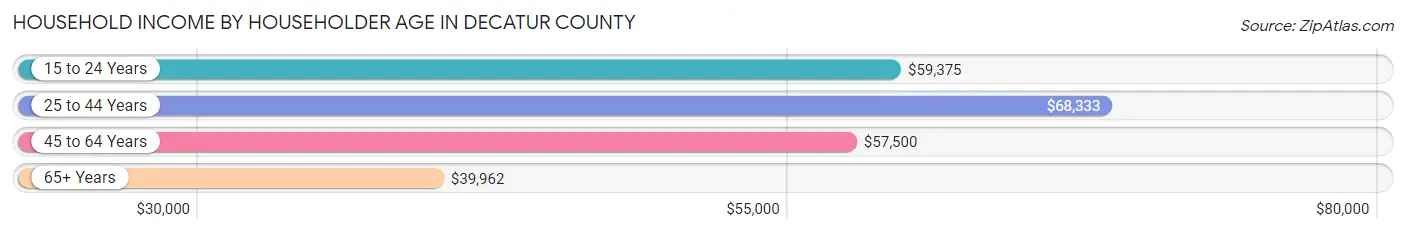
| Income Bracket | # Households | Median Income |
| 15 to 24 Years | 29 (2.2%) | $59,375 |
| 25 to 44 Years | 316 (23.9%) | $68,333 |
| 45 to 64 Years | 418 (31.6%) | $57,500 |
| 65+ Years | 561 (42.4%) | $39,962 |
| Total | 1,324 (100.0%) | $49,412 |
Poverty in Decatur County
Income Below Poverty by Sex and Age in Decatur County
With 7.9% poverty level for males and 16.8% for females among the residents of Decatur County, 16 and 17 year old males and 18 to 24 year old females are the most vulnerable to poverty, with 8 males (32.0%) and 37 females (71.2%) in their respective age groups living below the poverty level.
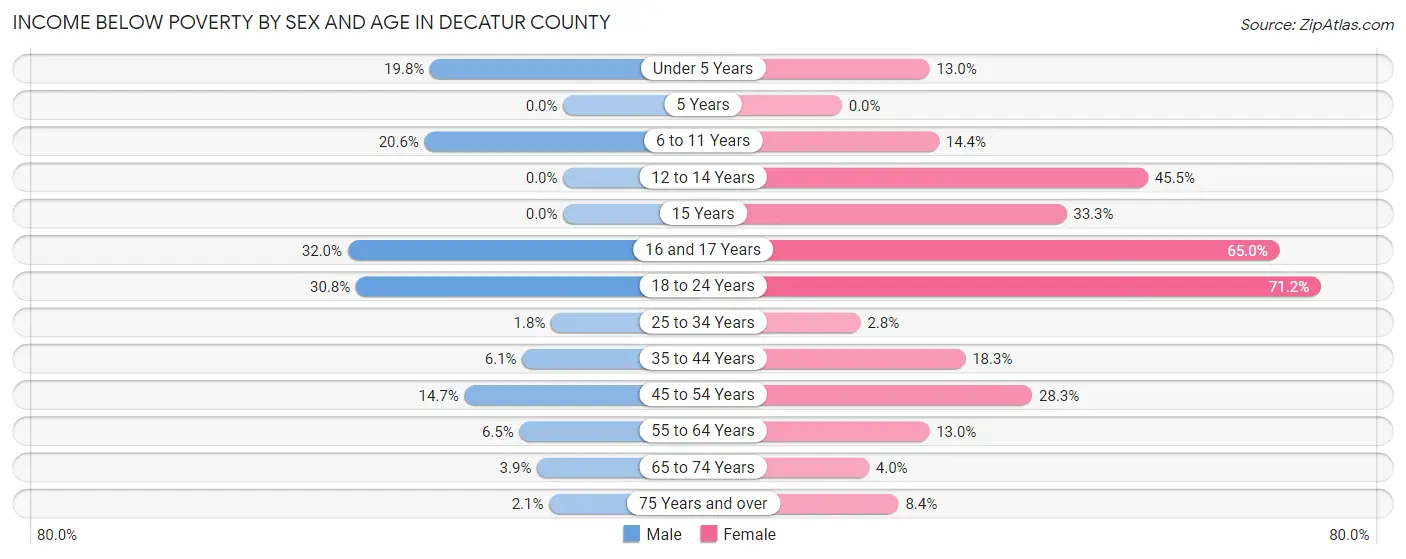
| Age Bracket | Male | Female |
| Under 5 Years | 18 (19.8%) | 6 (13.0%) |
| 5 Years | 0 (0.0%) | 0 (0.0%) |
| 6 to 11 Years | 14 (20.6%) | 16 (14.4%) |
| 12 to 14 Years | 0 (0.0%) | 10 (45.5%) |
| 15 Years | 0 (0.0%) | 8 (33.3%) |
| 16 and 17 Years | 8 (32.0%) | 26 (65.0%) |
| 18 to 24 Years | 12 (30.8%) | 37 (71.2%) |
| 25 to 34 Years | 3 (1.8%) | 4 (2.8%) |
| 35 to 44 Years | 9 (6.1%) | 22 (18.3%) |
| 45 to 54 Years | 17 (14.7%) | 39 (28.3%) |
| 55 to 64 Years | 17 (6.5%) | 27 (13.0%) |
| 65 to 74 Years | 8 (3.9%) | 8 (4.0%) |
| 75 Years and over | 3 (2.1%) | 17 (8.4%) |
| Total | 109 (7.9%) | 220 (16.8%) |
Income Above Poverty by Sex and Age in Decatur County
According to the poverty statistics in Decatur County, males aged 5 years and females aged 5 years are the age groups that are most secure financially, with 100.0% of males and 100.0% of females in these age groups living above the poverty line.
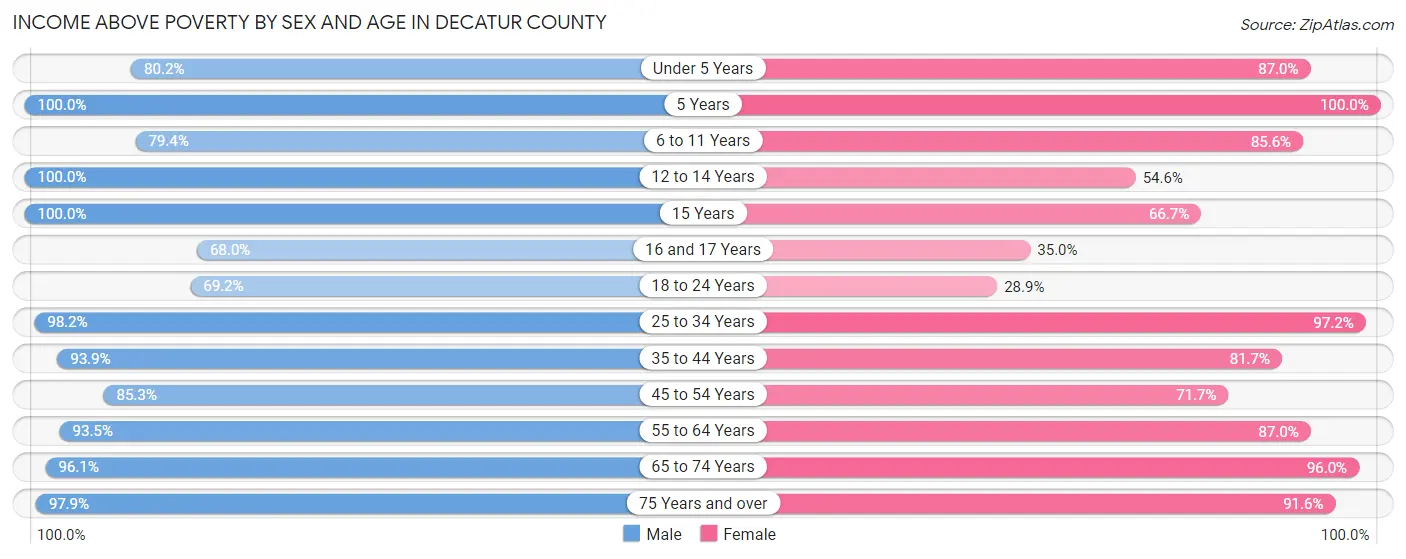
| Age Bracket | Male | Female |
| Under 5 Years | 73 (80.2%) | 40 (87.0%) |
| 5 Years | 19 (100.0%) | 3 (100.0%) |
| 6 to 11 Years | 54 (79.4%) | 95 (85.6%) |
| 12 to 14 Years | 75 (100.0%) | 12 (54.5%) |
| 15 Years | 18 (100.0%) | 16 (66.7%) |
| 16 and 17 Years | 17 (68.0%) | 14 (35.0%) |
| 18 to 24 Years | 27 (69.2%) | 15 (28.8%) |
| 25 to 34 Years | 164 (98.2%) | 140 (97.2%) |
| 35 to 44 Years | 139 (93.9%) | 98 (81.7%) |
| 45 to 54 Years | 99 (85.3%) | 99 (71.7%) |
| 55 to 64 Years | 244 (93.5%) | 181 (87.0%) |
| 65 to 74 Years | 198 (96.1%) | 191 (96.0%) |
| 75 Years and over | 141 (97.9%) | 185 (91.6%) |
| Total | 1,268 (92.1%) | 1,089 (83.2%) |
Income Below Poverty Among Married-Couple Families in Decatur County
The poverty statistics for married-couple families in Decatur County show that 3.2% or 20 of the total 617 families live below the poverty line. Families with 1 or 2 children have the highest poverty rate of 16.7%, comprising of 18 families. On the other hand, families with no children have the lowest poverty rate of 0.2%, which includes 1 families.
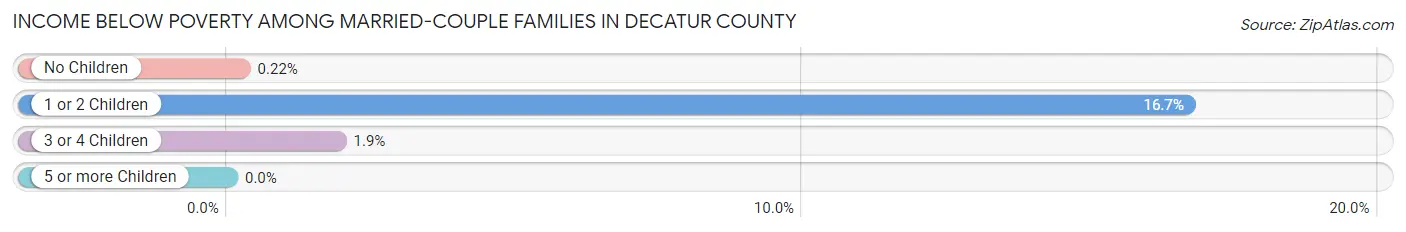
| Children | Above Poverty | Below Poverty |
| No Children | 455 (99.8%) | 1 (0.2%) |
| 1 or 2 Children | 90 (83.3%) | 18 (16.7%) |
| 3 or 4 Children | 52 (98.1%) | 1 (1.9%) |
| 5 or more Children | 0 (0.0%) | 0 (0.0%) |
| Total | 597 (96.8%) | 20 (3.2%) |
Income Below Poverty Among Single-Parent Households in Decatur County
According to the poverty data in Decatur County, 6.2% or 3 single-father households and 59.2% or 29 single-mother households are living below the poverty line. Among single-father households, those with no children have the highest poverty rate, with 3 households (12.0%) experiencing poverty. Likewise, among single-mother households, those with 1 or 2 children have the highest poverty rate, with 27 households (67.5%) falling below the poverty line.
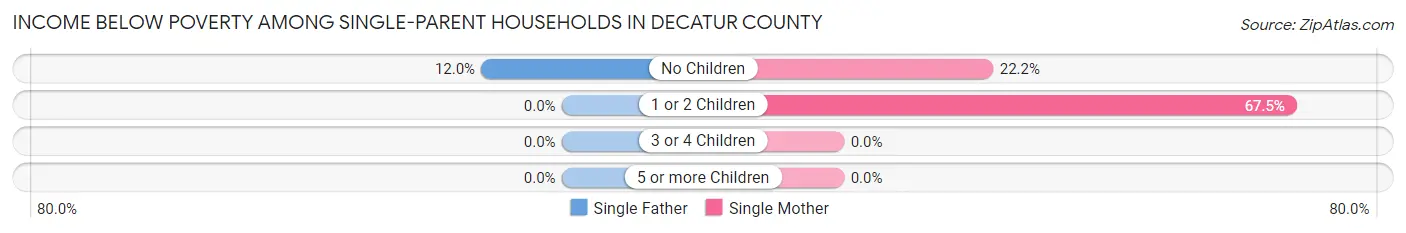
| Children | Single Father | Single Mother |
| No Children | 3 (12.0%) | 2 (22.2%) |
| 1 or 2 Children | 0 (0.0%) | 27 (67.5%) |
| 3 or 4 Children | 0 (0.0%) | 0 (0.0%) |
| 5 or more Children | 0 (0.0%) | 0 (0.0%) |
| Total | 3 (6.2%) | 29 (59.2%) |
Income Below Poverty Among Married-Couple vs Single-Parent Households in Decatur County
The poverty data for Decatur County shows that 20 of the married-couple family households (3.2%) and 32 of the single-parent households (33.0%) are living below the poverty level. Within the married-couple family households, those with 1 or 2 children have the highest poverty rate, with 18 households (16.7%) falling below the poverty line. Among the single-parent households, those with 1 or 2 children have the highest poverty rate, with 27 household (42.9%) living below poverty.
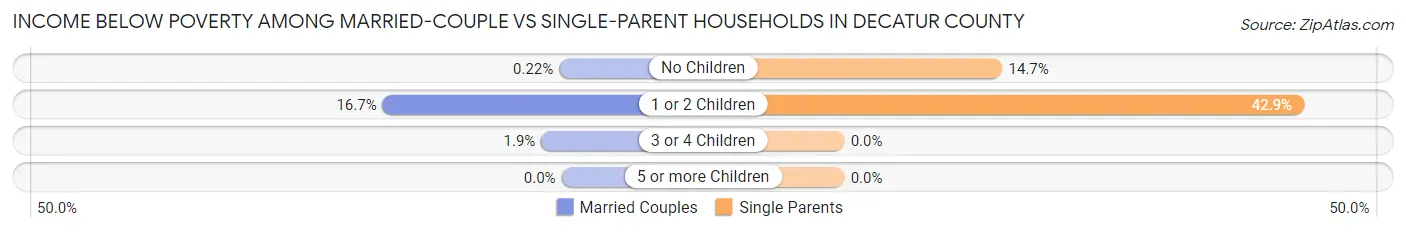
| Children | Married-Couple Families | Single-Parent Households |
| No Children | 1 (0.2%) | 5 (14.7%) |
| 1 or 2 Children | 18 (16.7%) | 27 (42.9%) |
| 3 or 4 Children | 1 (1.9%) | 0 (0.0%) |
| 5 or more Children | 0 (0.0%) | 0 (0.0%) |
| Total | 20 (3.2%) | 32 (33.0%) |
Race in Decatur County
The most populous races in Decatur County are White / Caucasian (2,633 | 95.0%), Hispanic or Latino (101 | 3.6%), and Two or more Races (58 | 2.1%).
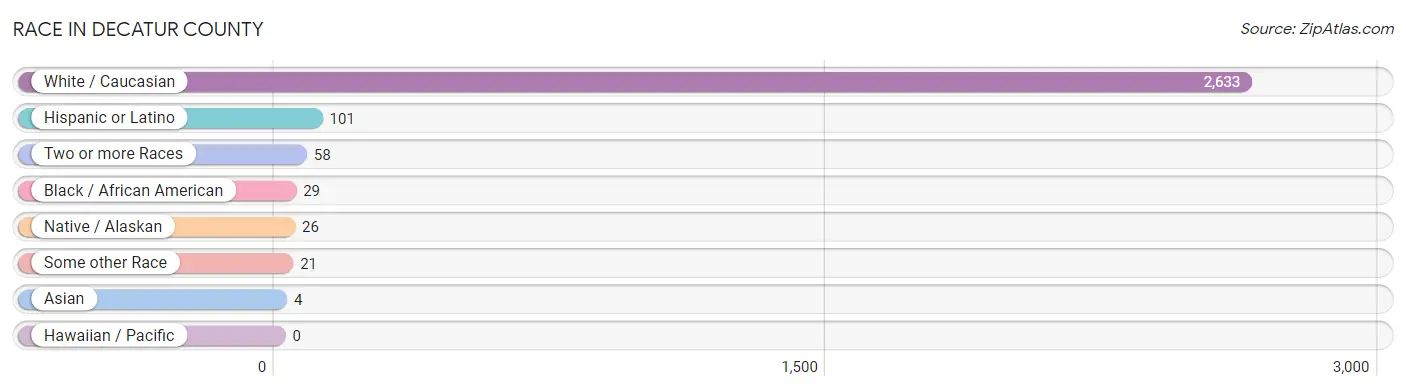
| Race | # Population | % Population |
| Asian | 4 | 0.1% |
| Black / African American | 29 | 1.1% |
| Hawaiian / Pacific | 0 | 0.0% |
| Hispanic or Latino | 101 | 3.6% |
| Native / Alaskan | 26 | 0.9% |
| White / Caucasian | 2,633 | 95.0% |
| Two or more Races | 58 | 2.1% |
| Some other Race | 21 | 0.8% |
| Total | 2,771 | 100.0% |
Ancestry in Decatur County
The most populous ancestries reported in Decatur County are German (1,013 | 36.6%), Irish (360 | 13.0%), English (281 | 10.1%), Swedish (221 | 8.0%), and American (129 | 4.7%), together accounting for 72.3% of all Decatur County residents.
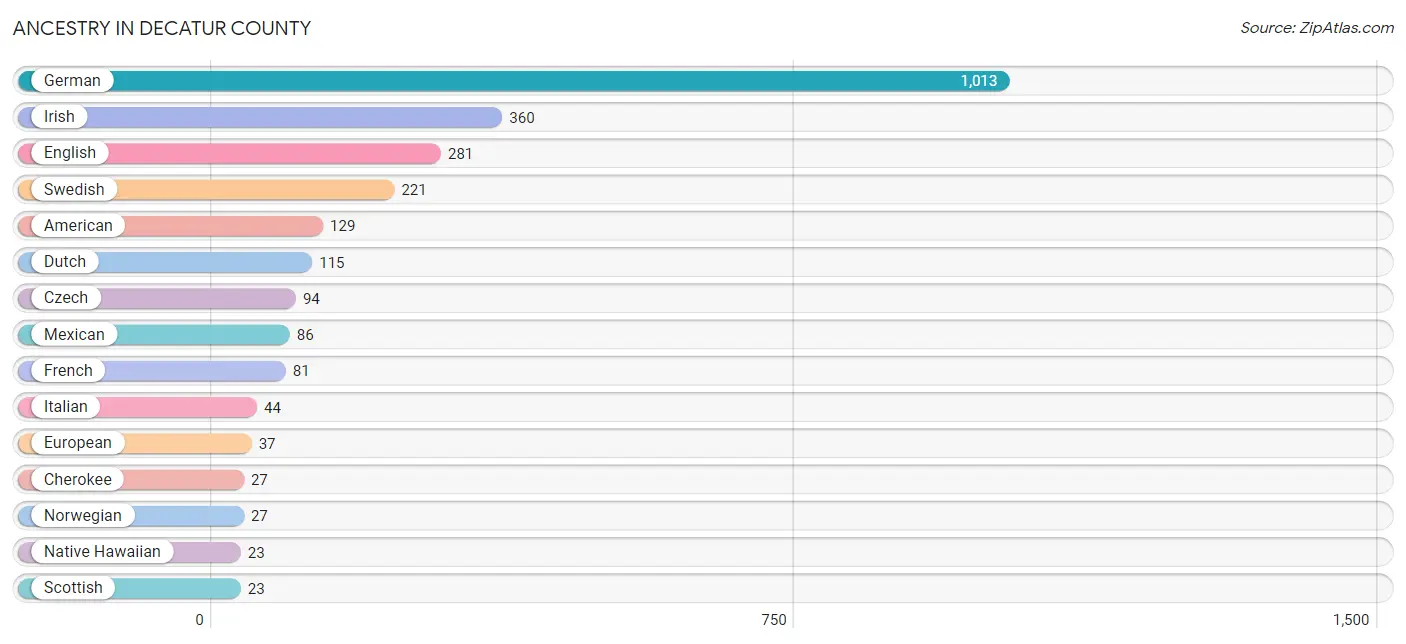
| Ancestry | # Population | % Population |
| Alsatian | 6 | 0.2% |
| American | 129 | 4.7% |
| Bhutanese | 8 | 0.3% |
| Bolivian | 6 | 0.2% |
| British | 12 | 0.4% |
| Central American | 3 | 0.1% |
| Cherokee | 27 | 1.0% |
| Czech | 94 | 3.4% |
| Czechoslovakian | 9 | 0.3% |
| Danish | 3 | 0.1% |
| Delaware | 3 | 0.1% |
| Dutch | 115 | 4.2% |
| English | 281 | 10.1% |
| European | 37 | 1.3% |
| Finnish | 3 | 0.1% |
| French | 81 | 2.9% |
| French Canadian | 20 | 0.7% |
| German | 1,013 | 36.6% |
| German Russian | 3 | 0.1% |
| Greek | 18 | 0.6% |
| Hungarian | 2 | 0.1% |
| Irish | 360 | 13.0% |
| Italian | 44 | 1.6% |
| Korean | 10 | 0.4% |
| Mexican | 86 | 3.1% |
| Native Hawaiian | 23 | 0.8% |
| Norwegian | 27 | 1.0% |
| Paiute | 3 | 0.1% |
| Pennsylvania German | 5 | 0.2% |
| Polish | 6 | 0.2% |
| Russian | 8 | 0.3% |
| Salvadoran | 3 | 0.1% |
| Scotch-Irish | 16 | 0.6% |
| Scottish | 23 | 0.8% |
| South American | 6 | 0.2% |
| Spaniard | 1 | 0.0% |
| Swedish | 221 | 8.0% |
| Swiss | 9 | 0.3% |
| Welsh | 6 | 0.2% | View All 39 Rows |
Immigrants in Decatur County
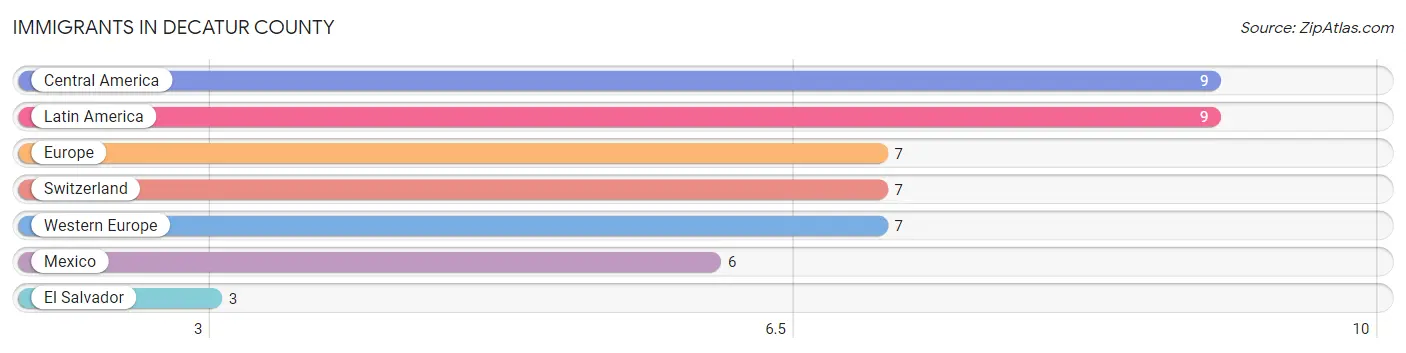
The most numerous immigrant groups reported in Decatur County came from Central America (9 | 0.3%), Latin America (9 | 0.3%), Europe (7 | 0.3%), Switzerland (7 | 0.3%), and Western Europe (7 | 0.3%), together accounting for 1.4% of all Decatur County residents.
| Immigration Origin | # Population | % Population |
| Central America | 9 | 0.3% |
| El Salvador | 3 | 0.1% |
| Europe | 7 | 0.3% |
| Latin America | 9 | 0.3% |
| Mexico | 6 | 0.2% |
| Switzerland | 7 | 0.3% |
| Western Europe | 7 | 0.3% | View All 7 Rows |
Sex and Age in Decatur County
Sex and Age in Decatur County
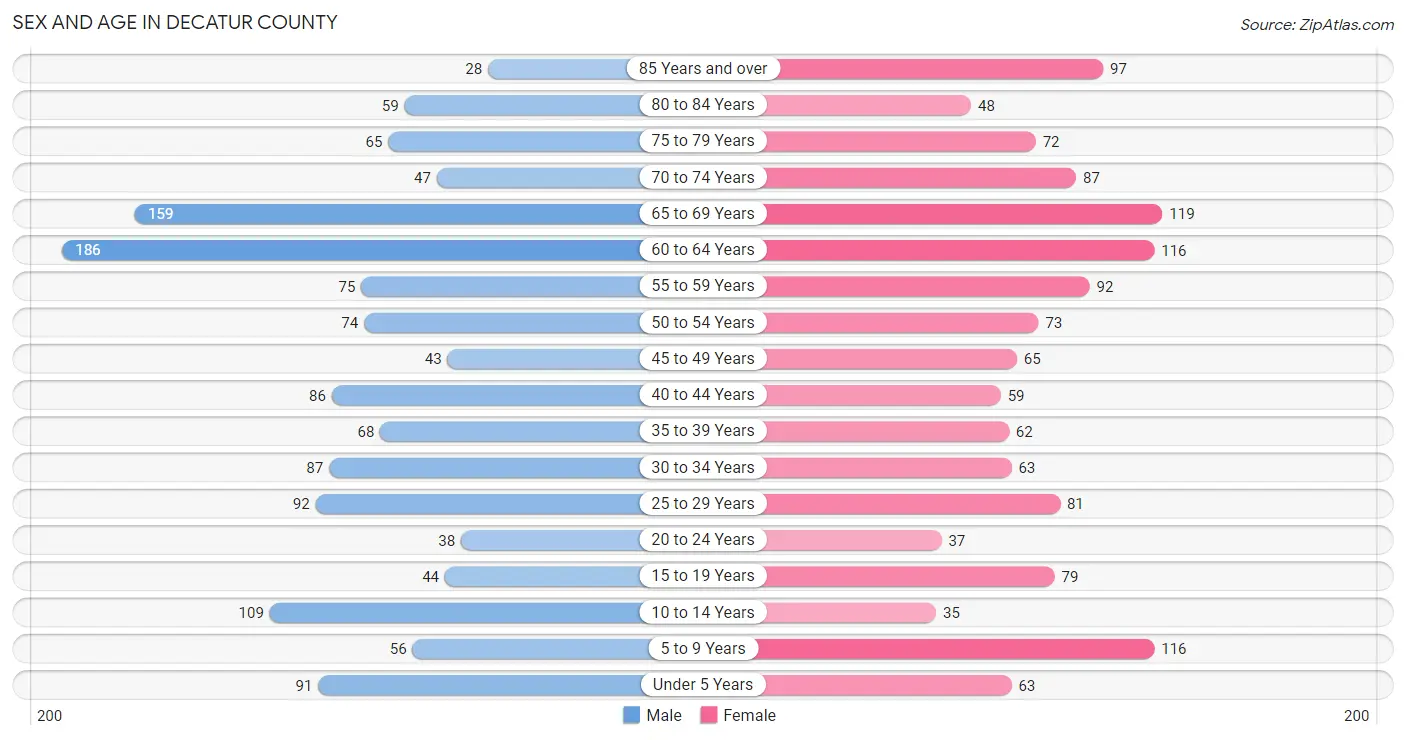
The most populous age groups in Decatur County are 60 to 64 Years (186 | 13.2%) for men and 65 to 69 Years (119 | 8.7%) for women.
| Age Bracket | Male | Female |
| Under 5 Years | 91 (6.5%) | 63 (4.6%) |
| 5 to 9 Years | 56 (4.0%) | 116 (8.5%) |
| 10 to 14 Years | 109 (7.7%) | 35 (2.6%) |
| 15 to 19 Years | 44 (3.1%) | 79 (5.8%) |
| 20 to 24 Years | 38 (2.7%) | 37 (2.7%) |
| 25 to 29 Years | 92 (6.5%) | 81 (5.9%) |
| 30 to 34 Years | 87 (6.2%) | 63 (4.6%) |
| 35 to 39 Years | 68 (4.8%) | 62 (4.5%) |
| 40 to 44 Years | 86 (6.1%) | 59 (4.3%) |
| 45 to 49 Years | 43 (3.1%) | 65 (4.8%) |
| 50 to 54 Years | 74 (5.3%) | 73 (5.3%) |
| 55 to 59 Years | 75 (5.3%) | 92 (6.7%) |
| 60 to 64 Years | 186 (13.2%) | 116 (8.5%) |
| 65 to 69 Years | 159 (11.3%) | 119 (8.7%) |
| 70 to 74 Years | 47 (3.3%) | 87 (6.4%) |
| 75 to 79 Years | 65 (4.6%) | 72 (5.3%) |
| 80 to 84 Years | 59 (4.2%) | 48 (3.5%) |
| 85 Years and over | 28 (2.0%) | 97 (7.1%) |
| Total | 1,407 (100.0%) | 1,364 (100.0%) |
Families and Households in Decatur County
Median Family Size in Decatur County
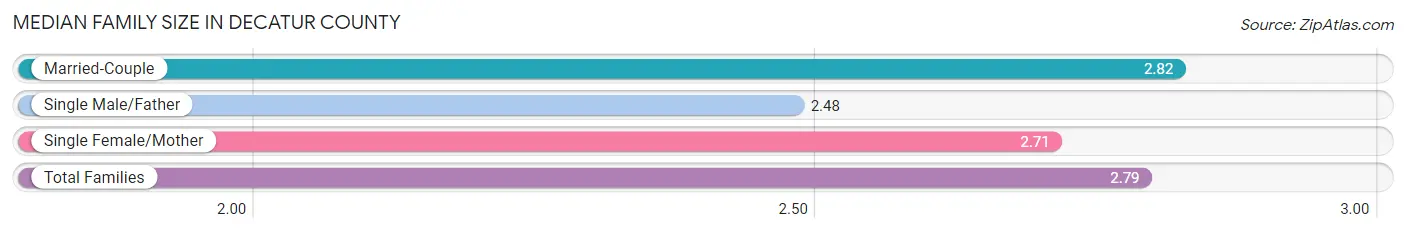
The median family size in Decatur County is 2.79 persons per family, with married-couple families (617 | 86.4%) accounting for the largest median family size of 2.82 persons per family. On the other hand, single male/father families (48 | 6.7%) represent the smallest median family size with 2.48 persons per family.
| Family Type | # Families | Family Size |
| Married-Couple | 617 (86.4%) | 2.82 |
| Single Male/Father | 48 (6.7%) | 2.48 |
| Single Female/Mother | 49 (6.9%) | 2.71 |
| Total Families | 714 (100.0%) | 2.79 |
Median Household Size in Decatur County
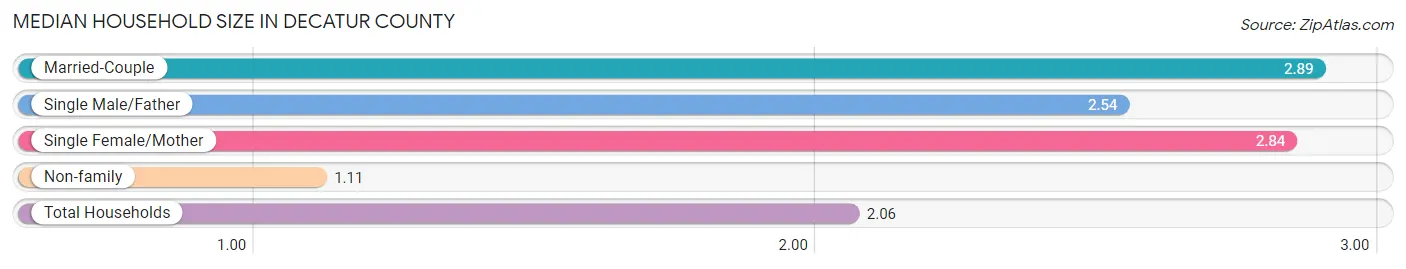
The median household size in Decatur County is 2.06 persons per household, with married-couple households (617 | 46.6%) accounting for the largest median household size of 2.89 persons per household. non-family households (610 | 46.1%) represent the smallest median household size with 1.11 persons per household.
| Household Type | # Households | Household Size |
| Married-Couple | 617 (46.6%) | 2.89 |
| Single Male/Father | 48 (3.6%) | 2.54 |
| Single Female/Mother | 49 (3.7%) | 2.84 |
| Non-family | 610 (46.1%) | 1.11 |
| Total Households | 1,324 (100.0%) | 2.06 |
Household Size by Marriage Status in Decatur County
Out of a total of 1,324 households in Decatur County, 714 (53.9%) are family households, while 610 (46.1%) are nonfamily households. The most numerous type of family households are 2-person households, comprising 465, and the most common type of nonfamily households are 1-person households, comprising 537.
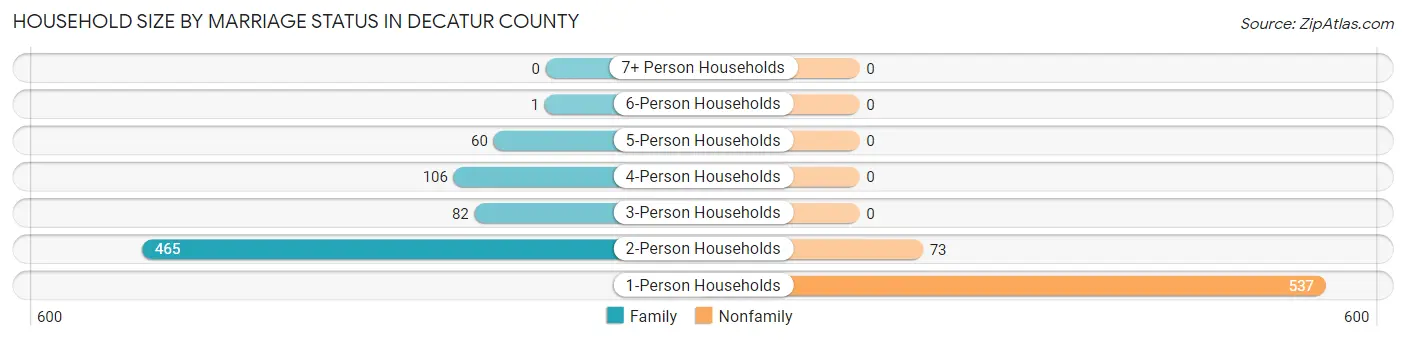
| Household Size | Family Households | Nonfamily Households |
| 1-Person Households | - | 537 (40.6%) |
| 2-Person Households | 465 (35.1%) | 73 (5.5%) |
| 3-Person Households | 82 (6.2%) | 0 (0.0%) |
| 4-Person Households | 106 (8.0%) | 0 (0.0%) |
| 5-Person Households | 60 (4.5%) | 0 (0.0%) |
| 6-Person Households | 1 (0.1%) | 0 (0.0%) |
| 7+ Person Households | 0 (0.0%) | 0 (0.0%) |
| Total | 714 (53.9%) | 610 (46.1%) |
Female Fertility in Decatur County
Fertility by Age in Decatur County
Average fertility rate in Decatur County is 16.0 births per 1,000 women. Women in the age bracket of 20 to 34 years have the highest fertility rate with 28.0 births per 1,000 women. Women in the age bracket of 20 to 34 years acount for 71.4% of all women with births.
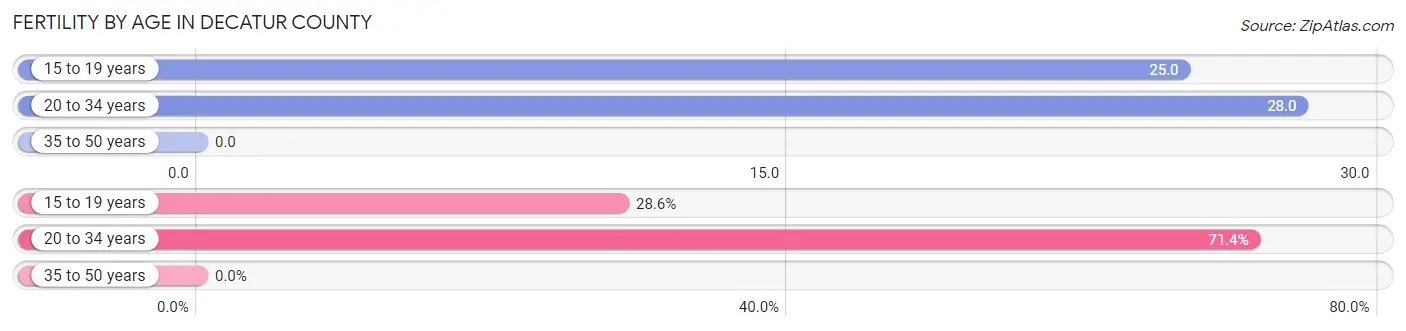
| Age Bracket | Women with Births | Births / 1,000 Women |
| 15 to 19 years | 2 (28.6%) | 25.0 |
| 20 to 34 years | 5 (71.4%) | 28.0 |
| 35 to 50 years | 0 (0.0%) | 0.0 |
| Total | 7 (100.0%) | 16.0 |
Fertility by Age by Marriage Status in Decatur County
57.1% of women with births (7) in Decatur County are married. The highest percentage of unmarried women with births falls into 15 to 19 years age bracket with 100.0% of them unmarried at the time of birth, while the lowest percentage of unmarried women with births belong to 20 to 34 years age bracket with 20.0% of them unmarried.
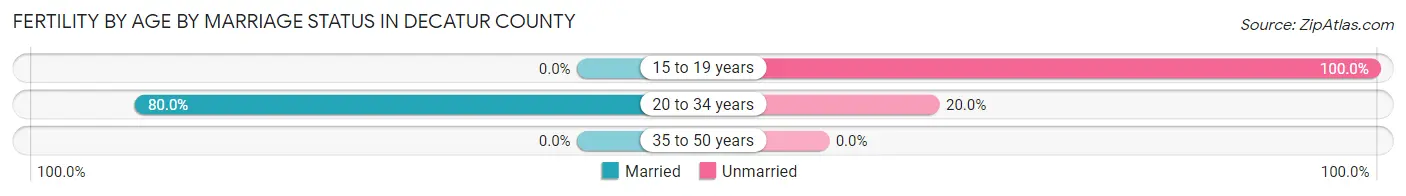
| Age Bracket | Married | Unmarried |
| 15 to 19 years | 0 (0.0%) | 2 (100.0%) |
| 20 to 34 years | 4 (80.0%) | 1 (20.0%) |
| 35 to 50 years | 0 (0.0%) | 0 (0.0%) |
| Total | 4 (57.1%) | 3 (42.9%) |
Fertility by Education in Decatur County
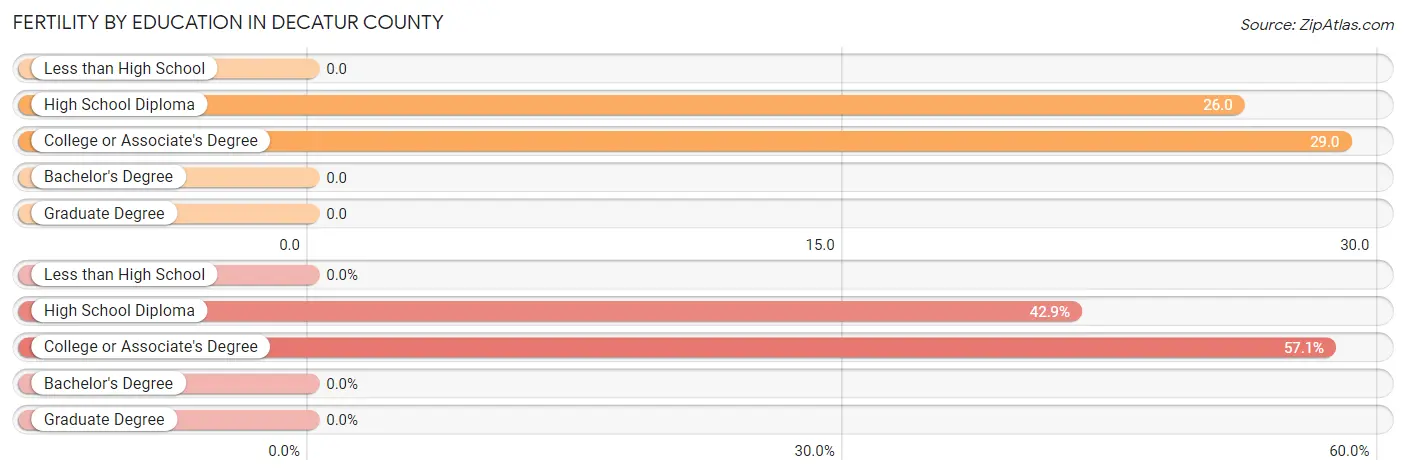
| Educational Attainment | Women with Births | Births / 1,000 Women |
| Less than High School | 0 (0.0%) | 0.0 |
| High School Diploma | 3 (42.9%) | 26.0 |
| College or Associate's Degree | 4 (57.1%) | 29.0 |
| Bachelor's Degree | 0 (0.0%) | 0.0 |
| Graduate Degree | 0 (0.0%) | 0.0 |
| Total | 7 (100.0%) | 16.0 |
Fertility by Education by Marriage Status in Decatur County
42.9% of women with births in Decatur County are unmarried. Women with the educational attainment of college or associate's degree are most likely to be married with 100.0% of them married at childbirth, while women with the educational attainment of high school diploma are least likely to be married with 100.0% of them unmarried at childbirth.
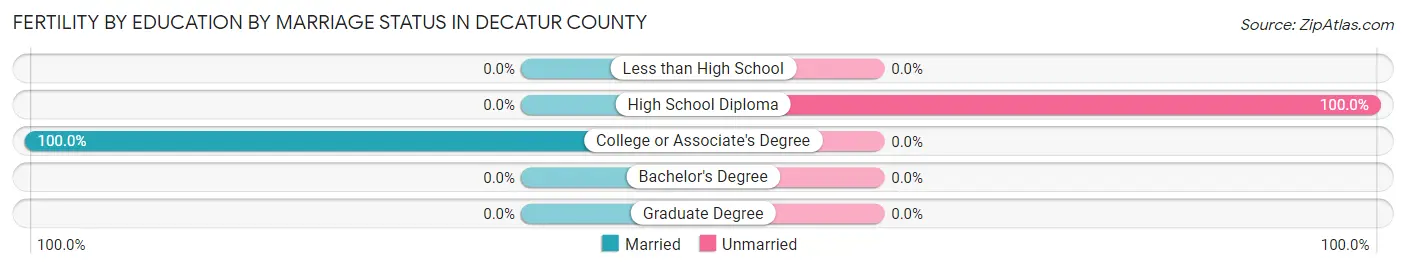
| Educational Attainment | Married | Unmarried |
| Less than High School | 0 (0.0%) | 0 (0.0%) |
| High School Diploma | 0 (0.0%) | 3 (100.0%) |
| College or Associate's Degree | 4 (100.0%) | 0 (0.0%) |
| Bachelor's Degree | 0 (0.0%) | 0 (0.0%) |
| Graduate Degree | 0 (0.0%) | 0 (0.0%) |
| Total | 4 (57.1%) | 3 (42.9%) |
Employment Characteristics in Decatur County
Employment by Class of Employer in Decatur County
Among the 1,303 employed individuals in Decatur County, private company employees (659 | 50.6%), self-employed (not incorporated) (235 | 18.0%), and local government employees (132 | 10.1%) make up the most common classes of employment.
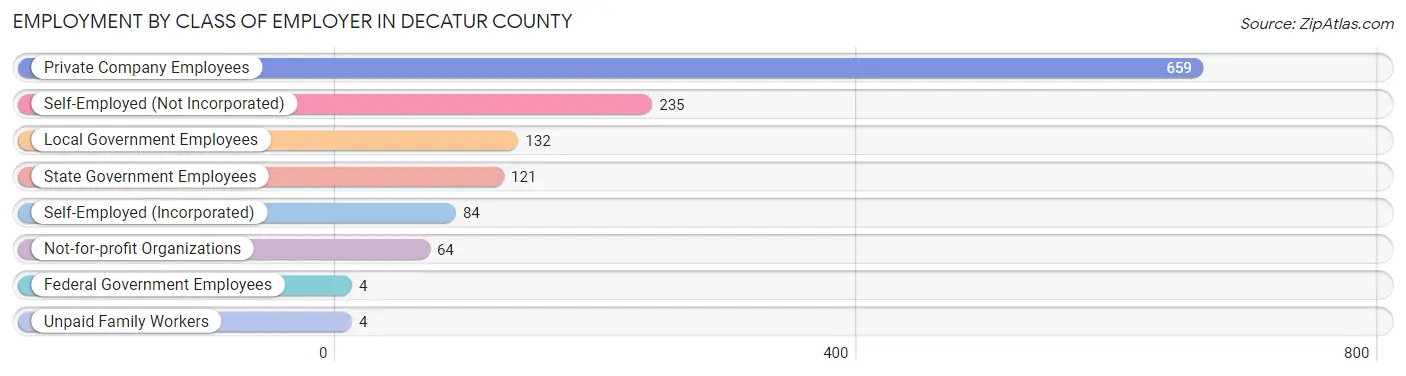
| Employer Class | # Employees | % Employees |
| Private Company Employees | 659 | 50.6% |
| Self-Employed (Incorporated) | 84 | 6.5% |
| Self-Employed (Not Incorporated) | 235 | 18.0% |
| Not-for-profit Organizations | 64 | 4.9% |
| Local Government Employees | 132 | 10.1% |
| State Government Employees | 121 | 9.3% |
| Federal Government Employees | 4 | 0.3% |
| Unpaid Family Workers | 4 | 0.3% |
| Total | 1,303 | 100.0% |
Employment Status by Age in Decatur County
According to the labor force statistics for Decatur County, out of the total population over 16 years of age (2,259), 60.9% or 1,376 individuals are in the labor force, with 4.9% or 67 of them unemployed. The age group with the highest labor force participation rate is 35 to 44 years, with 97.5% or 268 individuals in the labor force. Within the labor force, the 16 to 19 years age range has the highest percentage of unemployed individuals, with 30.0% or 15 of them being unemployed.
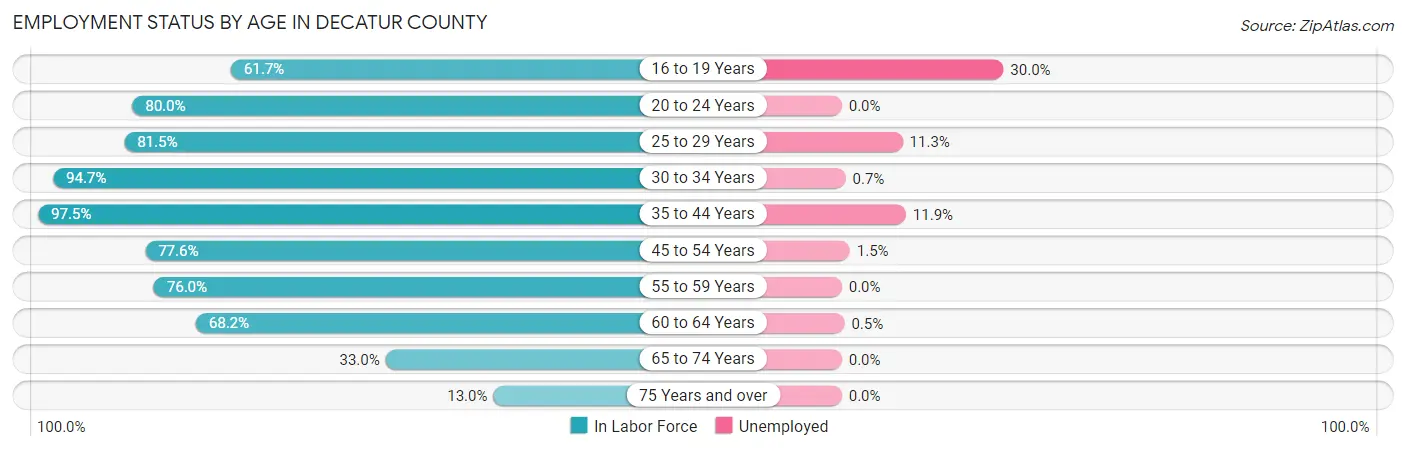
| Age Bracket | In Labor Force | Unemployed |
| 16 to 19 Years | 50 (61.7%) | 15 (30.0%) |
| 20 to 24 Years | 60 (80.0%) | 0 (0.0%) |
| 25 to 29 Years | 141 (81.5%) | 16 (11.3%) |
| 30 to 34 Years | 142 (94.7%) | 1 (0.7%) |
| 35 to 44 Years | 268 (97.5%) | 32 (11.9%) |
| 45 to 54 Years | 198 (77.6%) | 3 (1.5%) |
| 55 to 59 Years | 127 (76.0%) | 0 (0.0%) |
| 60 to 64 Years | 206 (68.2%) | 1 (0.5%) |
| 65 to 74 Years | 136 (33.0%) | 0 (0.0%) |
| 75 Years and over | 48 (13.0%) | 0 (0.0%) |
| Total | 1,376 (60.9%) | 67 (4.9%) |
Employment Status by Educational Attainment in Decatur County
According to labor force statistics for Decatur County, 81.8% of individuals (1,081) out of the total population between 25 and 64 years of age (1,322) are in the labor force, with 4.9% or 53 of them being unemployed. The group with the highest labor force participation rate are those with the educational attainment of college / associate degree, with 91.2% or 395 individuals in the labor force. Within the labor force, individuals with less than high school education have the highest percentage of unemployment, with 61.2% or 30 of them being unemployed.
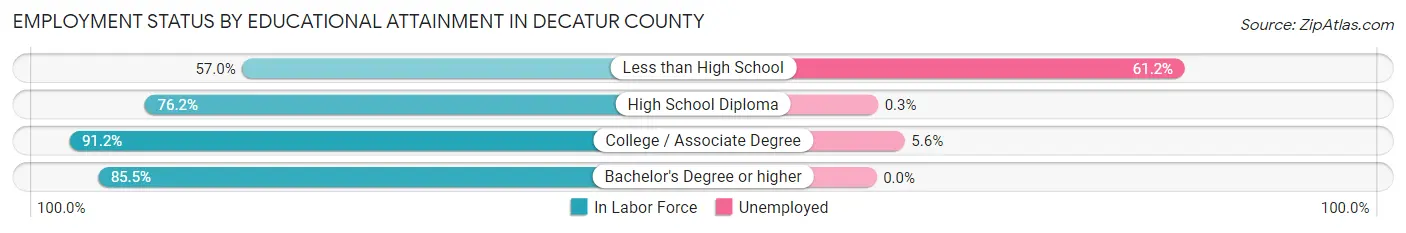
| Educational Attainment | In Labor Force | Unemployed |
| Less than High School | 49 (57.0%) | 53 (61.2%) |
| High School Diploma | 396 (76.2%) | 2 (0.3%) |
| College / Associate Degree | 395 (91.2%) | 24 (5.6%) |
| Bachelor's Degree or higher | 242 (85.5%) | 0 (0.0%) |
| Total | 1,081 (81.8%) | 65 (4.9%) |
Employment Occupations by Sex in Decatur County
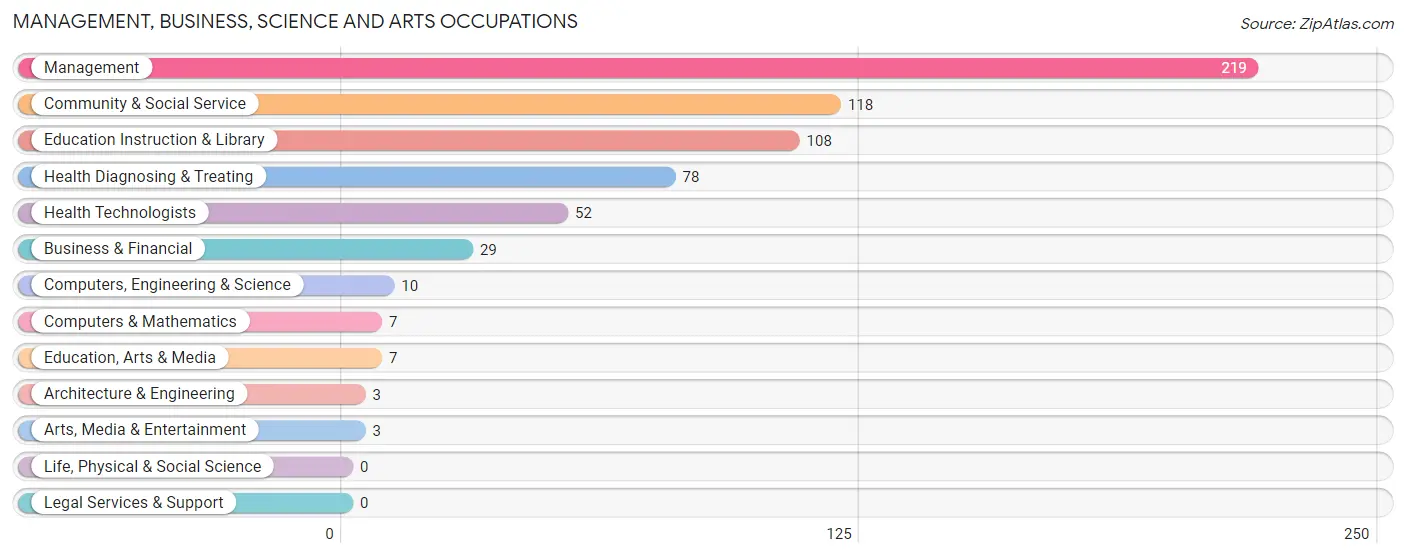
Management, Business, Science and Arts Occupations
The most common Management, Business, Science and Arts occupations in Decatur County are Management (219 | 16.7%), Community & Social Service (118 | 9.0%), Education Instruction & Library (108 | 8.3%), Health Diagnosing & Treating (78 | 6.0%), and Health Technologists (52 | 4.0%).
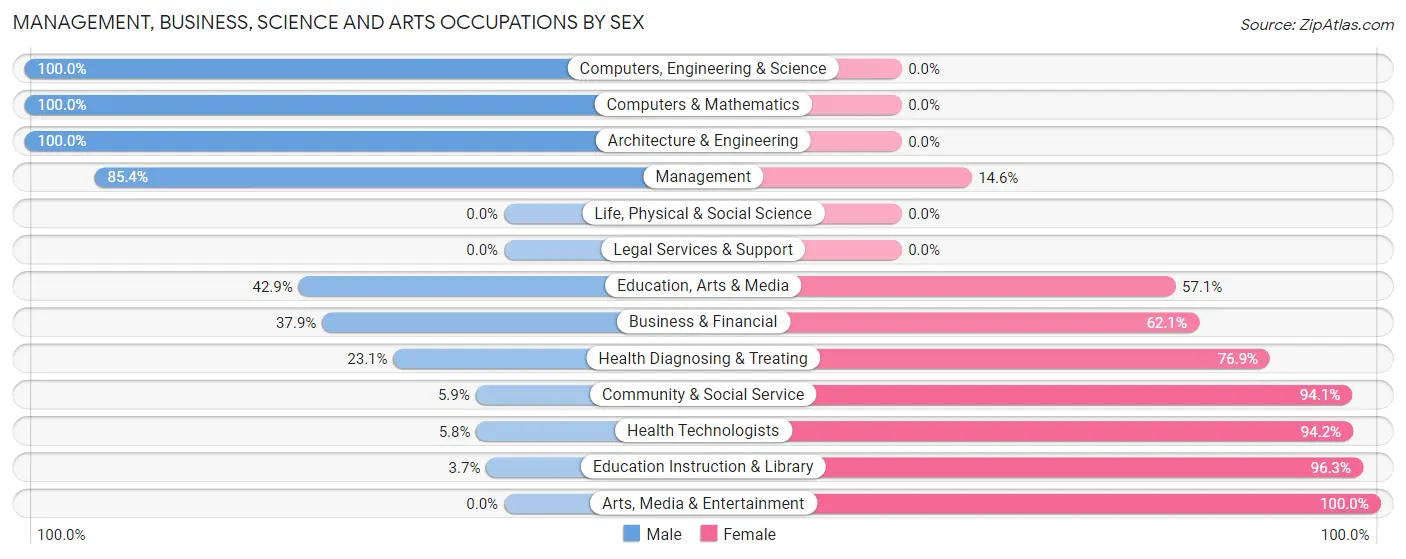
Management, Business, Science and Arts Occupations by Sex
Within the Management, Business, Science and Arts occupations in Decatur County, the most male-oriented occupations are Computers, Engineering & Science (100.0%), Computers & Mathematics (100.0%), and Architecture & Engineering (100.0%), while the most female-oriented occupations are Arts, Media & Entertainment (100.0%), Education Instruction & Library (96.3%), and Health Technologists (94.2%).
| Occupation | Male | Female |
| Management | 187 (85.4%) | 32 (14.6%) |
| Business & Financial | 11 (37.9%) | 18 (62.1%) |
| Computers, Engineering & Science | 10 (100.0%) | 0 (0.0%) |
| Computers & Mathematics | 7 (100.0%) | 0 (0.0%) |
| Architecture & Engineering | 3 (100.0%) | 0 (0.0%) |
| Life, Physical & Social Science | 0 (0.0%) | 0 (0.0%) |
| Community & Social Service | 7 (5.9%) | 111 (94.1%) |
| Education, Arts & Media | 3 (42.9%) | 4 (57.1%) |
| Legal Services & Support | 0 (0.0%) | 0 (0.0%) |
| Education Instruction & Library | 4 (3.7%) | 104 (96.3%) |
| Arts, Media & Entertainment | 0 (0.0%) | 3 (100.0%) |
| Health Diagnosing & Treating | 18 (23.1%) | 60 (76.9%) |
| Health Technologists | 3 (5.8%) | 49 (94.2%) |
| Total (Category) | 233 (51.3%) | 221 (48.7%) |
| Total (Overall) | 715 (54.7%) | 593 (45.3%) |
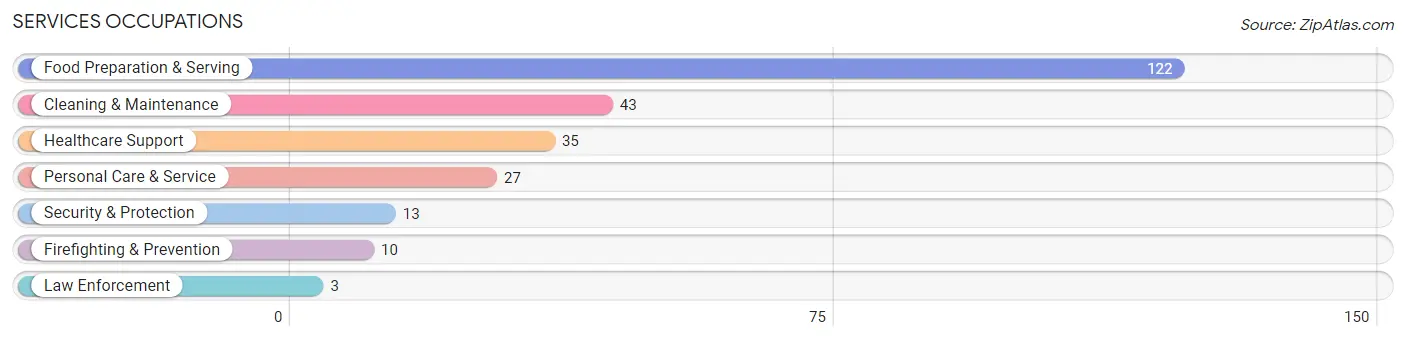
Services Occupations
The most common Services occupations in Decatur County are Food Preparation & Serving (122 | 9.3%), Cleaning & Maintenance (43 | 3.3%), Healthcare Support (35 | 2.7%), Personal Care & Service (27 | 2.1%), and Security & Protection (13 | 1.0%).
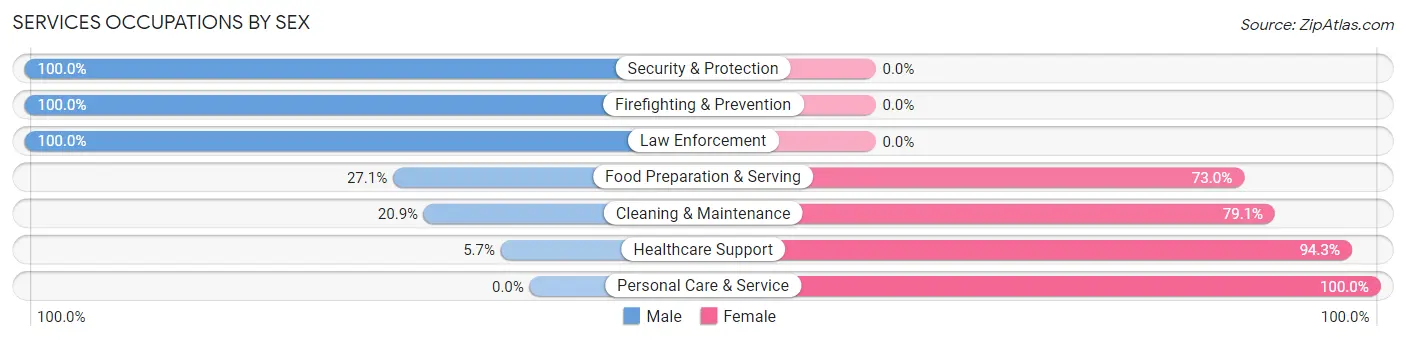
Services Occupations by Sex
Within the Services occupations in Decatur County, the most male-oriented occupations are Security & Protection (100.0%), Firefighting & Prevention (100.0%), and Law Enforcement (100.0%), while the most female-oriented occupations are Personal Care & Service (100.0%), Healthcare Support (94.3%), and Cleaning & Maintenance (79.1%).
| Occupation | Male | Female |
| Healthcare Support | 2 (5.7%) | 33 (94.3%) |
| Security & Protection | 13 (100.0%) | 0 (0.0%) |
| Firefighting & Prevention | 10 (100.0%) | 0 (0.0%) |
| Law Enforcement | 3 (100.0%) | 0 (0.0%) |
| Food Preparation & Serving | 33 (27.1%) | 89 (73.0%) |
| Cleaning & Maintenance | 9 (20.9%) | 34 (79.1%) |
| Personal Care & Service | 0 (0.0%) | 27 (100.0%) |
| Total (Category) | 57 (23.7%) | 183 (76.2%) |
| Total (Overall) | 715 (54.7%) | 593 (45.3%) |
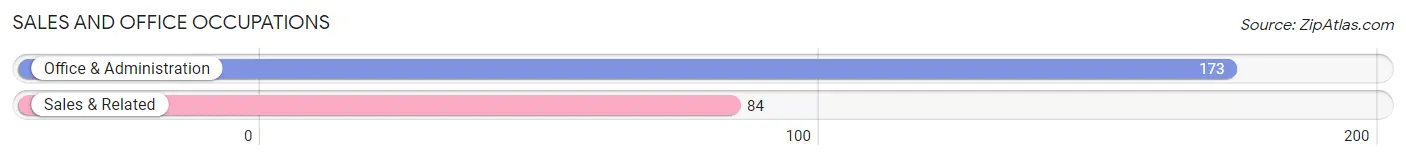
Sales and Office Occupations
The most common Sales and Office occupations in Decatur County are Office & Administration (173 | 13.2%), and Sales & Related (84 | 6.4%).
Sales and Office Occupations by Sex
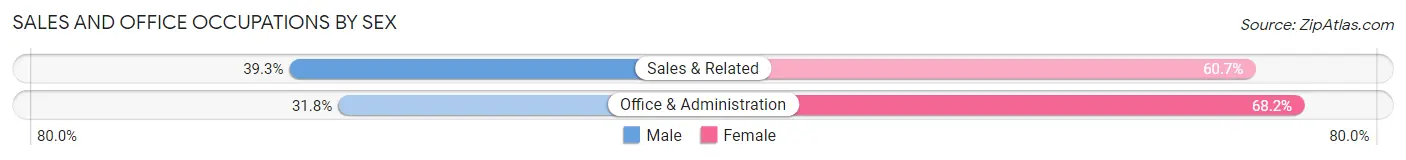
| Occupation | Male | Female |
| Sales & Related | 33 (39.3%) | 51 (60.7%) |
| Office & Administration | 55 (31.8%) | 118 (68.2%) |
| Total (Category) | 88 (34.2%) | 169 (65.8%) |
| Total (Overall) | 715 (54.7%) | 593 (45.3%) |
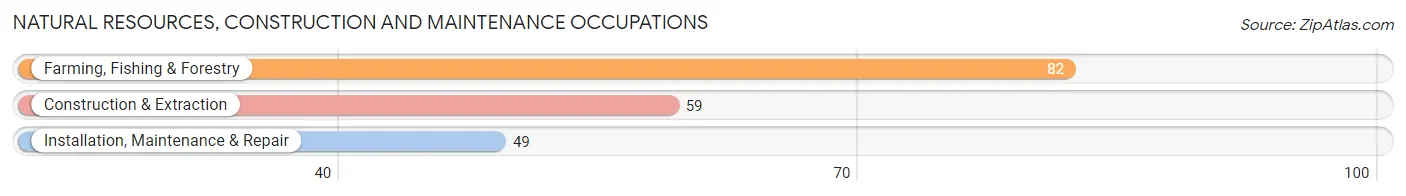
Natural Resources, Construction and Maintenance Occupations
The most common Natural Resources, Construction and Maintenance occupations in Decatur County are Farming, Fishing & Forestry (82 | 6.3%), Construction & Extraction (59 | 4.5%), and Installation, Maintenance & Repair (49 | 3.7%).
Natural Resources, Construction and Maintenance Occupations by Sex
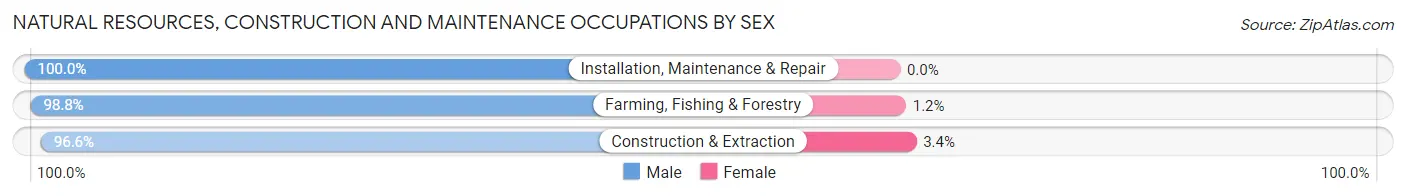
| Occupation | Male | Female |
| Farming, Fishing & Forestry | 81 (98.8%) | 1 (1.2%) |
| Construction & Extraction | 57 (96.6%) | 2 (3.4%) |
| Installation, Maintenance & Repair | 49 (100.0%) | 0 (0.0%) |
| Total (Category) | 187 (98.4%) | 3 (1.6%) |
| Total (Overall) | 715 (54.7%) | 593 (45.3%) |
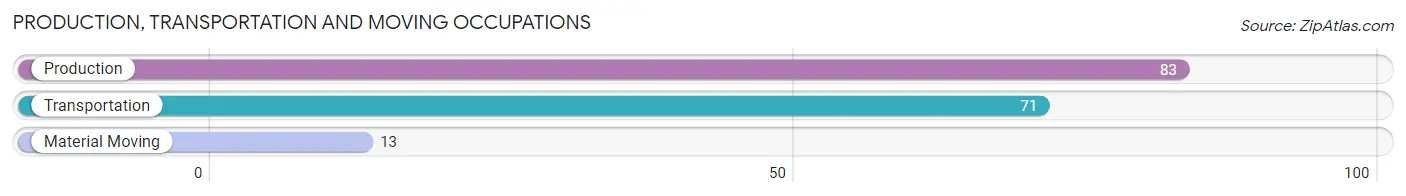
Production, Transportation and Moving Occupations
The most common Production, Transportation and Moving occupations in Decatur County are Production (83 | 6.4%), Transportation (71 | 5.4%), and Material Moving (13 | 1.0%).
Production, Transportation and Moving Occupations by Sex
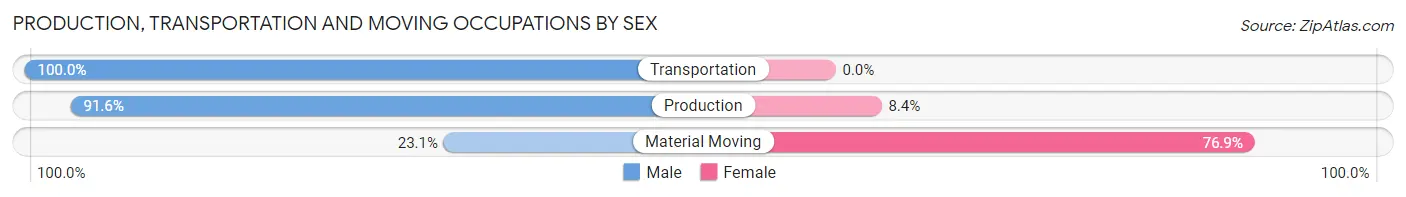
| Occupation | Male | Female |
| Production | 76 (91.6%) | 7 (8.4%) |
| Transportation | 71 (100.0%) | 0 (0.0%) |
| Material Moving | 3 (23.1%) | 10 (76.9%) |
| Total (Category) | 150 (89.8%) | 17 (10.2%) |
| Total (Overall) | 715 (54.7%) | 593 (45.3%) |
Employment Industries by Sex in Decatur County
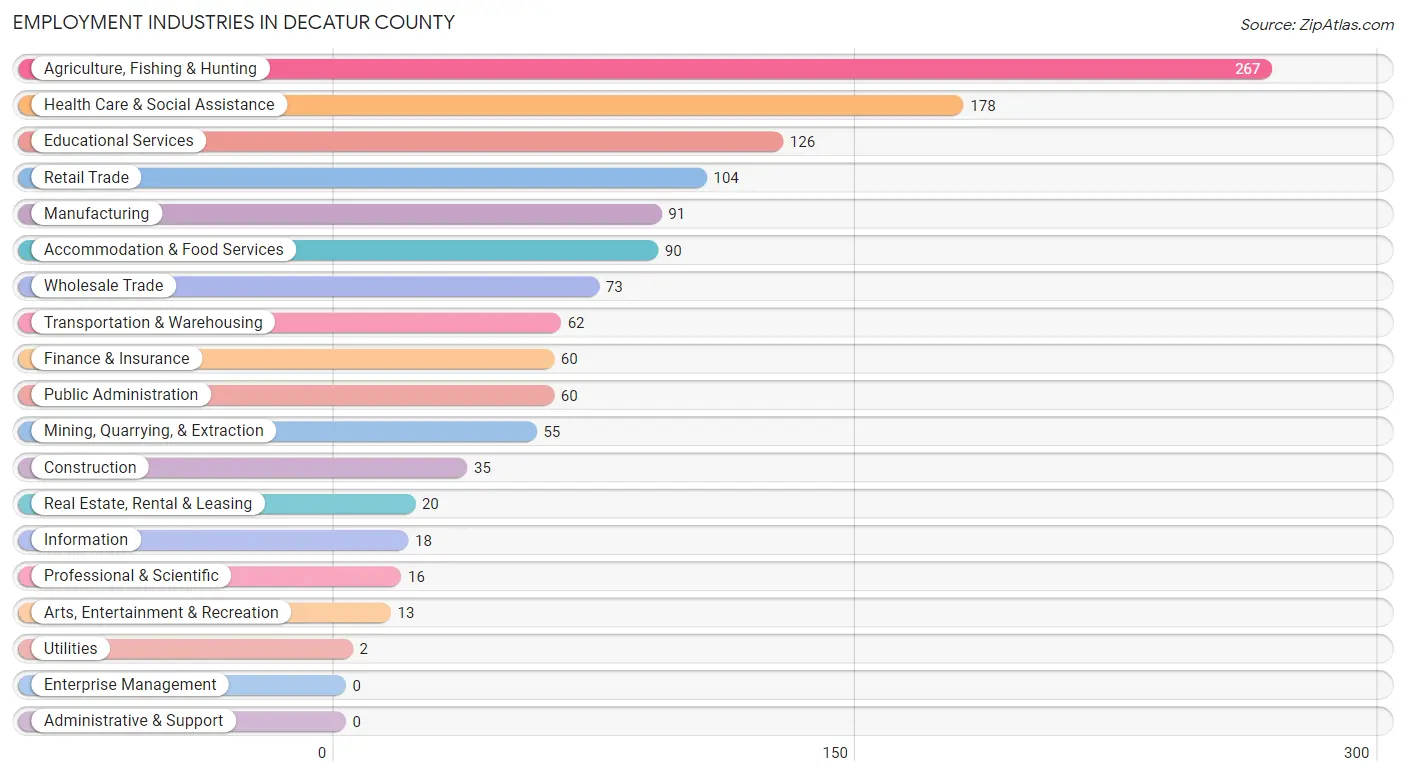
Employment Industries in Decatur County
The major employment industries in Decatur County include Agriculture, Fishing & Hunting (267 | 20.4%), Health Care & Social Assistance (178 | 13.6%), Educational Services (126 | 9.6%), Retail Trade (104 | 8.0%), and Manufacturing (91 | 7.0%).
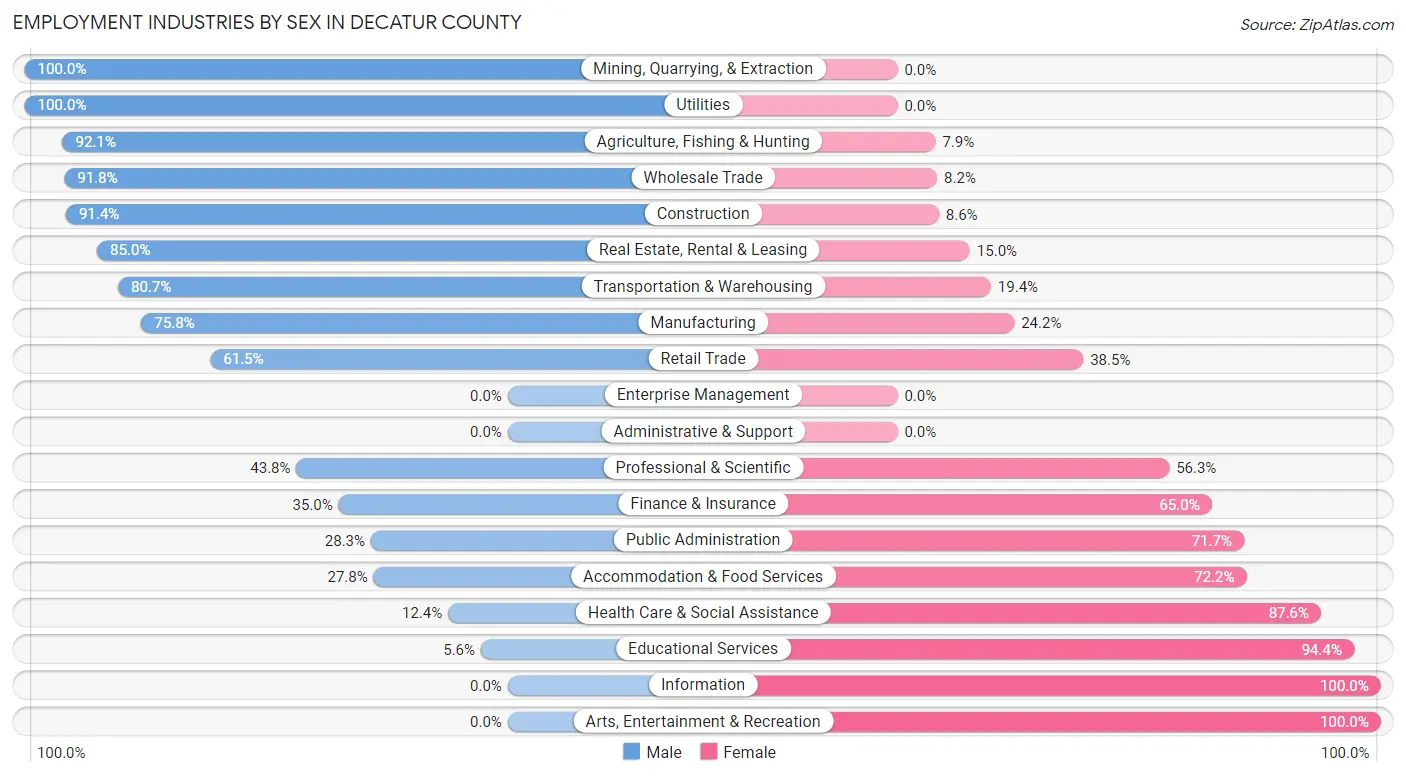
Employment Industries by Sex in Decatur County
The Decatur County industries that see more men than women are Mining, Quarrying, & Extraction (100.0%), Utilities (100.0%), and Agriculture, Fishing & Hunting (92.1%), whereas the industries that tend to have a higher number of women are Information (100.0%), Arts, Entertainment & Recreation (100.0%), and Educational Services (94.4%).
| Industry | Male | Female |
| Agriculture, Fishing & Hunting | 246 (92.1%) | 21 (7.9%) |
| Mining, Quarrying, & Extraction | 55 (100.0%) | 0 (0.0%) |
| Construction | 32 (91.4%) | 3 (8.6%) |
| Manufacturing | 69 (75.8%) | 22 (24.2%) |
| Wholesale Trade | 67 (91.8%) | 6 (8.2%) |
| Retail Trade | 64 (61.5%) | 40 (38.5%) |
| Transportation & Warehousing | 50 (80.6%) | 12 (19.4%) |
| Utilities | 2 (100.0%) | 0 (0.0%) |
| Information | 0 (0.0%) | 18 (100.0%) |
| Finance & Insurance | 21 (35.0%) | 39 (65.0%) |
| Real Estate, Rental & Leasing | 17 (85.0%) | 3 (15.0%) |
| Professional & Scientific | 7 (43.8%) | 9 (56.2%) |
| Enterprise Management | 0 (0.0%) | 0 (0.0%) |
| Administrative & Support | 0 (0.0%) | 0 (0.0%) |
| Educational Services | 7 (5.6%) | 119 (94.4%) |
| Health Care & Social Assistance | 22 (12.4%) | 156 (87.6%) |
| Arts, Entertainment & Recreation | 0 (0.0%) | 13 (100.0%) |
| Accommodation & Food Services | 25 (27.8%) | 65 (72.2%) |
| Public Administration | 17 (28.3%) | 43 (71.7%) |
| Total | 715 (54.7%) | 593 (45.3%) |
Education in Decatur County
School Enrollment in Decatur County
The most common levels of schooling among the 541 students in Decatur County are elementary school (172 | 31.8%), high school (135 | 24.9%), and middle school (89 | 16.5%).
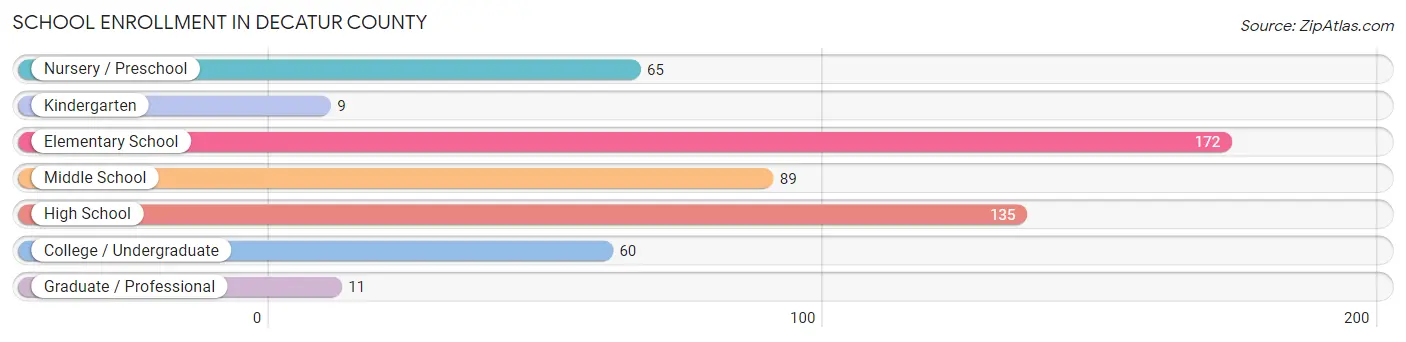
| School Level | # Students | % Students |
| Nursery / Preschool | 65 | 12.0% |
| Kindergarten | 9 | 1.7% |
| Elementary School | 172 | 31.8% |
| Middle School | 89 | 16.5% |
| High School | 135 | 24.9% |
| College / Undergraduate | 60 | 11.1% |
| Graduate / Professional | 11 | 2.0% |
| Total | 541 | 100.0% |
School Enrollment by Age by Funding Source in Decatur County
Out of a total of 541 students who are enrolled in schools in Decatur County, 19 (3.5%) attend a private institution, while the remaining 522 (96.5%) are enrolled in public schools. The age group of 20 to 24 year olds has the highest likelihood of being enrolled in private schools, with 7 (19.4% in the age bracket) enrolled. Conversely, the age group of 10 to 14 year olds has the lowest likelihood of being enrolled in a private school, with 144 (100.0% in the age bracket) attending a public institution.
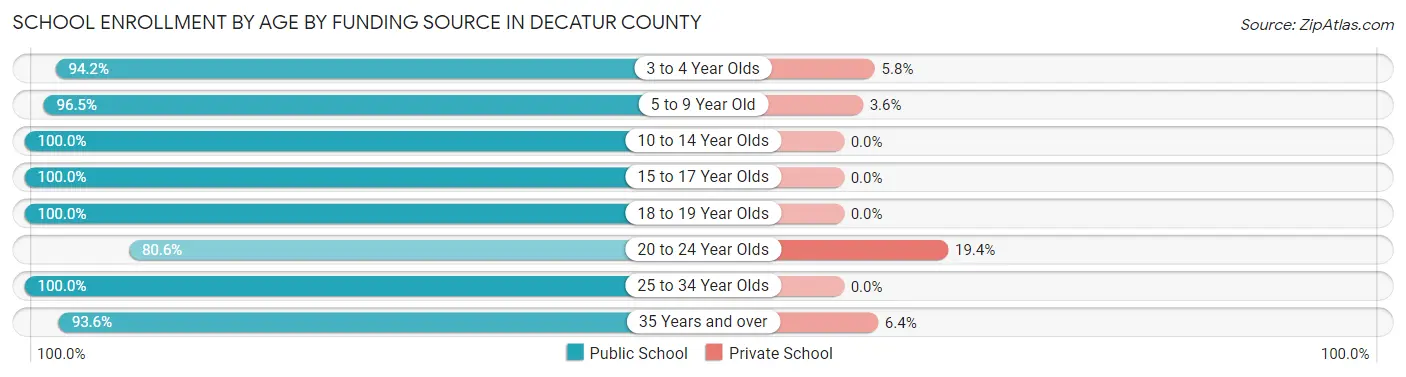
| Age Bracket | Public School | Private School |
| 3 to 4 Year Olds | 49 (94.2%) | 3 (5.8%) |
| 5 to 9 Year Old | 163 (96.5%) | 6 (3.5%) |
| 10 to 14 Year Olds | 144 (100.0%) | 0 (0.0%) |
| 15 to 17 Year Olds | 91 (100.0%) | 0 (0.0%) |
| 18 to 19 Year Olds | 1 (100.0%) | 0 (0.0%) |
| 20 to 24 Year Olds | 29 (80.6%) | 7 (19.4%) |
| 25 to 34 Year Olds | 1 (100.0%) | 0 (0.0%) |
| 35 Years and over | 44 (93.6%) | 3 (6.4%) |
| Total | 522 (96.5%) | 19 (3.5%) |
Educational Attainment by Field of Study in Decatur County
Education (113 | 20.0%), business (82 | 14.5%), bio, nature & agricultural (79 | 14.0%), physical & health sciences (64 | 11.4%), and science & technology (56 | 9.9%) are the most common fields of study among 564 individuals in Decatur County who have obtained a bachelor's degree or higher.
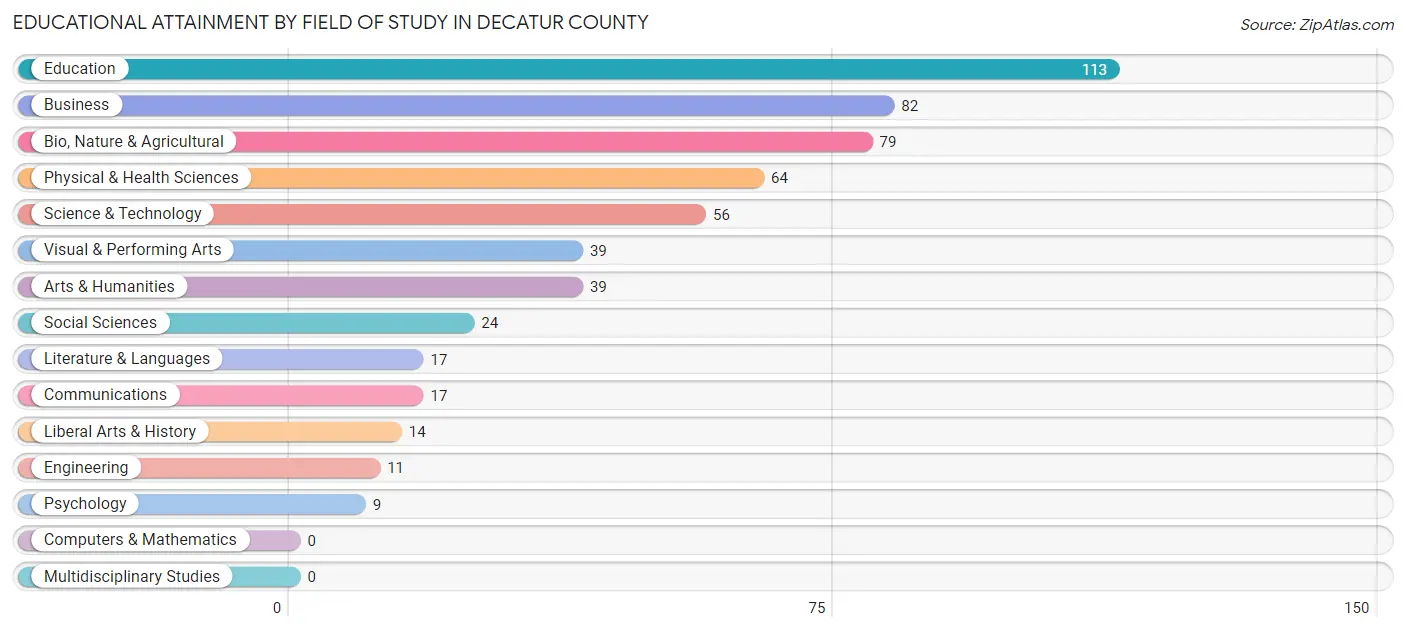
| Field of Study | # Graduates | % Graduates |
| Computers & Mathematics | 0 | 0.0% |
| Bio, Nature & Agricultural | 79 | 14.0% |
| Physical & Health Sciences | 64 | 11.4% |
| Psychology | 9 | 1.6% |
| Social Sciences | 24 | 4.3% |
| Engineering | 11 | 1.9% |
| Multidisciplinary Studies | 0 | 0.0% |
| Science & Technology | 56 | 9.9% |
| Business | 82 | 14.5% |
| Education | 113 | 20.0% |
| Literature & Languages | 17 | 3.0% |
| Liberal Arts & History | 14 | 2.5% |
| Visual & Performing Arts | 39 | 6.9% |
| Communications | 17 | 3.0% |
| Arts & Humanities | 39 | 6.9% |
| Total | 564 | 100.0% |
Transportation & Commute in Decatur County
Vehicle Availability by Sex in Decatur County
The most prevalent vehicle ownership categories in Decatur County are males with 2 vehicles (266, accounting for 37.2%) and females with 2 vehicles (227, making up 45.2%).
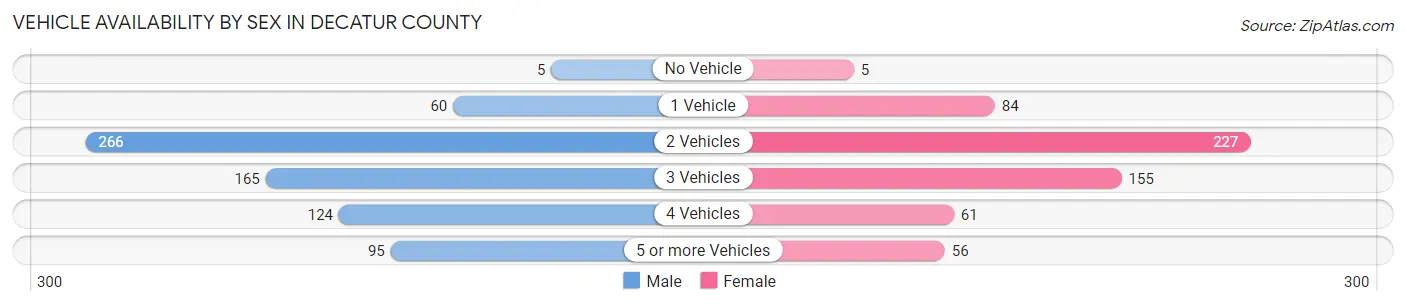
| Vehicles Available | Male | Female |
| No Vehicle | 5 (0.7%) | 5 (0.9%) |
| 1 Vehicle | 60 (8.4%) | 84 (14.3%) |
| 2 Vehicles | 266 (37.2%) | 227 (38.6%) |
| 3 Vehicles | 165 (23.1%) | 155 (26.4%) |
| 4 Vehicles | 124 (17.3%) | 61 (10.4%) |
| 5 or more Vehicles | 95 (13.3%) | 56 (9.5%) |
| Total | 715 (100.0%) | 588 (100.0%) |
Commute Time in Decatur County
The most frequently occuring commute durations in Decatur County are 5 to 9 minutes (303 commuters, 28.6%), less than 5 minutes (261 commuters, 24.6%), and 30 to 34 minutes (137 commuters, 12.9%).
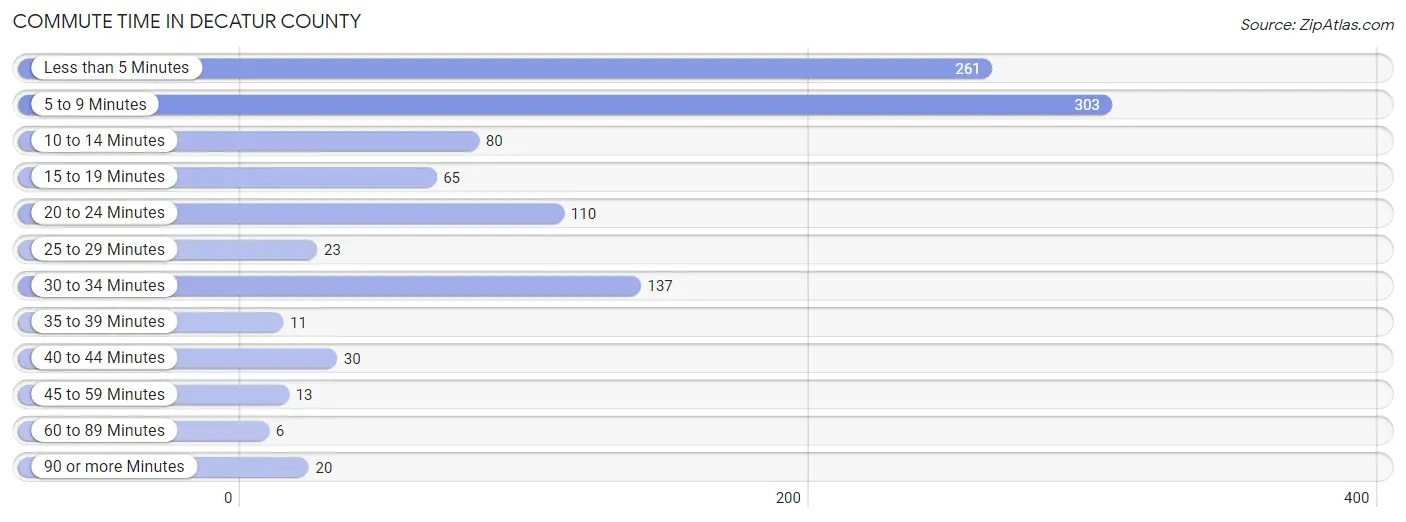
| Commute Time | # Commuters | % Commuters |
| Less than 5 Minutes | 261 | 24.6% |
| 5 to 9 Minutes | 303 | 28.6% |
| 10 to 14 Minutes | 80 | 7.5% |
| 15 to 19 Minutes | 65 | 6.1% |
| 20 to 24 Minutes | 110 | 10.4% |
| 25 to 29 Minutes | 23 | 2.2% |
| 30 to 34 Minutes | 137 | 12.9% |
| 35 to 39 Minutes | 11 | 1.0% |
| 40 to 44 Minutes | 30 | 2.8% |
| 45 to 59 Minutes | 13 | 1.2% |
| 60 to 89 Minutes | 6 | 0.6% |
| 90 or more Minutes | 20 | 1.9% |
Commute Time by Sex in Decatur County
The most common commute times in Decatur County are 5 to 9 minutes (144 commuters, 28.0%) for males and 5 to 9 minutes (159 commuters, 29.2%) for females.
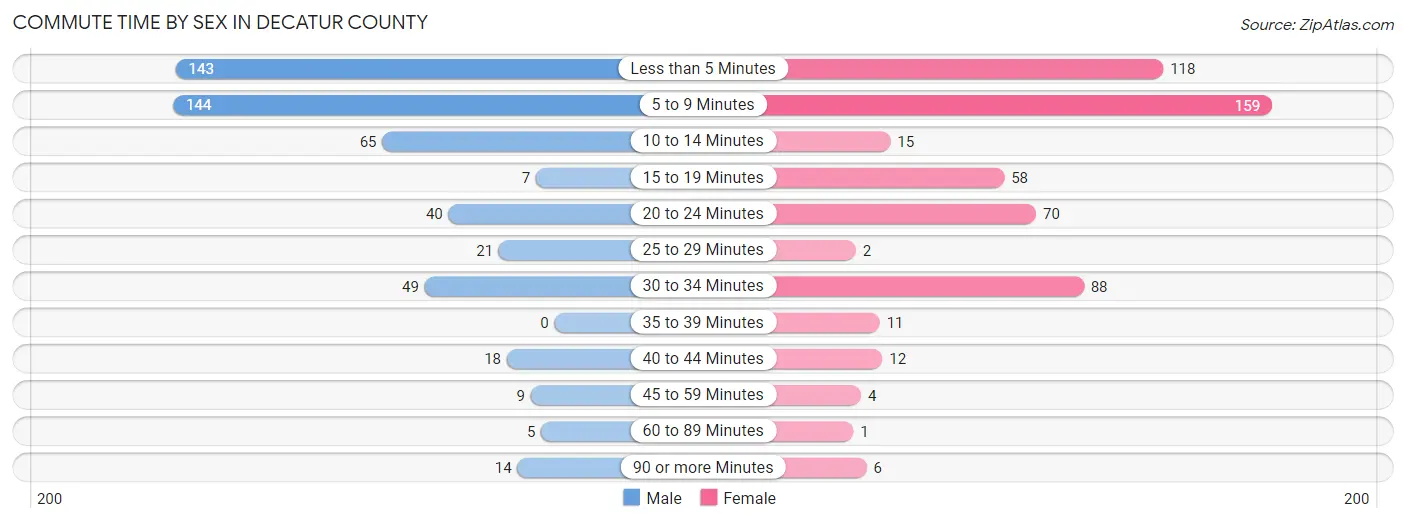
| Commute Time | Male | Female |
| Less than 5 Minutes | 143 (27.8%) | 118 (21.7%) |
| 5 to 9 Minutes | 144 (28.0%) | 159 (29.2%) |
| 10 to 14 Minutes | 65 (12.6%) | 15 (2.8%) |
| 15 to 19 Minutes | 7 (1.4%) | 58 (10.7%) |
| 20 to 24 Minutes | 40 (7.8%) | 70 (12.9%) |
| 25 to 29 Minutes | 21 (4.1%) | 2 (0.4%) |
| 30 to 34 Minutes | 49 (9.5%) | 88 (16.2%) |
| 35 to 39 Minutes | 0 (0.0%) | 11 (2.0%) |
| 40 to 44 Minutes | 18 (3.5%) | 12 (2.2%) |
| 45 to 59 Minutes | 9 (1.8%) | 4 (0.7%) |
| 60 to 89 Minutes | 5 (1.0%) | 1 (0.2%) |
| 90 or more Minutes | 14 (2.7%) | 6 (1.1%) |
Time of Departure to Work by Sex in Decatur County
The most frequent times of departure to work in Decatur County are 7:30 AM to 7:59 AM (158, 30.7%) for males and 7:00 AM to 7:29 AM (99, 18.2%) for females.
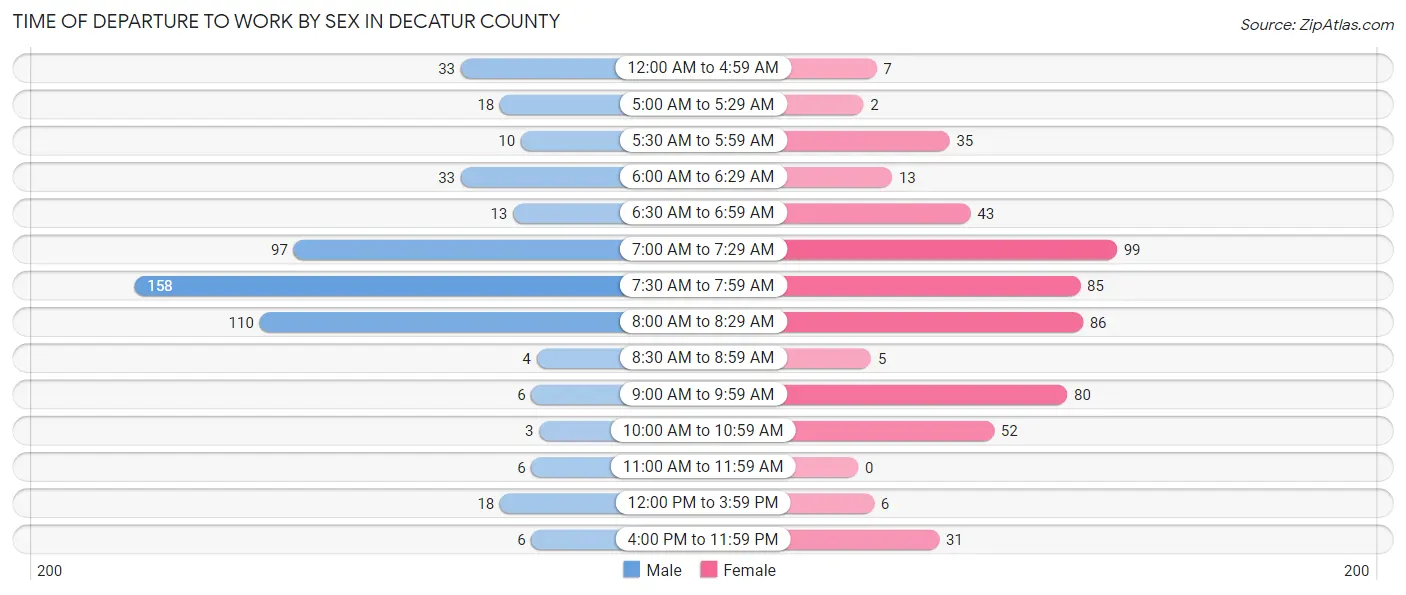
| Time of Departure | Male | Female |
| 12:00 AM to 4:59 AM | 33 (6.4%) | 7 (1.3%) |
| 5:00 AM to 5:29 AM | 18 (3.5%) | 2 (0.4%) |
| 5:30 AM to 5:59 AM | 10 (1.9%) | 35 (6.4%) |
| 6:00 AM to 6:29 AM | 33 (6.4%) | 13 (2.4%) |
| 6:30 AM to 6:59 AM | 13 (2.5%) | 43 (7.9%) |
| 7:00 AM to 7:29 AM | 97 (18.8%) | 99 (18.2%) |
| 7:30 AM to 7:59 AM | 158 (30.7%) | 85 (15.6%) |
| 8:00 AM to 8:29 AM | 110 (21.4%) | 86 (15.8%) |
| 8:30 AM to 8:59 AM | 4 (0.8%) | 5 (0.9%) |
| 9:00 AM to 9:59 AM | 6 (1.2%) | 80 (14.7%) |
| 10:00 AM to 10:59 AM | 3 (0.6%) | 52 (9.6%) |
| 11:00 AM to 11:59 AM | 6 (1.2%) | 0 (0.0%) |
| 12:00 PM to 3:59 PM | 18 (3.5%) | 6 (1.1%) |
| 4:00 PM to 11:59 PM | 6 (1.2%) | 31 (5.7%) |
| Total | 515 (100.0%) | 544 (100.0%) |
Housing Occupancy in Decatur County
Occupancy by Ownership in Decatur County
Of the total 1,324 dwellings in Decatur County, owner-occupied units account for 1,066 (80.5%), while renter-occupied units make up 258 (19.5%).
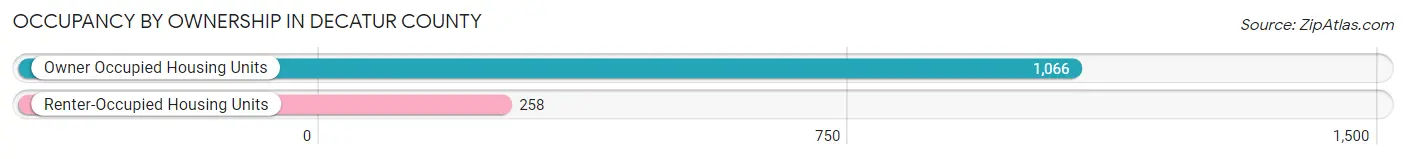
| Occupancy | # Housing Units | % Housing Units |
| Owner Occupied Housing Units | 1,066 | 80.5% |
| Renter-Occupied Housing Units | 258 | 19.5% |
| Total Occupied Housing Units | 1,324 | 100.0% |
Occupancy by Household Size in Decatur County
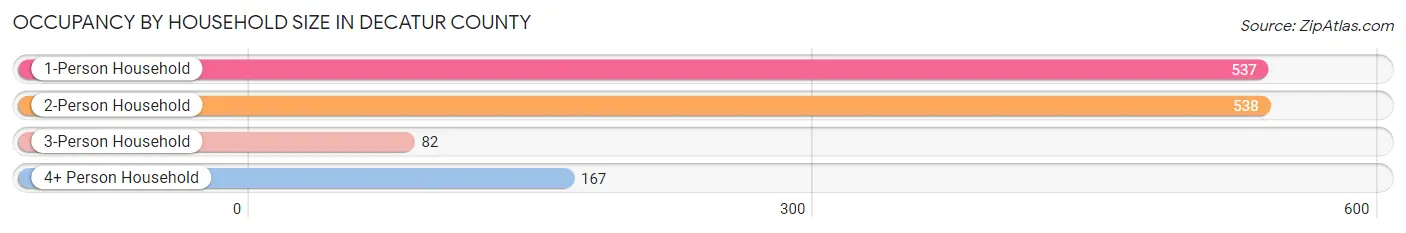
| Household Size | # Housing Units | % Housing Units |
| 1-Person Household | 537 | 40.6% |
| 2-Person Household | 538 | 40.6% |
| 3-Person Household | 82 | 6.2% |
| 4+ Person Household | 167 | 12.6% |
| Total Housing Units | 1,324 | 100.0% |
Occupancy by Ownership by Household Size in Decatur County
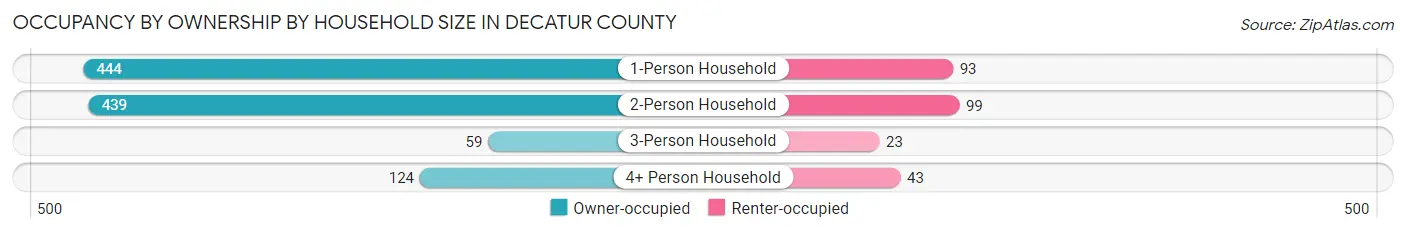
| Household Size | Owner-occupied | Renter-occupied |
| 1-Person Household | 444 (82.7%) | 93 (17.3%) |
| 2-Person Household | 439 (81.6%) | 99 (18.4%) |
| 3-Person Household | 59 (72.0%) | 23 (28.1%) |
| 4+ Person Household | 124 (74.3%) | 43 (25.8%) |
| Total Housing Units | 1,066 (80.5%) | 258 (19.5%) |
Occupancy by Educational Attainment in Decatur County
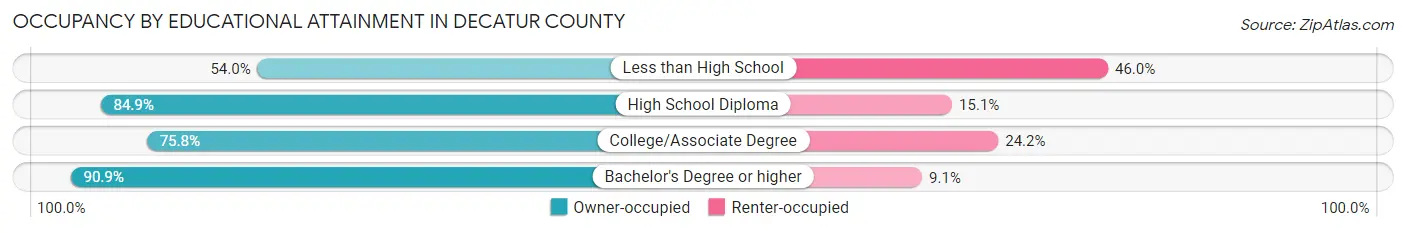
| Household Size | Owner-occupied | Renter-occupied |
| Less than High School | 47 (54.0%) | 40 (46.0%) |
| High School Diploma | 327 (84.9%) | 58 (15.1%) |
| College/Associate Degree | 413 (75.8%) | 132 (24.2%) |
| Bachelor's Degree or higher | 279 (90.9%) | 28 (9.1%) |
Occupancy by Age of Householder in Decatur County
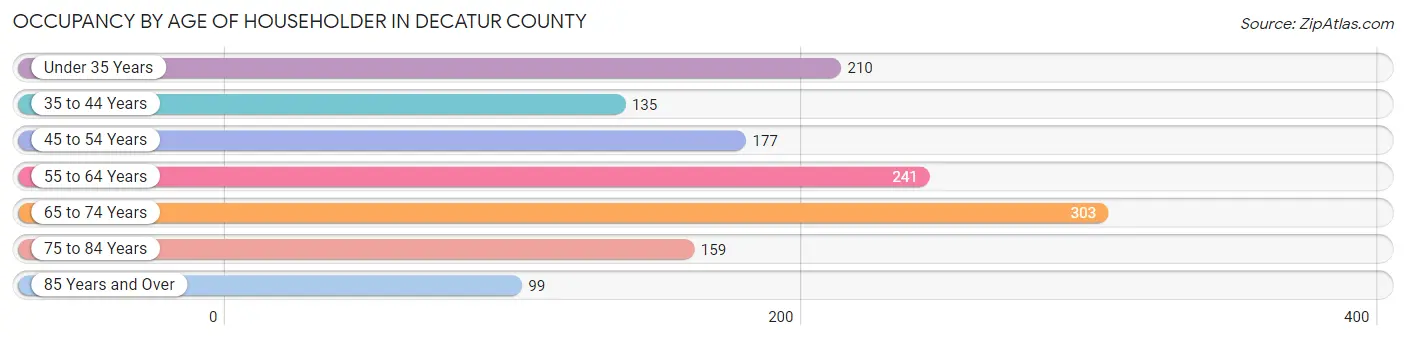
| Age Bracket | # Households | % Households |
| Under 35 Years | 210 | 15.9% |
| 35 to 44 Years | 135 | 10.2% |
| 45 to 54 Years | 177 | 13.4% |
| 55 to 64 Years | 241 | 18.2% |
| 65 to 74 Years | 303 | 22.9% |
| 75 to 84 Years | 159 | 12.0% |
| 85 Years and Over | 99 | 7.5% |
| Total | 1,324 | 100.0% |
Housing Finances in Decatur County
Median Income by Occupancy in Decatur County
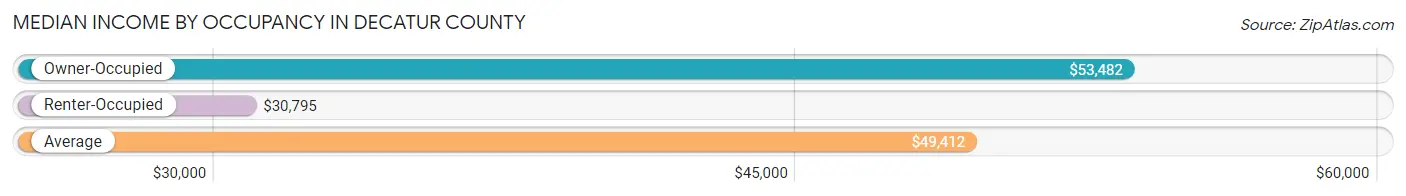
| Occupancy Type | # Households | Median Income |
| Owner-Occupied | 1,066 (80.5%) | $53,482 |
| Renter-Occupied | 258 (19.5%) | $30,795 |
| Average | 1,324 (100.0%) | $49,412 |
Occupancy by Householder Income Bracket in Decatur County
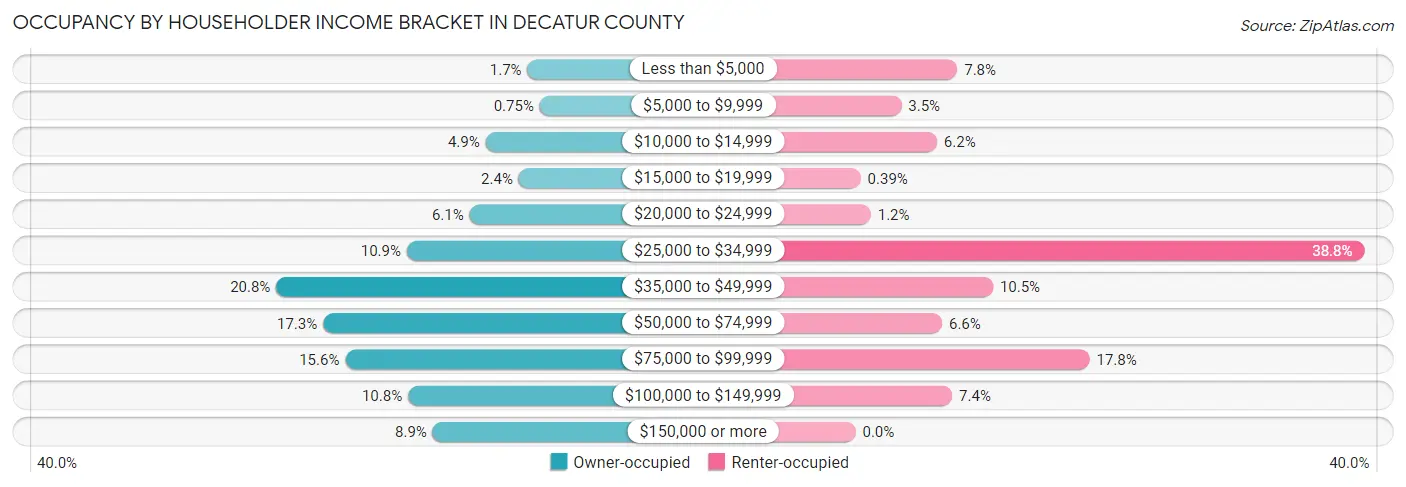
| Income Bracket | Owner-occupied | Renter-occupied |
| Less than $5,000 | 18 (1.7%) | 20 (7.7%) |
| $5,000 to $9,999 | 8 (0.7%) | 9 (3.5%) |
| $10,000 to $14,999 | 52 (4.9%) | 16 (6.2%) |
| $15,000 to $19,999 | 25 (2.4%) | 1 (0.4%) |
| $20,000 to $24,999 | 65 (6.1%) | 3 (1.2%) |
| $25,000 to $34,999 | 116 (10.9%) | 100 (38.8%) |
| $35,000 to $49,999 | 222 (20.8%) | 27 (10.5%) |
| $50,000 to $74,999 | 184 (17.3%) | 17 (6.6%) |
| $75,000 to $99,999 | 166 (15.6%) | 46 (17.8%) |
| $100,000 to $149,999 | 115 (10.8%) | 19 (7.4%) |
| $150,000 or more | 95 (8.9%) | 0 (0.0%) |
| Total | 1,066 (100.0%) | 258 (100.0%) |
Monthly Housing Cost Tiers in Decatur County
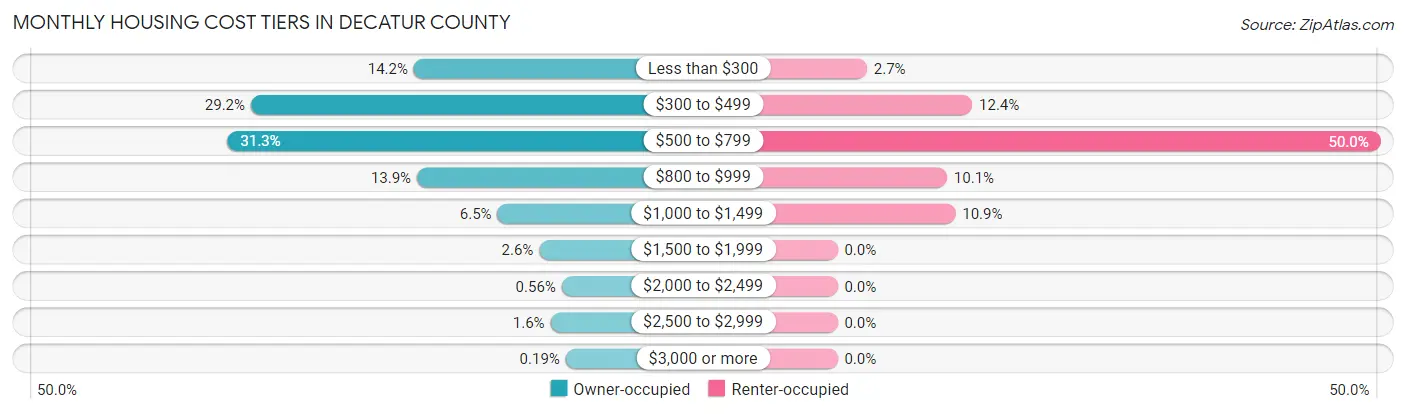
| Monthly Cost | Owner-occupied | Renter-occupied |
| Less than $300 | 151 (14.2%) | 7 (2.7%) |
| $300 to $499 | 311 (29.2%) | 32 (12.4%) |
| $500 to $799 | 334 (31.3%) | 129 (50.0%) |
| $800 to $999 | 148 (13.9%) | 26 (10.1%) |
| $1,000 to $1,499 | 69 (6.5%) | 28 (10.8%) |
| $1,500 to $1,999 | 28 (2.6%) | 0 (0.0%) |
| $2,000 to $2,499 | 6 (0.6%) | 0 (0.0%) |
| $2,500 to $2,999 | 17 (1.6%) | 0 (0.0%) |
| $3,000 or more | 2 (0.2%) | 0 (0.0%) |
| Total | 1,066 (100.0%) | 258 (100.0%) |
Physical Housing Characteristics in Decatur County
Housing Structures in Decatur County
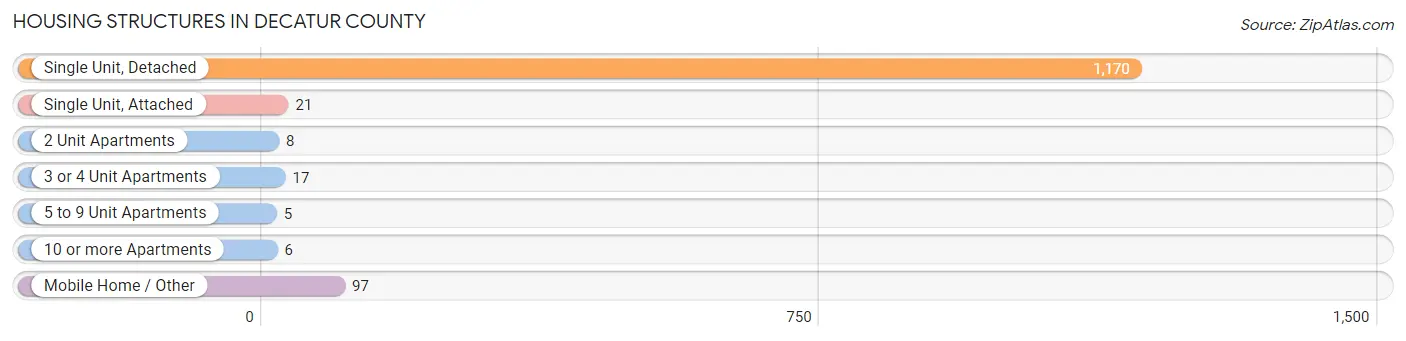
| Structure Type | # Housing Units | % Housing Units |
| Single Unit, Detached | 1,170 | 88.4% |
| Single Unit, Attached | 21 | 1.6% |
| 2 Unit Apartments | 8 | 0.6% |
| 3 or 4 Unit Apartments | 17 | 1.3% |
| 5 to 9 Unit Apartments | 5 | 0.4% |
| 10 or more Apartments | 6 | 0.4% |
| Mobile Home / Other | 97 | 7.3% |
| Total | 1,324 | 100.0% |
Housing Structures by Occupancy in Decatur County
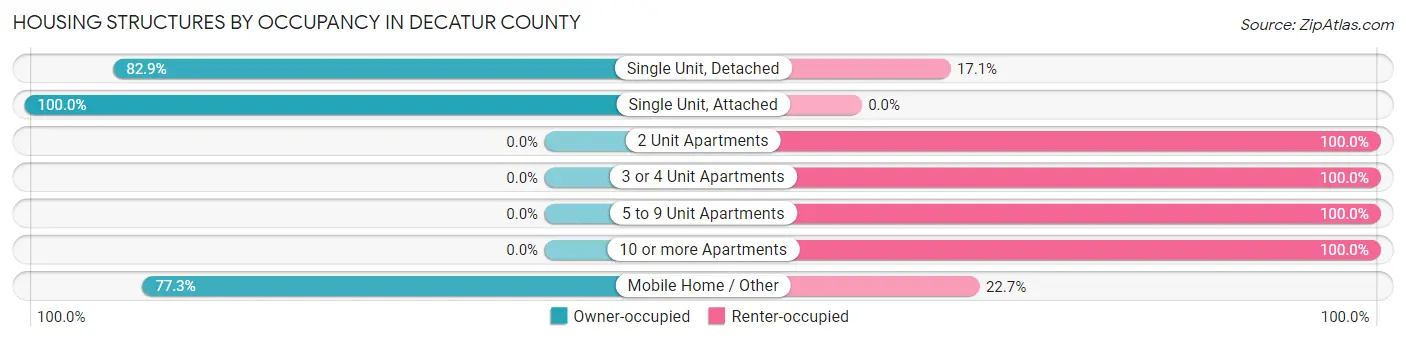
| Structure Type | Owner-occupied | Renter-occupied |
| Single Unit, Detached | 970 (82.9%) | 200 (17.1%) |
| Single Unit, Attached | 21 (100.0%) | 0 (0.0%) |
| 2 Unit Apartments | 0 (0.0%) | 8 (100.0%) |
| 3 or 4 Unit Apartments | 0 (0.0%) | 17 (100.0%) |
| 5 to 9 Unit Apartments | 0 (0.0%) | 5 (100.0%) |
| 10 or more Apartments | 0 (0.0%) | 6 (100.0%) |
| Mobile Home / Other | 75 (77.3%) | 22 (22.7%) |
| Total | 1,066 (80.5%) | 258 (19.5%) |
Housing Structures by Number of Rooms in Decatur County
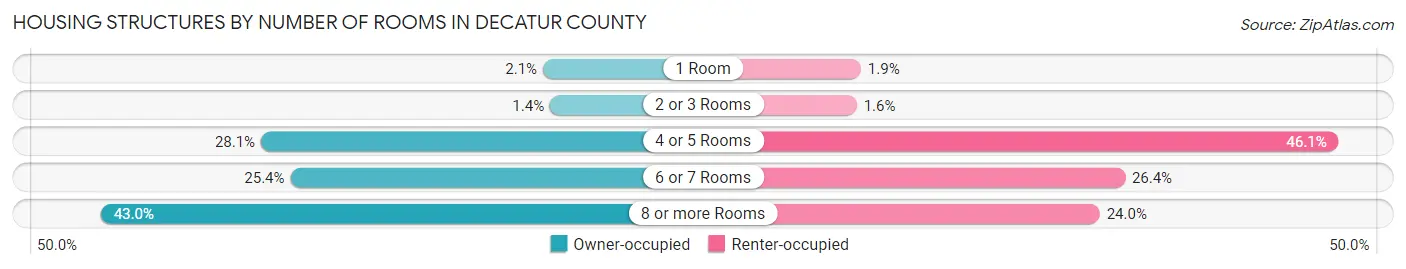
| Number of Rooms | Owner-occupied | Renter-occupied |
| 1 Room | 22 (2.1%) | 5 (1.9%) |
| 2 or 3 Rooms | 15 (1.4%) | 4 (1.5%) |
| 4 or 5 Rooms | 300 (28.1%) | 119 (46.1%) |
| 6 or 7 Rooms | 271 (25.4%) | 68 (26.4%) |
| 8 or more Rooms | 458 (43.0%) | 62 (24.0%) |
| Total | 1,066 (100.0%) | 258 (100.0%) |
Housing Structure by Heating Type in Decatur County
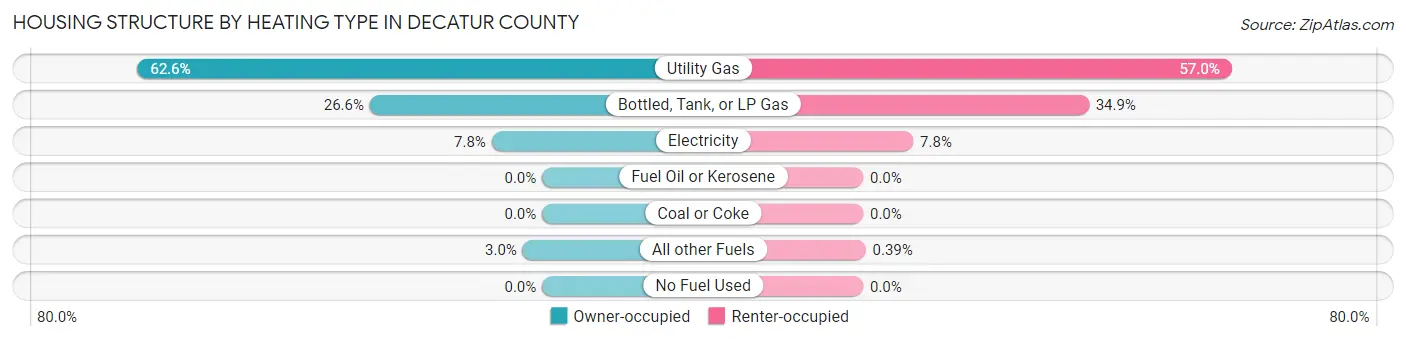
| Heating Type | Owner-occupied | Renter-occupied |
| Utility Gas | 667 (62.6%) | 147 (57.0%) |
| Bottled, Tank, or LP Gas | 284 (26.6%) | 90 (34.9%) |
| Electricity | 83 (7.8%) | 20 (7.7%) |
| Fuel Oil or Kerosene | 0 (0.0%) | 0 (0.0%) |
| Coal or Coke | 0 (0.0%) | 0 (0.0%) |
| All other Fuels | 32 (3.0%) | 1 (0.4%) |
| No Fuel Used | 0 (0.0%) | 0 (0.0%) |
| Total | 1,066 (100.0%) | 258 (100.0%) |
Household Vehicle Usage in Decatur County
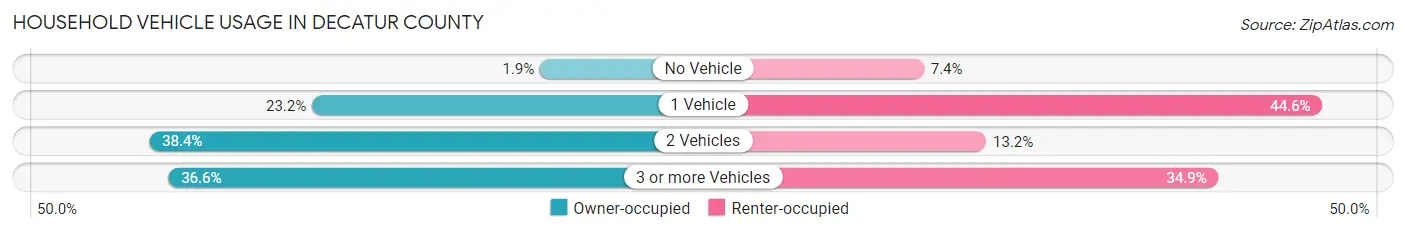
| Vehicles per Household | Owner-occupied | Renter-occupied |
| No Vehicle | 20 (1.9%) | 19 (7.4%) |
| 1 Vehicle | 247 (23.2%) | 115 (44.6%) |
| 2 Vehicles | 409 (38.4%) | 34 (13.2%) |
| 3 or more Vehicles | 390 (36.6%) | 90 (34.9%) |
| Total | 1,066 (100.0%) | 258 (100.0%) |
Real Estate & Mortgages in Decatur County
Real Estate and Mortgage Overview in Decatur County
| Characteristic | Without Mortgage | With Mortgage |
| Housing Units | 735 | 331 |
| Median Property Value | $76,100 | $75,800 |
| Median Household Income | $49,247 | $51 |
| Monthly Housing Costs | $460 | $2 |
| Real Estate Taxes | $1,240 | $5 |
Property Value by Mortgage Status in Decatur County
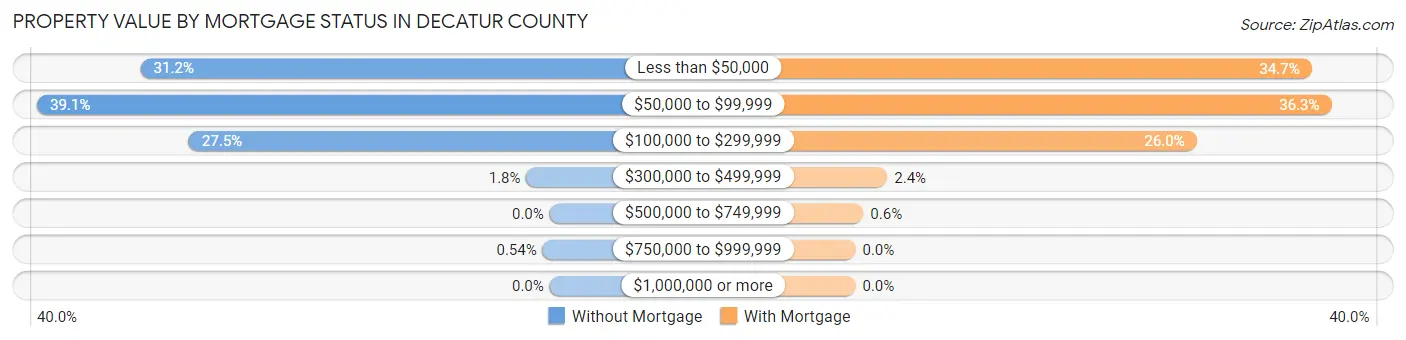
| Property Value | Without Mortgage | With Mortgage |
| Less than $50,000 | 229 (31.2%) | 115 (34.7%) |
| $50,000 to $99,999 | 287 (39.1%) | 120 (36.2%) |
| $100,000 to $299,999 | 202 (27.5%) | 86 (26.0%) |
| $300,000 to $499,999 | 13 (1.8%) | 8 (2.4%) |
| $500,000 to $749,999 | 0 (0.0%) | 2 (0.6%) |
| $750,000 to $999,999 | 4 (0.5%) | 0 (0.0%) |
| $1,000,000 or more | 0 (0.0%) | 0 (0.0%) |
| Total | 735 (100.0%) | 331 (100.0%) |
Household Income by Mortgage Status in Decatur County
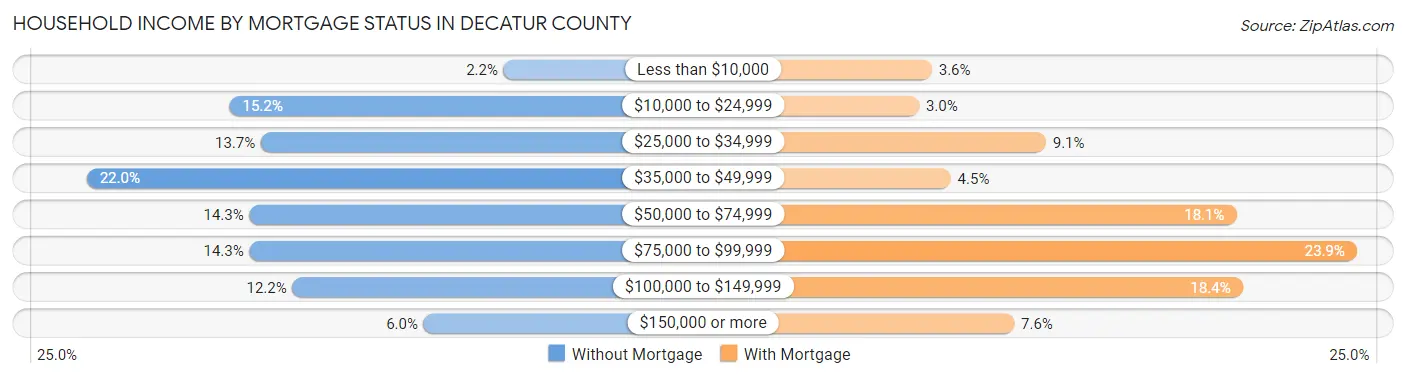
| Household Income | Without Mortgage | With Mortgage |
| Less than $10,000 | 16 (2.2%) | 12 (3.6%) |
| $10,000 to $24,999 | 112 (15.2%) | 10 (3.0%) |
| $25,000 to $34,999 | 101 (13.7%) | 30 (9.1%) |
| $35,000 to $49,999 | 162 (22.0%) | 15 (4.5%) |
| $50,000 to $74,999 | 105 (14.3%) | 60 (18.1%) |
| $75,000 to $99,999 | 105 (14.3%) | 79 (23.9%) |
| $100,000 to $149,999 | 90 (12.2%) | 61 (18.4%) |
| $150,000 or more | 44 (6.0%) | 25 (7.5%) |
| Total | 735 (100.0%) | 331 (100.0%) |
Property Value to Household Income Ratio in Decatur County
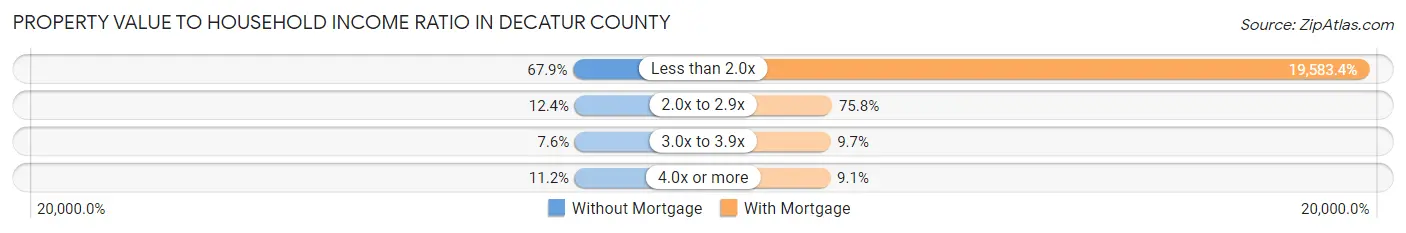
| Value-to-Income Ratio | Without Mortgage | With Mortgage |
| Less than 2.0x | 499 (67.9%) | 64,821 (19,583.4%) |
| 2.0x to 2.9x | 91 (12.4%) | 251 (75.8%) |
| 3.0x to 3.9x | 56 (7.6%) | 32 (9.7%) |
| 4.0x or more | 82 (11.2%) | 30 (9.1%) |
| Total | 735 (100.0%) | 331 (100.0%) |
Real Estate Taxes by Mortgage Status in Decatur County
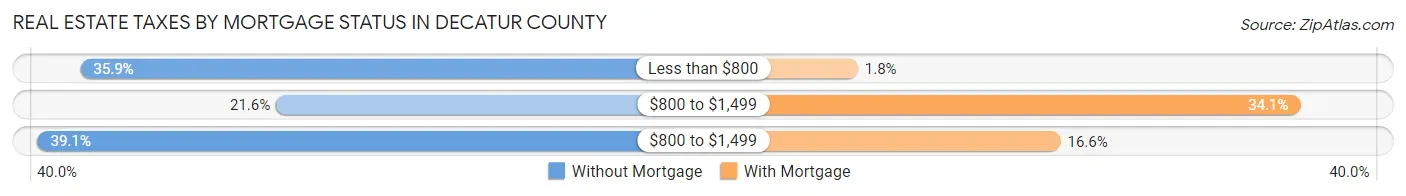
| Property Taxes | Without Mortgage | With Mortgage |
| Less than $800 | 264 (35.9%) | 6 (1.8%) |
| $800 to $1,499 | 159 (21.6%) | 113 (34.1%) |
| $800 to $1,499 | 287 (39.1%) | 55 (16.6%) |
| Total | 735 (100.0%) | 331 (100.0%) |
Health & Disability in Decatur County
Health Insurance Coverage by Age in Decatur County
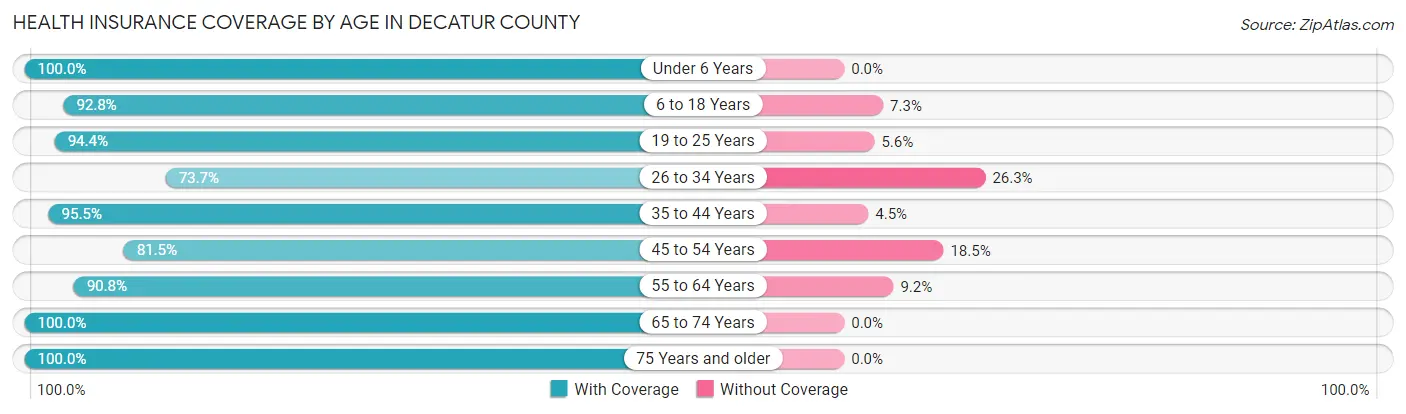
| Age Bracket | With Coverage | Without Coverage |
| Under 6 Years | 176 (100.0%) | 0 (0.0%) |
| 6 to 18 Years | 384 (92.7%) | 30 (7.2%) |
| 19 to 25 Years | 134 (94.4%) | 8 (5.6%) |
| 26 to 34 Years | 182 (73.7%) | 65 (26.3%) |
| 35 to 44 Years | 256 (95.5%) | 12 (4.5%) |
| 45 to 54 Years | 207 (81.5%) | 47 (18.5%) |
| 55 to 64 Years | 426 (90.8%) | 43 (9.2%) |
| 65 to 74 Years | 405 (100.0%) | 0 (0.0%) |
| 75 Years and older | 346 (100.0%) | 0 (0.0%) |
| Total | 2,516 (92.5%) | 205 (7.5%) |
Health Insurance Coverage by Citizenship Status in Decatur County
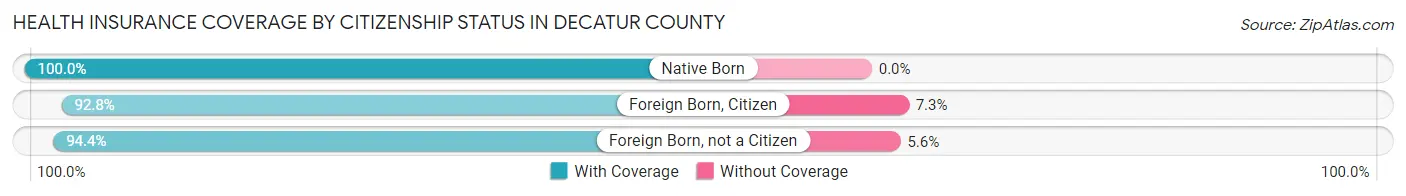
| Citizenship Status | With Coverage | Without Coverage |
| Native Born | 176 (100.0%) | 0 (0.0%) |
| Foreign Born, Citizen | 384 (92.7%) | 30 (7.2%) |
| Foreign Born, not a Citizen | 134 (94.4%) | 8 (5.6%) |
Health Insurance Coverage by Household Income in Decatur County
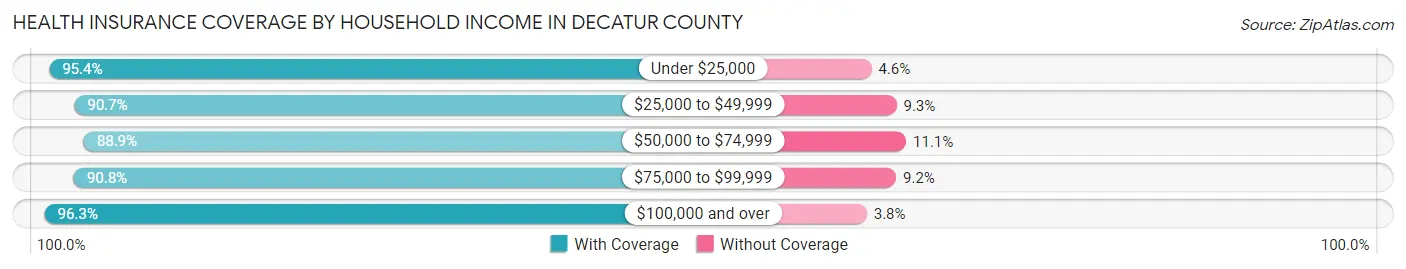
| Household Income | With Coverage | Without Coverage |
| Under $25,000 | 351 (95.4%) | 17 (4.6%) |
| $25,000 to $49,999 | 671 (90.7%) | 69 (9.3%) |
| $50,000 to $74,999 | 384 (88.9%) | 48 (11.1%) |
| $75,000 to $99,999 | 442 (90.8%) | 45 (9.2%) |
| $100,000 and over | 668 (96.3%) | 26 (3.7%) |
Public vs Private Health Insurance Coverage by Age in Decatur County
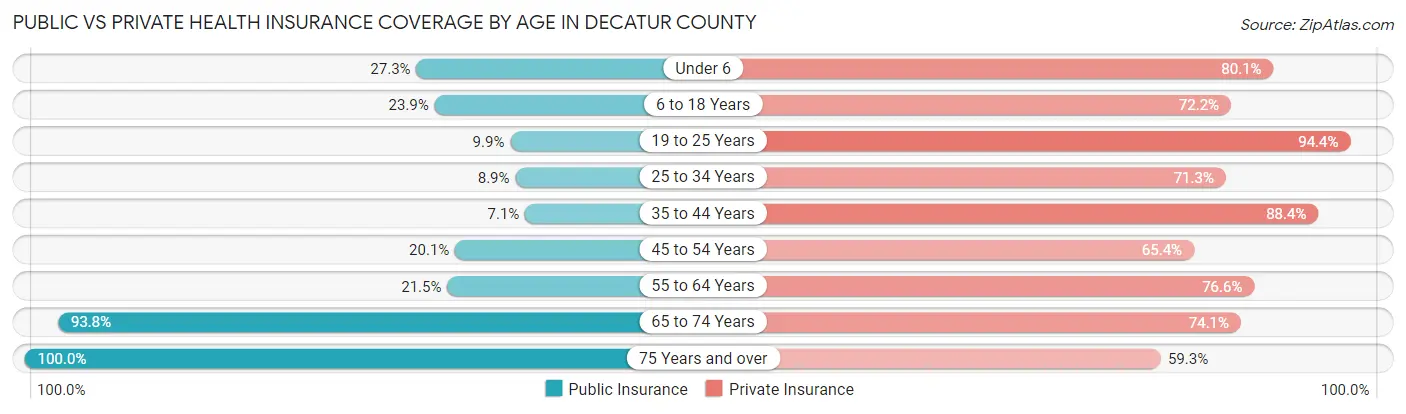
| Age Bracket | Public Insurance | Private Insurance |
| Under 6 | 48 (27.3%) | 141 (80.1%) |
| 6 to 18 Years | 99 (23.9%) | 299 (72.2%) |
| 19 to 25 Years | 14 (9.9%) | 134 (94.4%) |
| 25 to 34 Years | 22 (8.9%) | 176 (71.3%) |
| 35 to 44 Years | 19 (7.1%) | 237 (88.4%) |
| 45 to 54 Years | 51 (20.1%) | 166 (65.3%) |
| 55 to 64 Years | 101 (21.5%) | 359 (76.5%) |
| 65 to 74 Years | 380 (93.8%) | 300 (74.1%) |
| 75 Years and over | 346 (100.0%) | 205 (59.3%) |
| Total | 1,080 (39.7%) | 2,017 (74.1%) |
Disability Status by Sex by Age in Decatur County
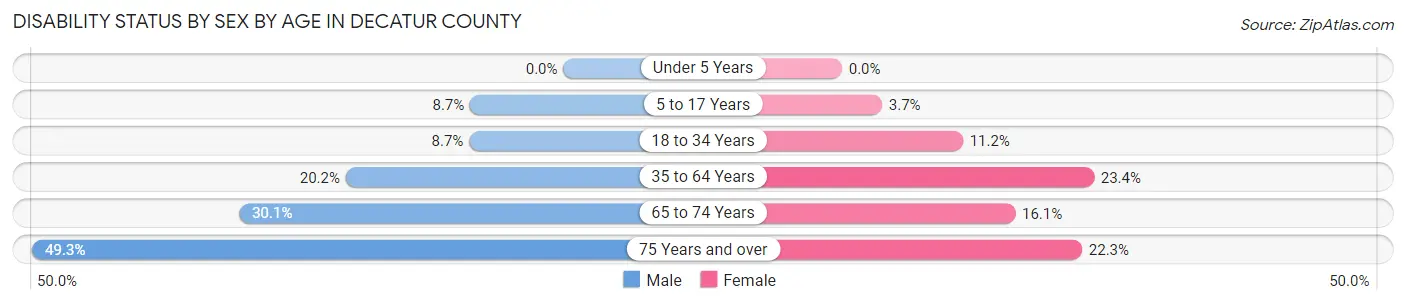
| Age Bracket | Male | Female |
| Under 5 Years | 0 (0.0%) | 0 (0.0%) |
| 5 to 17 Years | 18 (8.6%) | 8 (3.7%) |
| 18 to 34 Years | 18 (8.7%) | 22 (11.2%) |
| 35 to 64 Years | 106 (20.2%) | 109 (23.4%) |
| 65 to 74 Years | 62 (30.1%) | 32 (16.1%) |
| 75 Years and over | 71 (49.3%) | 45 (22.3%) |
Disability Class by Sex by Age in Decatur County
Disability Class: Hearing Difficulty
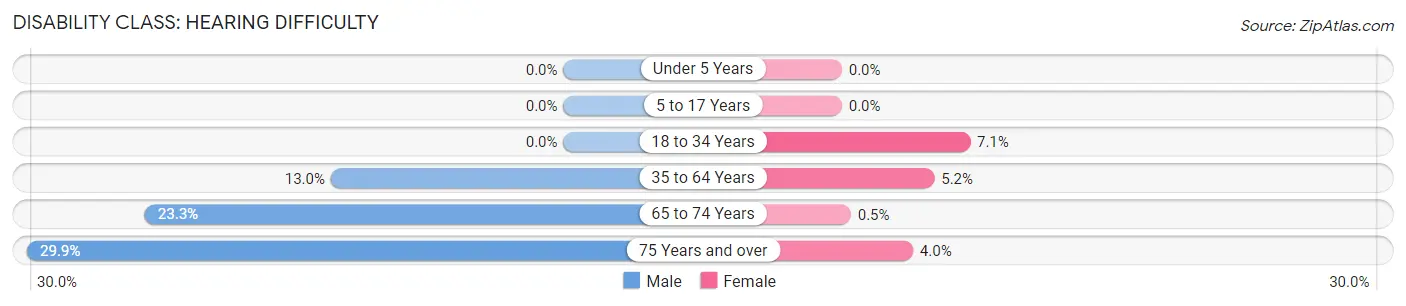
| Age Bracket | Male | Female |
| Under 5 Years | 0 (0.0%) | 0 (0.0%) |
| 5 to 17 Years | 0 (0.0%) | 0 (0.0%) |
| 18 to 34 Years | 0 (0.0%) | 14 (7.1%) |
| 35 to 64 Years | 68 (13.0%) | 24 (5.1%) |
| 65 to 74 Years | 48 (23.3%) | 1 (0.5%) |
| 75 Years and over | 43 (29.9%) | 8 (4.0%) |
Disability Class: Vision Difficulty
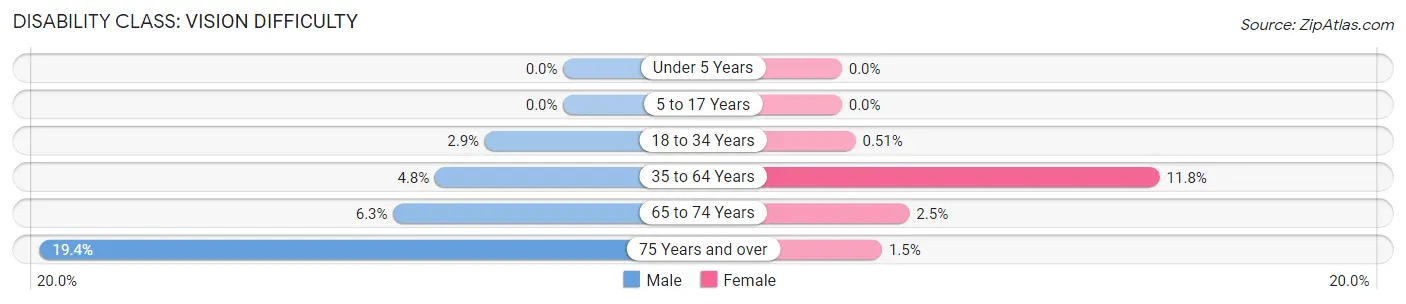
| Age Bracket | Male | Female |
| Under 5 Years | 0 (0.0%) | 0 (0.0%) |
| 5 to 17 Years | 0 (0.0%) | 0 (0.0%) |
| 18 to 34 Years | 6 (2.9%) | 1 (0.5%) |
| 35 to 64 Years | 25 (4.8%) | 55 (11.8%) |
| 65 to 74 Years | 13 (6.3%) | 5 (2.5%) |
| 75 Years and over | 28 (19.4%) | 3 (1.5%) |
Disability Class: Cognitive Difficulty
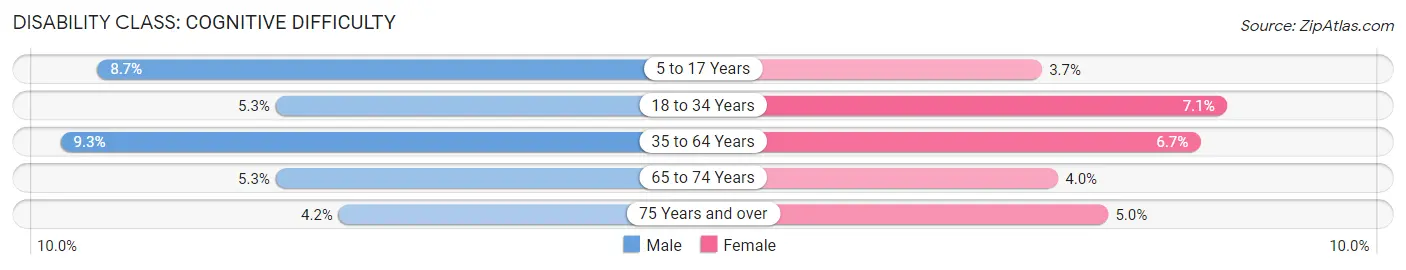
| Age Bracket | Male | Female |
| 5 to 17 Years | 18 (8.6%) | 8 (3.7%) |
| 18 to 34 Years | 11 (5.3%) | 14 (7.1%) |
| 35 to 64 Years | 49 (9.3%) | 31 (6.7%) |
| 65 to 74 Years | 11 (5.3%) | 8 (4.0%) |
| 75 Years and over | 6 (4.2%) | 10 (5.0%) |
Disability Class: Ambulatory Difficulty
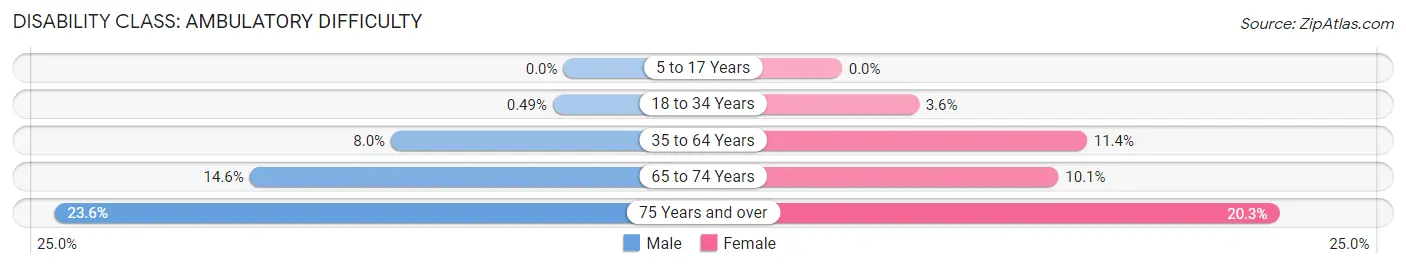
| Age Bracket | Male | Female |
| 5 to 17 Years | 0 (0.0%) | 0 (0.0%) |
| 18 to 34 Years | 1 (0.5%) | 7 (3.6%) |
| 35 to 64 Years | 42 (8.0%) | 53 (11.4%) |
| 65 to 74 Years | 30 (14.6%) | 20 (10.1%) |
| 75 Years and over | 34 (23.6%) | 41 (20.3%) |
Disability Class: Self-Care Difficulty
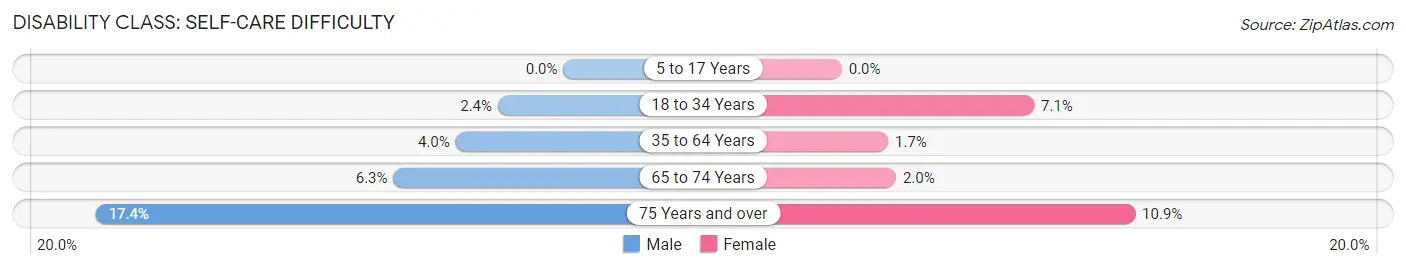
| Age Bracket | Male | Female |
| 5 to 17 Years | 0 (0.0%) | 0 (0.0%) |
| 18 to 34 Years | 5 (2.4%) | 14 (7.1%) |
| 35 to 64 Years | 21 (4.0%) | 8 (1.7%) |
| 65 to 74 Years | 13 (6.3%) | 4 (2.0%) |
| 75 Years and over | 25 (17.4%) | 22 (10.9%) |
Technology Access in Decatur County
Computing Device Access in Decatur County
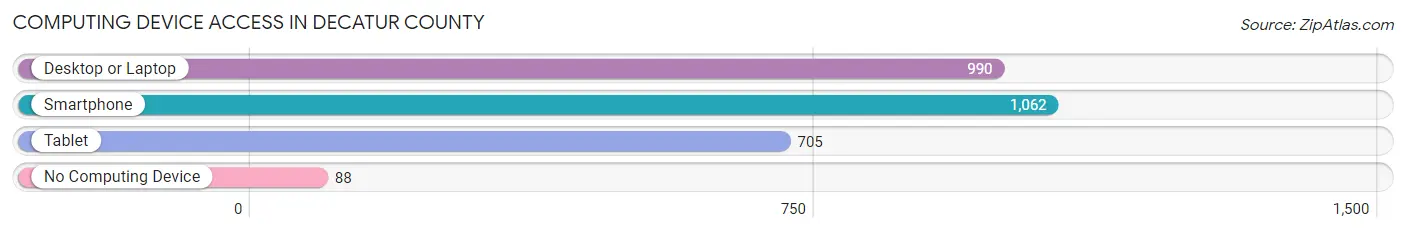
| Device Type | # Households | % Households |
| Desktop or Laptop | 990 | 74.8% |
| Smartphone | 1,062 | 80.2% |
| Tablet | 705 | 53.2% |
| No Computing Device | 88 | 6.7% |
| Total | 1,324 | 100.0% |
Internet Access in Decatur County
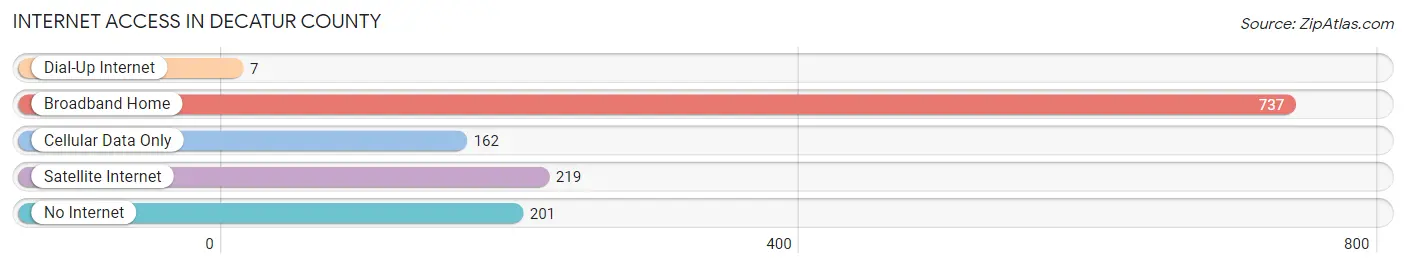
| Internet Type | # Households | % Households |
| Dial-Up Internet | 7 | 0.5% |
| Broadband Home | 737 | 55.7% |
| Cellular Data Only | 162 | 12.2% |
| Satellite Internet | 219 | 16.5% |
| No Internet | 201 | 15.2% |
| Total | 1,324 | 100.0% |
Decatur County Summary
Decatur County, Kansas is located in the northwest corner of the state, bordered by Nebraska to the north and Colorado to the west. It is part of the High Plains region of the Great Plains, and is one of the most sparsely populated counties in the state. The county seat is Oberlin, and the largest city is Norton.
History
Decatur County was established in 1873, and was named after Commodore Stephen Decatur, a naval hero of the War of 1812. The county was originally part of Sheridan County, but was split off in 1873. The first settlers arrived in the area in the 1870s, and the county was officially organized in 1876.
The county was largely agricultural in its early years, with wheat, corn, and other grains being the main crops. Cattle ranching was also an important industry, and the county was home to several large ranches.
In the early 20th century, the county began to diversify its economy. Oil and gas were discovered in the area in the 1920s, and the county became a major producer of oil and gas. The discovery of oil and gas led to an influx of new residents, and the population of the county grew rapidly.
Geography
Decatur County is located in the northwest corner of Kansas, and is bordered by Nebraska to the north and Colorado to the west. It is part of the High Plains region of the Great Plains, and is one of the most sparsely populated counties in the state.
The county is mostly flat, with some rolling hills in the east. The terrain is mostly grassland, with some areas of sandhills and sagebrush. The county is drained by the Republican River, which flows through the county from north to south.
The county has a total area of 1,092 square miles, of which 1,087 square miles is land and 5 square miles is water.
Economy
Decatur County’s economy is largely based on agriculture and oil and gas production. The county is one of the top producers of wheat, corn, and other grains in the state. Cattle ranching is also an important industry, and the county is home to several large ranches.
Oil and gas production is also an important part of the county’s economy. The county is one of the top producers of oil and gas in the state, and the industry has been a major source of jobs and income for the county.
Demographics
As of the 2010 census, Decatur County had a population of 2,945. The population density was 2.7 people per square mile. The racial makeup of the county was 95.3% White, 0.3% African American, 0.7% Native American, 0.2% Asian, 0.1% Pacific Islander, 1.7% from other races, and 1.7% from two or more races. Hispanic or Latino of any race were 4.2% of the population.
The median income for a household in the county was $37,917, and the median income for a family was $45,000. The per capita income for the county was $18,945. About 11.2% of families and 14.2% of the population were below the poverty line, including 17.2% of those under age 18 and 8.2% of those age 65 or over.
Common Questions
What is Per Capita Income in Decatur County?
Per Capita income in Decatur County is $33,767.
What is the Median Family Income in Decatur County?
Median Family Income in Decatur County is $71,300.
What is the Median Household income in Decatur County?
Median Household Income in Decatur County is $49,412.
What is Income or Wage Gap in Decatur County?
Income or Wage Gap in Decatur County is 46.1%.
Women in Decatur County earn 53.9 cents for every dollar earned by a man.
What is Inequality or Gini Index in Decatur County?
Inequality or Gini Index in Decatur County is 0.43.
What is the Total Population of Decatur County?
Total Population of Decatur County is 2,771.
What is the Total Male Population of Decatur County?
Total Male Population of Decatur County is 1,407.
What is the Total Female Population of Decatur County?
Total Female Population of Decatur County is 1,364.
What is the Ratio of Males per 100 Females in Decatur County?
There are 103.15 Males per 100 Females in Decatur County.
What is the Ratio of Females per 100 Males in Decatur County?
There are 96.94 Females per 100 Males in Decatur County.
What is the Median Population Age in Decatur County?
Median Population Age in Decatur County is 50.6 Years.
What is the Average Family Size in Decatur County
Average Family Size in Decatur County is 2.8 People.
What is the Average Household Size in Decatur County
Average Household Size in Decatur County is 2.1 People.
How Large is the Labor Force in Decatur County?
There are 1,376 People in the Labor Forcein in Decatur County.
What is the Percentage of People in the Labor Force in Decatur County?
60.9% of People are in the Labor Force in Decatur County.
What is the Unemployment Rate in Decatur County?
Unemployment Rate in Decatur County is 4.9%.