Comanche County, KS Map & Demographics
Comanche County Map
Comanche County Overview
$30,989
PER CAPITA INCOME
$84,583
AVG FAMILY INCOME
$49,754
AVG HOUSEHOLD INCOME
38.8%
WAGE / INCOME GAP [ % ]
61.2¢/ $1
WAGE / INCOME GAP [ $ ]
0.40
INEQUALITY / GINI INDEX
1,825
TOTAL POPULATION
914
MALE POPULATION
911
FEMALE POPULATION
100.33
MALES / 100 FEMALES
99.67
FEMALES / 100 MALES
46.8
MEDIAN AGE
3.0
AVG FAMILY SIZE
2.1
AVG HOUSEHOLD SIZE
912
LABOR FORCE [ PEOPLE ]
62.5%
PERCENT IN LABOR FORCE
3.8%
UNEMPLOYMENT RATE
Comanche County Area Codes
Income in Comanche County
Income Overview in Comanche County
Per Capita Income in Comanche County is $30,989, while median incomes of families and households are $84,583 and $49,754 respectively.
| Characteristic | Number | Measure |
| Per Capita Income | 1,825 | $30,989 |
| Median Family Income | 440 | $84,583 |
| Mean Family Income | 440 | $93,253 |
| Median Household Income | 827 | $49,754 |
| Mean Household Income | 827 | $66,123 |
| Income Deficit | 440 | $0 |
| Wage / Income Gap (%) | 1,825 | 38.77% |
| Wage / Income Gap ($) | 1,825 | 61.23¢ per $1 |
| Gini / Inequality Index | 1,825 | 0.40 |
Earnings by Sex in Comanche County
Average Earnings in Comanche County are $34,939, $46,103 for men and $28,229 for women, a difference of 38.8%.
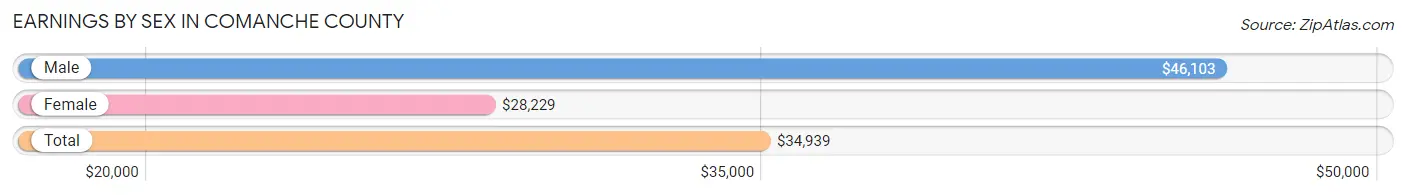
| Sex | Number | Average Earnings |
| Male | 517 (52.4%) | $46,103 |
| Female | 469 (47.6%) | $28,229 |
| Total | 986 (100.0%) | $34,939 |
Earnings by Sex by Income Bracket in Comanche County
The most common earnings brackets in Comanche County are $55,000 to $64,999 for men (64 | 12.4%) and $30,000 to $34,999 for women (56 | 11.9%).
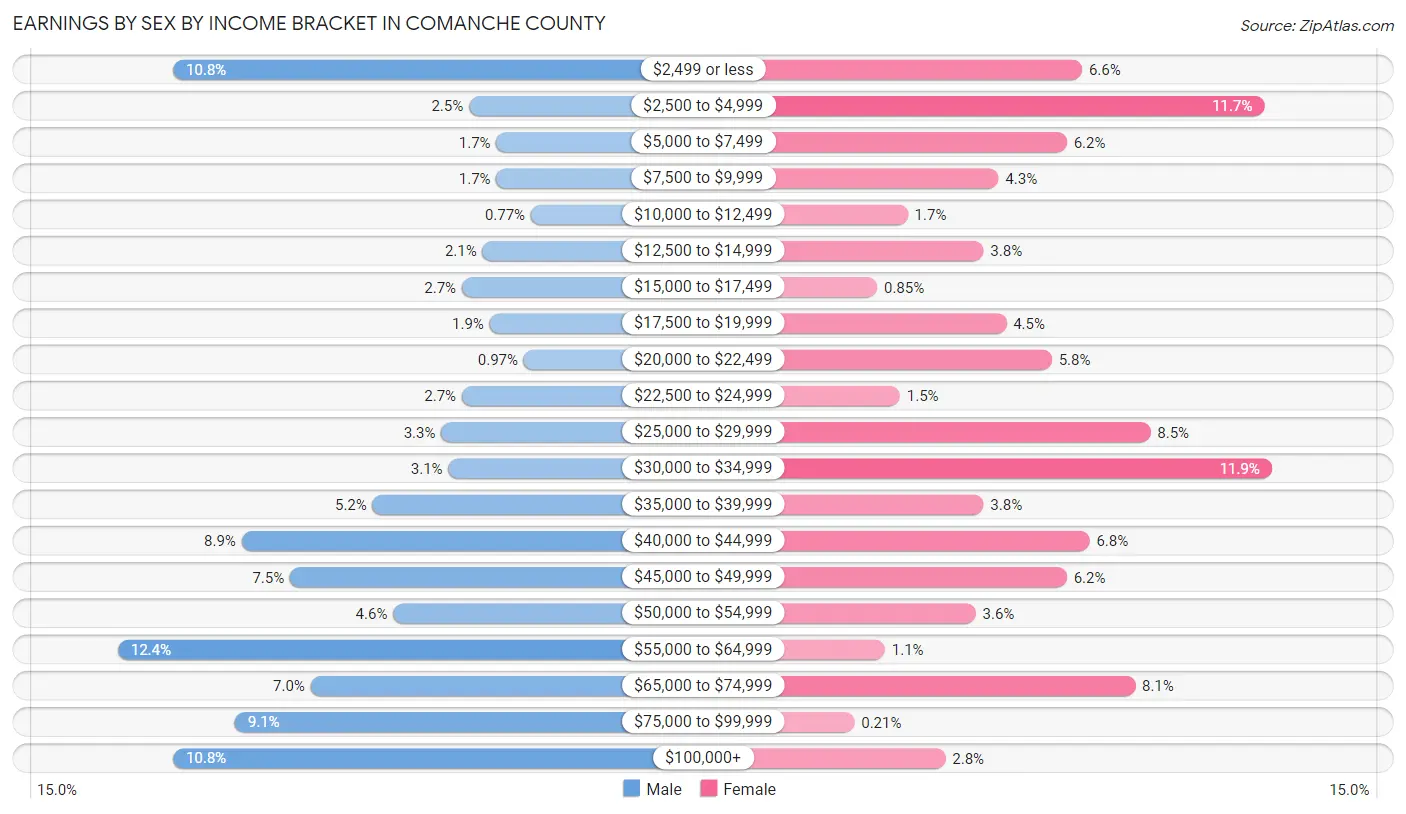
| Income | Male | Female |
| $2,499 or less | 56 (10.8%) | 31 (6.6%) |
| $2,500 to $4,999 | 13 (2.5%) | 55 (11.7%) |
| $5,000 to $7,499 | 9 (1.7%) | 29 (6.2%) |
| $7,500 to $9,999 | 9 (1.7%) | 20 (4.3%) |
| $10,000 to $12,499 | 4 (0.8%) | 8 (1.7%) |
| $12,500 to $14,999 | 11 (2.1%) | 18 (3.8%) |
| $15,000 to $17,499 | 14 (2.7%) | 4 (0.9%) |
| $17,500 to $19,999 | 10 (1.9%) | 21 (4.5%) |
| $20,000 to $22,499 | 5 (1.0%) | 27 (5.8%) |
| $22,500 to $24,999 | 14 (2.7%) | 7 (1.5%) |
| $25,000 to $29,999 | 17 (3.3%) | 40 (8.5%) |
| $30,000 to $34,999 | 16 (3.1%) | 56 (11.9%) |
| $35,000 to $39,999 | 27 (5.2%) | 18 (3.8%) |
| $40,000 to $44,999 | 46 (8.9%) | 32 (6.8%) |
| $45,000 to $49,999 | 39 (7.5%) | 29 (6.2%) |
| $50,000 to $54,999 | 24 (4.6%) | 17 (3.6%) |
| $55,000 to $64,999 | 64 (12.4%) | 5 (1.1%) |
| $65,000 to $74,999 | 36 (7.0%) | 38 (8.1%) |
| $75,000 to $99,999 | 47 (9.1%) | 1 (0.2%) |
| $100,000+ | 56 (10.8%) | 13 (2.8%) |
| Total | 517 (100.0%) | 469 (100.0%) |
Earnings by Sex by Educational Attainment in Comanche County
Average earnings in Comanche County are $52,321 for men and $30,242 for women, a difference of 42.2%. Men with an educational attainment of graduate degree enjoy the highest average annual earnings of $80,833, while those with high school diploma education earn the least with $36,607. Women with an educational attainment of bachelor's degree earn the most with the average annual earnings of $50,221, while those with less than high school education have the smallest earnings of $11,607.
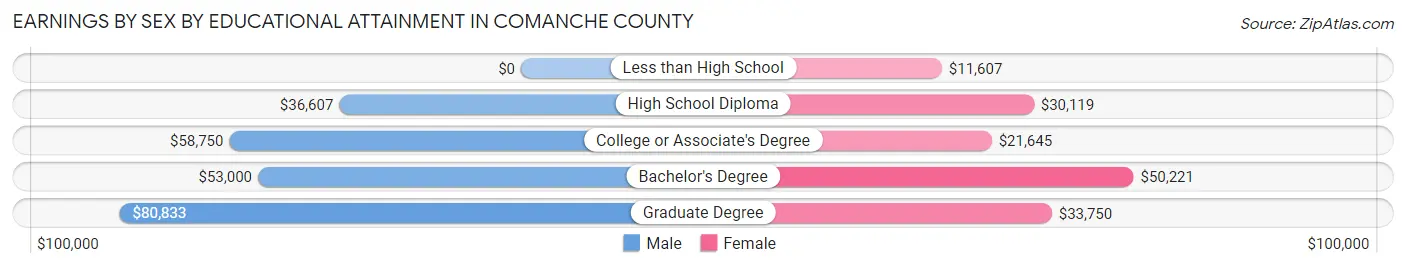
| Educational Attainment | Male Income | Female Income |
| Less than High School | - | - |
| High School Diploma | $36,607 | $30,119 |
| College or Associate's Degree | $58,750 | $21,645 |
| Bachelor's Degree | $53,000 | $50,221 |
| Graduate Degree | $80,833 | $33,750 |
| Total | $52,321 | $30,242 |
Family Income in Comanche County
Family Income Brackets in Comanche County
According to the Comanche County family income data, there are 115 families falling into the $100,000 to $149,999 income range, which is the most common income bracket and makes up 26.1% of all families.
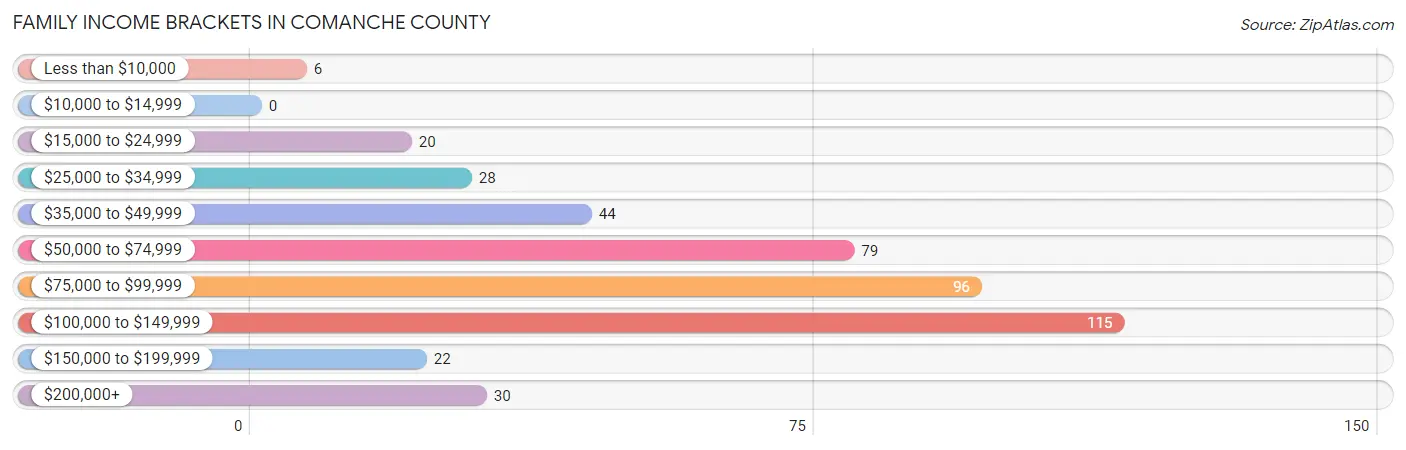
| Income Bracket | # Families | % Families |
| Less than $10,000 | 6 | 1.4% |
| $10,000 to $14,999 | 0 | 0.0% |
| $15,000 to $24,999 | 20 | 4.5% |
| $25,000 to $34,999 | 28 | 6.4% |
| $35,000 to $49,999 | 44 | 10.0% |
| $50,000 to $74,999 | 79 | 18.0% |
| $75,000 to $99,999 | 96 | 21.8% |
| $100,000 to $149,999 | 115 | 26.1% |
| $150,000 to $199,999 | 22 | 5.0% |
| $200,000+ | 30 | 6.8% |
Family Income by Famaliy Size in Comanche County
5-person families (39 | 8.9%) account for the highest median family income in Comanche County with $205,446 per family, while 5-person families (39 | 8.9%) have the highest median income of $41,089 per family member.
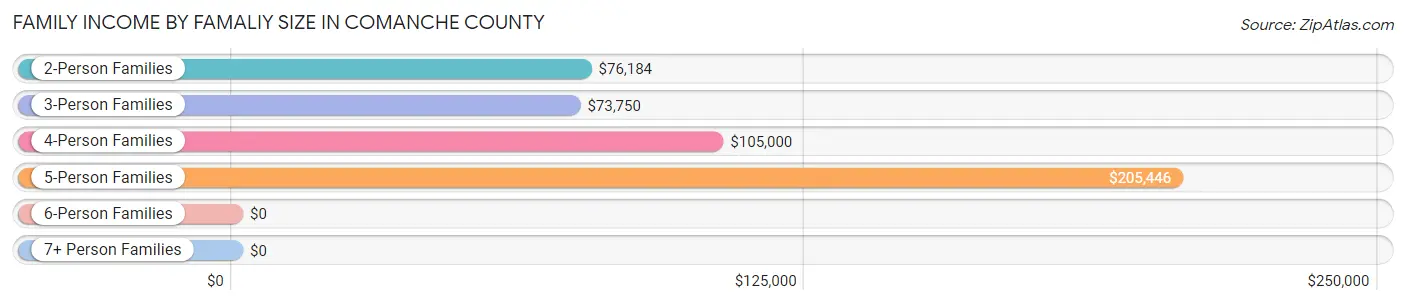
| Income Bracket | # Families | Median Income |
| 2-Person Families | 272 (61.8%) | $76,184 |
| 3-Person Families | 43 (9.8%) | $73,750 |
| 4-Person Families | 64 (14.5%) | $105,000 |
| 5-Person Families | 39 (8.9%) | $205,446 |
| 6-Person Families | 17 (3.9%) | $0 |
| 7+ Person Families | 5 (1.1%) | $0 |
| Total | 440 (100.0%) | $84,583 |
Family Income by Number of Earners in Comanche County
The median family income in Comanche County is $84,583, with families comprising 3+ earners (58) having the highest median family income of $131,250, while families with no earners (42) have the lowest median family income of $32,500, accounting for 13.2% and 9.6% of families, respectively.
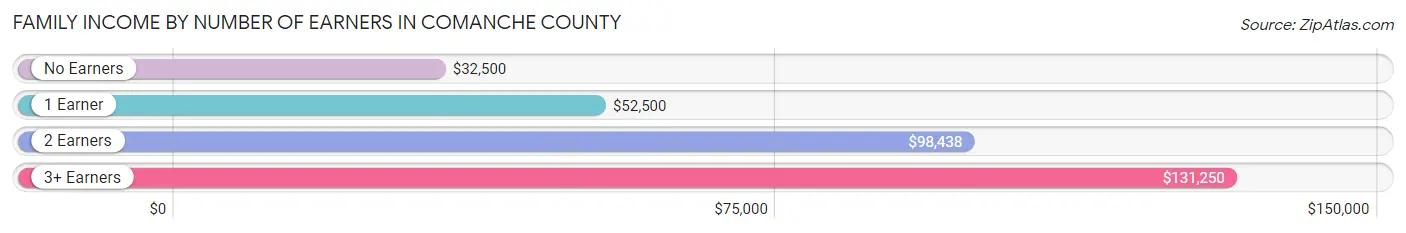
| Number of Earners | # Families | Median Income |
| No Earners | 42 (9.6%) | $32,500 |
| 1 Earner | 108 (24.5%) | $52,500 |
| 2 Earners | 232 (52.7%) | $98,438 |
| 3+ Earners | 58 (13.2%) | $131,250 |
| Total | 440 (100.0%) | $84,583 |
Household Income in Comanche County
Household Income Brackets in Comanche County
With 161 households falling in the category, the $35,000 to $49,999 income range is the most frequent in Comanche County, accounting for 19.5% of all households. In contrast, only 25 households (3.0%) fall into the $150,000 to $199,999 income bracket, making it the least populous group.
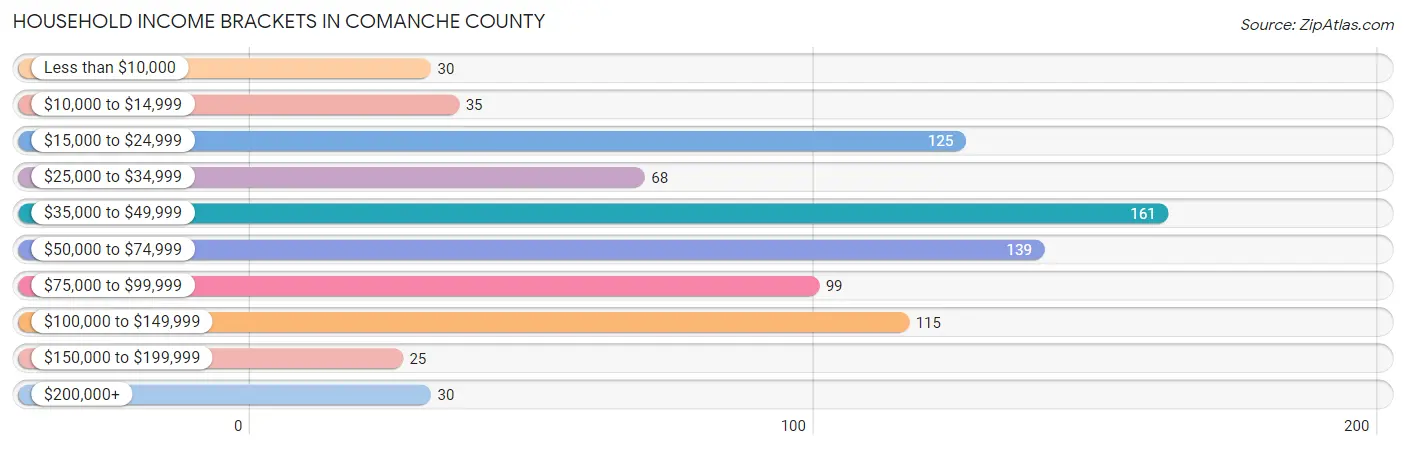
| Income Bracket | # Households | % Households |
| Less than $10,000 | 30 | 3.6% |
| $10,000 to $14,999 | 35 | 4.2% |
| $15,000 to $24,999 | 125 | 15.1% |
| $25,000 to $34,999 | 68 | 8.2% |
| $35,000 to $49,999 | 161 | 19.5% |
| $50,000 to $74,999 | 139 | 16.8% |
| $75,000 to $99,999 | 99 | 12.0% |
| $100,000 to $149,999 | 115 | 13.9% |
| $150,000 to $199,999 | 25 | 3.0% |
| $200,000+ | 30 | 3.6% |
Household Income by Householder Age in Comanche County
The median household income in Comanche County is $49,754, with the highest median household income of $74,000 found in the 45 to 64 years age bracket for the primary householder. A total of 280 households (33.9%) fall into this category. Meanwhile, the 15 to 24 years age bracket for the primary householder has the lowest median household income of $33,750, with 26 households (3.1%) in this group.
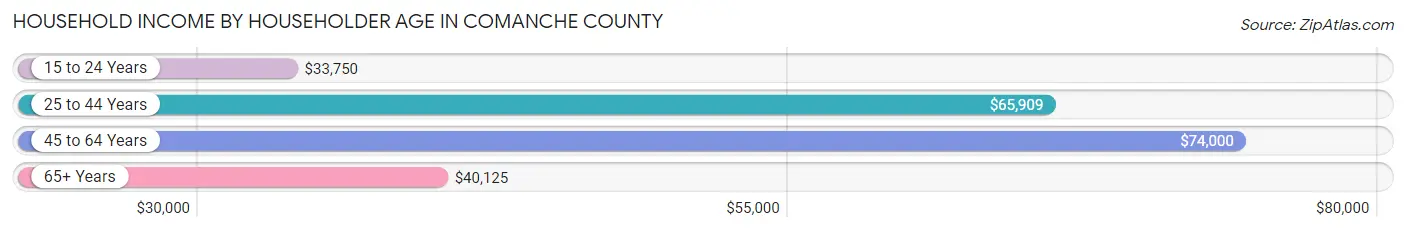
| Income Bracket | # Households | Median Income |
| 15 to 24 Years | 26 (3.1%) | $33,750 |
| 25 to 44 Years | 202 (24.4%) | $65,909 |
| 45 to 64 Years | 280 (33.9%) | $74,000 |
| 65+ Years | 319 (38.6%) | $40,125 |
| Total | 827 (100.0%) | $49,754 |
Poverty in Comanche County
Income Below Poverty by Sex and Age in Comanche County
With 8.9% poverty level for males and 8.5% for females among the residents of Comanche County, 5 year old males and under 5 year old females are the most vulnerable to poverty, with 3 males (23.1%) and 8 females (29.6%) in their respective age groups living below the poverty level.
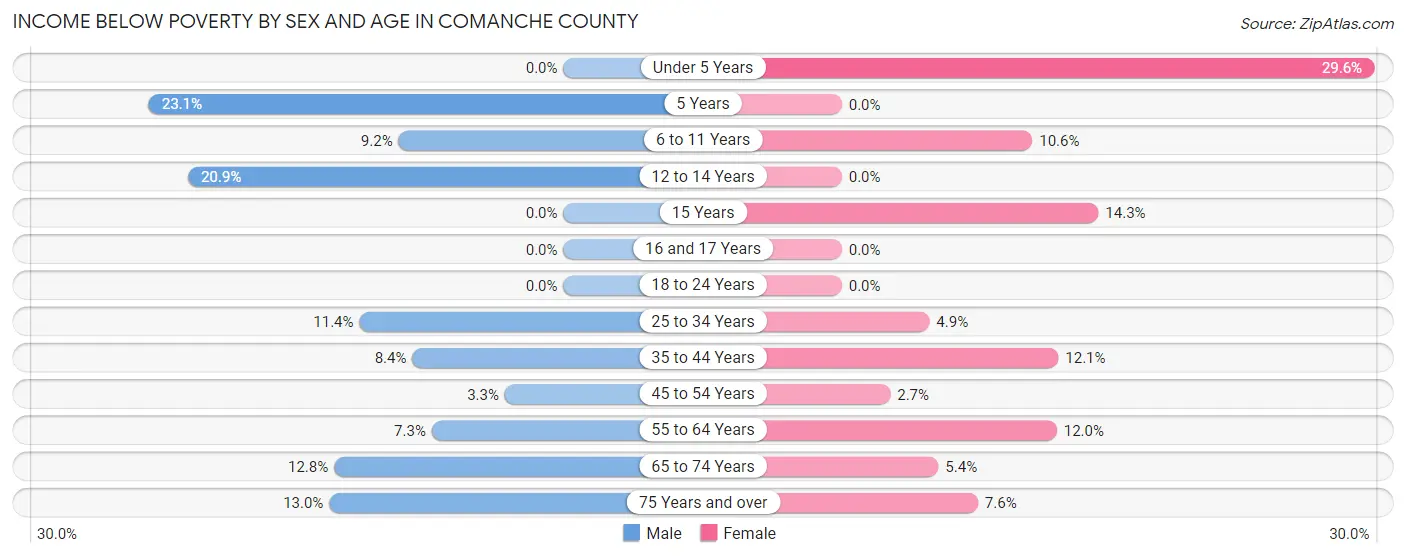
| Age Bracket | Male | Female |
| Under 5 Years | 0 (0.0%) | 8 (29.6%) |
| 5 Years | 3 (23.1%) | 0 (0.0%) |
| 6 to 11 Years | 9 (9.2%) | 7 (10.6%) |
| 12 to 14 Years | 14 (20.9%) | 0 (0.0%) |
| 15 Years | 0 (0.0%) | 4 (14.3%) |
| 16 and 17 Years | 0 (0.0%) | 0 (0.0%) |
| 18 to 24 Years | 0 (0.0%) | 0 (0.0%) |
| 25 to 34 Years | 5 (11.4%) | 2 (4.9%) |
| 35 to 44 Years | 9 (8.4%) | 17 (12.1%) |
| 45 to 54 Years | 3 (3.3%) | 2 (2.7%) |
| 55 to 64 Years | 11 (7.3%) | 17 (12.0%) |
| 65 to 74 Years | 18 (12.8%) | 7 (5.4%) |
| 75 Years and over | 6 (13.0%) | 10 (7.6%) |
| Total | 78 (8.9%) | 74 (8.5%) |
Income Above Poverty by Sex and Age in Comanche County
According to the poverty statistics in Comanche County, males aged under 5 years and females aged 12 to 14 years are the age groups that are most secure financially, with 100.0% of males and 100.0% of females in these age groups living above the poverty line.
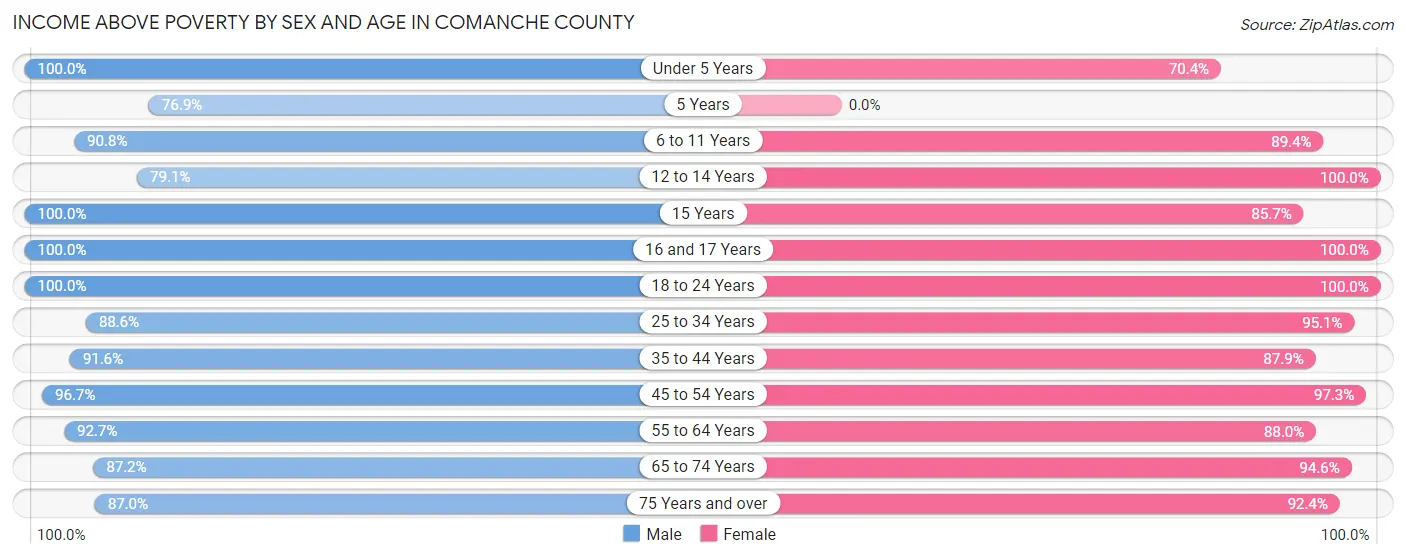
| Age Bracket | Male | Female |
| Under 5 Years | 35 (100.0%) | 19 (70.4%) |
| 5 Years | 10 (76.9%) | 0 (0.0%) |
| 6 to 11 Years | 89 (90.8%) | 59 (89.4%) |
| 12 to 14 Years | 53 (79.1%) | 16 (100.0%) |
| 15 Years | 1 (100.0%) | 24 (85.7%) |
| 16 and 17 Years | 12 (100.0%) | 35 (100.0%) |
| 18 to 24 Years | 67 (100.0%) | 41 (100.0%) |
| 25 to 34 Years | 39 (88.6%) | 39 (95.1%) |
| 35 to 44 Years | 98 (91.6%) | 124 (87.9%) |
| 45 to 54 Years | 89 (96.7%) | 72 (97.3%) |
| 55 to 64 Years | 139 (92.7%) | 125 (88.0%) |
| 65 to 74 Years | 123 (87.2%) | 123 (94.6%) |
| 75 Years and over | 40 (87.0%) | 122 (92.4%) |
| Total | 795 (91.1%) | 799 (91.5%) |
Income Below Poverty Among Married-Couple Families in Comanche County
The poverty statistics for married-couple families in Comanche County show that 4.7% or 17 of the total 363 families live below the poverty line. Families with 5 or more children have the highest poverty rate of 100.0%, comprising of 5 families. On the other hand, families with 1 or 2 children have the lowest poverty rate of 0.0%, which includes 0 families.
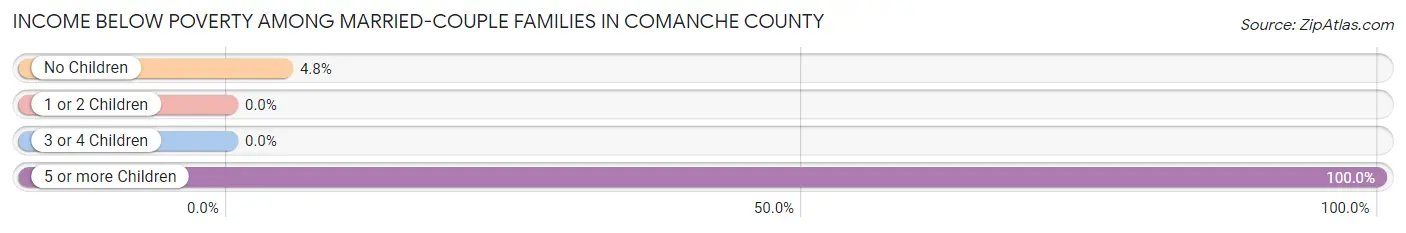
| Children | Above Poverty | Below Poverty |
| No Children | 239 (95.2%) | 12 (4.8%) |
| 1 or 2 Children | 65 (100.0%) | 0 (0.0%) |
| 3 or 4 Children | 42 (100.0%) | 0 (0.0%) |
| 5 or more Children | 0 (0.0%) | 5 (100.0%) |
| Total | 346 (95.3%) | 17 (4.7%) |
Income Below Poverty Among Single-Parent Households in Comanche County
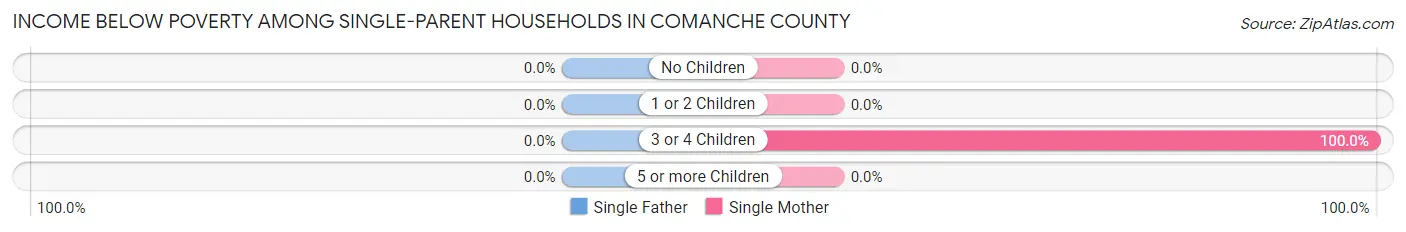
| Children | Single Father | Single Mother |
| No Children | 0 (0.0%) | 0 (0.0%) |
| 1 or 2 Children | 0 (0.0%) | 0 (0.0%) |
| 3 or 4 Children | 0 (0.0%) | 4 (100.0%) |
| 5 or more Children | 0 (0.0%) | 0 (0.0%) |
| Total | 0 (0.0%) | 4 (9.1%) |
Income Below Poverty Among Married-Couple vs Single-Parent Households in Comanche County
The poverty data for Comanche County shows that 17 of the married-couple family households (4.7%) and 4 of the single-parent households (5.2%) are living below the poverty level. Within the married-couple family households, those with 5 or more children have the highest poverty rate, with 5 households (100.0%) falling below the poverty line. Among the single-parent households, those with 3 or 4 children have the highest poverty rate, with 4 household (100.0%) living below poverty.
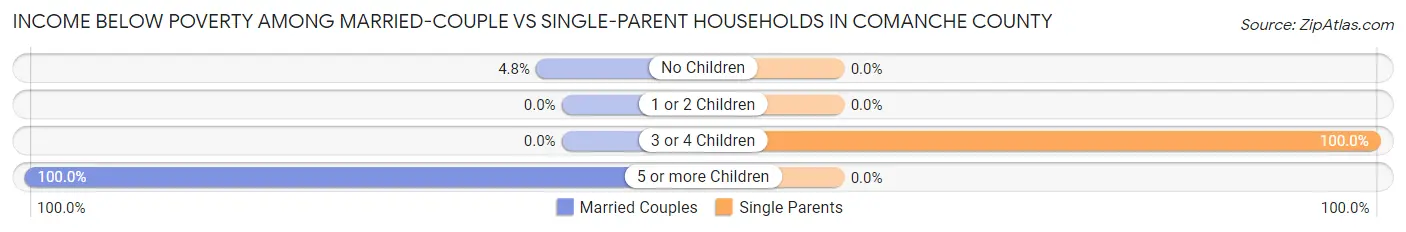
| Children | Married-Couple Families | Single-Parent Households |
| No Children | 12 (4.8%) | 0 (0.0%) |
| 1 or 2 Children | 0 (0.0%) | 0 (0.0%) |
| 3 or 4 Children | 0 (0.0%) | 4 (100.0%) |
| 5 or more Children | 5 (100.0%) | 0 (0.0%) |
| Total | 17 (4.7%) | 4 (5.2%) |
Race in Comanche County
The most populous races in Comanche County are White / Caucasian (1,782 | 97.6%), Hispanic or Latino (48 | 2.6%), and Two or more Races (33 | 1.8%).
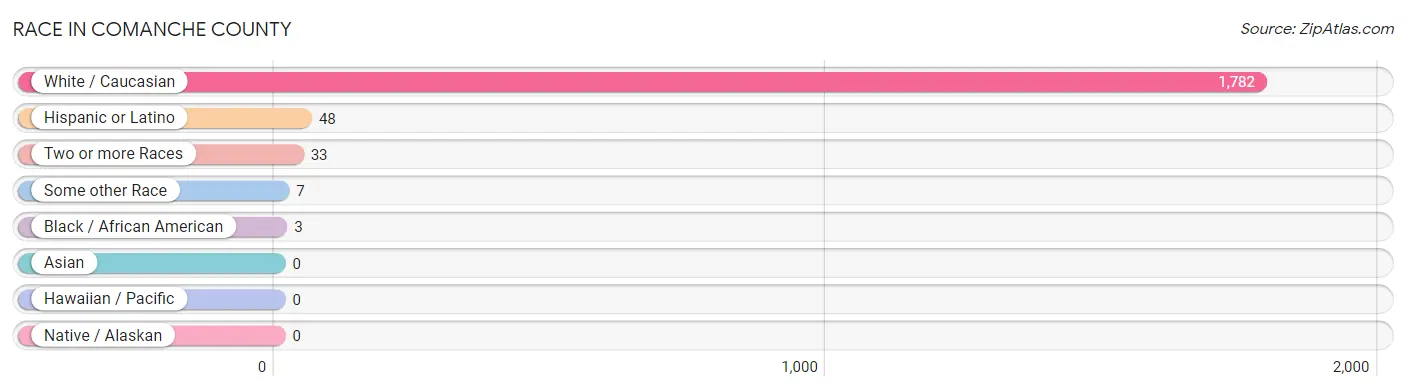
| Race | # Population | % Population |
| Asian | 0 | 0.0% |
| Black / African American | 3 | 0.2% |
| Hawaiian / Pacific | 0 | 0.0% |
| Hispanic or Latino | 48 | 2.6% |
| Native / Alaskan | 0 | 0.0% |
| White / Caucasian | 1,782 | 97.6% |
| Two or more Races | 33 | 1.8% |
| Some other Race | 7 | 0.4% |
| Total | 1,825 | 100.0% |
Ancestry in Comanche County
The most populous ancestries reported in Comanche County are German (555 | 30.4%), English (391 | 21.4%), Irish (277 | 15.2%), American (86 | 4.7%), and European (50 | 2.7%), together accounting for 74.5% of all Comanche County residents.
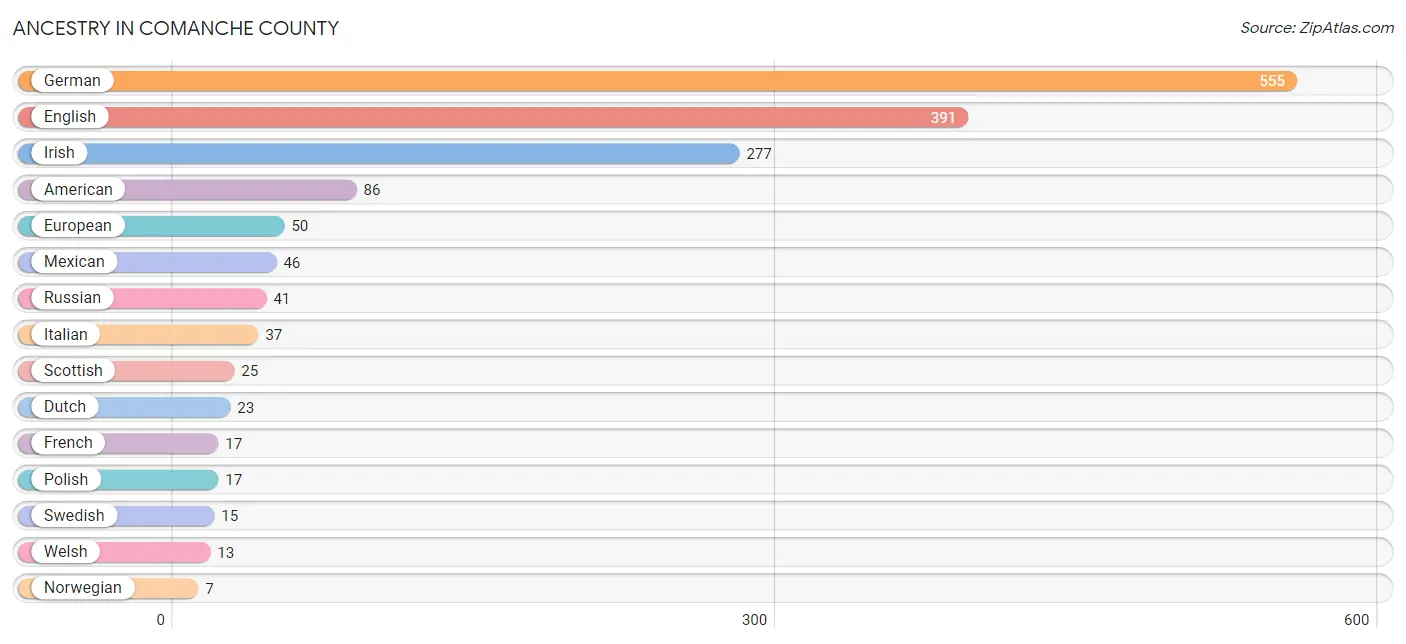
| Ancestry | # Population | % Population |
| Alaska Native | 5 | 0.3% |
| American | 86 | 4.7% |
| Cherokee | 5 | 0.3% |
| Czechoslovakian | 1 | 0.1% |
| Danish | 5 | 0.3% |
| Dutch | 23 | 1.3% |
| Eastern European | 3 | 0.2% |
| English | 391 | 21.4% |
| European | 50 | 2.7% |
| French | 17 | 0.9% |
| German | 555 | 30.4% |
| Hungarian | 2 | 0.1% |
| Irish | 277 | 15.2% |
| Italian | 37 | 2.0% |
| Mexican | 46 | 2.5% |
| Norwegian | 7 | 0.4% |
| Polish | 17 | 0.9% |
| Russian | 41 | 2.2% |
| Scandinavian | 1 | 0.1% |
| Scotch-Irish | 6 | 0.3% |
| Scottish | 25 | 1.4% |
| Slovak | 5 | 0.3% |
| Swedish | 15 | 0.8% |
| Swiss | 7 | 0.4% |
| Welsh | 13 | 0.7% | View All 25 Rows |
Immigrants in Comanche County
The most numerous immigrant groups reported in Comanche County came from Central America (14 | 0.8%), Latin America (14 | 0.8%), and Mexico (14 | 0.8%), together accounting for 2.3% of all Comanche County residents.
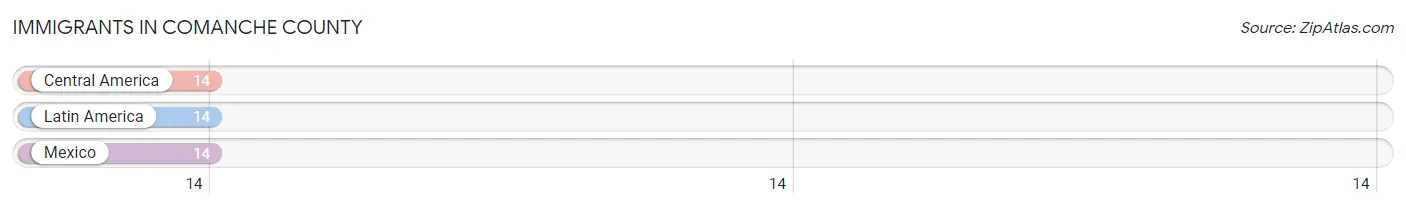
| Immigration Origin | # Population | % Population |
| Central America | 14 | 0.8% |
| Latin America | 14 | 0.8% |
| Mexico | 14 | 0.8% | View All 3 Rows |
Sex and Age in Comanche County
Sex and Age in Comanche County
The most populous age groups in Comanche County are 65 to 69 Years (109 | 11.9%) for men and 70 to 74 Years (110 | 12.1%) for women.
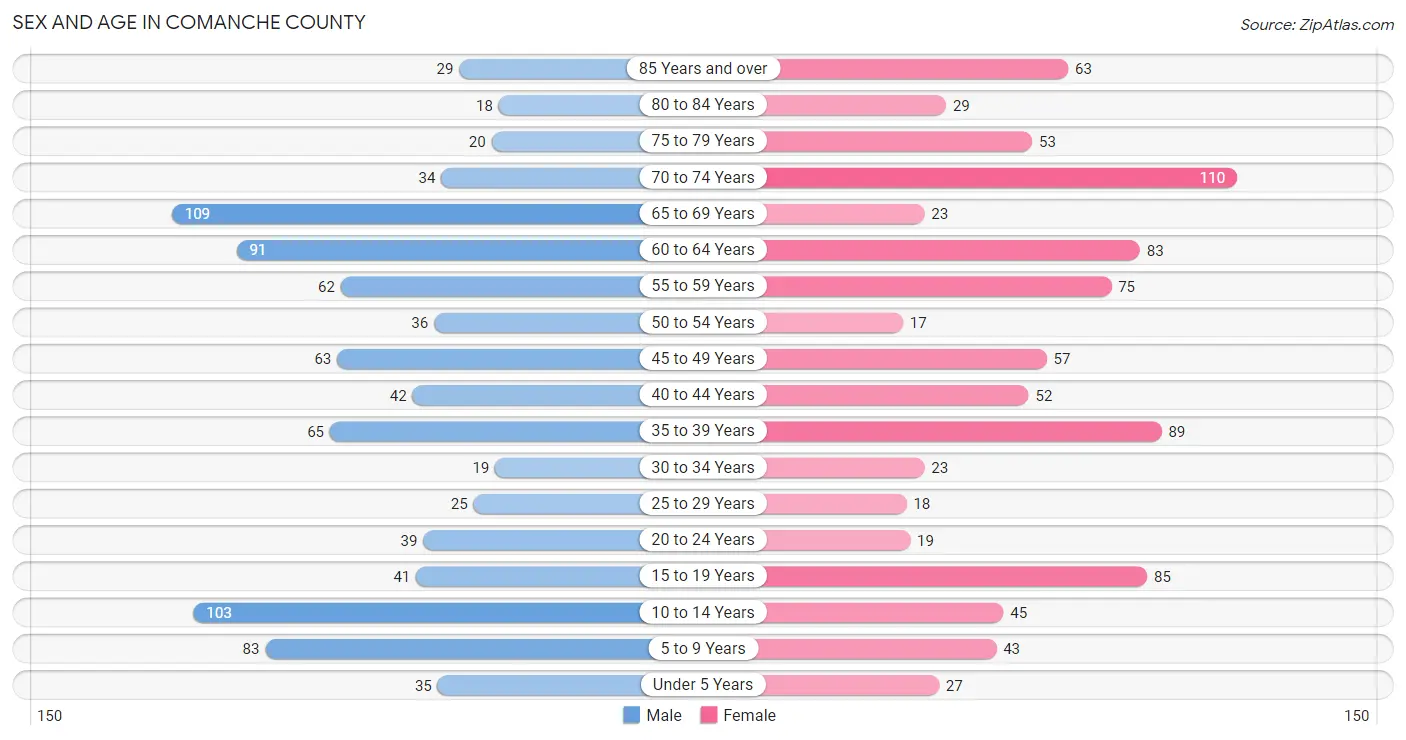
| Age Bracket | Male | Female |
| Under 5 Years | 35 (3.8%) | 27 (3.0%) |
| 5 to 9 Years | 83 (9.1%) | 43 (4.7%) |
| 10 to 14 Years | 103 (11.3%) | 45 (4.9%) |
| 15 to 19 Years | 41 (4.5%) | 85 (9.3%) |
| 20 to 24 Years | 39 (4.3%) | 19 (2.1%) |
| 25 to 29 Years | 25 (2.7%) | 18 (2.0%) |
| 30 to 34 Years | 19 (2.1%) | 23 (2.5%) |
| 35 to 39 Years | 65 (7.1%) | 89 (9.8%) |
| 40 to 44 Years | 42 (4.6%) | 52 (5.7%) |
| 45 to 49 Years | 63 (6.9%) | 57 (6.3%) |
| 50 to 54 Years | 36 (3.9%) | 17 (1.9%) |
| 55 to 59 Years | 62 (6.8%) | 75 (8.2%) |
| 60 to 64 Years | 91 (10.0%) | 83 (9.1%) |
| 65 to 69 Years | 109 (11.9%) | 23 (2.5%) |
| 70 to 74 Years | 34 (3.7%) | 110 (12.1%) |
| 75 to 79 Years | 20 (2.2%) | 53 (5.8%) |
| 80 to 84 Years | 18 (2.0%) | 29 (3.2%) |
| 85 Years and over | 29 (3.2%) | 63 (6.9%) |
| Total | 914 (100.0%) | 911 (100.0%) |
Families and Households in Comanche County
Median Family Size in Comanche County
The median family size in Comanche County is 3.01 persons per family, with single male/father families (33 | 7.5%) accounting for the largest median family size of 3.79 persons per family. On the other hand, married-couple families (363 | 82.5%) represent the smallest median family size with 2.91 persons per family.
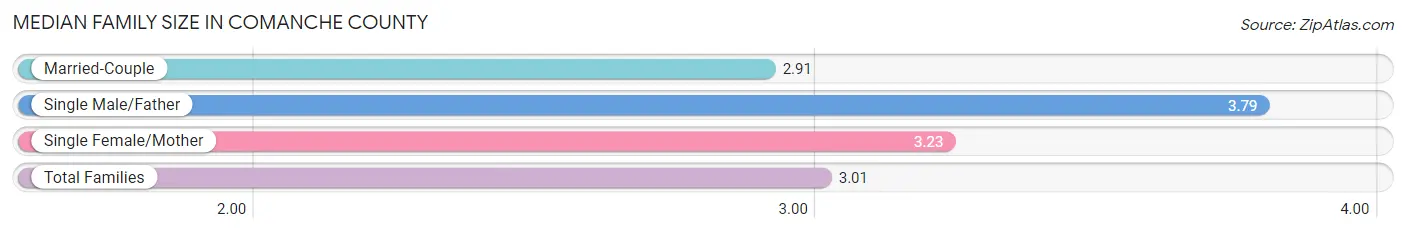
| Family Type | # Families | Family Size |
| Married-Couple | 363 (82.5%) | 2.91 |
| Single Male/Father | 33 (7.5%) | 3.79 |
| Single Female/Mother | 44 (10.0%) | 3.23 |
| Total Families | 440 (100.0%) | 3.01 |
Median Household Size in Comanche County
The median household size in Comanche County is 2.13 persons per household, with single male/father households (33 | 4.0%) accounting for the largest median household size of 3.97 persons per household. non-family households (387 | 46.8%) represent the smallest median household size with 1.06 persons per household.
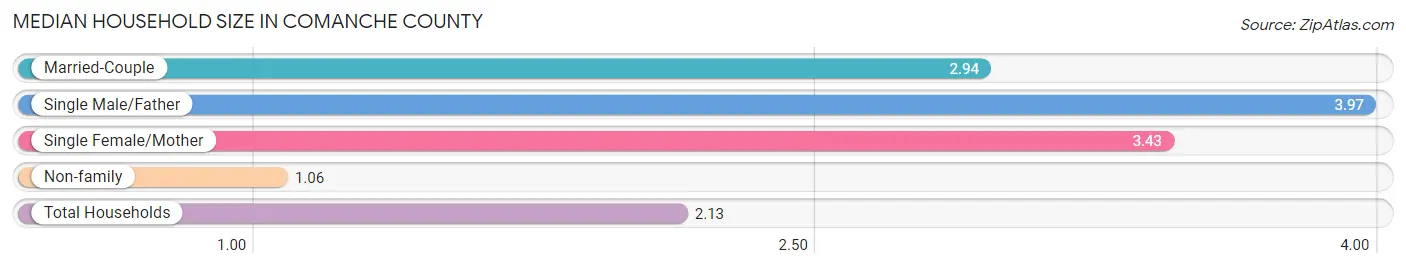
| Household Type | # Households | Household Size |
| Married-Couple | 363 (43.9%) | 2.94 |
| Single Male/Father | 33 (4.0%) | 3.97 |
| Single Female/Mother | 44 (5.3%) | 3.43 |
| Non-family | 387 (46.8%) | 1.06 |
| Total Households | 827 (100.0%) | 2.13 |
Household Size by Marriage Status in Comanche County
Out of a total of 827 households in Comanche County, 440 (53.2%) are family households, while 387 (46.8%) are nonfamily households. The most numerous type of family households are 2-person households, comprising 265, and the most common type of nonfamily households are 1-person households, comprising 368.
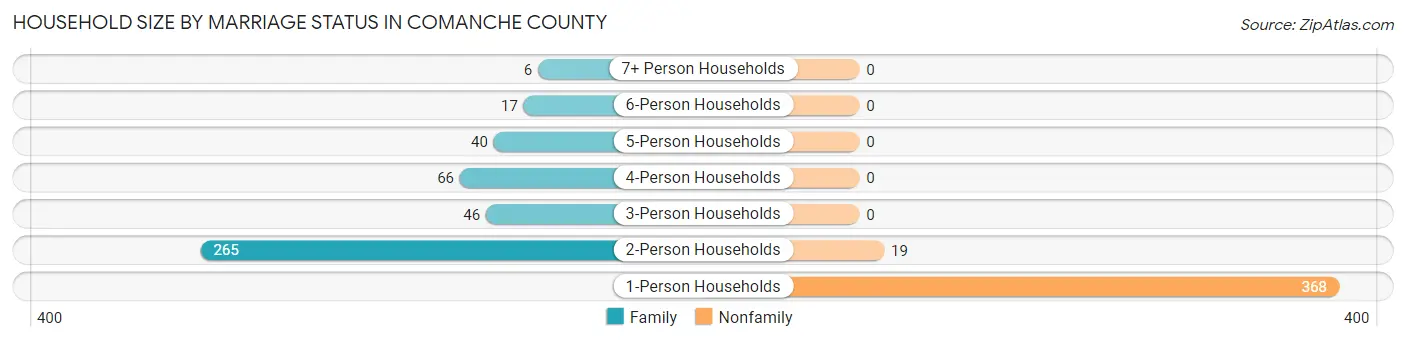
| Household Size | Family Households | Nonfamily Households |
| 1-Person Households | - | 368 (44.5%) |
| 2-Person Households | 265 (32.0%) | 19 (2.3%) |
| 3-Person Households | 46 (5.6%) | 0 (0.0%) |
| 4-Person Households | 66 (8.0%) | 0 (0.0%) |
| 5-Person Households | 40 (4.8%) | 0 (0.0%) |
| 6-Person Households | 17 (2.1%) | 0 (0.0%) |
| 7+ Person Households | 6 (0.7%) | 0 (0.0%) |
| Total | 440 (53.2%) | 387 (46.8%) |
Female Fertility in Comanche County
Fertility by Age in Comanche County
Average fertility rate in Comanche County is 17.0 births per 1,000 women. Women in the age bracket of 20 to 34 years have the highest fertility rate with 100.0 births per 1,000 women. Women in the age bracket of 20 to 34 years acount for 100.0% of all women with births.
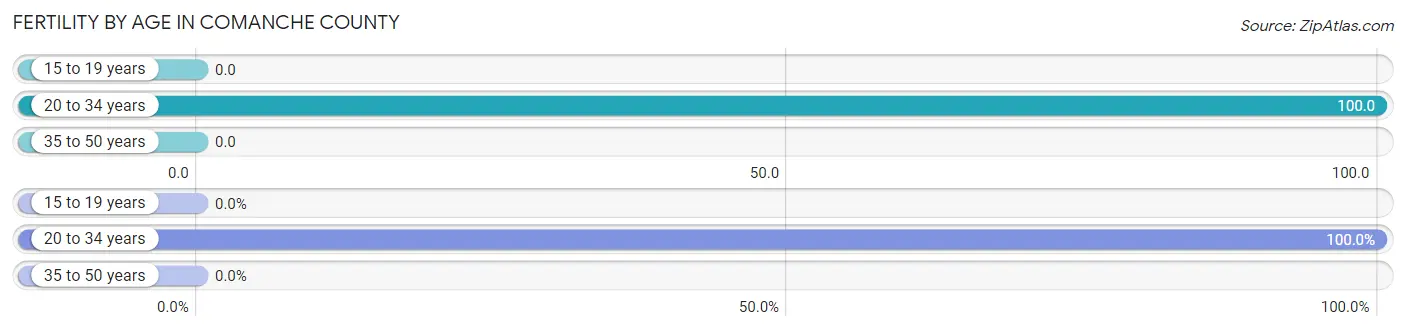
| Age Bracket | Women with Births | Births / 1,000 Women |
| 15 to 19 years | 0 (0.0%) | 0.0 |
| 20 to 34 years | 6 (100.0%) | 100.0 |
| 35 to 50 years | 0 (0.0%) | 0.0 |
| Total | 6 (100.0%) | 17.0 |
Fertility by Age by Marriage Status in Comanche County
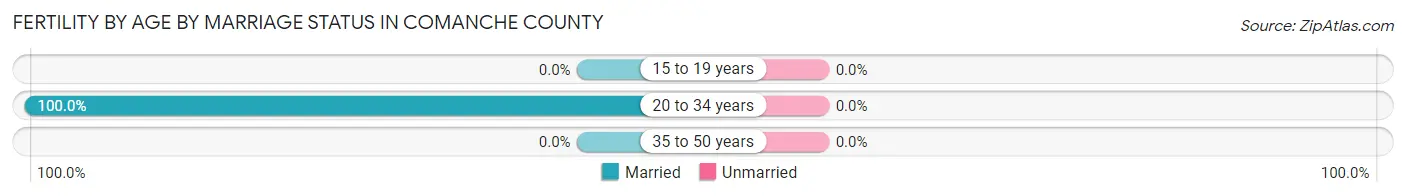
| Age Bracket | Married | Unmarried |
| 15 to 19 years | 0 (0.0%) | 0 (0.0%) |
| 20 to 34 years | 6 (100.0%) | 0 (0.0%) |
| 35 to 50 years | 0 (0.0%) | 0 (0.0%) |
| Total | 6 (100.0%) | 0 (0.0%) |
Fertility by Education in Comanche County
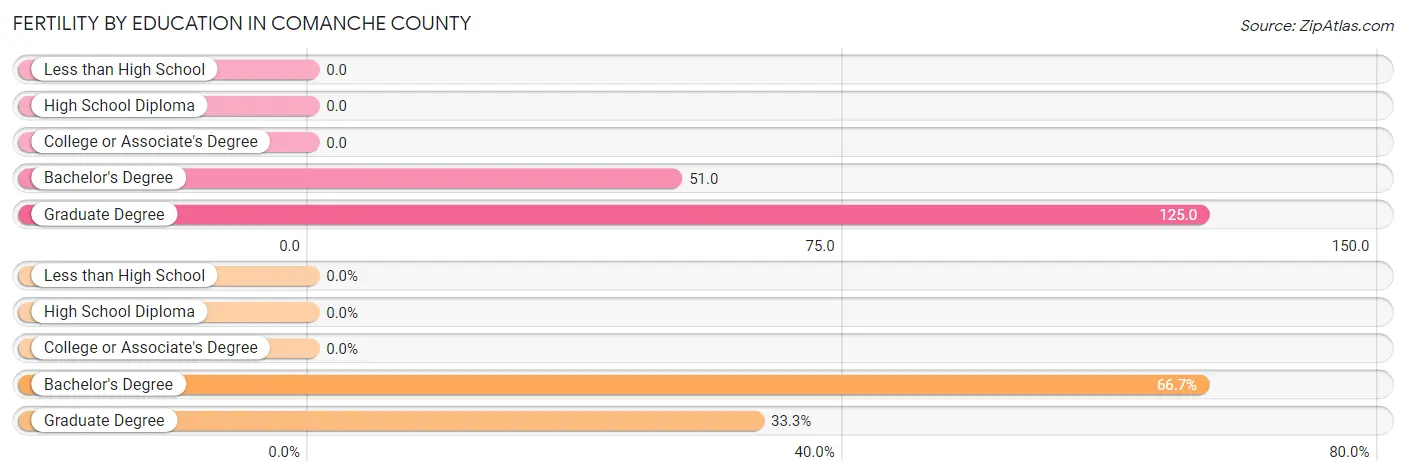
| Educational Attainment | Women with Births | Births / 1,000 Women |
| Less than High School | 0 (0.0%) | 0.0 |
| High School Diploma | 0 (0.0%) | 0.0 |
| College or Associate's Degree | 0 (0.0%) | 0.0 |
| Bachelor's Degree | 4 (66.7%) | 51.0 |
| Graduate Degree | 2 (33.3%) | 125.0 |
| Total | 6 (100.0%) | 17.0 |
Fertility by Education by Marriage Status in Comanche County
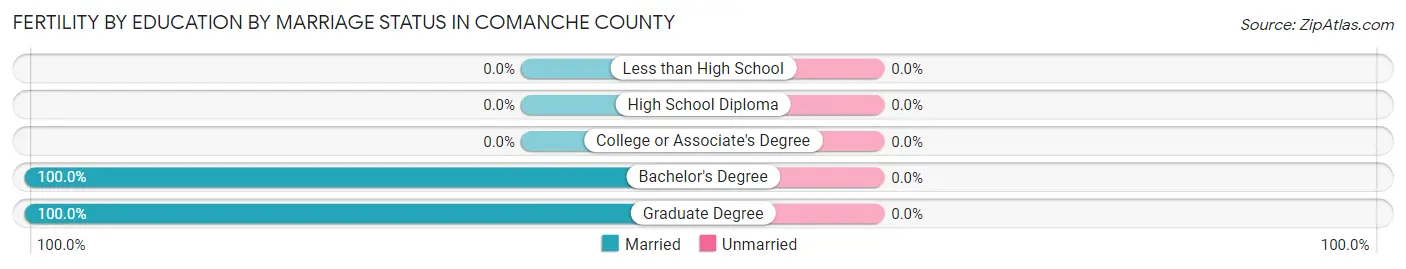
| Educational Attainment | Married | Unmarried |
| Less than High School | 0 (0.0%) | 0 (0.0%) |
| High School Diploma | 0 (0.0%) | 0 (0.0%) |
| College or Associate's Degree | 0 (0.0%) | 0 (0.0%) |
| Bachelor's Degree | 4 (100.0%) | 0 (0.0%) |
| Graduate Degree | 2 (100.0%) | 0 (0.0%) |
| Total | 6 (100.0%) | 0 (0.0%) |
Employment Characteristics in Comanche County
Employment by Class of Employer in Comanche County
Among the 855 employed individuals in Comanche County, private company employees (396 | 46.3%), self-employed (not incorporated) (127 | 14.8%), and local government employees (111 | 13.0%) make up the most common classes of employment.
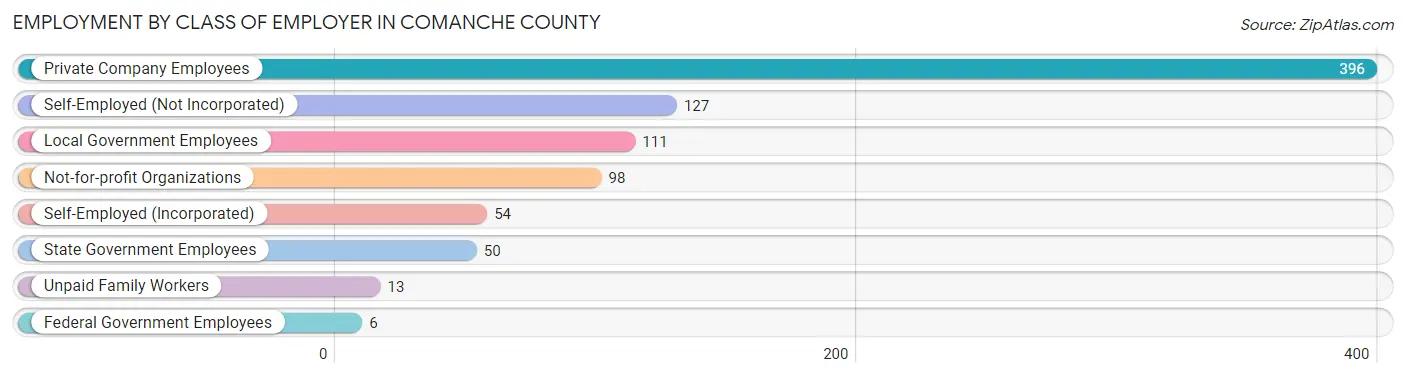
| Employer Class | # Employees | % Employees |
| Private Company Employees | 396 | 46.3% |
| Self-Employed (Incorporated) | 54 | 6.3% |
| Self-Employed (Not Incorporated) | 127 | 14.8% |
| Not-for-profit Organizations | 98 | 11.5% |
| Local Government Employees | 111 | 13.0% |
| State Government Employees | 50 | 5.9% |
| Federal Government Employees | 6 | 0.7% |
| Unpaid Family Workers | 13 | 1.5% |
| Total | 855 | 100.0% |
Employment Status by Age in Comanche County
According to the labor force statistics for Comanche County, out of the total population over 16 years of age (1,460), 62.5% or 912 individuals are in the labor force, with 3.8% or 35 of them unemployed. The age group with the highest labor force participation rate is 30 to 34 years, with 100.0% or 42 individuals in the labor force. Within the labor force, the 35 to 44 years age range has the highest percentage of unemployed individuals, with 12.4% or 25 of them being unemployed.
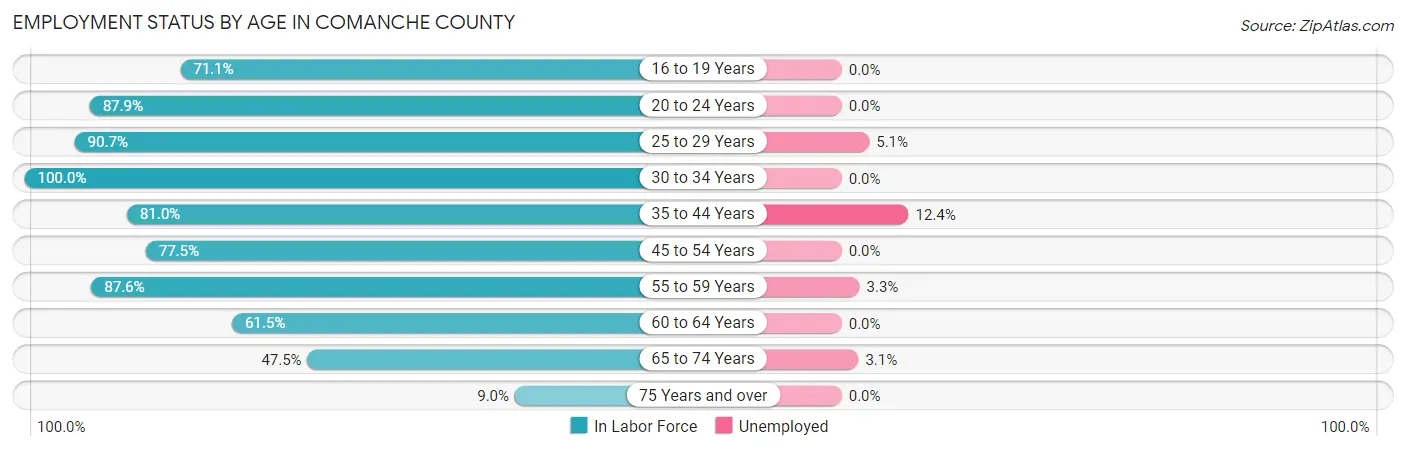
| Age Bracket | In Labor Force | Unemployed |
| 16 to 19 Years | 69 (71.1%) | 0 (0.0%) |
| 20 to 24 Years | 51 (87.9%) | 0 (0.0%) |
| 25 to 29 Years | 39 (90.7%) | 2 (5.1%) |
| 30 to 34 Years | 42 (100.0%) | 0 (0.0%) |
| 35 to 44 Years | 201 (81.0%) | 25 (12.4%) |
| 45 to 54 Years | 134 (77.5%) | 0 (0.0%) |
| 55 to 59 Years | 120 (87.6%) | 4 (3.3%) |
| 60 to 64 Years | 107 (61.5%) | 0 (0.0%) |
| 65 to 74 Years | 131 (47.5%) | 4 (3.1%) |
| 75 Years and over | 19 (9.0%) | 0 (0.0%) |
| Total | 912 (62.5%) | 35 (3.8%) |
Employment Status by Educational Attainment in Comanche County
According to labor force statistics for Comanche County, 78.7% of individuals (643) out of the total population between 25 and 64 years of age (817) are in the labor force, with 4.8% or 31 of them being unemployed. The group with the highest labor force participation rate are those with the educational attainment of bachelor's degree or higher, with 83.8% or 181 individuals in the labor force. Within the labor force, individuals with college / associate degree education have the highest percentage of unemployment, with 7.1% or 18 of them being unemployed.
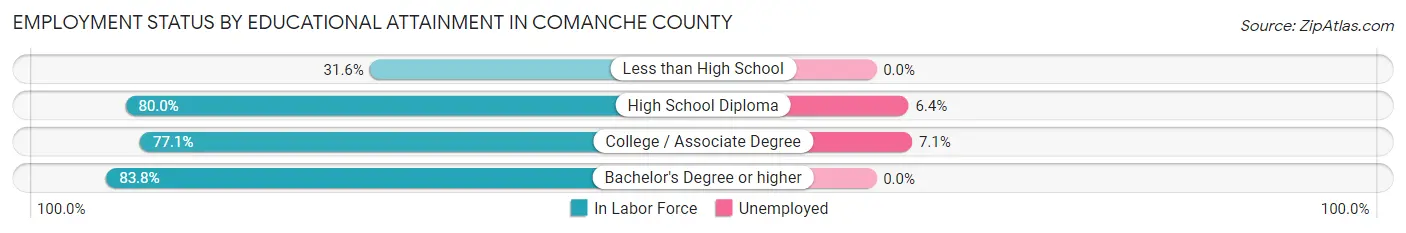
| Educational Attainment | In Labor Force | Unemployed |
| Less than High School | 6 (31.6%) | 0 (0.0%) |
| High School Diploma | 204 (80.0%) | 16 (6.4%) |
| College / Associate Degree | 252 (77.1%) | 23 (7.1%) |
| Bachelor's Degree or higher | 181 (83.8%) | 0 (0.0%) |
| Total | 643 (78.7%) | 39 (4.8%) |
Employment Occupations by Sex in Comanche County
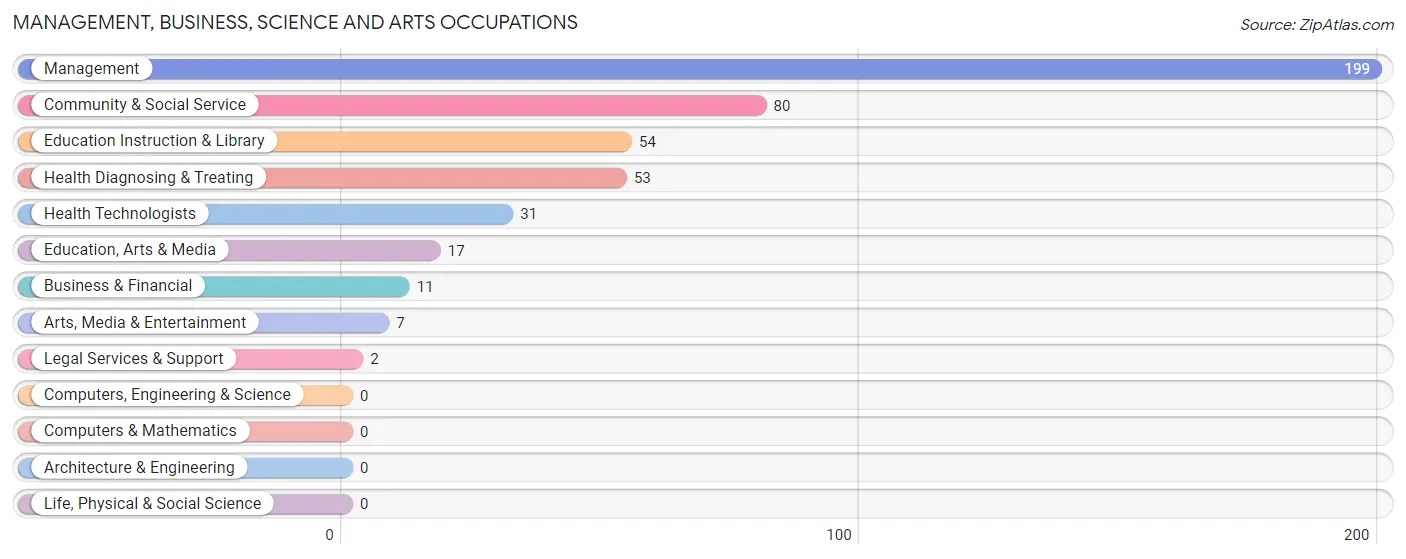
Management, Business, Science and Arts Occupations
The most common Management, Business, Science and Arts occupations in Comanche County are Management (199 | 22.7%), Community & Social Service (80 | 9.1%), Education Instruction & Library (54 | 6.1%), Health Diagnosing & Treating (53 | 6.0%), and Health Technologists (31 | 3.5%).
Management, Business, Science and Arts Occupations by Sex
Within the Management, Business, Science and Arts occupations in Comanche County, the most male-oriented occupations are Legal Services & Support (100.0%), Management (66.3%), and Education, Arts & Media (47.1%), while the most female-oriented occupations are Arts, Media & Entertainment (100.0%), Health Technologists (96.8%), and Health Diagnosing & Treating (88.7%).
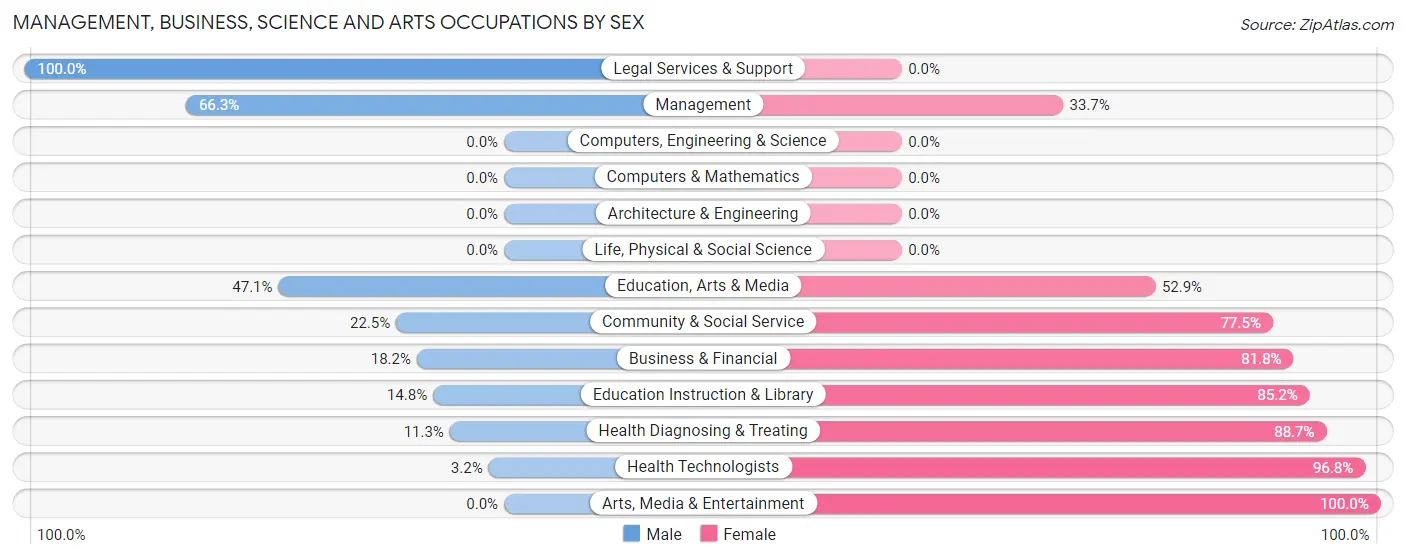
| Occupation | Male | Female |
| Management | 132 (66.3%) | 67 (33.7%) |
| Business & Financial | 2 (18.2%) | 9 (81.8%) |
| Computers, Engineering & Science | 0 (0.0%) | 0 (0.0%) |
| Computers & Mathematics | 0 (0.0%) | 0 (0.0%) |
| Architecture & Engineering | 0 (0.0%) | 0 (0.0%) |
| Life, Physical & Social Science | 0 (0.0%) | 0 (0.0%) |
| Community & Social Service | 18 (22.5%) | 62 (77.5%) |
| Education, Arts & Media | 8 (47.1%) | 9 (52.9%) |
| Legal Services & Support | 2 (100.0%) | 0 (0.0%) |
| Education Instruction & Library | 8 (14.8%) | 46 (85.2%) |
| Arts, Media & Entertainment | 0 (0.0%) | 7 (100.0%) |
| Health Diagnosing & Treating | 6 (11.3%) | 47 (88.7%) |
| Health Technologists | 1 (3.2%) | 30 (96.8%) |
| Total (Category) | 158 (46.1%) | 185 (53.9%) |
| Total (Overall) | 478 (54.4%) | 400 (45.6%) |
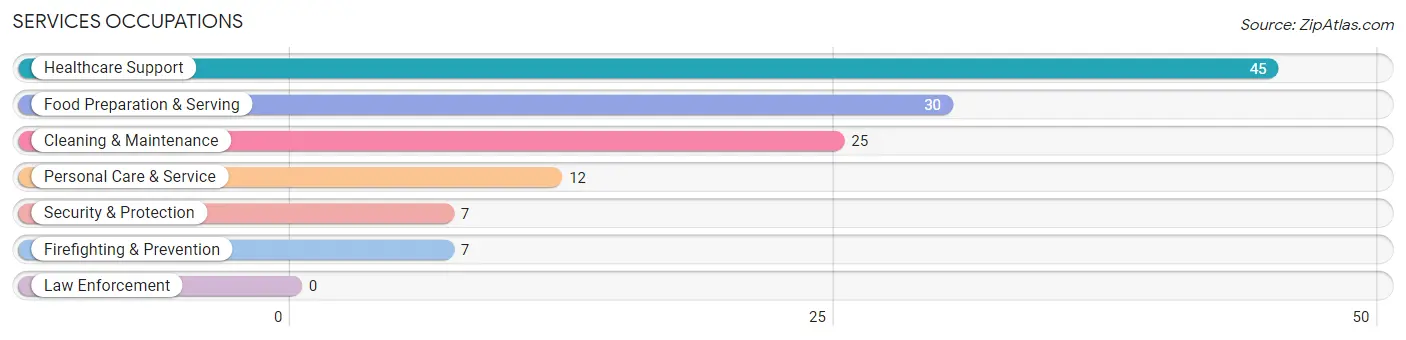
Services Occupations
The most common Services occupations in Comanche County are Healthcare Support (45 | 5.1%), Food Preparation & Serving (30 | 3.4%), Cleaning & Maintenance (25 | 2.9%), Personal Care & Service (12 | 1.4%), and Security & Protection (7 | 0.8%).
Services Occupations by Sex
Within the Services occupations in Comanche County, the most male-oriented occupations are Security & Protection (100.0%), Firefighting & Prevention (100.0%), and Cleaning & Maintenance (36.0%), while the most female-oriented occupations are Food Preparation & Serving (83.3%), Healthcare Support (80.0%), and Personal Care & Service (75.0%).
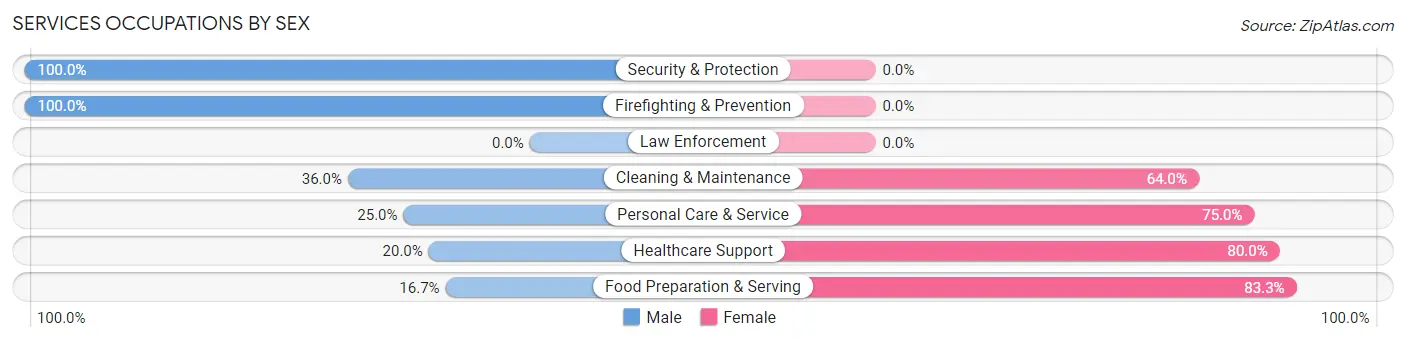
| Occupation | Male | Female |
| Healthcare Support | 9 (20.0%) | 36 (80.0%) |
| Security & Protection | 7 (100.0%) | 0 (0.0%) |
| Firefighting & Prevention | 7 (100.0%) | 0 (0.0%) |
| Law Enforcement | 0 (0.0%) | 0 (0.0%) |
| Food Preparation & Serving | 5 (16.7%) | 25 (83.3%) |
| Cleaning & Maintenance | 9 (36.0%) | 16 (64.0%) |
| Personal Care & Service | 3 (25.0%) | 9 (75.0%) |
| Total (Category) | 33 (27.7%) | 86 (72.3%) |
| Total (Overall) | 478 (54.4%) | 400 (45.6%) |
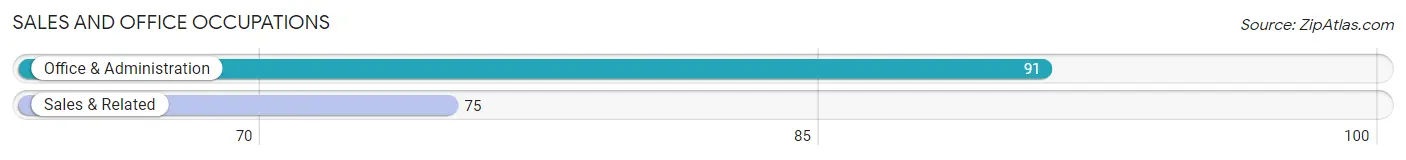
Sales and Office Occupations
The most common Sales and Office occupations in Comanche County are Office & Administration (91 | 10.4%), and Sales & Related (75 | 8.5%).
Sales and Office Occupations by Sex
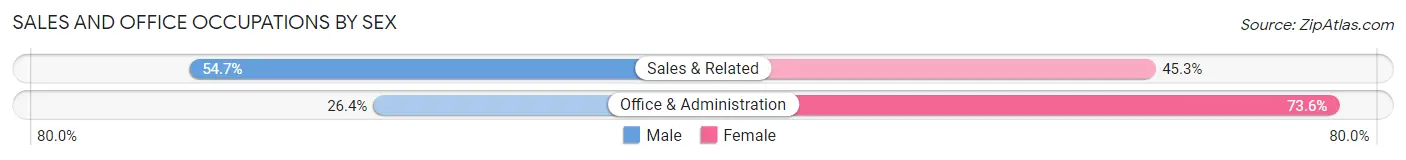
| Occupation | Male | Female |
| Sales & Related | 41 (54.7%) | 34 (45.3%) |
| Office & Administration | 24 (26.4%) | 67 (73.6%) |
| Total (Category) | 65 (39.2%) | 101 (60.8%) |
| Total (Overall) | 478 (54.4%) | 400 (45.6%) |
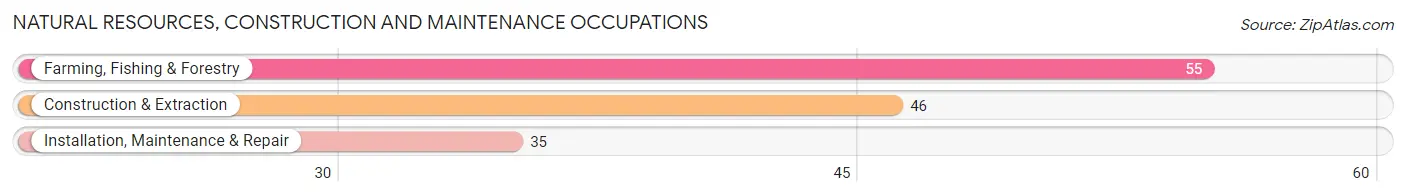
Natural Resources, Construction and Maintenance Occupations
The most common Natural Resources, Construction and Maintenance occupations in Comanche County are Farming, Fishing & Forestry (55 | 6.3%), Construction & Extraction (46 | 5.2%), and Installation, Maintenance & Repair (35 | 4.0%).
Natural Resources, Construction and Maintenance Occupations by Sex
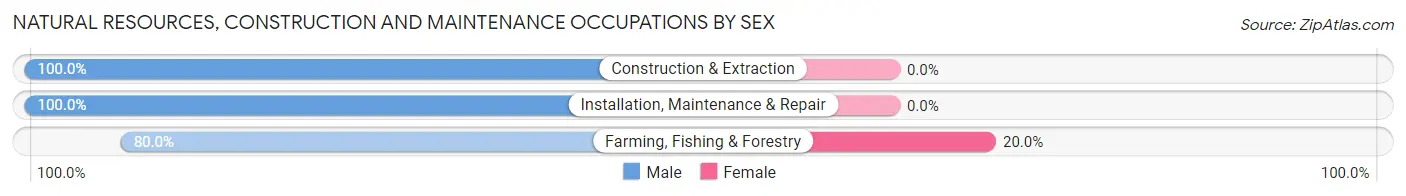
| Occupation | Male | Female |
| Farming, Fishing & Forestry | 44 (80.0%) | 11 (20.0%) |
| Construction & Extraction | 46 (100.0%) | 0 (0.0%) |
| Installation, Maintenance & Repair | 35 (100.0%) | 0 (0.0%) |
| Total (Category) | 125 (91.9%) | 11 (8.1%) |
| Total (Overall) | 478 (54.4%) | 400 (45.6%) |
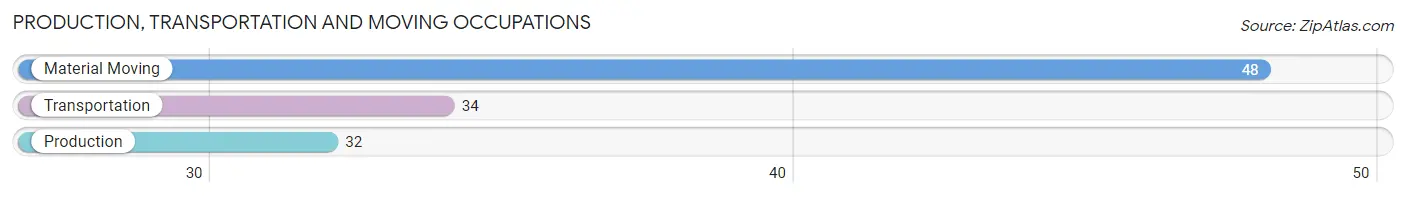
Production, Transportation and Moving Occupations
The most common Production, Transportation and Moving occupations in Comanche County are Material Moving (48 | 5.5%), Transportation (34 | 3.9%), and Production (32 | 3.6%).
Production, Transportation and Moving Occupations by Sex
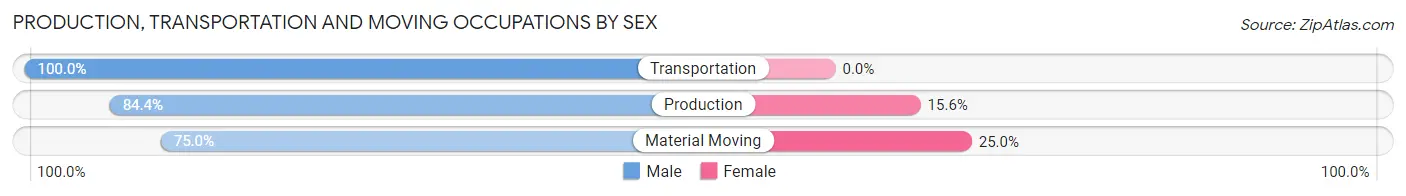
| Occupation | Male | Female |
| Production | 27 (84.4%) | 5 (15.6%) |
| Transportation | 34 (100.0%) | 0 (0.0%) |
| Material Moving | 36 (75.0%) | 12 (25.0%) |
| Total (Category) | 97 (85.1%) | 17 (14.9%) |
| Total (Overall) | 478 (54.4%) | 400 (45.6%) |
Employment Industries by Sex in Comanche County
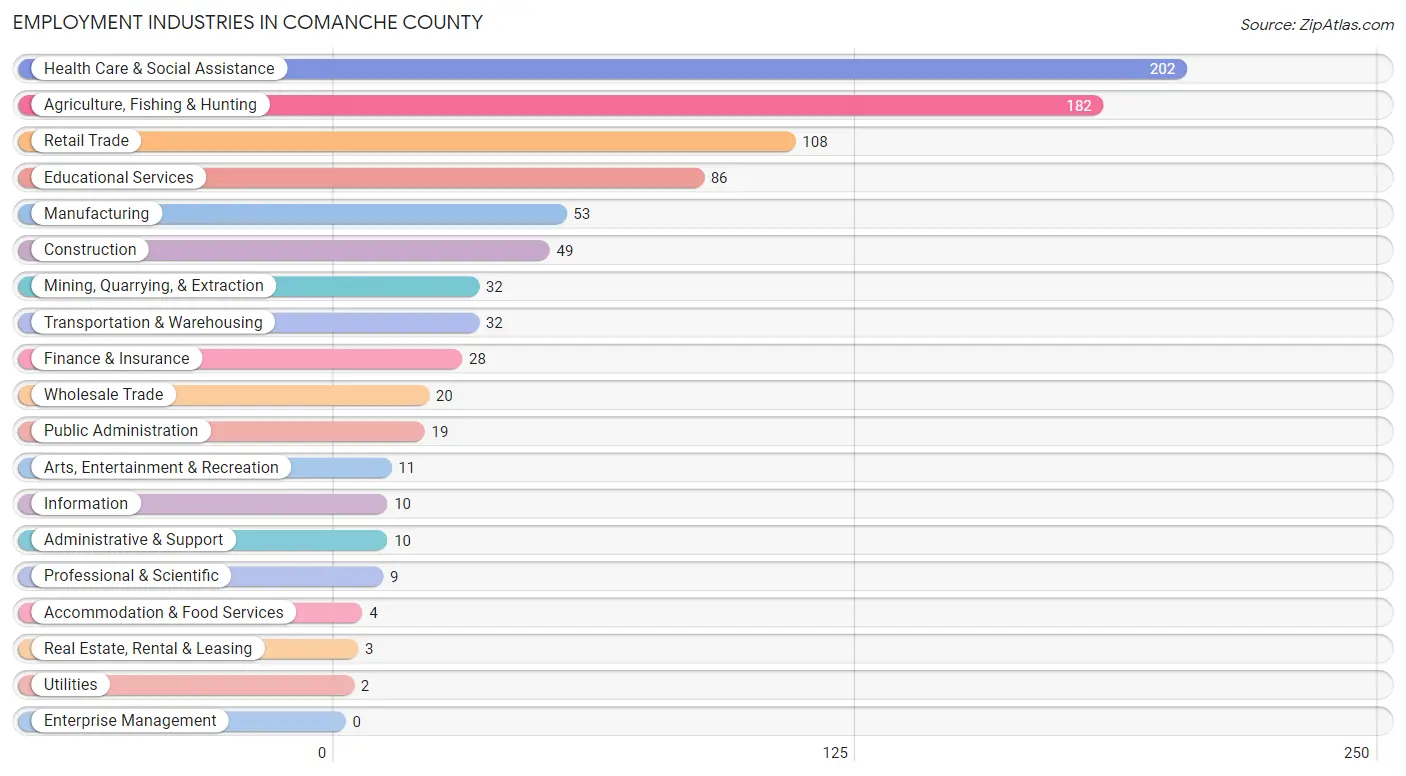
Employment Industries in Comanche County
The major employment industries in Comanche County include Health Care & Social Assistance (202 | 23.0%), Agriculture, Fishing & Hunting (182 | 20.7%), Retail Trade (108 | 12.3%), Educational Services (86 | 9.8%), and Manufacturing (53 | 6.0%).
Employment Industries by Sex in Comanche County
The Comanche County industries that see more men than women are Mining, Quarrying, & Extraction (100.0%), Wholesale Trade (100.0%), and Transportation & Warehousing (100.0%), whereas the industries that tend to have a higher number of women are Finance & Insurance (100.0%), Health Care & Social Assistance (89.1%), and Professional & Scientific (77.8%).
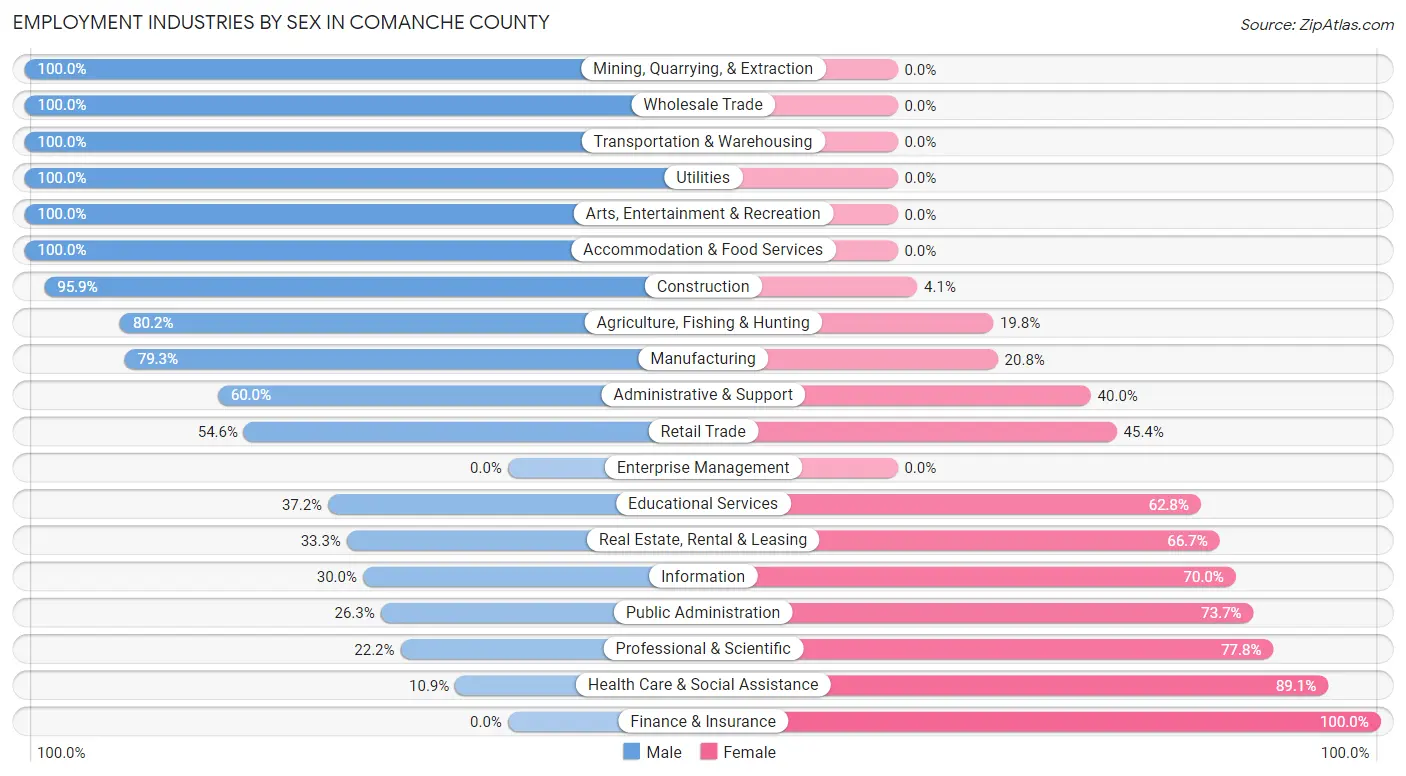
| Industry | Male | Female |
| Agriculture, Fishing & Hunting | 146 (80.2%) | 36 (19.8%) |
| Mining, Quarrying, & Extraction | 32 (100.0%) | 0 (0.0%) |
| Construction | 47 (95.9%) | 2 (4.1%) |
| Manufacturing | 42 (79.2%) | 11 (20.7%) |
| Wholesale Trade | 20 (100.0%) | 0 (0.0%) |
| Retail Trade | 59 (54.6%) | 49 (45.4%) |
| Transportation & Warehousing | 32 (100.0%) | 0 (0.0%) |
| Utilities | 2 (100.0%) | 0 (0.0%) |
| Information | 3 (30.0%) | 7 (70.0%) |
| Finance & Insurance | 0 (0.0%) | 28 (100.0%) |
| Real Estate, Rental & Leasing | 1 (33.3%) | 2 (66.7%) |
| Professional & Scientific | 2 (22.2%) | 7 (77.8%) |
| Enterprise Management | 0 (0.0%) | 0 (0.0%) |
| Administrative & Support | 6 (60.0%) | 4 (40.0%) |
| Educational Services | 32 (37.2%) | 54 (62.8%) |
| Health Care & Social Assistance | 22 (10.9%) | 180 (89.1%) |
| Arts, Entertainment & Recreation | 11 (100.0%) | 0 (0.0%) |
| Accommodation & Food Services | 4 (100.0%) | 0 (0.0%) |
| Public Administration | 5 (26.3%) | 14 (73.7%) |
| Total | 478 (54.4%) | 400 (45.6%) |
Education in Comanche County
School Enrollment in Comanche County
The most common levels of schooling among the 377 students in Comanche County are high school (129 | 34.2%), elementary school (117 | 31.0%), and middle school (91 | 24.1%).
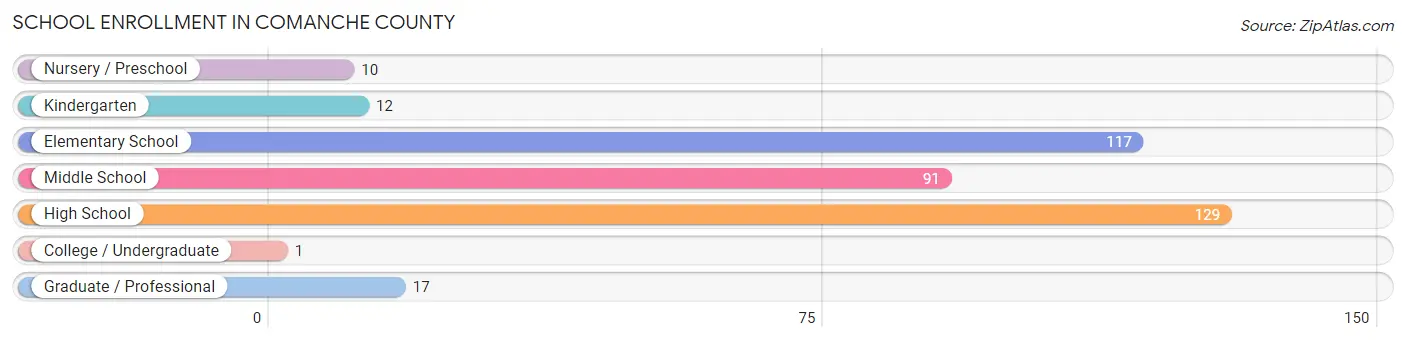
| School Level | # Students | % Students |
| Nursery / Preschool | 10 | 2.6% |
| Kindergarten | 12 | 3.2% |
| Elementary School | 117 | 31.0% |
| Middle School | 91 | 24.1% |
| High School | 129 | 34.2% |
| College / Undergraduate | 1 | 0.3% |
| Graduate / Professional | 17 | 4.5% |
| Total | 377 | 100.0% |
School Enrollment by Age by Funding Source in Comanche County
Out of a total of 377 students who are enrolled in schools in Comanche County, 29 (7.7%) attend a private institution, while the remaining 348 (92.3%) are enrolled in public schools. The age group of 35 years and over has the highest likelihood of being enrolled in private schools, with 4 (25.0% in the age bracket) enrolled. Conversely, the age group of 3 to 4 year olds has the lowest likelihood of being enrolled in a private school, with 7 (100.0% in the age bracket) attending a public institution.
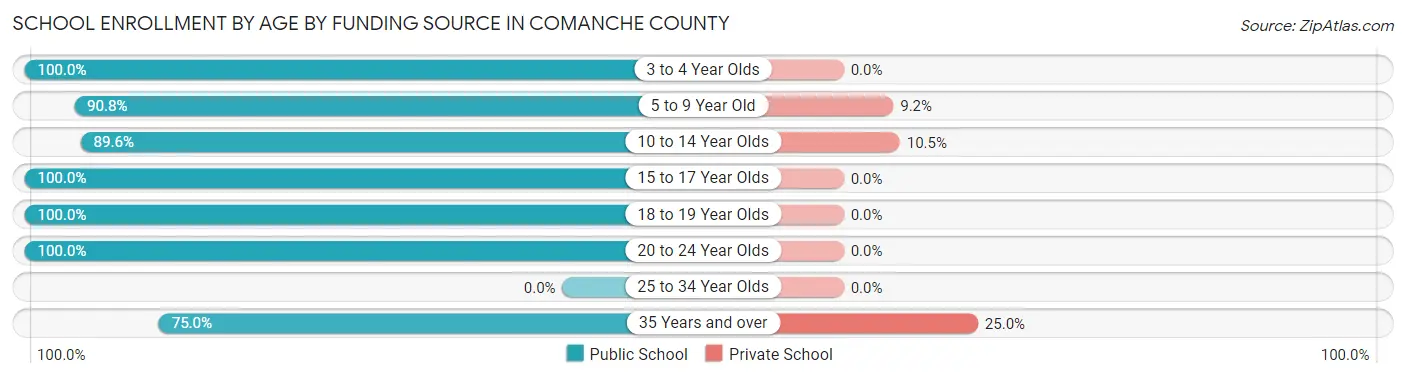
| Age Bracket | Public School | Private School |
| 3 to 4 Year Olds | 7 (100.0%) | 0 (0.0%) |
| 5 to 9 Year Old | 108 (90.8%) | 11 (9.2%) |
| 10 to 14 Year Olds | 120 (89.5%) | 14 (10.4%) |
| 15 to 17 Year Olds | 76 (100.0%) | 0 (0.0%) |
| 18 to 19 Year Olds | 21 (100.0%) | 0 (0.0%) |
| 20 to 24 Year Olds | 4 (100.0%) | 0 (0.0%) |
| 25 to 34 Year Olds | 0 (0.0%) | 0 (0.0%) |
| 35 Years and over | 12 (75.0%) | 4 (25.0%) |
| Total | 348 (92.3%) | 29 (7.7%) |
Educational Attainment by Field of Study in Comanche County
Education (87 | 31.0%), business (62 | 22.1%), bio, nature & agricultural (36 | 12.8%), arts & humanities (27 | 9.6%), and communications (20 | 7.1%) are the most common fields of study among 281 individuals in Comanche County who have obtained a bachelor's degree or higher.
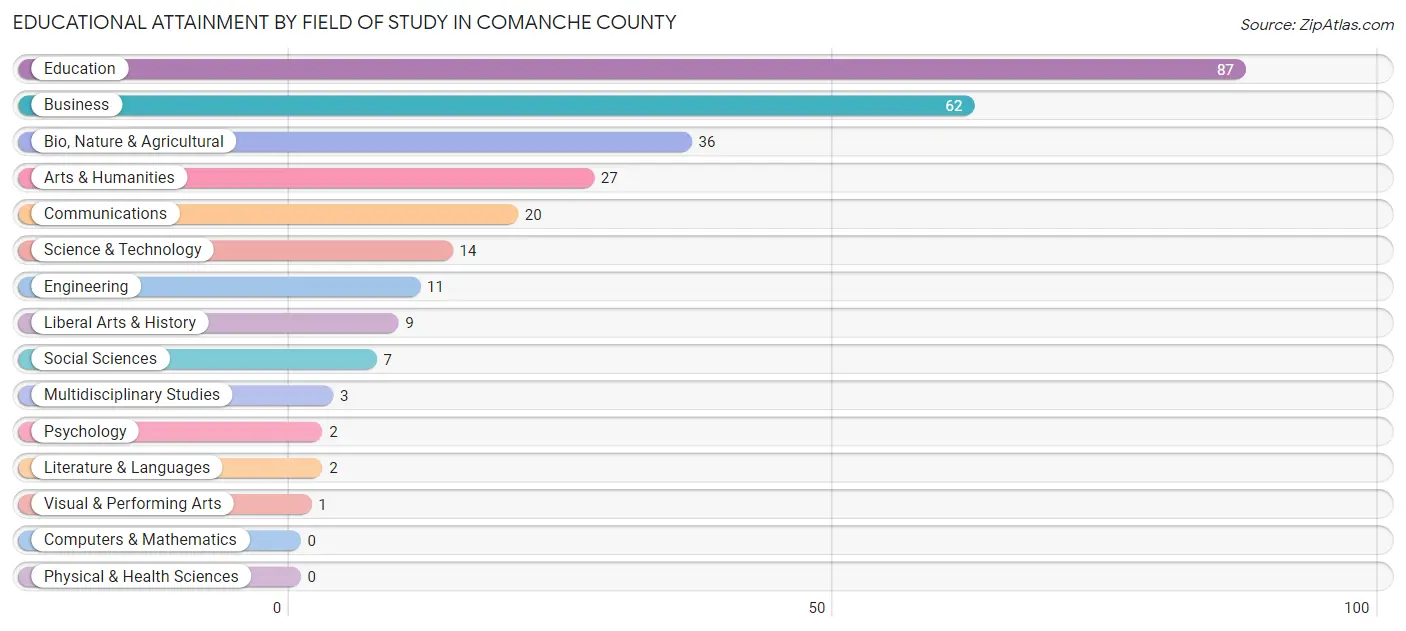
| Field of Study | # Graduates | % Graduates |
| Computers & Mathematics | 0 | 0.0% |
| Bio, Nature & Agricultural | 36 | 12.8% |
| Physical & Health Sciences | 0 | 0.0% |
| Psychology | 2 | 0.7% |
| Social Sciences | 7 | 2.5% |
| Engineering | 11 | 3.9% |
| Multidisciplinary Studies | 3 | 1.1% |
| Science & Technology | 14 | 5.0% |
| Business | 62 | 22.1% |
| Education | 87 | 31.0% |
| Literature & Languages | 2 | 0.7% |
| Liberal Arts & History | 9 | 3.2% |
| Visual & Performing Arts | 1 | 0.4% |
| Communications | 20 | 7.1% |
| Arts & Humanities | 27 | 9.6% |
| Total | 281 | 100.0% |
Transportation & Commute in Comanche County
Vehicle Availability by Sex in Comanche County
The most prevalent vehicle ownership categories in Comanche County are males with 2 vehicles (194, accounting for 40.7%) and females with 2 vehicles (94, making up 51.3%).
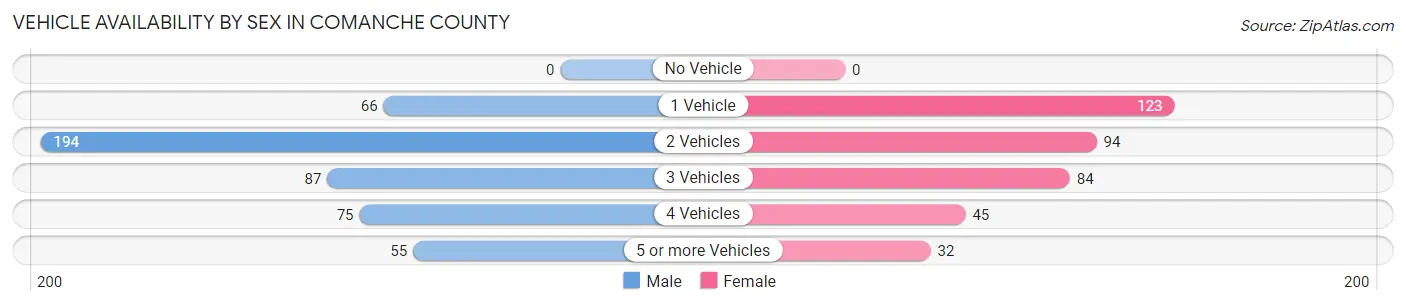
| Vehicles Available | Male | Female |
| No Vehicle | 0 (0.0%) | 0 (0.0%) |
| 1 Vehicle | 66 (13.8%) | 123 (32.5%) |
| 2 Vehicles | 194 (40.7%) | 94 (24.9%) |
| 3 Vehicles | 87 (18.2%) | 84 (22.2%) |
| 4 Vehicles | 75 (15.7%) | 45 (11.9%) |
| 5 or more Vehicles | 55 (11.5%) | 32 (8.5%) |
| Total | 477 (100.0%) | 378 (100.0%) |
Commute Time in Comanche County
The most frequently occuring commute durations in Comanche County are less than 5 minutes (224 commuters, 28.3%), 5 to 9 minutes (191 commuters, 24.1%), and 15 to 19 minutes (91 commuters, 11.5%).
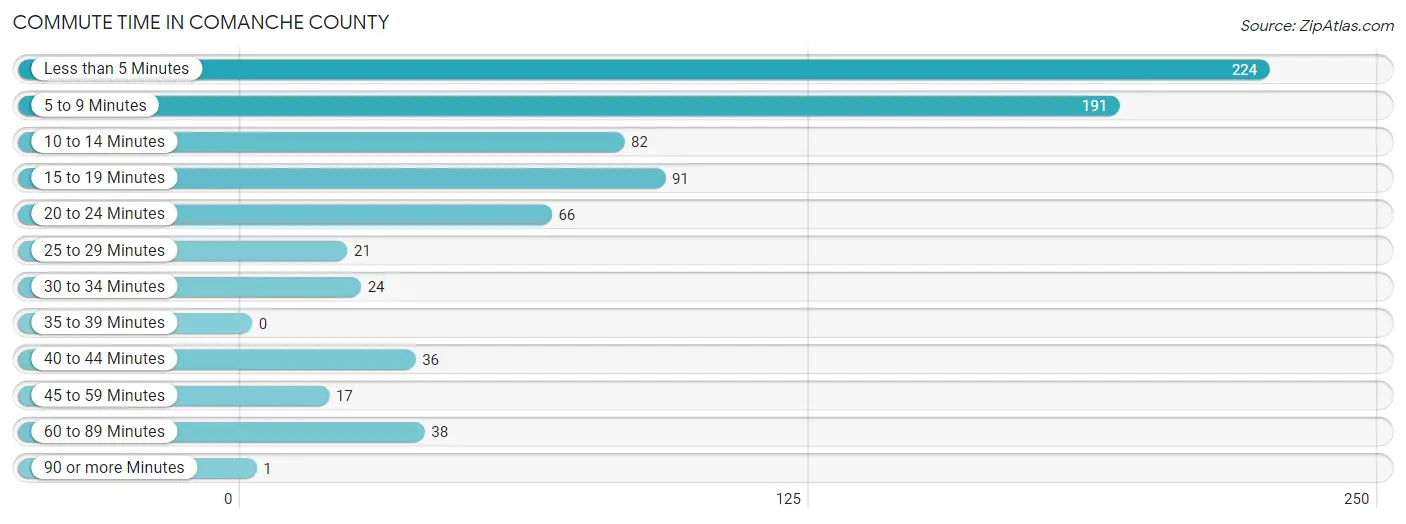
| Commute Time | # Commuters | % Commuters |
| Less than 5 Minutes | 224 | 28.3% |
| 5 to 9 Minutes | 191 | 24.1% |
| 10 to 14 Minutes | 82 | 10.4% |
| 15 to 19 Minutes | 91 | 11.5% |
| 20 to 24 Minutes | 66 | 8.3% |
| 25 to 29 Minutes | 21 | 2.6% |
| 30 to 34 Minutes | 24 | 3.0% |
| 35 to 39 Minutes | 0 | 0.0% |
| 40 to 44 Minutes | 36 | 4.5% |
| 45 to 59 Minutes | 17 | 2.1% |
| 60 to 89 Minutes | 38 | 4.8% |
| 90 or more Minutes | 1 | 0.1% |
Commute Time by Sex in Comanche County
The most common commute times in Comanche County are less than 5 minutes (116 commuters, 26.9%) for males and less than 5 minutes (108 commuters, 30.1%) for females.
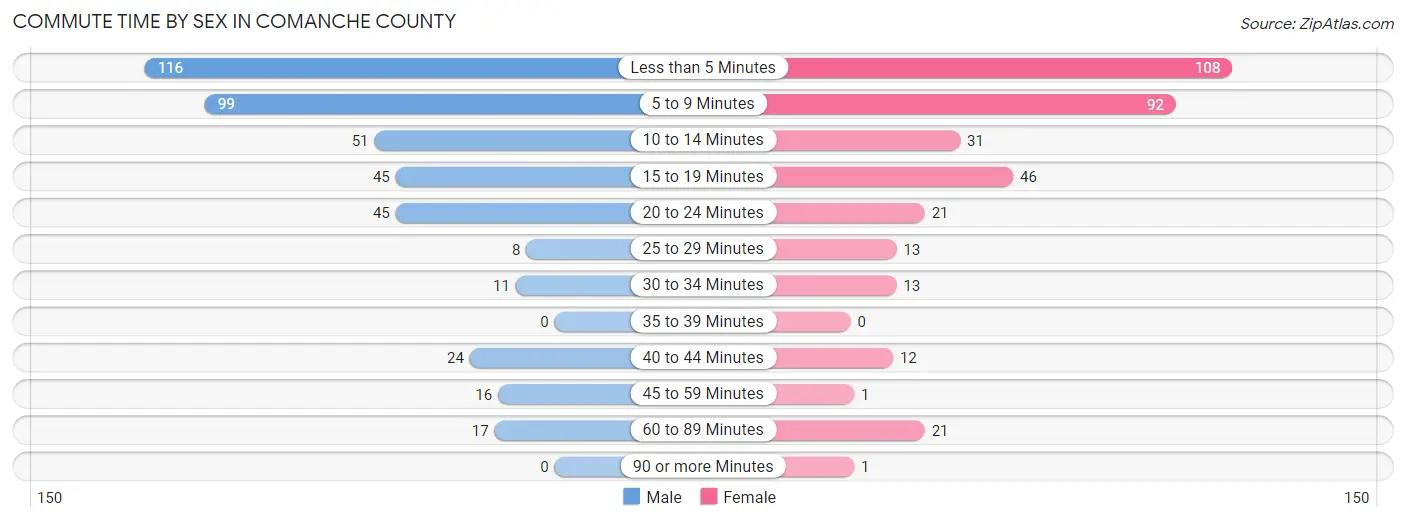
| Commute Time | Male | Female |
| Less than 5 Minutes | 116 (26.9%) | 108 (30.1%) |
| 5 to 9 Minutes | 99 (22.9%) | 92 (25.6%) |
| 10 to 14 Minutes | 51 (11.8%) | 31 (8.6%) |
| 15 to 19 Minutes | 45 (10.4%) | 46 (12.8%) |
| 20 to 24 Minutes | 45 (10.4%) | 21 (5.9%) |
| 25 to 29 Minutes | 8 (1.8%) | 13 (3.6%) |
| 30 to 34 Minutes | 11 (2.5%) | 13 (3.6%) |
| 35 to 39 Minutes | 0 (0.0%) | 0 (0.0%) |
| 40 to 44 Minutes | 24 (5.6%) | 12 (3.3%) |
| 45 to 59 Minutes | 16 (3.7%) | 1 (0.3%) |
| 60 to 89 Minutes | 17 (3.9%) | 21 (5.9%) |
| 90 or more Minutes | 0 (0.0%) | 1 (0.3%) |
Time of Departure to Work by Sex in Comanche County
The most frequent times of departure to work in Comanche County are 7:00 AM to 7:29 AM (113, 26.2%) for males and 8:00 AM to 8:29 AM (87, 24.2%) for females.
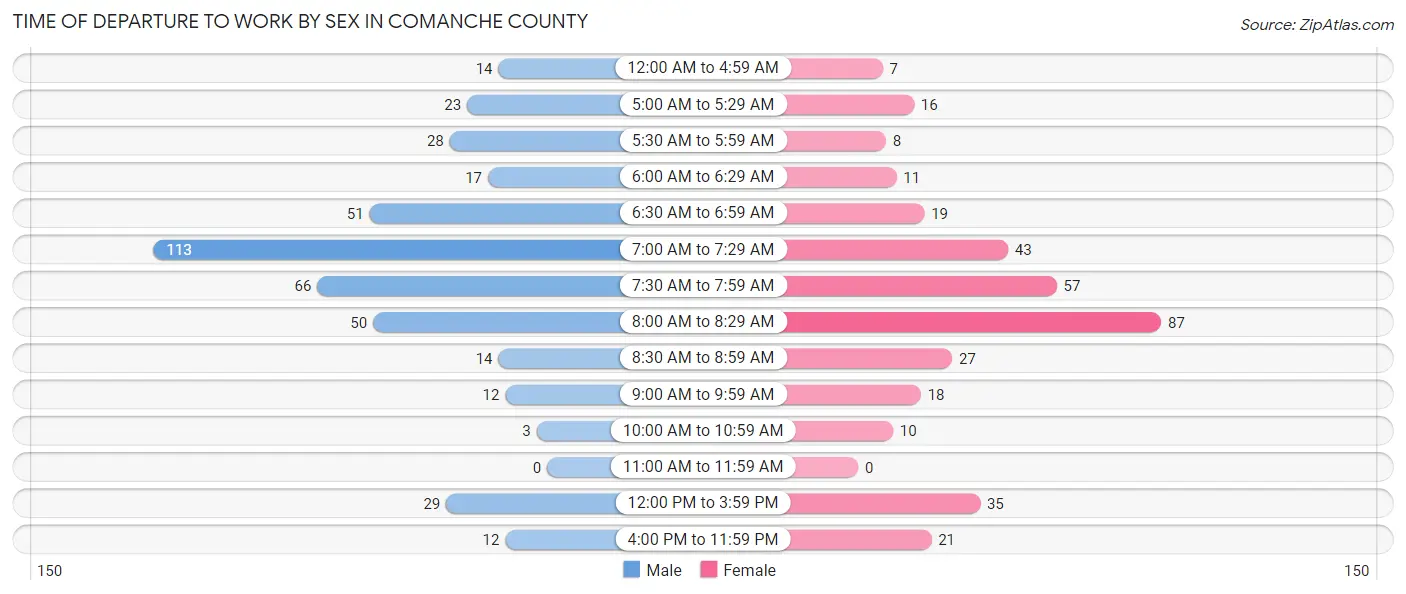
| Time of Departure | Male | Female |
| 12:00 AM to 4:59 AM | 14 (3.2%) | 7 (1.9%) |
| 5:00 AM to 5:29 AM | 23 (5.3%) | 16 (4.5%) |
| 5:30 AM to 5:59 AM | 28 (6.5%) | 8 (2.2%) |
| 6:00 AM to 6:29 AM | 17 (3.9%) | 11 (3.1%) |
| 6:30 AM to 6:59 AM | 51 (11.8%) | 19 (5.3%) |
| 7:00 AM to 7:29 AM | 113 (26.2%) | 43 (12.0%) |
| 7:30 AM to 7:59 AM | 66 (15.3%) | 57 (15.9%) |
| 8:00 AM to 8:29 AM | 50 (11.6%) | 87 (24.2%) |
| 8:30 AM to 8:59 AM | 14 (3.2%) | 27 (7.5%) |
| 9:00 AM to 9:59 AM | 12 (2.8%) | 18 (5.0%) |
| 10:00 AM to 10:59 AM | 3 (0.7%) | 10 (2.8%) |
| 11:00 AM to 11:59 AM | 0 (0.0%) | 0 (0.0%) |
| 12:00 PM to 3:59 PM | 29 (6.7%) | 35 (9.8%) |
| 4:00 PM to 11:59 PM | 12 (2.8%) | 21 (5.9%) |
| Total | 432 (100.0%) | 359 (100.0%) |
Housing Occupancy in Comanche County
Occupancy by Ownership in Comanche County
Of the total 827 dwellings in Comanche County, owner-occupied units account for 609 (73.6%), while renter-occupied units make up 218 (26.4%).
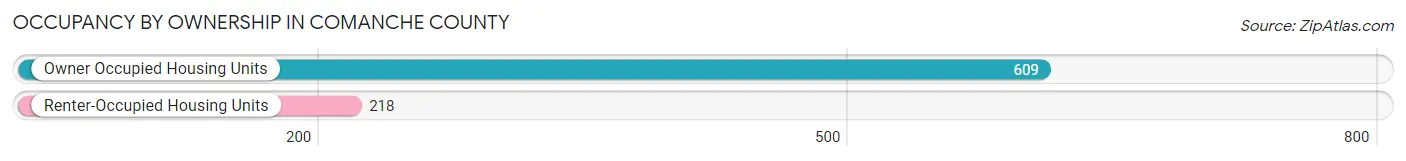
| Occupancy | # Housing Units | % Housing Units |
| Owner Occupied Housing Units | 609 | 73.6% |
| Renter-Occupied Housing Units | 218 | 26.4% |
| Total Occupied Housing Units | 827 | 100.0% |
Occupancy by Household Size in Comanche County
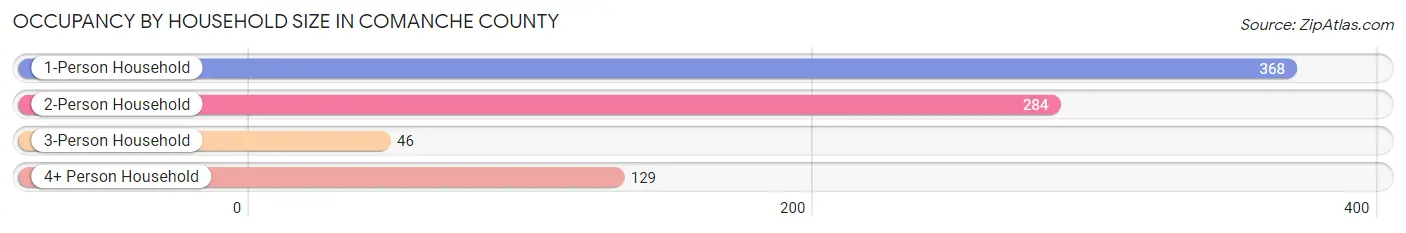
| Household Size | # Housing Units | % Housing Units |
| 1-Person Household | 368 | 44.5% |
| 2-Person Household | 284 | 34.3% |
| 3-Person Household | 46 | 5.6% |
| 4+ Person Household | 129 | 15.6% |
| Total Housing Units | 827 | 100.0% |
Occupancy by Ownership by Household Size in Comanche County
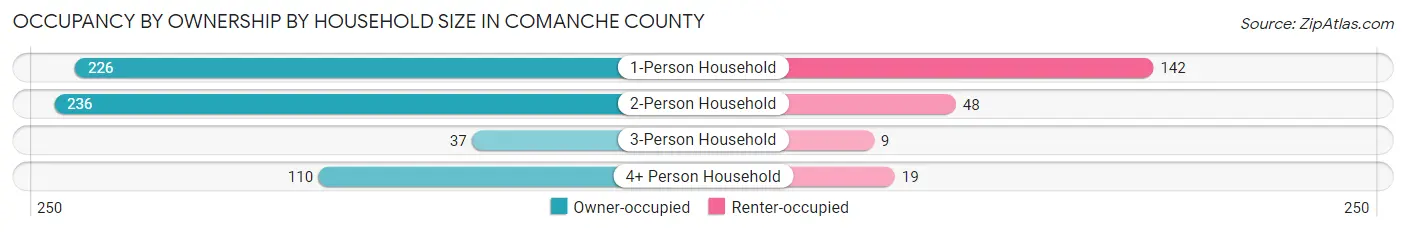
| Household Size | Owner-occupied | Renter-occupied |
| 1-Person Household | 226 (61.4%) | 142 (38.6%) |
| 2-Person Household | 236 (83.1%) | 48 (16.9%) |
| 3-Person Household | 37 (80.4%) | 9 (19.6%) |
| 4+ Person Household | 110 (85.3%) | 19 (14.7%) |
| Total Housing Units | 609 (73.6%) | 218 (26.4%) |
Occupancy by Educational Attainment in Comanche County
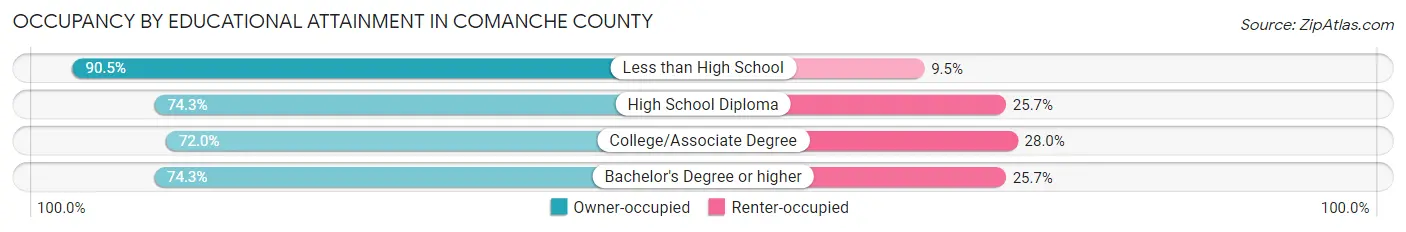
| Household Size | Owner-occupied | Renter-occupied |
| Less than High School | 19 (90.5%) | 2 (9.5%) |
| High School Diploma | 182 (74.3%) | 63 (25.7%) |
| College/Associate Degree | 272 (72.0%) | 106 (28.0%) |
| Bachelor's Degree or higher | 136 (74.3%) | 47 (25.7%) |
Occupancy by Age of Householder in Comanche County
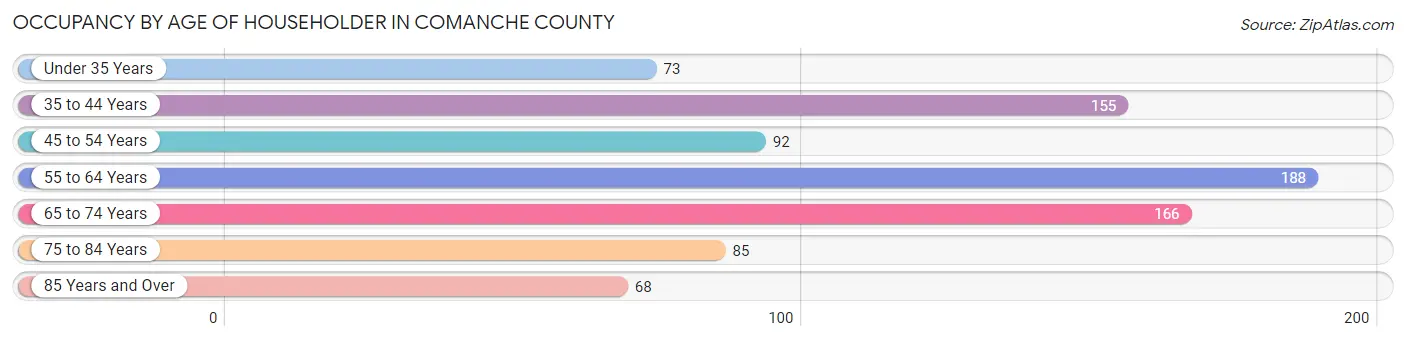
| Age Bracket | # Households | % Households |
| Under 35 Years | 73 | 8.8% |
| 35 to 44 Years | 155 | 18.7% |
| 45 to 54 Years | 92 | 11.1% |
| 55 to 64 Years | 188 | 22.7% |
| 65 to 74 Years | 166 | 20.1% |
| 75 to 84 Years | 85 | 10.3% |
| 85 Years and Over | 68 | 8.2% |
| Total | 827 | 100.0% |
Housing Finances in Comanche County
Median Income by Occupancy in Comanche County
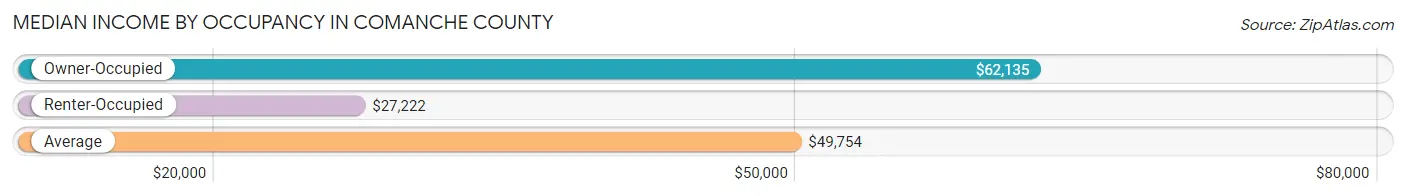
| Occupancy Type | # Households | Median Income |
| Owner-Occupied | 609 (73.6%) | $62,135 |
| Renter-Occupied | 218 (26.4%) | $27,222 |
| Average | 827 (100.0%) | $49,754 |
Occupancy by Householder Income Bracket in Comanche County
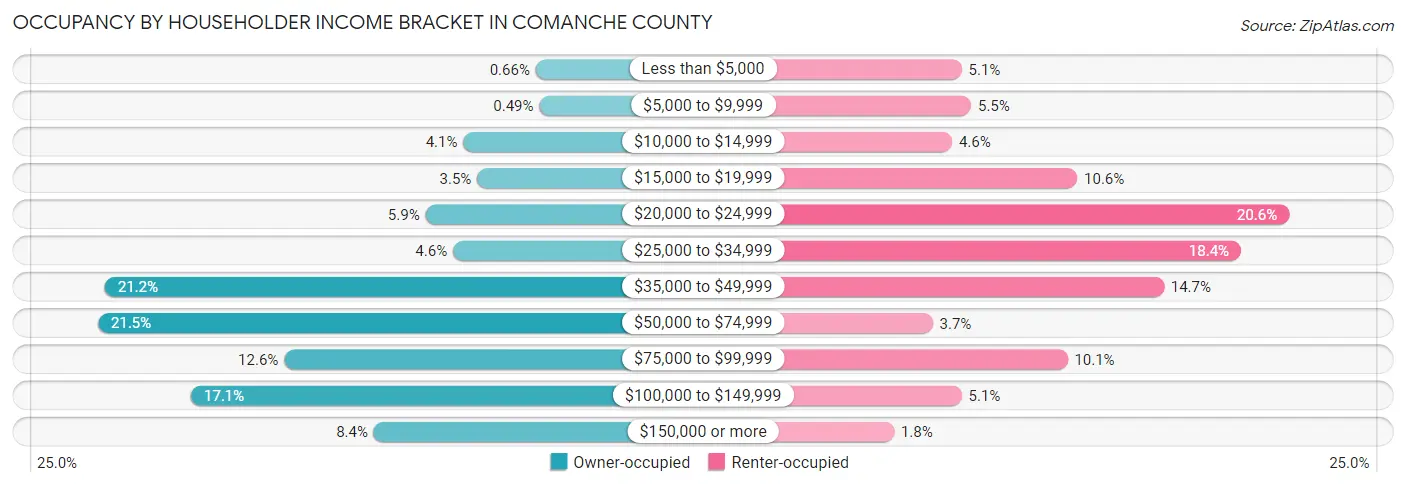
| Income Bracket | Owner-occupied | Renter-occupied |
| Less than $5,000 | 4 (0.7%) | 11 (5.1%) |
| $5,000 to $9,999 | 3 (0.5%) | 12 (5.5%) |
| $10,000 to $14,999 | 25 (4.1%) | 10 (4.6%) |
| $15,000 to $19,999 | 21 (3.5%) | 23 (10.5%) |
| $20,000 to $24,999 | 36 (5.9%) | 45 (20.6%) |
| $25,000 to $34,999 | 28 (4.6%) | 40 (18.3%) |
| $35,000 to $49,999 | 129 (21.2%) | 32 (14.7%) |
| $50,000 to $74,999 | 131 (21.5%) | 8 (3.7%) |
| $75,000 to $99,999 | 77 (12.6%) | 22 (10.1%) |
| $100,000 to $149,999 | 104 (17.1%) | 11 (5.1%) |
| $150,000 or more | 51 (8.4%) | 4 (1.8%) |
| Total | 609 (100.0%) | 218 (100.0%) |
Monthly Housing Cost Tiers in Comanche County
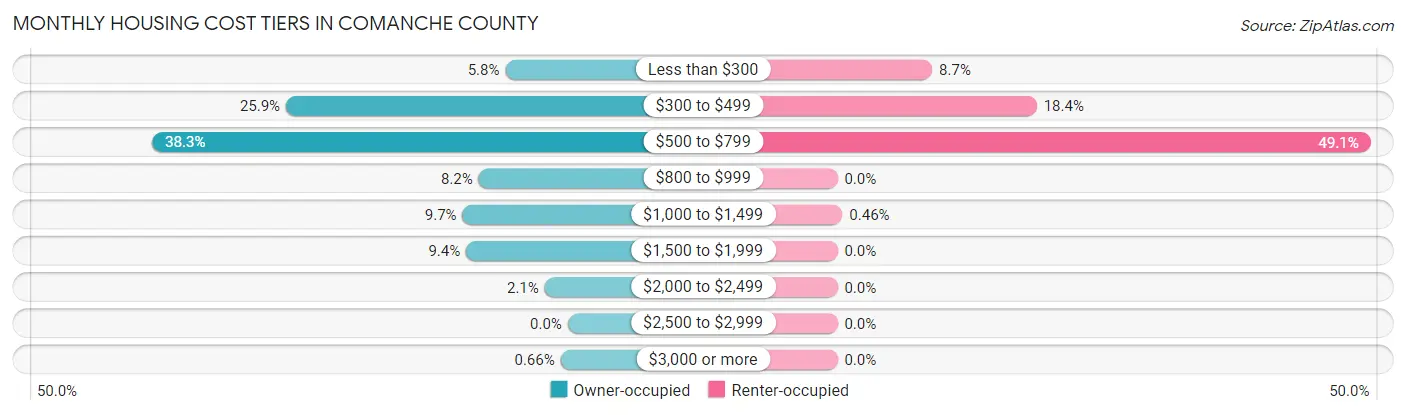
| Monthly Cost | Owner-occupied | Renter-occupied |
| Less than $300 | 35 (5.8%) | 19 (8.7%) |
| $300 to $499 | 158 (25.9%) | 40 (18.3%) |
| $500 to $799 | 233 (38.3%) | 107 (49.1%) |
| $800 to $999 | 50 (8.2%) | 0 (0.0%) |
| $1,000 to $1,499 | 59 (9.7%) | 1 (0.5%) |
| $1,500 to $1,999 | 57 (9.4%) | 0 (0.0%) |
| $2,000 to $2,499 | 13 (2.1%) | 0 (0.0%) |
| $2,500 to $2,999 | 0 (0.0%) | 0 (0.0%) |
| $3,000 or more | 4 (0.7%) | 0 (0.0%) |
| Total | 609 (100.0%) | 218 (100.0%) |
Physical Housing Characteristics in Comanche County
Housing Structures in Comanche County
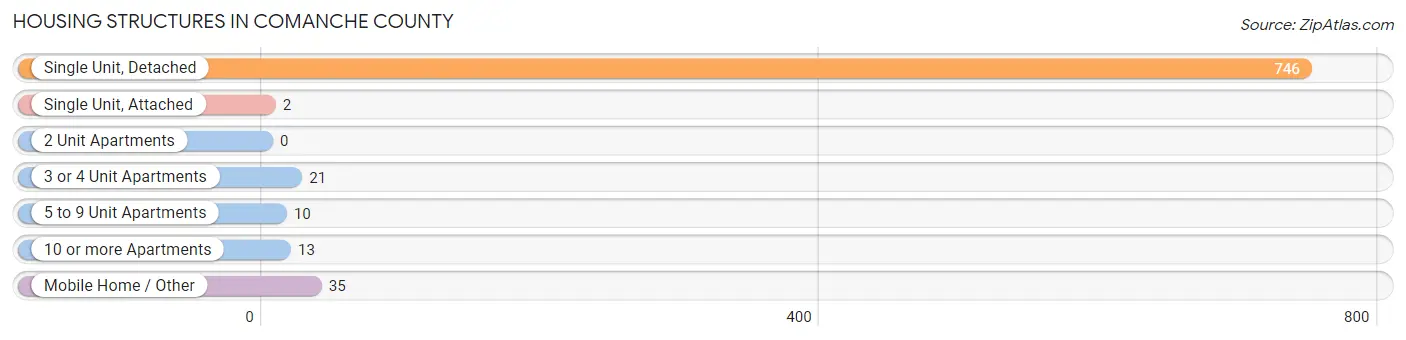
| Structure Type | # Housing Units | % Housing Units |
| Single Unit, Detached | 746 | 90.2% |
| Single Unit, Attached | 2 | 0.2% |
| 2 Unit Apartments | 0 | 0.0% |
| 3 or 4 Unit Apartments | 21 | 2.5% |
| 5 to 9 Unit Apartments | 10 | 1.2% |
| 10 or more Apartments | 13 | 1.6% |
| Mobile Home / Other | 35 | 4.2% |
| Total | 827 | 100.0% |
Housing Structures by Occupancy in Comanche County
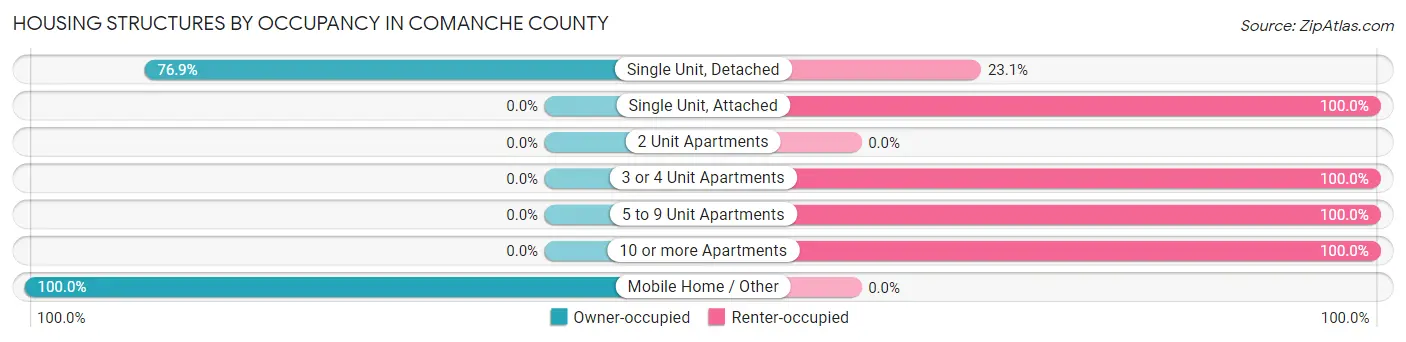
| Structure Type | Owner-occupied | Renter-occupied |
| Single Unit, Detached | 574 (76.9%) | 172 (23.1%) |
| Single Unit, Attached | 0 (0.0%) | 2 (100.0%) |
| 2 Unit Apartments | 0 (0.0%) | 0 (0.0%) |
| 3 or 4 Unit Apartments | 0 (0.0%) | 21 (100.0%) |
| 5 to 9 Unit Apartments | 0 (0.0%) | 10 (100.0%) |
| 10 or more Apartments | 0 (0.0%) | 13 (100.0%) |
| Mobile Home / Other | 35 (100.0%) | 0 (0.0%) |
| Total | 609 (73.6%) | 218 (26.4%) |
Housing Structures by Number of Rooms in Comanche County
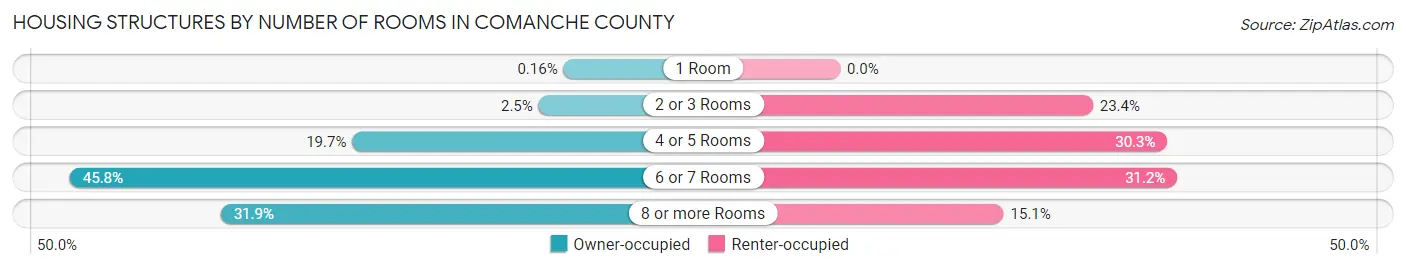
| Number of Rooms | Owner-occupied | Renter-occupied |
| 1 Room | 1 (0.2%) | 0 (0.0%) |
| 2 or 3 Rooms | 15 (2.5%) | 51 (23.4%) |
| 4 or 5 Rooms | 120 (19.7%) | 66 (30.3%) |
| 6 or 7 Rooms | 279 (45.8%) | 68 (31.2%) |
| 8 or more Rooms | 194 (31.9%) | 33 (15.1%) |
| Total | 609 (100.0%) | 218 (100.0%) |
Housing Structure by Heating Type in Comanche County
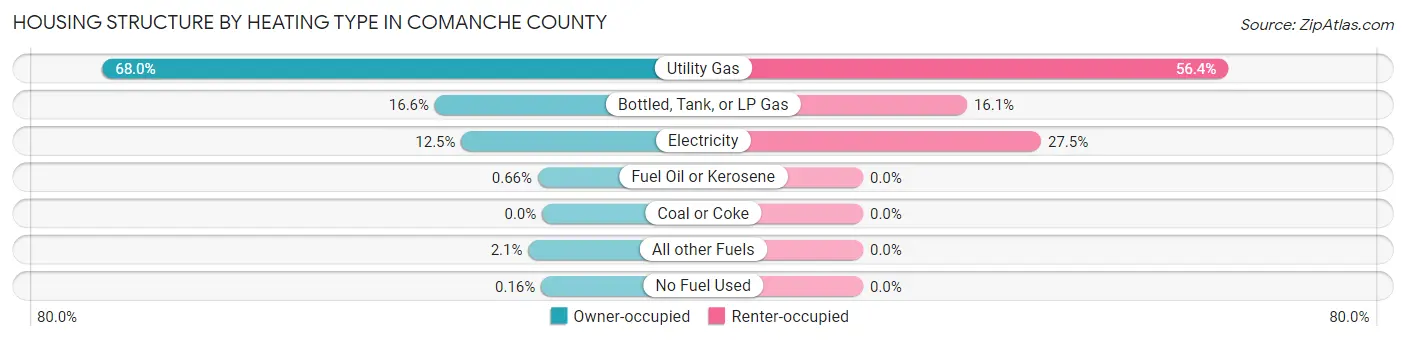
| Heating Type | Owner-occupied | Renter-occupied |
| Utility Gas | 414 (68.0%) | 123 (56.4%) |
| Bottled, Tank, or LP Gas | 101 (16.6%) | 35 (16.1%) |
| Electricity | 76 (12.5%) | 60 (27.5%) |
| Fuel Oil or Kerosene | 4 (0.7%) | 0 (0.0%) |
| Coal or Coke | 0 (0.0%) | 0 (0.0%) |
| All other Fuels | 13 (2.1%) | 0 (0.0%) |
| No Fuel Used | 1 (0.2%) | 0 (0.0%) |
| Total | 609 (100.0%) | 218 (100.0%) |
Household Vehicle Usage in Comanche County
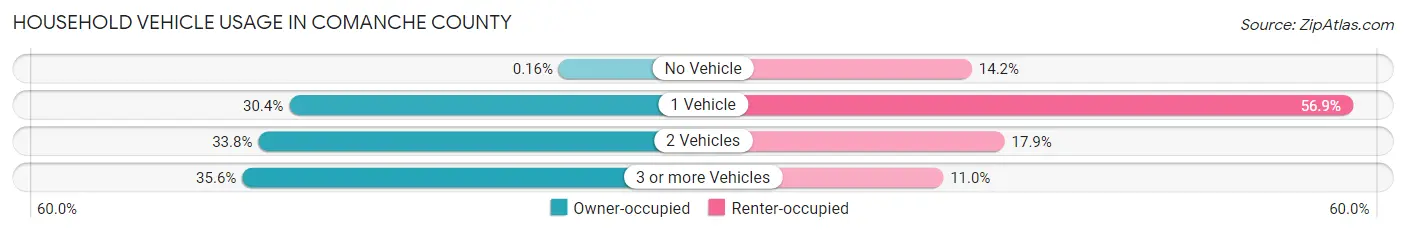
| Vehicles per Household | Owner-occupied | Renter-occupied |
| No Vehicle | 1 (0.2%) | 31 (14.2%) |
| 1 Vehicle | 185 (30.4%) | 124 (56.9%) |
| 2 Vehicles | 206 (33.8%) | 39 (17.9%) |
| 3 or more Vehicles | 217 (35.6%) | 24 (11.0%) |
| Total | 609 (100.0%) | 218 (100.0%) |
Real Estate & Mortgages in Comanche County
Real Estate and Mortgage Overview in Comanche County
| Characteristic | Without Mortgage | With Mortgage |
| Housing Units | 362 | 247 |
| Median Property Value | $55,300 | $84,200 |
| Median Household Income | $48,796 | $32 |
| Monthly Housing Costs | $478 | $4 |
| Real Estate Taxes | $1,263 | $2 |
Property Value by Mortgage Status in Comanche County
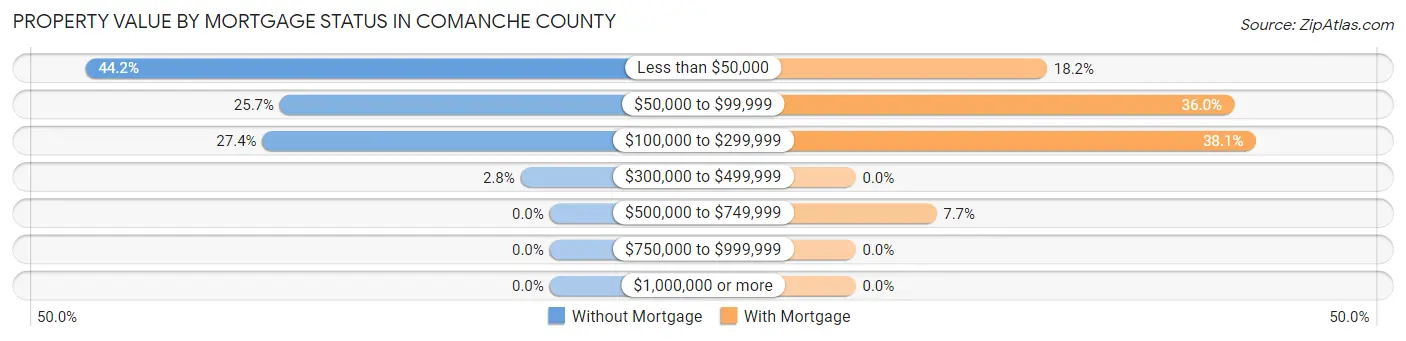
| Property Value | Without Mortgage | With Mortgage |
| Less than $50,000 | 160 (44.2%) | 45 (18.2%) |
| $50,000 to $99,999 | 93 (25.7%) | 89 (36.0%) |
| $100,000 to $299,999 | 99 (27.4%) | 94 (38.1%) |
| $300,000 to $499,999 | 10 (2.8%) | 0 (0.0%) |
| $500,000 to $749,999 | 0 (0.0%) | 19 (7.7%) |
| $750,000 to $999,999 | 0 (0.0%) | 0 (0.0%) |
| $1,000,000 or more | 0 (0.0%) | 0 (0.0%) |
| Total | 362 (100.0%) | 247 (100.0%) |
Household Income by Mortgage Status in Comanche County
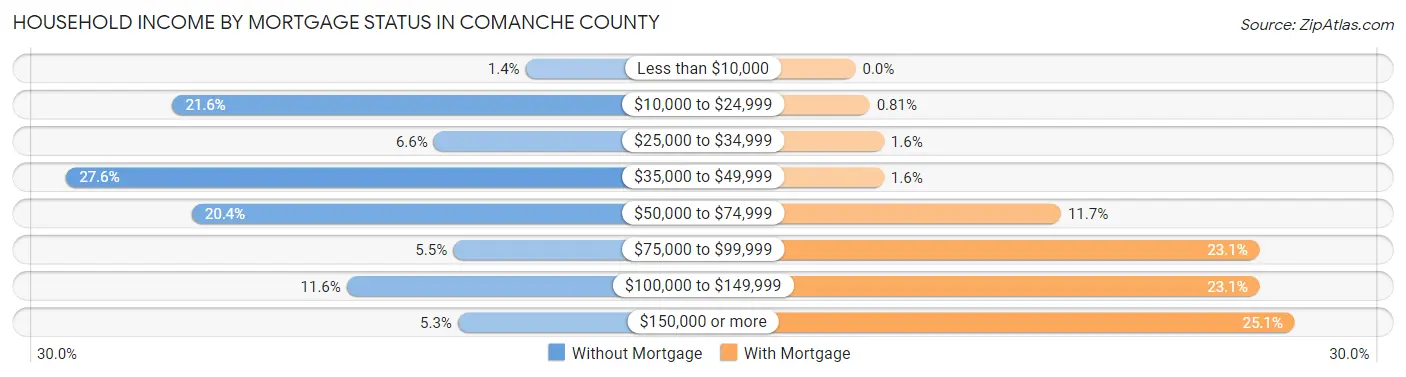
| Household Income | Without Mortgage | With Mortgage |
| Less than $10,000 | 5 (1.4%) | 0 (0.0%) |
| $10,000 to $24,999 | 78 (21.5%) | 2 (0.8%) |
| $25,000 to $34,999 | 24 (6.6%) | 4 (1.6%) |
| $35,000 to $49,999 | 100 (27.6%) | 4 (1.6%) |
| $50,000 to $74,999 | 74 (20.4%) | 29 (11.7%) |
| $75,000 to $99,999 | 20 (5.5%) | 57 (23.1%) |
| $100,000 to $149,999 | 42 (11.6%) | 57 (23.1%) |
| $150,000 or more | 19 (5.2%) | 62 (25.1%) |
| Total | 362 (100.0%) | 247 (100.0%) |
Property Value to Household Income Ratio in Comanche County
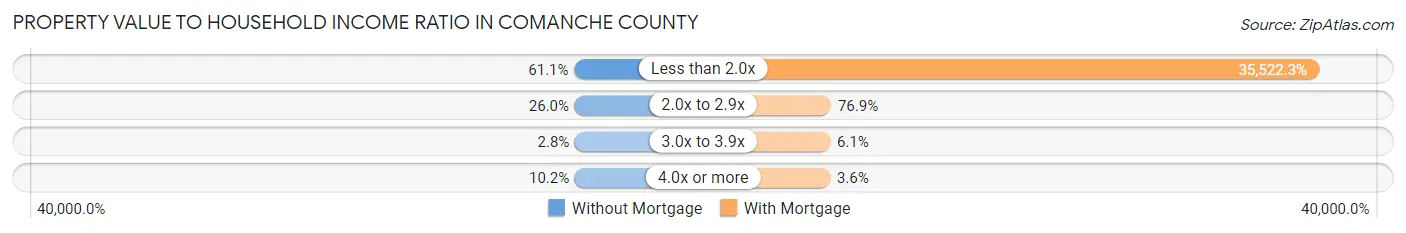
| Value-to-Income Ratio | Without Mortgage | With Mortgage |
| Less than 2.0x | 221 (61.1%) | 87,740 (35,522.3%) |
| 2.0x to 2.9x | 94 (26.0%) | 190 (76.9%) |
| 3.0x to 3.9x | 10 (2.8%) | 15 (6.1%) |
| 4.0x or more | 37 (10.2%) | 9 (3.6%) |
| Total | 362 (100.0%) | 247 (100.0%) |
Real Estate Taxes by Mortgage Status in Comanche County
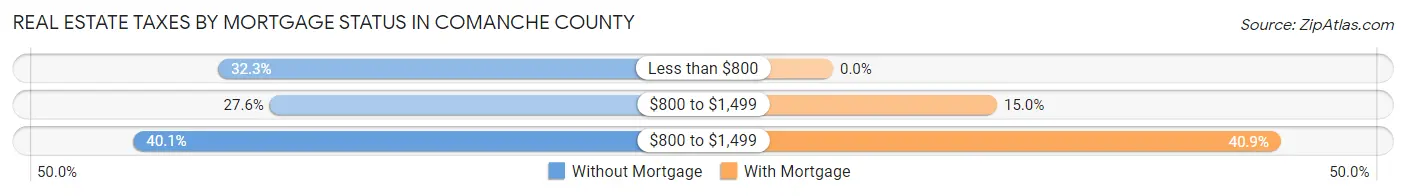
| Property Taxes | Without Mortgage | With Mortgage |
| Less than $800 | 117 (32.3%) | 0 (0.0%) |
| $800 to $1,499 | 100 (27.6%) | 37 (15.0%) |
| $800 to $1,499 | 145 (40.1%) | 101 (40.9%) |
| Total | 362 (100.0%) | 247 (100.0%) |
Health & Disability in Comanche County
Health Insurance Coverage by Age in Comanche County
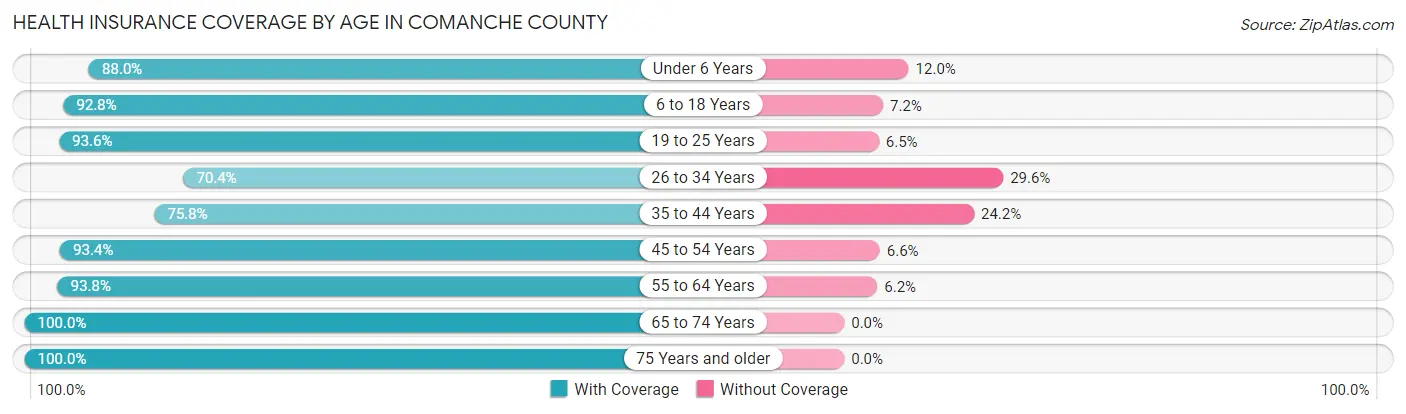
| Age Bracket | With Coverage | Without Coverage |
| Under 6 Years | 66 (88.0%) | 9 (12.0%) |
| 6 to 18 Years | 359 (92.8%) | 28 (7.2%) |
| 19 to 25 Years | 58 (93.5%) | 4 (6.5%) |
| 26 to 34 Years | 57 (70.4%) | 24 (29.6%) |
| 35 to 44 Years | 188 (75.8%) | 60 (24.2%) |
| 45 to 54 Years | 155 (93.4%) | 11 (6.6%) |
| 55 to 64 Years | 274 (93.8%) | 18 (6.2%) |
| 65 to 74 Years | 271 (100.0%) | 0 (0.0%) |
| 75 Years and older | 178 (100.0%) | 0 (0.0%) |
| Total | 1,606 (91.2%) | 154 (8.7%) |
Health Insurance Coverage by Citizenship Status in Comanche County
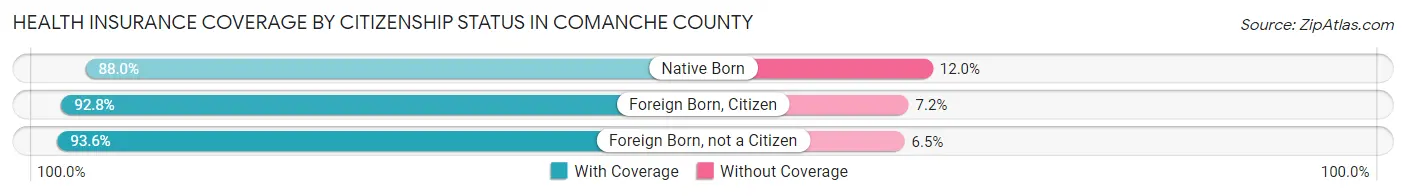
| Citizenship Status | With Coverage | Without Coverage |
| Native Born | 66 (88.0%) | 9 (12.0%) |
| Foreign Born, Citizen | 359 (92.8%) | 28 (7.2%) |
| Foreign Born, not a Citizen | 58 (93.5%) | 4 (6.5%) |
Health Insurance Coverage by Household Income in Comanche County
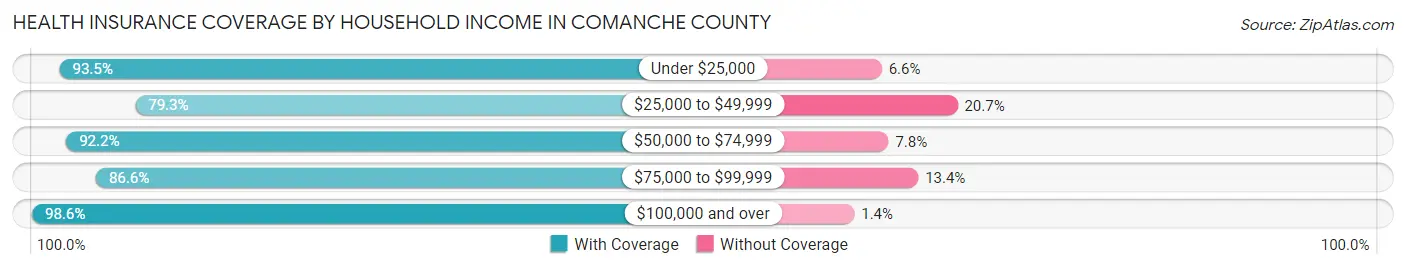
| Household Income | With Coverage | Without Coverage |
| Under $25,000 | 214 (93.4%) | 15 (6.6%) |
| $25,000 to $49,999 | 279 (79.3%) | 73 (20.7%) |
| $50,000 to $74,999 | 248 (92.2%) | 21 (7.8%) |
| $75,000 to $99,999 | 233 (86.6%) | 36 (13.4%) |
| $100,000 and over | 632 (98.6%) | 9 (1.4%) |
Public vs Private Health Insurance Coverage by Age in Comanche County
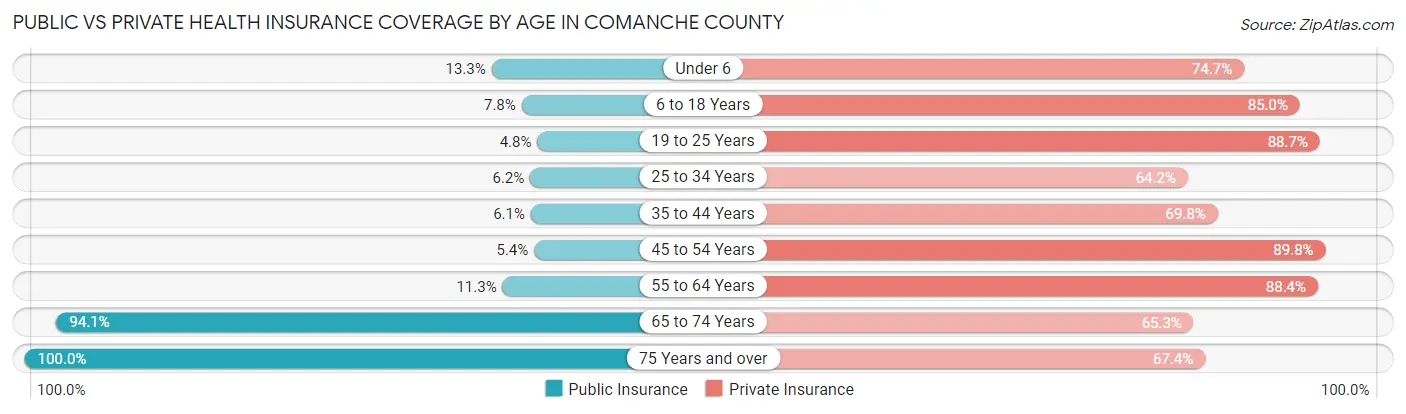
| Age Bracket | Public Insurance | Private Insurance |
| Under 6 | 10 (13.3%) | 56 (74.7%) |
| 6 to 18 Years | 30 (7.7%) | 329 (85.0%) |
| 19 to 25 Years | 3 (4.8%) | 55 (88.7%) |
| 25 to 34 Years | 5 (6.2%) | 52 (64.2%) |
| 35 to 44 Years | 15 (6.0%) | 173 (69.8%) |
| 45 to 54 Years | 9 (5.4%) | 149 (89.8%) |
| 55 to 64 Years | 33 (11.3%) | 258 (88.4%) |
| 65 to 74 Years | 255 (94.1%) | 177 (65.3%) |
| 75 Years and over | 178 (100.0%) | 120 (67.4%) |
| Total | 538 (30.6%) | 1,369 (77.8%) |
Disability Status by Sex by Age in Comanche County
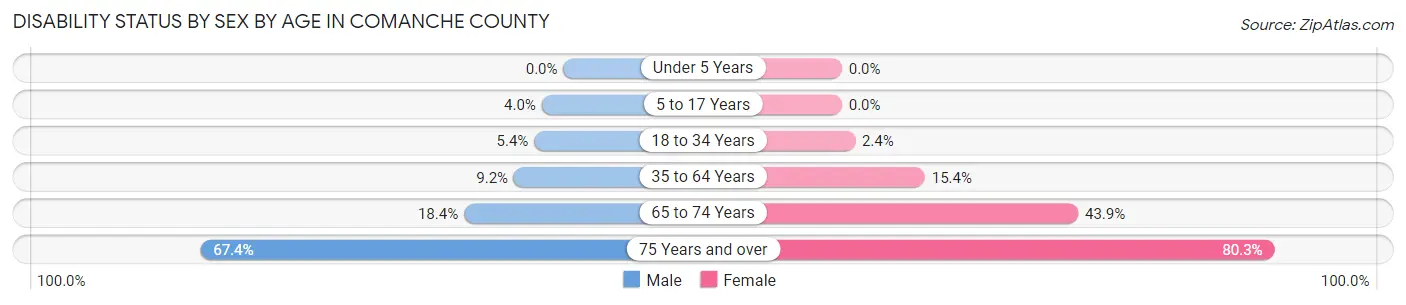
| Age Bracket | Male | Female |
| Under 5 Years | 0 (0.0%) | 0 (0.0%) |
| 5 to 17 Years | 8 (4.0%) | 0 (0.0%) |
| 18 to 34 Years | 6 (5.4%) | 2 (2.4%) |
| 35 to 64 Years | 32 (9.2%) | 55 (15.4%) |
| 65 to 74 Years | 26 (18.4%) | 57 (43.9%) |
| 75 Years and over | 31 (67.4%) | 106 (80.3%) |
Disability Class by Sex by Age in Comanche County
Disability Class: Hearing Difficulty
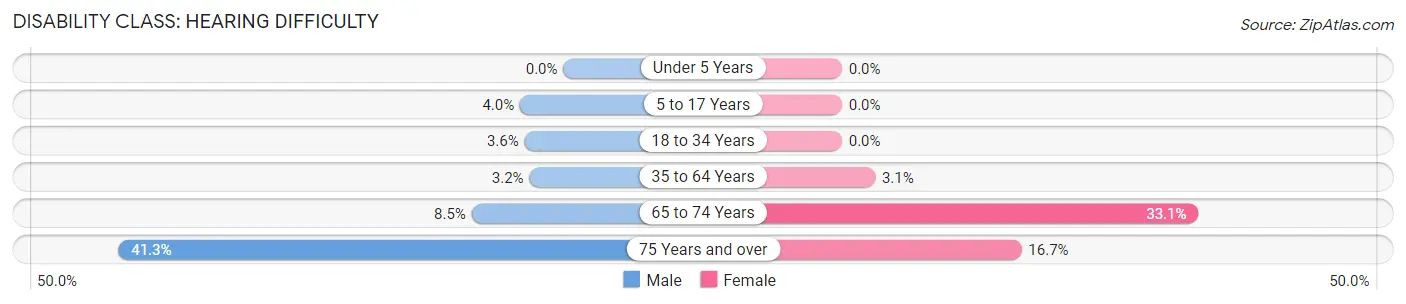
| Age Bracket | Male | Female |
| Under 5 Years | 0 (0.0%) | 0 (0.0%) |
| 5 to 17 Years | 8 (4.0%) | 0 (0.0%) |
| 18 to 34 Years | 4 (3.6%) | 0 (0.0%) |
| 35 to 64 Years | 11 (3.2%) | 11 (3.1%) |
| 65 to 74 Years | 12 (8.5%) | 43 (33.1%) |
| 75 Years and over | 19 (41.3%) | 22 (16.7%) |
Disability Class: Vision Difficulty
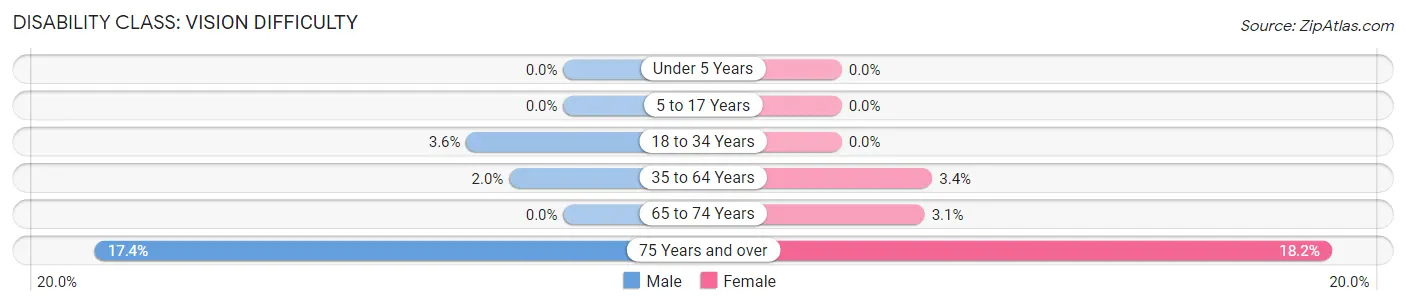
| Age Bracket | Male | Female |
| Under 5 Years | 0 (0.0%) | 0 (0.0%) |
| 5 to 17 Years | 0 (0.0%) | 0 (0.0%) |
| 18 to 34 Years | 4 (3.6%) | 0 (0.0%) |
| 35 to 64 Years | 7 (2.0%) | 12 (3.4%) |
| 65 to 74 Years | 0 (0.0%) | 4 (3.1%) |
| 75 Years and over | 8 (17.4%) | 24 (18.2%) |
Disability Class: Cognitive Difficulty
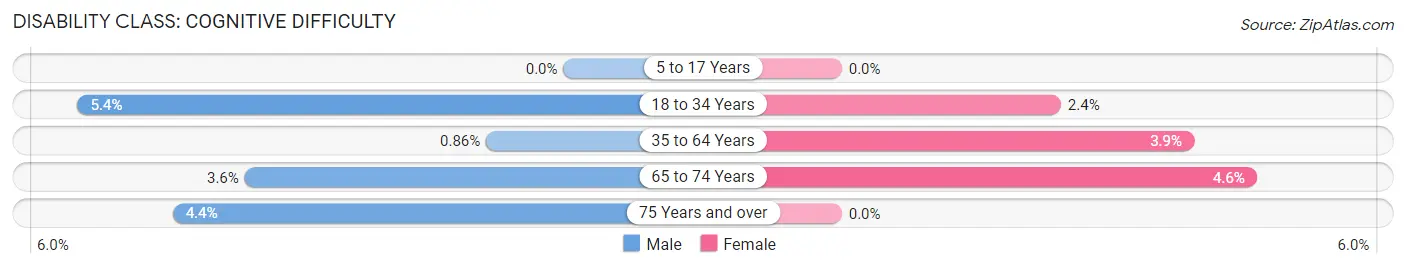
| Age Bracket | Male | Female |
| 5 to 17 Years | 0 (0.0%) | 0 (0.0%) |
| 18 to 34 Years | 6 (5.4%) | 2 (2.4%) |
| 35 to 64 Years | 3 (0.9%) | 14 (3.9%) |
| 65 to 74 Years | 5 (3.5%) | 6 (4.6%) |
| 75 Years and over | 2 (4.3%) | 0 (0.0%) |
Disability Class: Ambulatory Difficulty
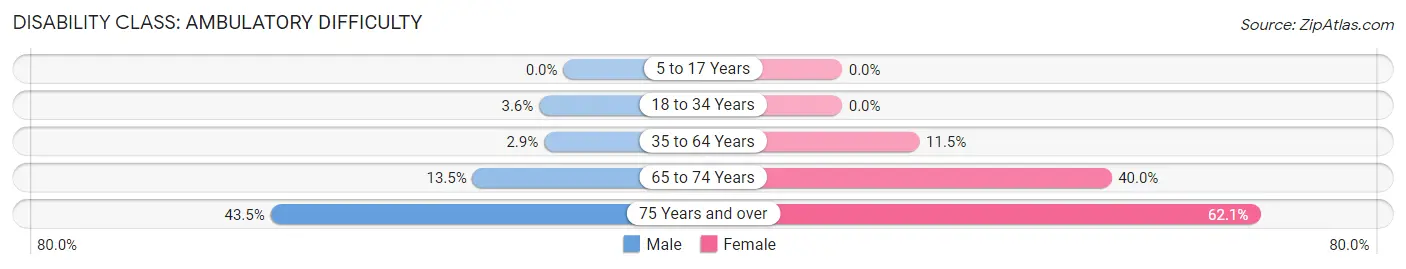
| Age Bracket | Male | Female |
| 5 to 17 Years | 0 (0.0%) | 0 (0.0%) |
| 18 to 34 Years | 4 (3.6%) | 0 (0.0%) |
| 35 to 64 Years | 10 (2.9%) | 41 (11.5%) |
| 65 to 74 Years | 19 (13.5%) | 52 (40.0%) |
| 75 Years and over | 20 (43.5%) | 82 (62.1%) |
Disability Class: Self-Care Difficulty
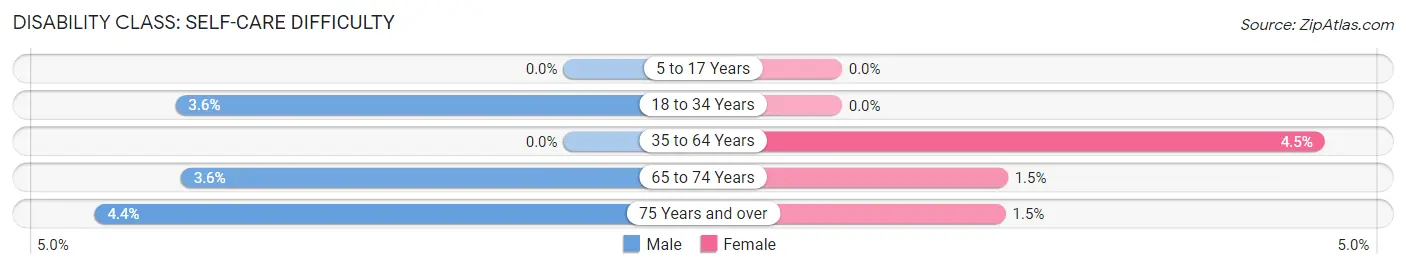
| Age Bracket | Male | Female |
| 5 to 17 Years | 0 (0.0%) | 0 (0.0%) |
| 18 to 34 Years | 4 (3.6%) | 0 (0.0%) |
| 35 to 64 Years | 0 (0.0%) | 16 (4.5%) |
| 65 to 74 Years | 5 (3.5%) | 2 (1.5%) |
| 75 Years and over | 2 (4.3%) | 2 (1.5%) |
Technology Access in Comanche County
Computing Device Access in Comanche County
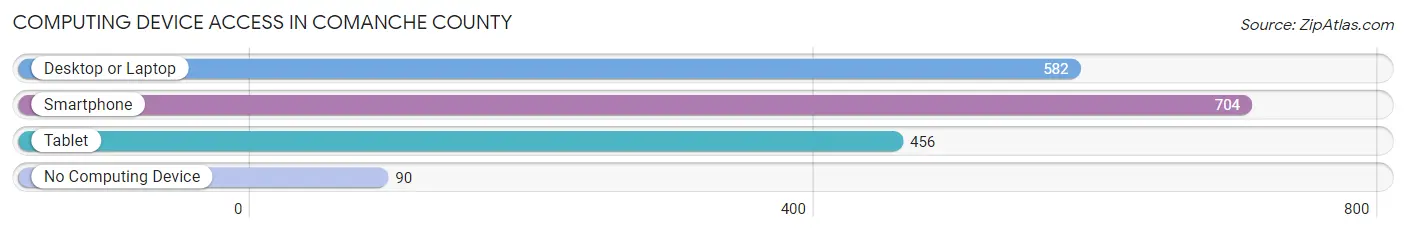
| Device Type | # Households | % Households |
| Desktop or Laptop | 582 | 70.4% |
| Smartphone | 704 | 85.1% |
| Tablet | 456 | 55.1% |
| No Computing Device | 90 | 10.9% |
| Total | 827 | 100.0% |
Internet Access in Comanche County
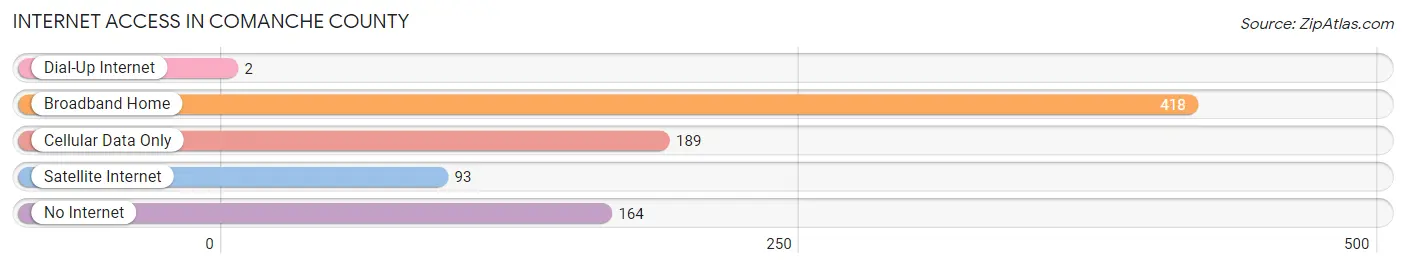
| Internet Type | # Households | % Households |
| Dial-Up Internet | 2 | 0.2% |
| Broadband Home | 418 | 50.5% |
| Cellular Data Only | 189 | 22.9% |
| Satellite Internet | 93 | 11.3% |
| No Internet | 164 | 19.8% |
| Total | 827 | 100.0% |
Comanche County Summary
Comanche County, Kansas is located in the south-central part of the state, and is bordered by Barber, Clark, Edwards, Kiowa, and Meade counties. The county seat is Coldwater, and the county was named after the Comanche Native American tribe. As of the 2010 census, the population of Comanche County was 2,819, making it the second least populous county in the state.
Geography
Comanche County is located in the High Plains region of Kansas, and is mostly flat with rolling hills. The county is drained by the Arkansas River, which forms its western border. The county has a total area of 890 square miles, of which 889 square miles is land and 1.2 square miles is water. The highest point in the county is located in the northwest corner, at an elevation of 2,890 feet.
Climate
Comanche County has a semi-arid climate, with hot summers and cold winters. The average annual temperature is 54°F, and the average annual precipitation is 22 inches.
Demographics
As of the 2010 census, there were 2,819 people, 1,093 households, and 790 families residing in the county. The population density was 3.2 people per square mile. The racial makeup of the county was 95.2% White, 0.2% African American, 0.7% Native American, 0.2% Asian, 0.1% Pacific Islander, 2.3% from other races, and 1.3% from two or more races. Hispanic or Latino of any race were 4.2% of the population.
Economy
Agriculture is the main economic activity in Comanche County. The county is home to a variety of crops, including wheat, corn, sorghum, soybeans, and hay. Livestock production is also important, with cattle, hogs, and sheep being the main animals raised.
The county also has a few small businesses, including a few restaurants, a grocery store, and a few gas stations. The county is also home to a few small manufacturing companies, including a furniture manufacturer and a metal fabrication company.
History
Comanche County was established in 1867, and was named after the Comanche Native American tribe. The county was originally part of Kiowa County, but was split off in 1867. The county seat was originally located in the town of Coldwater, which was founded in 1871.
The county was largely agricultural in its early years, with wheat, corn, and sorghum being the main crops. The county also had a few small businesses, including a few restaurants, a grocery store, and a few gas stations.
In the early 20th century, the county experienced a population boom, as many people moved to the area to take advantage of the agricultural opportunities. The population peaked in 1930, with 8,845 people.
Since then, the population has steadily declined, as many people have moved away from the area in search of better economic opportunities. As of the 2010 census, the population of Comanche County was 2,819.
Common Questions
What is Per Capita Income in Comanche County?
Per Capita income in Comanche County is $30,989.
What is the Median Family Income in Comanche County?
Median Family Income in Comanche County is $84,583.
What is the Median Household income in Comanche County?
Median Household Income in Comanche County is $49,754.
What is Income or Wage Gap in Comanche County?
Income or Wage Gap in Comanche County is 38.8%.
Women in Comanche County earn 61.2 cents for every dollar earned by a man.
What is Inequality or Gini Index in Comanche County?
Inequality or Gini Index in Comanche County is 0.40.
What is the Total Population of Comanche County?
Total Population of Comanche County is 1,825.
What is the Total Male Population of Comanche County?
Total Male Population of Comanche County is 914.
What is the Total Female Population of Comanche County?
Total Female Population of Comanche County is 911.
What is the Ratio of Males per 100 Females in Comanche County?
There are 100.33 Males per 100 Females in Comanche County.
What is the Ratio of Females per 100 Males in Comanche County?
There are 99.67 Females per 100 Males in Comanche County.
What is the Median Population Age in Comanche County?
Median Population Age in Comanche County is 46.8 Years.
What is the Average Family Size in Comanche County
Average Family Size in Comanche County is 3.0 People.
What is the Average Household Size in Comanche County
Average Household Size in Comanche County is 2.1 People.
How Large is the Labor Force in Comanche County?
There are 912 People in the Labor Forcein in Comanche County.
What is the Percentage of People in the Labor Force in Comanche County?
62.5% of People are in the Labor Force in Comanche County.
What is the Unemployment Rate in Comanche County?
Unemployment Rate in Comanche County is 3.8%.