Cheyenne County, KS Map & Demographics
Cheyenne County Map
Cheyenne County Overview
$34,829
PER CAPITA INCOME
$70,938
AVG FAMILY INCOME
$52,730
AVG HOUSEHOLD INCOME
28.1%
WAGE / INCOME GAP [ % ]
71.9¢/ $1
WAGE / INCOME GAP [ $ ]
0.45
INEQUALITY / GINI INDEX
2,619
TOTAL POPULATION
1,373
MALE POPULATION
1,246
FEMALE POPULATION
110.19
MALES / 100 FEMALES
90.75
FEMALES / 100 MALES
43.0
MEDIAN AGE
3.1
AVG FAMILY SIZE
2.1
AVG HOUSEHOLD SIZE
1,310
LABOR FORCE [ PEOPLE ]
62.0%
PERCENT IN LABOR FORCE
1.8%
UNEMPLOYMENT RATE
Cheyenne County Area Codes
Income in Cheyenne County
Income Overview in Cheyenne County
Per Capita Income in Cheyenne County is $34,829, while median incomes of families and households are $70,938 and $52,730 respectively.
| Characteristic | Number | Measure |
| Per Capita Income | 2,619 | $34,829 |
| Median Family Income | 603 | $70,938 |
| Mean Family Income | 603 | $91,695 |
| Median Household Income | 1,207 | $52,730 |
| Mean Household Income | 1,207 | $71,667 |
| Income Deficit | 603 | $0 |
| Wage / Income Gap (%) | 2,619 | 28.07% |
| Wage / Income Gap ($) | 2,619 | 71.93¢ per $1 |
| Gini / Inequality Index | 2,619 | 0.45 |
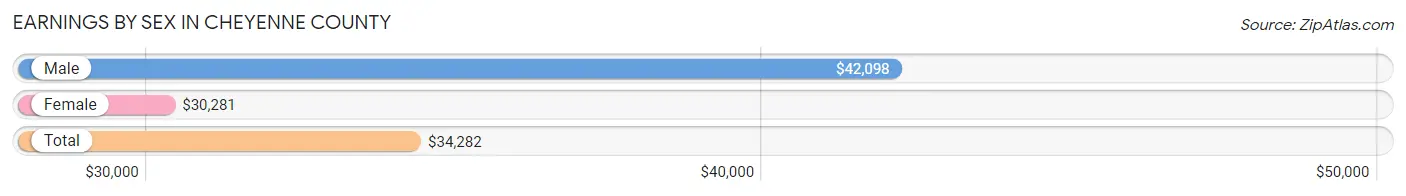
Earnings by Sex in Cheyenne County
Average Earnings in Cheyenne County are $34,282, $42,098 for men and $30,281 for women, a difference of 28.1%.
| Sex | Number | Average Earnings |
| Male | 819 (55.9%) | $42,098 |
| Female | 645 (44.1%) | $30,281 |
| Total | 1,464 (100.0%) | $34,282 |
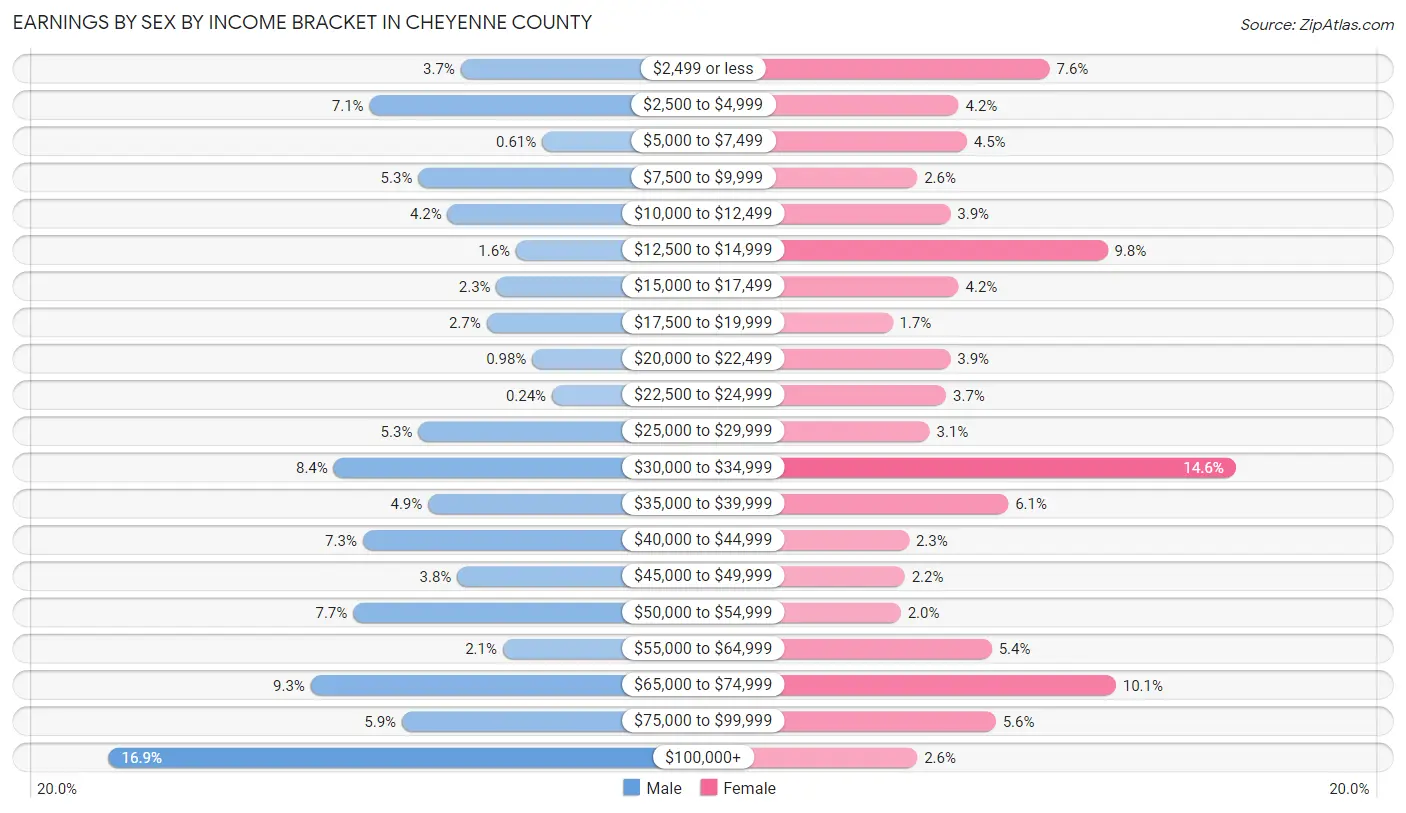
Earnings by Sex by Income Bracket in Cheyenne County
The most common earnings brackets in Cheyenne County are $100,000+ for men (138 | 16.9%) and $30,000 to $34,999 for women (94 | 14.6%).
| Income | Male | Female |
| $2,499 or less | 30 (3.7%) | 49 (7.6%) |
| $2,500 to $4,999 | 58 (7.1%) | 27 (4.2%) |
| $5,000 to $7,499 | 5 (0.6%) | 29 (4.5%) |
| $7,500 to $9,999 | 43 (5.2%) | 17 (2.6%) |
| $10,000 to $12,499 | 34 (4.2%) | 25 (3.9%) |
| $12,500 to $14,999 | 13 (1.6%) | 63 (9.8%) |
| $15,000 to $17,499 | 19 (2.3%) | 27 (4.2%) |
| $17,500 to $19,999 | 22 (2.7%) | 11 (1.7%) |
| $20,000 to $22,499 | 8 (1.0%) | 25 (3.9%) |
| $22,500 to $24,999 | 2 (0.2%) | 24 (3.7%) |
| $25,000 to $29,999 | 43 (5.2%) | 20 (3.1%) |
| $30,000 to $34,999 | 69 (8.4%) | 94 (14.6%) |
| $35,000 to $39,999 | 40 (4.9%) | 39 (6.0%) |
| $40,000 to $44,999 | 60 (7.3%) | 15 (2.3%) |
| $45,000 to $49,999 | 31 (3.8%) | 14 (2.2%) |
| $50,000 to $54,999 | 63 (7.7%) | 13 (2.0%) |
| $55,000 to $64,999 | 17 (2.1%) | 35 (5.4%) |
| $65,000 to $74,999 | 76 (9.3%) | 65 (10.1%) |
| $75,000 to $99,999 | 48 (5.9%) | 36 (5.6%) |
| $100,000+ | 138 (16.9%) | 17 (2.6%) |
| Total | 819 (100.0%) | 645 (100.0%) |
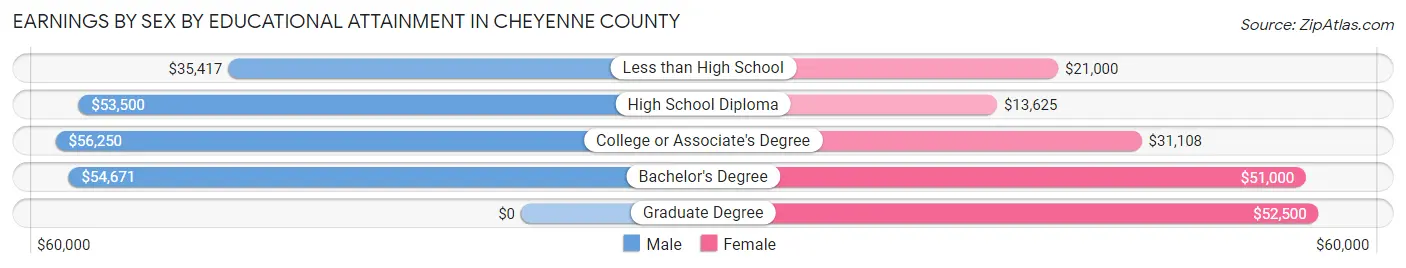
Earnings by Sex by Educational Attainment in Cheyenne County
Average earnings in Cheyenne County are $50,208 for men and $31,403 for women, a difference of 37.4%. Men with an educational attainment of college or associate's degree enjoy the highest average annual earnings of $56,250, while those with less than high school education earn the least with $35,417. Women with an educational attainment of graduate degree earn the most with the average annual earnings of $52,500, while those with high school diploma education have the smallest earnings of $13,625.
| Educational Attainment | Male Income | Female Income |
| Less than High School | $35,417 | $21,000 |
| High School Diploma | $53,500 | $13,625 |
| College or Associate's Degree | $56,250 | $31,108 |
| Bachelor's Degree | $54,671 | $51,000 |
| Graduate Degree | - | - |
| Total | $50,208 | $31,403 |
Family Income in Cheyenne County
Family Income Brackets in Cheyenne County
According to the Cheyenne County family income data, there are 165 families falling into the $50,000 to $74,999 income range, which is the most common income bracket and makes up 27.4% of all families. Conversely, the less than $10,000 income bracket is the least frequent group with only 16 families (2.6%) belonging to this category.
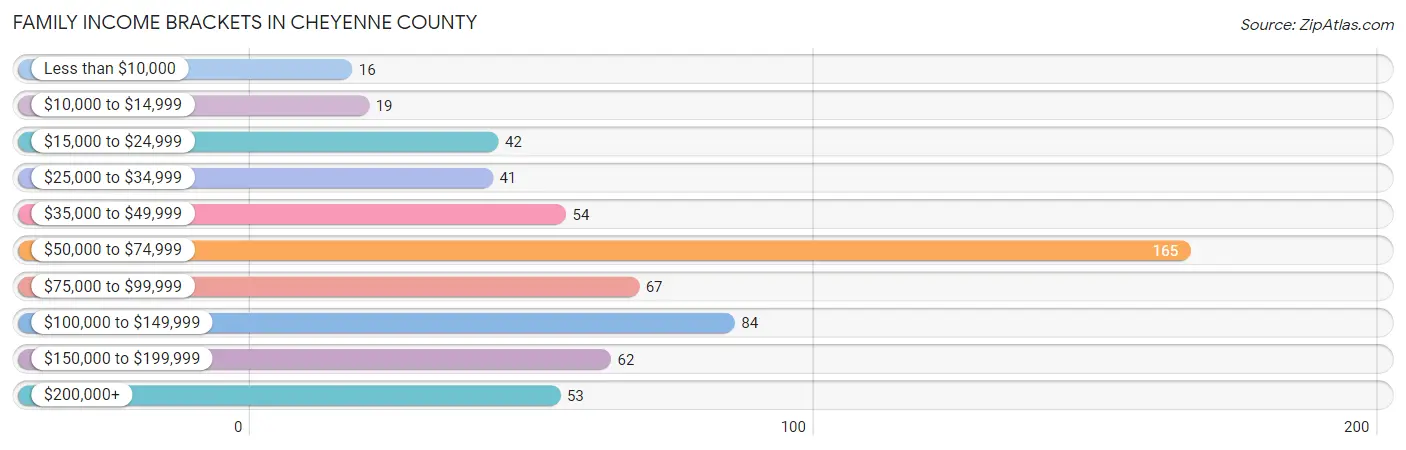
| Income Bracket | # Families | % Families |
| Less than $10,000 | 16 | 2.7% |
| $10,000 to $14,999 | 19 | 3.2% |
| $15,000 to $24,999 | 42 | 7.0% |
| $25,000 to $34,999 | 41 | 6.8% |
| $35,000 to $49,999 | 54 | 9.0% |
| $50,000 to $74,999 | 165 | 27.4% |
| $75,000 to $99,999 | 67 | 11.1% |
| $100,000 to $149,999 | 84 | 13.9% |
| $150,000 to $199,999 | 62 | 10.3% |
| $200,000+ | 53 | 8.8% |
Family Income by Famaliy Size in Cheyenne County
4-person families (82 | 13.6%) account for the highest median family income in Cheyenne County with $76,000 per family, while 2-person families (328 | 54.4%) have the highest median income of $34,772 per family member.
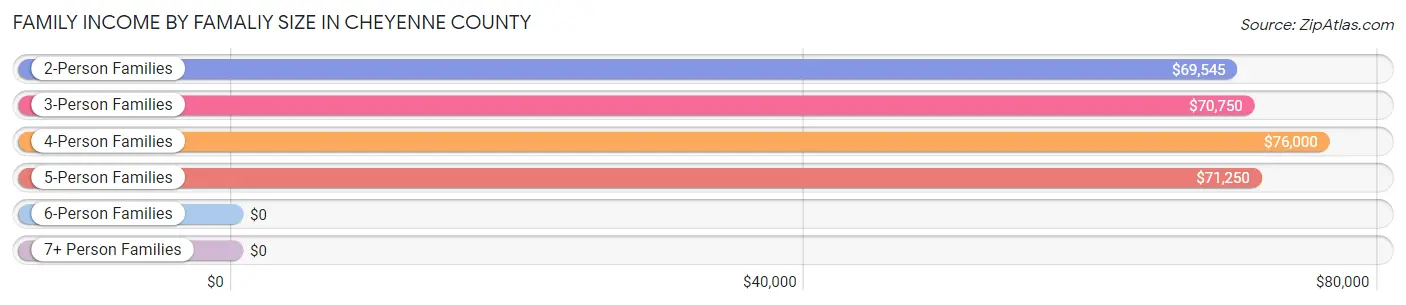
| Income Bracket | # Families | Median Income |
| 2-Person Families | 328 (54.4%) | $69,545 |
| 3-Person Families | 123 (20.4%) | $70,750 |
| 4-Person Families | 82 (13.6%) | $76,000 |
| 5-Person Families | 50 (8.3%) | $71,250 |
| 6-Person Families | 6 (1.0%) | $0 |
| 7+ Person Families | 14 (2.3%) | $0 |
| Total | 603 (100.0%) | $70,938 |
Family Income by Number of Earners in Cheyenne County
The median family income in Cheyenne County is $70,938, with families comprising 2 earners (293) having the highest median family income of $94,250, while families with no earners (59) have the lowest median family income of $24,135, accounting for 48.6% and 9.8% of families, respectively.
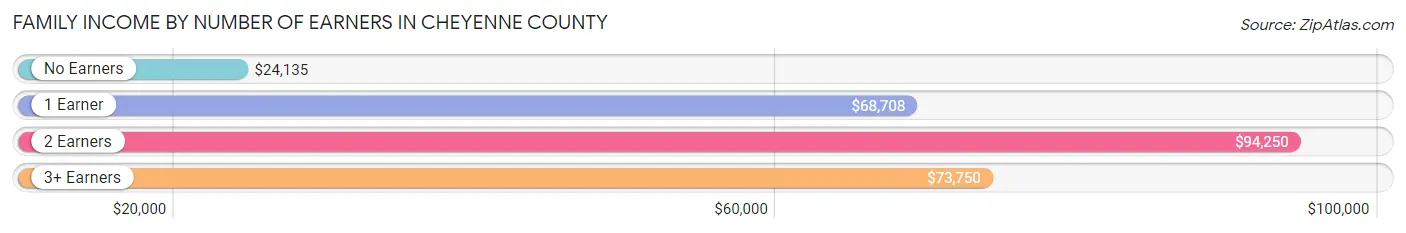
| Number of Earners | # Families | Median Income |
| No Earners | 59 (9.8%) | $24,135 |
| 1 Earner | 197 (32.7%) | $68,708 |
| 2 Earners | 293 (48.6%) | $94,250 |
| 3+ Earners | 54 (9.0%) | $73,750 |
| Total | 603 (100.0%) | $70,938 |
Household Income in Cheyenne County
Household Income Brackets in Cheyenne County
With 255 households falling in the category, the $50,000 to $74,999 income range is the most frequent in Cheyenne County, accounting for 21.1% of all households. In contrast, only 62 households (5.1%) fall into the $150,000 to $199,999 income bracket, making it the least populous group.
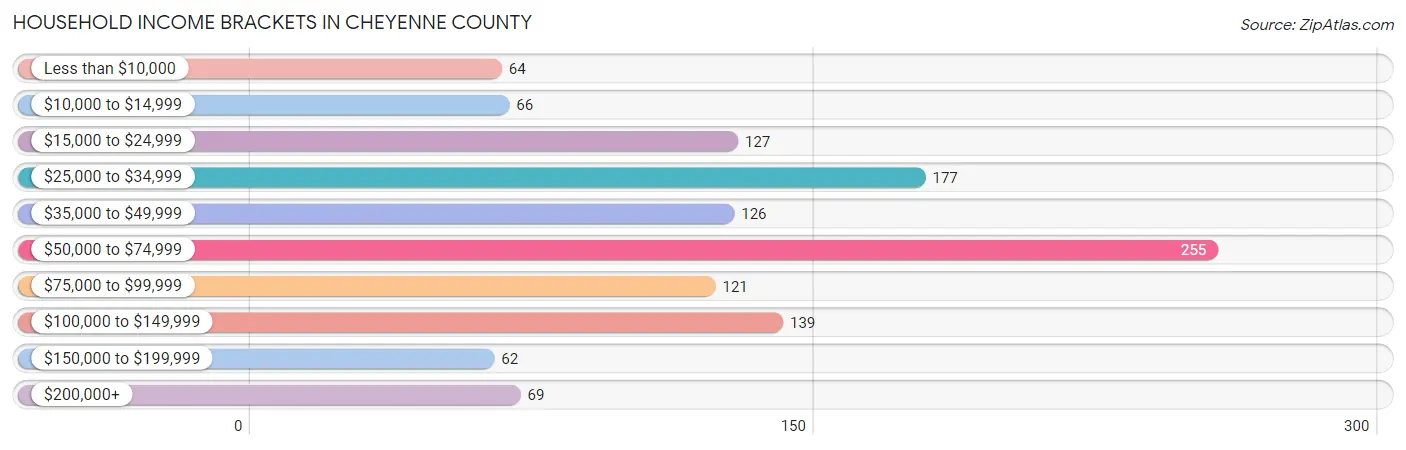
| Income Bracket | # Households | % Households |
| Less than $10,000 | 64 | 5.3% |
| $10,000 to $14,999 | 66 | 5.5% |
| $15,000 to $24,999 | 127 | 10.5% |
| $25,000 to $34,999 | 177 | 14.7% |
| $35,000 to $49,999 | 126 | 10.4% |
| $50,000 to $74,999 | 255 | 21.1% |
| $75,000 to $99,999 | 121 | 10.0% |
| $100,000 to $149,999 | 139 | 11.5% |
| $150,000 to $199,999 | 62 | 5.1% |
| $200,000+ | 69 | 5.7% |
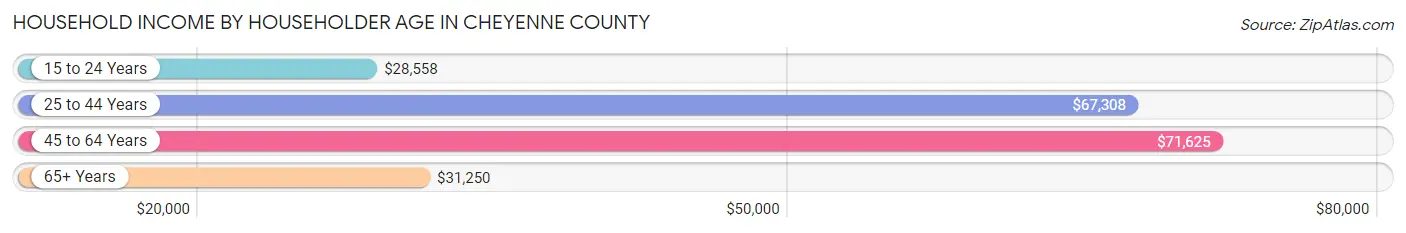
Household Income by Householder Age in Cheyenne County
The median household income in Cheyenne County is $52,730, with the highest median household income of $71,625 found in the 45 to 64 years age bracket for the primary householder. A total of 374 households (31.0%) fall into this category. Meanwhile, the 15 to 24 years age bracket for the primary householder has the lowest median household income of $28,558, with 41 households (3.4%) in this group.
| Income Bracket | # Households | Median Income |
| 15 to 24 Years | 41 (3.4%) | $28,558 |
| 25 to 44 Years | 322 (26.7%) | $67,308 |
| 45 to 64 Years | 374 (31.0%) | $71,625 |
| 65+ Years | 470 (38.9%) | $31,250 |
| Total | 1,207 (100.0%) | $52,730 |
Poverty in Cheyenne County
Income Below Poverty by Sex and Age in Cheyenne County
With 16.8% poverty level for males and 13.5% for females among the residents of Cheyenne County, 5 year old males and under 5 year old females are the most vulnerable to poverty, with 22 males (52.4%) and 23 females (47.9%) in their respective age groups living below the poverty level.
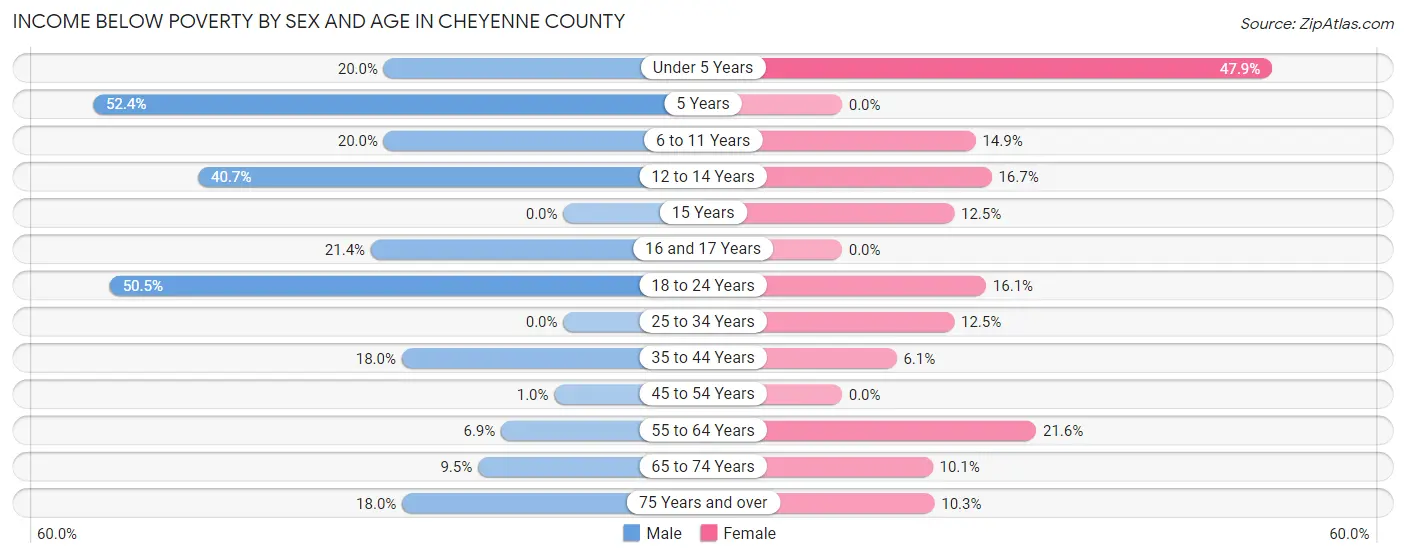
| Age Bracket | Male | Female |
| Under 5 Years | 20 (20.0%) | 23 (47.9%) |
| 5 Years | 22 (52.4%) | 0 (0.0%) |
| 6 to 11 Years | 18 (20.0%) | 14 (14.9%) |
| 12 to 14 Years | 24 (40.7%) | 5 (16.7%) |
| 15 Years | 0 (0.0%) | 2 (12.5%) |
| 16 and 17 Years | 9 (21.4%) | 0 (0.0%) |
| 18 to 24 Years | 49 (50.5%) | 13 (16.1%) |
| 25 to 34 Years | 0 (0.0%) | 14 (12.5%) |
| 35 to 44 Years | 34 (18.0%) | 12 (6.1%) |
| 45 to 54 Years | 1 (1.0%) | 0 (0.0%) |
| 55 to 64 Years | 14 (6.9%) | 45 (21.6%) |
| 65 to 74 Years | 17 (9.5%) | 18 (10.1%) |
| 75 Years and over | 21 (17.9%) | 17 (10.3%) |
| Total | 229 (16.8%) | 163 (13.5%) |
Income Above Poverty by Sex and Age in Cheyenne County
According to the poverty statistics in Cheyenne County, males aged 15 years and females aged 5 years are the age groups that are most secure financially, with 100.0% of males and 100.0% of females in these age groups living above the poverty line.
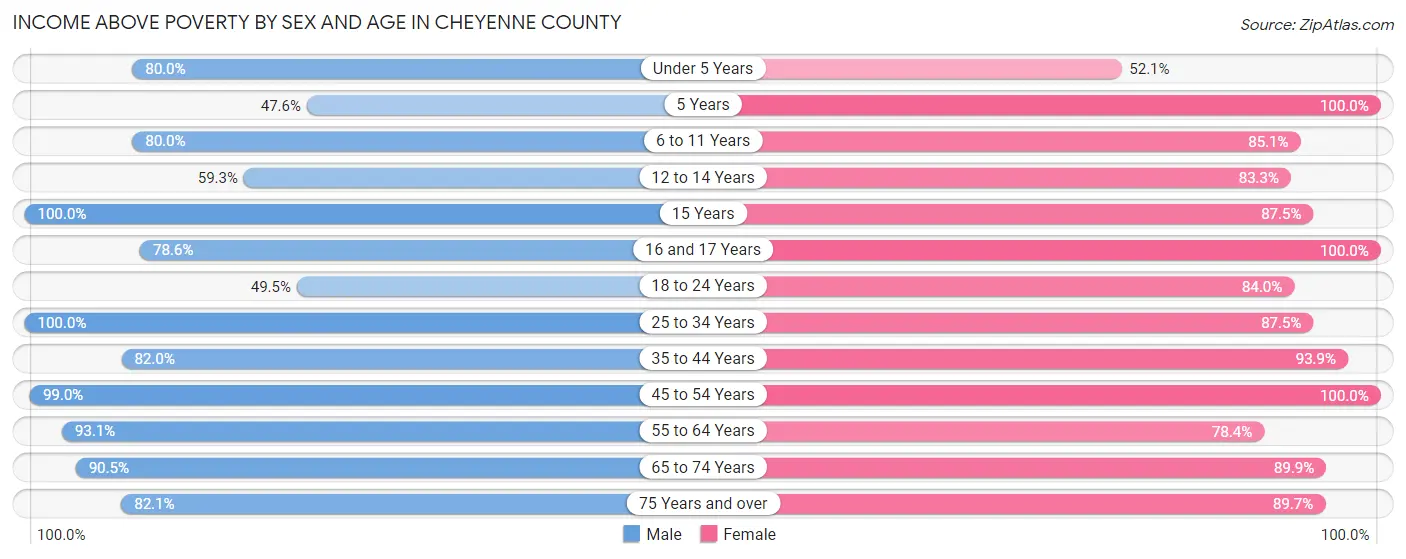
| Age Bracket | Male | Female |
| Under 5 Years | 80 (80.0%) | 25 (52.1%) |
| 5 Years | 20 (47.6%) | 3 (100.0%) |
| 6 to 11 Years | 72 (80.0%) | 80 (85.1%) |
| 12 to 14 Years | 35 (59.3%) | 25 (83.3%) |
| 15 Years | 16 (100.0%) | 14 (87.5%) |
| 16 and 17 Years | 33 (78.6%) | 11 (100.0%) |
| 18 to 24 Years | 48 (49.5%) | 68 (84.0%) |
| 25 to 34 Years | 127 (100.0%) | 98 (87.5%) |
| 35 to 44 Years | 155 (82.0%) | 185 (93.9%) |
| 45 to 54 Years | 99 (99.0%) | 69 (100.0%) |
| 55 to 64 Years | 188 (93.1%) | 163 (78.4%) |
| 65 to 74 Years | 162 (90.5%) | 160 (89.9%) |
| 75 Years and over | 96 (82.1%) | 148 (89.7%) |
| Total | 1,131 (83.2%) | 1,049 (86.6%) |
Income Below Poverty Among Married-Couple Families in Cheyenne County
The poverty statistics for married-couple families in Cheyenne County show that 8.1% or 39 of the total 483 families live below the poverty line. Families with 5 or more children have the highest poverty rate of 78.6%, comprising of 11 families. On the other hand, families with 1 or 2 children have the lowest poverty rate of 0.0%, which includes 0 families.
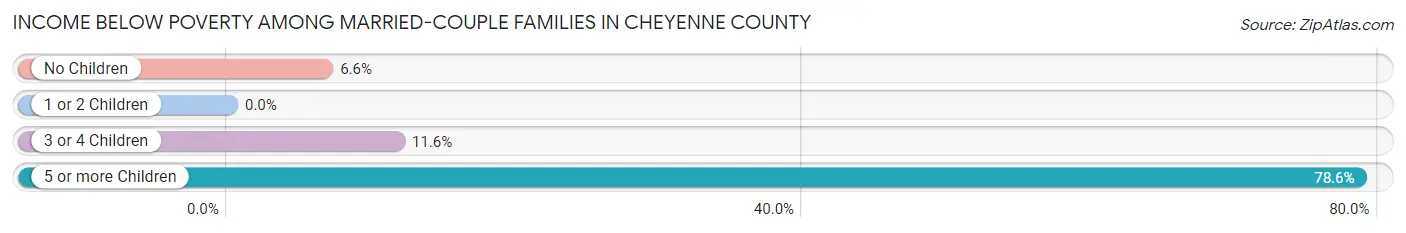
| Children | Above Poverty | Below Poverty |
| No Children | 324 (93.4%) | 23 (6.6%) |
| 1 or 2 Children | 79 (100.0%) | 0 (0.0%) |
| 3 or 4 Children | 38 (88.4%) | 5 (11.6%) |
| 5 or more Children | 3 (21.4%) | 11 (78.6%) |
| Total | 444 (91.9%) | 39 (8.1%) |
Income Below Poverty Among Single-Parent Households in Cheyenne County
According to the poverty data in Cheyenne County, 45.0% or 18 single-father households and 11.3% or 9 single-mother households are living below the poverty line. Among single-father households, those with 3 or 4 children have the highest poverty rate, with 18 households (85.7%) experiencing poverty. Likewise, among single-mother households, those with 3 or 4 children have the highest poverty rate, with 2 households (100.0%) falling below the poverty line.
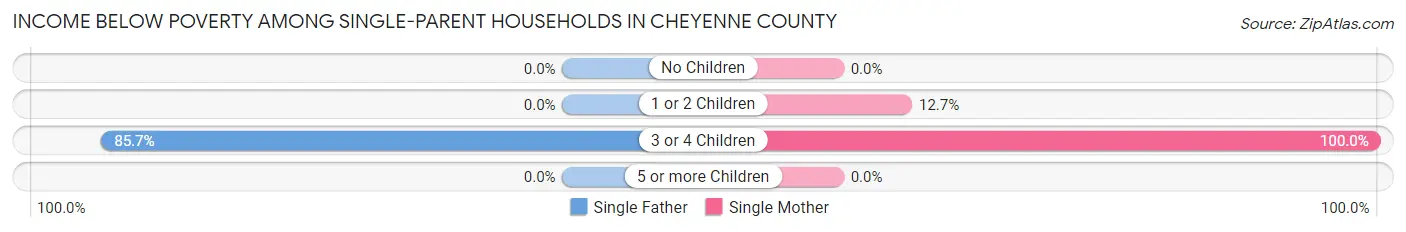
| Children | Single Father | Single Mother |
| No Children | 0 (0.0%) | 0 (0.0%) |
| 1 or 2 Children | 0 (0.0%) | 7 (12.7%) |
| 3 or 4 Children | 18 (85.7%) | 2 (100.0%) |
| 5 or more Children | 0 (0.0%) | 0 (0.0%) |
| Total | 18 (45.0%) | 9 (11.3%) |
Income Below Poverty Among Married-Couple vs Single-Parent Households in Cheyenne County
The poverty data for Cheyenne County shows that 39 of the married-couple family households (8.1%) and 27 of the single-parent households (22.5%) are living below the poverty level. Within the married-couple family households, those with 5 or more children have the highest poverty rate, with 11 households (78.6%) falling below the poverty line. Among the single-parent households, those with 3 or 4 children have the highest poverty rate, with 20 household (87.0%) living below poverty.
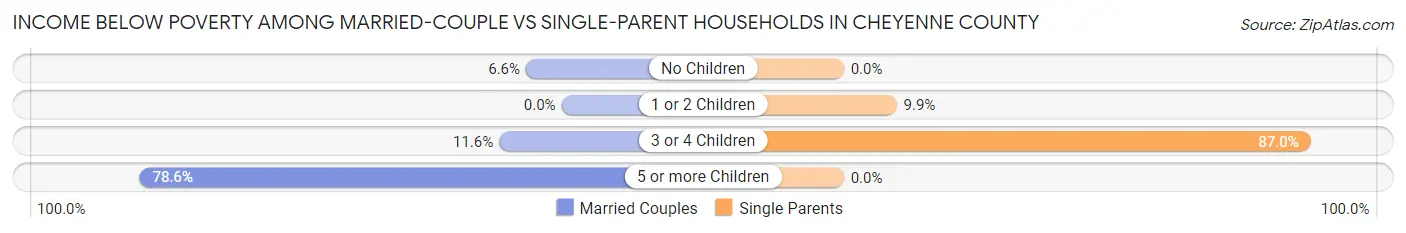
| Children | Married-Couple Families | Single-Parent Households |
| No Children | 23 (6.6%) | 0 (0.0%) |
| 1 or 2 Children | 0 (0.0%) | 7 (9.9%) |
| 3 or 4 Children | 5 (11.6%) | 20 (87.0%) |
| 5 or more Children | 11 (78.6%) | 0 (0.0%) |
| Total | 39 (8.1%) | 27 (22.5%) |
Race in Cheyenne County
The most populous races in Cheyenne County are White / Caucasian (2,377 | 90.8%), Hispanic or Latino (196 | 7.5%), and Two or more Races (102 | 3.9%).
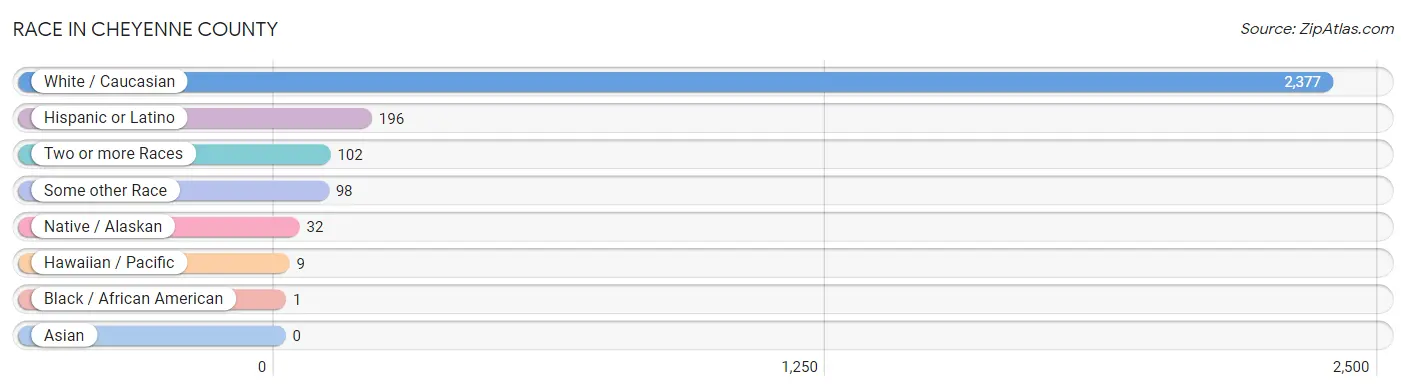
| Race | # Population | % Population |
| Asian | 0 | 0.0% |
| Black / African American | 1 | 0.0% |
| Hawaiian / Pacific | 9 | 0.3% |
| Hispanic or Latino | 196 | 7.5% |
| Native / Alaskan | 32 | 1.2% |
| White / Caucasian | 2,377 | 90.8% |
| Two or more Races | 102 | 3.9% |
| Some other Race | 98 | 3.7% |
| Total | 2,619 | 100.0% |
Ancestry in Cheyenne County
The most populous ancestries reported in Cheyenne County are German (1,067 | 40.7%), English (269 | 10.3%), Irish (247 | 9.4%), Mexican (178 | 6.8%), and Russian (110 | 4.2%), together accounting for 71.4% of all Cheyenne County residents.
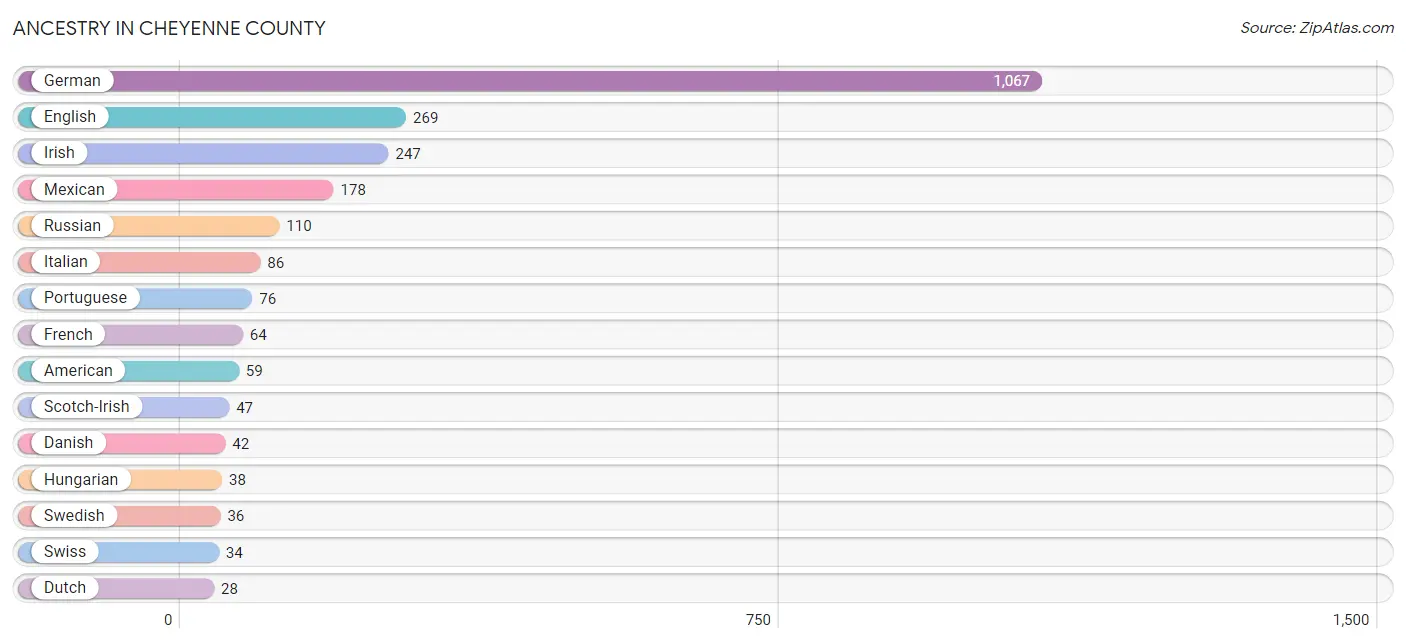
| Ancestry | # Population | % Population |
| African | 1 | 0.0% |
| American | 59 | 2.2% |
| Austrian | 1 | 0.0% |
| British | 10 | 0.4% |
| Cherokee | 21 | 0.8% |
| Czech | 11 | 0.4% |
| Danish | 42 | 1.6% |
| Dutch | 28 | 1.1% |
| Eastern European | 3 | 0.1% |
| English | 269 | 10.3% |
| European | 25 | 0.9% |
| French | 64 | 2.4% |
| French Canadian | 25 | 0.9% |
| German | 1,067 | 40.7% |
| Hungarian | 38 | 1.5% |
| Irish | 247 | 9.4% |
| Italian | 86 | 3.3% |
| Kiowa | 12 | 0.5% |
| Mexican | 178 | 6.8% |
| Mexican American Indian | 7 | 0.3% |
| Norwegian | 16 | 0.6% |
| Peruvian | 10 | 0.4% |
| Polish | 26 | 1.0% |
| Portuguese | 76 | 2.9% |
| Puerto Rican | 8 | 0.3% |
| Russian | 110 | 4.2% |
| Scotch-Irish | 47 | 1.8% |
| Scottish | 25 | 0.9% |
| Sioux | 4 | 0.2% |
| South American | 10 | 0.4% |
| Subsaharan African | 1 | 0.0% |
| Swedish | 36 | 1.4% |
| Swiss | 34 | 1.3% |
| Thai | 4 | 0.2% |
| Welsh | 6 | 0.2% | View All 35 Rows |
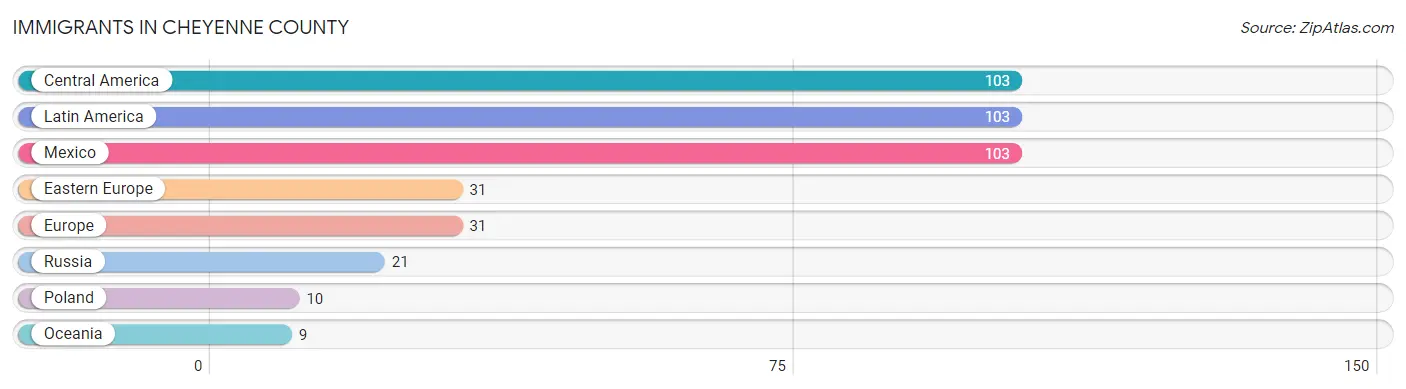
Immigrants in Cheyenne County
The most numerous immigrant groups reported in Cheyenne County came from Central America (103 | 3.9%), Latin America (103 | 3.9%), Mexico (103 | 3.9%), Eastern Europe (31 | 1.2%), and Europe (31 | 1.2%), together accounting for 14.2% of all Cheyenne County residents.
| Immigration Origin | # Population | % Population |
| Central America | 103 | 3.9% |
| Eastern Europe | 31 | 1.2% |
| Europe | 31 | 1.2% |
| Latin America | 103 | 3.9% |
| Mexico | 103 | 3.9% |
| Oceania | 9 | 0.3% |
| Poland | 10 | 0.4% |
| Russia | 21 | 0.8% | View All 8 Rows |
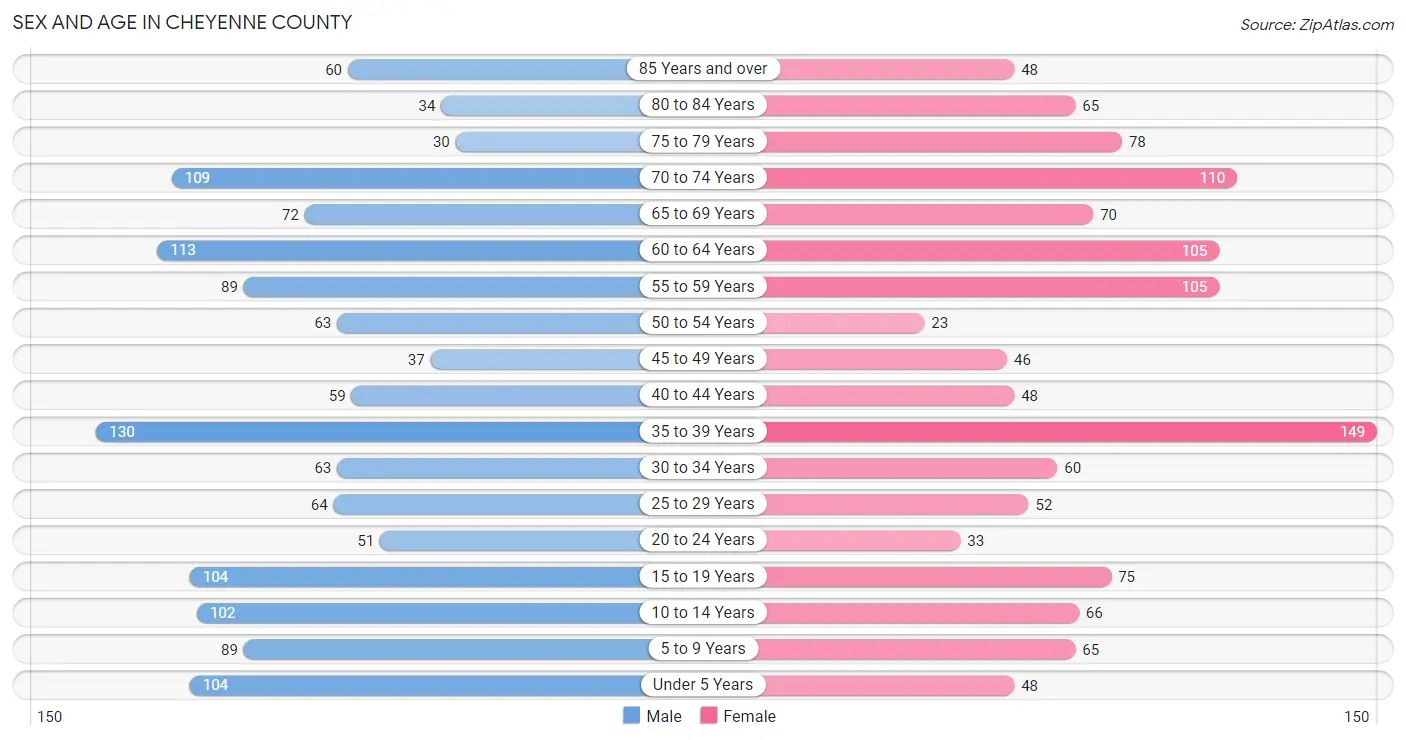
Sex and Age in Cheyenne County
Sex and Age in Cheyenne County
The most populous age groups in Cheyenne County are 35 to 39 Years (130 | 9.5%) for men and 35 to 39 Years (149 | 12.0%) for women.
| Age Bracket | Male | Female |
| Under 5 Years | 104 (7.6%) | 48 (3.8%) |
| 5 to 9 Years | 89 (6.5%) | 65 (5.2%) |
| 10 to 14 Years | 102 (7.4%) | 66 (5.3%) |
| 15 to 19 Years | 104 (7.6%) | 75 (6.0%) |
| 20 to 24 Years | 51 (3.7%) | 33 (2.6%) |
| 25 to 29 Years | 64 (4.7%) | 52 (4.2%) |
| 30 to 34 Years | 63 (4.6%) | 60 (4.8%) |
| 35 to 39 Years | 130 (9.5%) | 149 (12.0%) |
| 40 to 44 Years | 59 (4.3%) | 48 (3.8%) |
| 45 to 49 Years | 37 (2.7%) | 46 (3.7%) |
| 50 to 54 Years | 63 (4.6%) | 23 (1.8%) |
| 55 to 59 Years | 89 (6.5%) | 105 (8.4%) |
| 60 to 64 Years | 113 (8.2%) | 105 (8.4%) |
| 65 to 69 Years | 72 (5.2%) | 70 (5.6%) |
| 70 to 74 Years | 109 (7.9%) | 110 (8.8%) |
| 75 to 79 Years | 30 (2.2%) | 78 (6.3%) |
| 80 to 84 Years | 34 (2.5%) | 65 (5.2%) |
| 85 Years and over | 60 (4.4%) | 48 (3.8%) |
| Total | 1,373 (100.0%) | 1,246 (100.0%) |
Families and Households in Cheyenne County
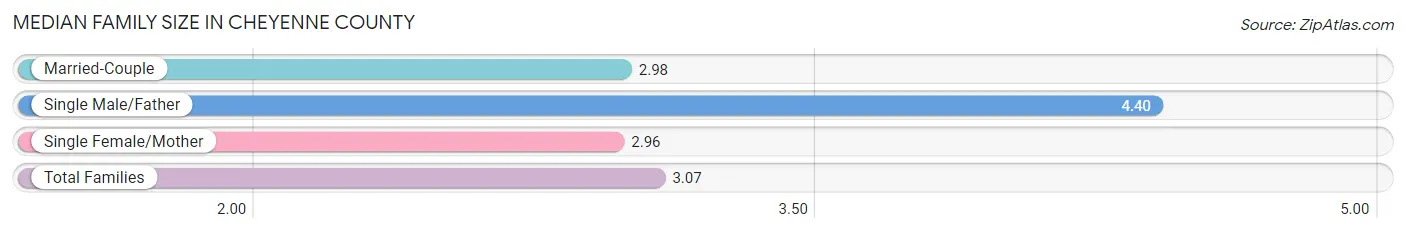
Median Family Size in Cheyenne County
The median family size in Cheyenne County is 3.07 persons per family, with single male/father families (40 | 6.6%) accounting for the largest median family size of 4.4 persons per family. On the other hand, single female/mother families (80 | 13.3%) represent the smallest median family size with 2.96 persons per family.
| Family Type | # Families | Family Size |
| Married-Couple | 483 (80.1%) | 2.98 |
| Single Male/Father | 40 (6.6%) | 4.40 |
| Single Female/Mother | 80 (13.3%) | 2.96 |
| Total Families | 603 (100.0%) | 3.07 |
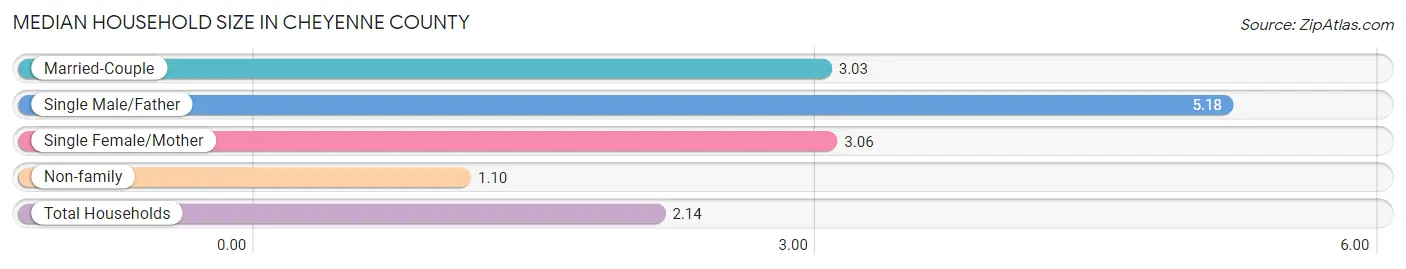
Median Household Size in Cheyenne County
The median household size in Cheyenne County is 2.14 persons per household, with single male/father households (40 | 3.3%) accounting for the largest median household size of 5.18 persons per household. non-family households (604 | 50.0%) represent the smallest median household size with 1.10 persons per household.
| Household Type | # Households | Household Size |
| Married-Couple | 483 (40.0%) | 3.03 |
| Single Male/Father | 40 (3.3%) | 5.18 |
| Single Female/Mother | 80 (6.6%) | 3.06 |
| Non-family | 604 (50.0%) | 1.10 |
| Total Households | 1,207 (100.0%) | 2.14 |
Household Size by Marriage Status in Cheyenne County
Out of a total of 1,207 households in Cheyenne County, 603 (50.0%) are family households, while 604 (50.0%) are nonfamily households. The most numerous type of family households are 2-person households, comprising 328, and the most common type of nonfamily households are 1-person households, comprising 573.
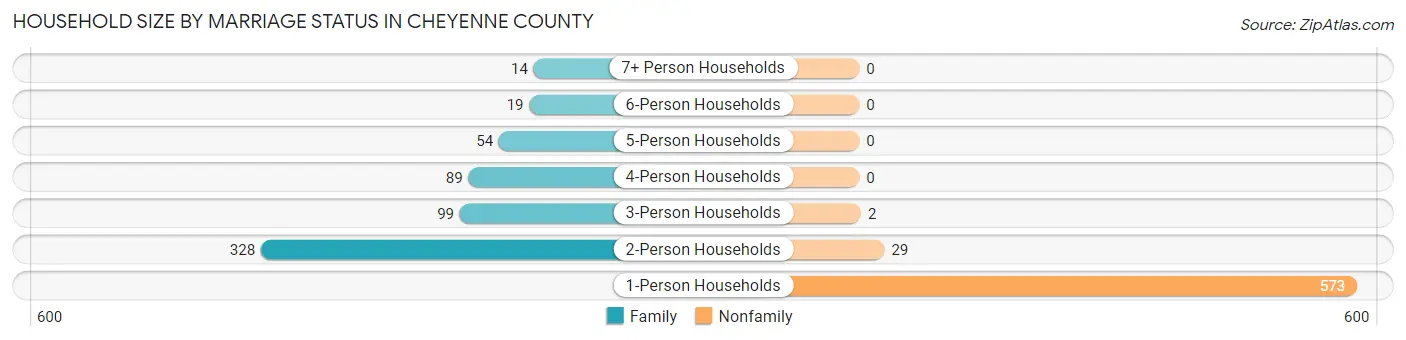
| Household Size | Family Households | Nonfamily Households |
| 1-Person Households | - | 573 (47.5%) |
| 2-Person Households | 328 (27.2%) | 29 (2.4%) |
| 3-Person Households | 99 (8.2%) | 2 (0.2%) |
| 4-Person Households | 89 (7.4%) | 0 (0.0%) |
| 5-Person Households | 54 (4.5%) | 0 (0.0%) |
| 6-Person Households | 19 (1.6%) | 0 (0.0%) |
| 7+ Person Households | 14 (1.2%) | 0 (0.0%) |
| Total | 603 (50.0%) | 604 (50.0%) |
Female Fertility in Cheyenne County
Fertility by Age in Cheyenne County
| Age Bracket | Women with Births | Births / 1,000 Women |
| 15 to 19 years | 0 (0.0%) | 0.0 |
| 20 to 34 years | 0 (0.0%) | 0.0 |
| 35 to 50 years | 0 (0.0%) | 0.0 |
| Total | 0 (0.0%) | 0.0 |
Fertility by Age by Marriage Status in Cheyenne County
| Age Bracket | Married | Unmarried |
| 15 to 19 years | 0 (0.0%) | 0 (0.0%) |
| 20 to 34 years | 0 (0.0%) | 0 (0.0%) |
| 35 to 50 years | 0 (0.0%) | 0 (0.0%) |
| Total | 0 (0.0%) | 0 (0.0%) |
Fertility by Education in Cheyenne County
| Educational Attainment | Women with Births | Births / 1,000 Women |
| Less than High School | 0 (0.0%) | 0.0 |
| High School Diploma | 0 (0.0%) | 0.0 |
| College or Associate's Degree | 0 (0.0%) | 0.0 |
| Bachelor's Degree | 0 (0.0%) | 0.0 |
| Graduate Degree | 0 (0.0%) | 0.0 |
| Total | 0 (0.0%) | 0.0 |
Fertility by Education by Marriage Status in Cheyenne County
| Educational Attainment | Married | Unmarried |
| Less than High School | 0 (0.0%) | 0 (0.0%) |
| High School Diploma | 0 (0.0%) | 0 (0.0%) |
| College or Associate's Degree | 0 (0.0%) | 0 (0.0%) |
| Bachelor's Degree | 0 (0.0%) | 0 (0.0%) |
| Graduate Degree | 0 (0.0%) | 0 (0.0%) |
| Total | 0 (0.0%) | 0 (0.0%) |
Employment Characteristics in Cheyenne County
Employment by Class of Employer in Cheyenne County
Among the 1,261 employed individuals in Cheyenne County, private company employees (654 | 51.9%), self-employed (not incorporated) (208 | 16.5%), and local government employees (147 | 11.7%) make up the most common classes of employment.
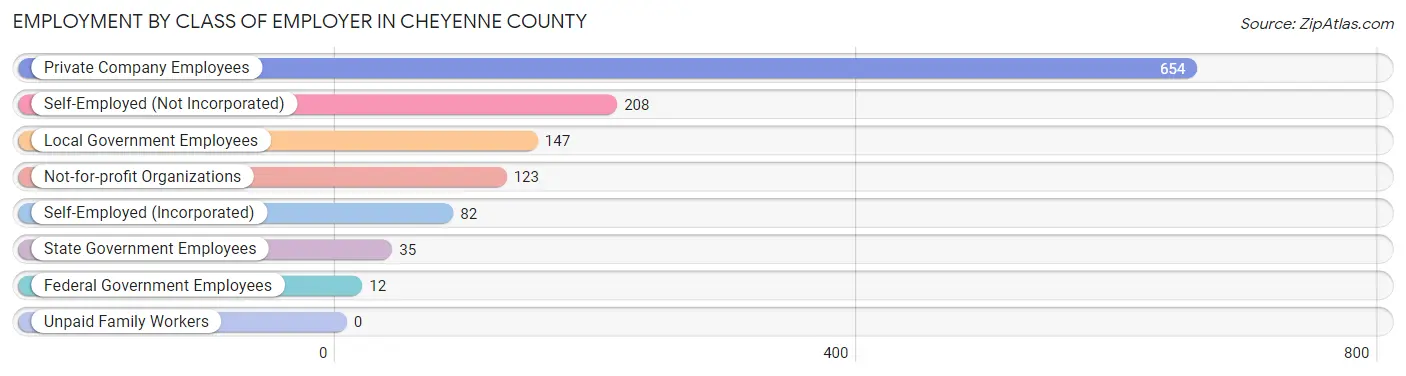
| Employer Class | # Employees | % Employees |
| Private Company Employees | 654 | 51.9% |
| Self-Employed (Incorporated) | 82 | 6.5% |
| Self-Employed (Not Incorporated) | 208 | 16.5% |
| Not-for-profit Organizations | 123 | 9.8% |
| Local Government Employees | 147 | 11.7% |
| State Government Employees | 35 | 2.8% |
| Federal Government Employees | 12 | 0.9% |
| Unpaid Family Workers | 0 | 0.0% |
| Total | 1,261 | 100.0% |
Employment Status by Age in Cheyenne County
According to the labor force statistics for Cheyenne County, out of the total population over 16 years of age (2,113), 62.0% or 1,310 individuals are in the labor force, with 1.8% or 24 of them unemployed. The age group with the highest labor force participation rate is 30 to 34 years, with 100.0% or 123 individuals in the labor force. Within the labor force, the 55 to 59 years age range has the highest percentage of unemployed individuals, with 7.1% or 8 of them being unemployed.
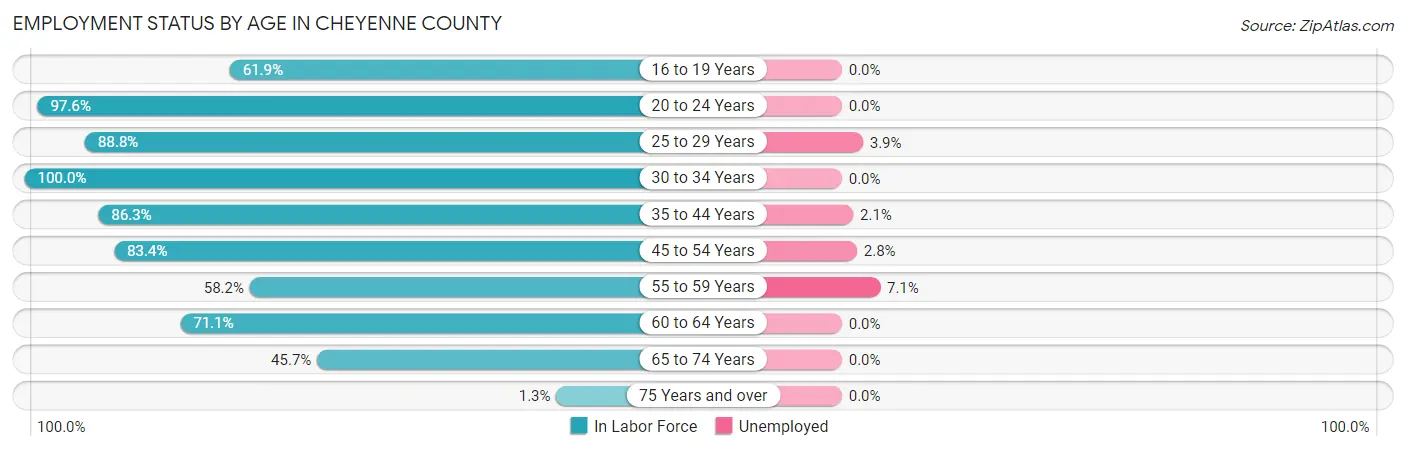
| Age Bracket | In Labor Force | Unemployed |
| 16 to 19 Years | 91 (61.9%) | 0 (0.0%) |
| 20 to 24 Years | 82 (97.6%) | 0 (0.0%) |
| 25 to 29 Years | 103 (88.8%) | 4 (3.9%) |
| 30 to 34 Years | 123 (100.0%) | 0 (0.0%) |
| 35 to 44 Years | 333 (86.3%) | 7 (2.1%) |
| 45 to 54 Years | 141 (83.4%) | 4 (2.8%) |
| 55 to 59 Years | 113 (58.2%) | 8 (7.1%) |
| 60 to 64 Years | 155 (71.1%) | 0 (0.0%) |
| 65 to 74 Years | 165 (45.7%) | 0 (0.0%) |
| 75 Years and over | 4 (1.3%) | 0 (0.0%) |
| Total | 1,310 (62.0%) | 24 (1.8%) |
Employment Status by Educational Attainment in Cheyenne County
According to labor force statistics for Cheyenne County, 80.3% of individuals (968) out of the total population between 25 and 64 years of age (1,206) are in the labor force, with 2.4% or 23 of them being unemployed. The group with the highest labor force participation rate are those with the educational attainment of college / associate degree, with 88.3% or 378 individuals in the labor force. Within the labor force, individuals with high school diploma education have the highest percentage of unemployment, with 5.0% or 12 of them being unemployed.
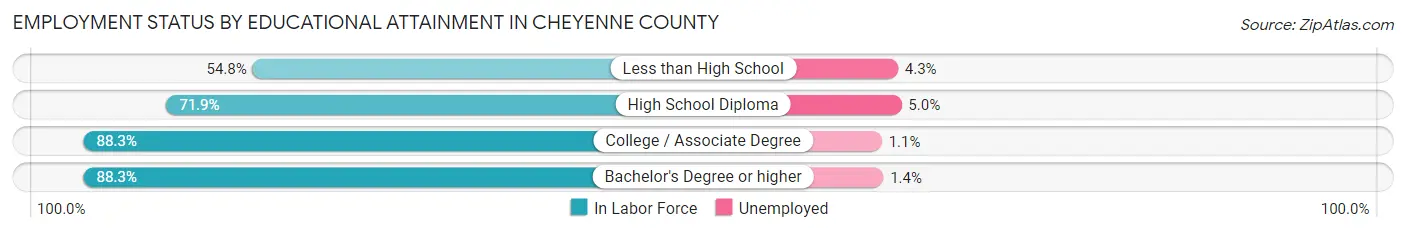
| Educational Attainment | In Labor Force | Unemployed |
| Less than High School | 69 (54.8%) | 5 (4.3%) |
| High School Diploma | 241 (71.9%) | 17 (5.0%) |
| College / Associate Degree | 378 (88.3%) | 5 (1.1%) |
| Bachelor's Degree or higher | 280 (88.3%) | 4 (1.4%) |
| Total | 968 (80.3%) | 29 (2.4%) |
Employment Occupations by Sex in Cheyenne County
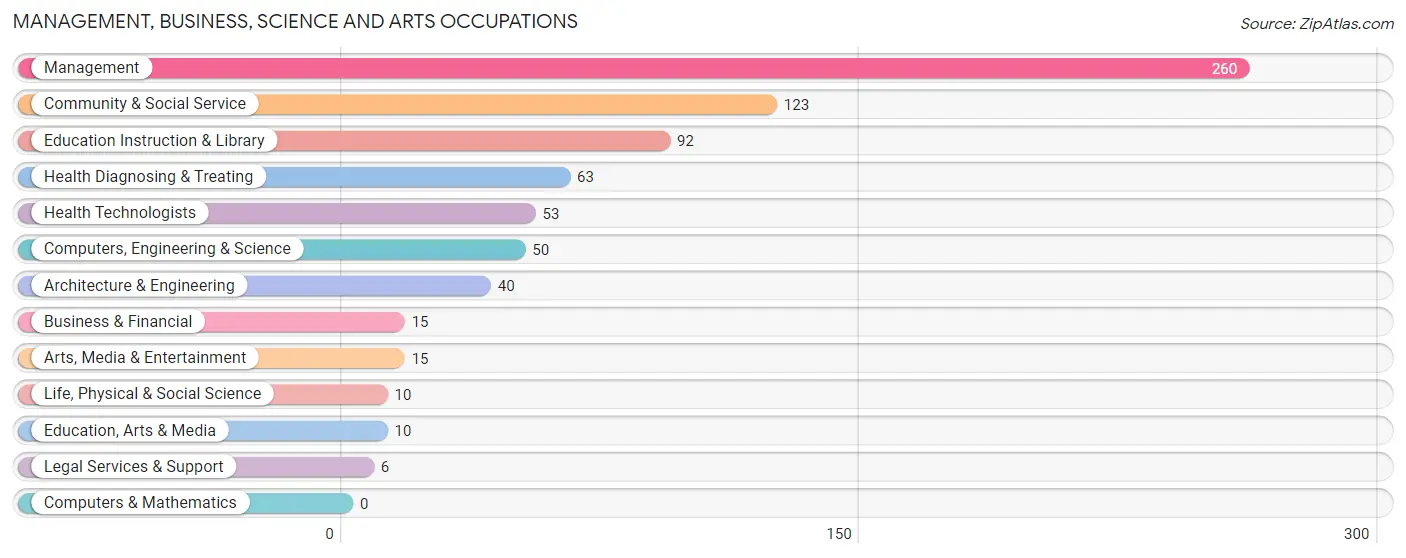
Management, Business, Science and Arts Occupations
The most common Management, Business, Science and Arts occupations in Cheyenne County are Management (260 | 20.3%), Community & Social Service (123 | 9.6%), Education Instruction & Library (92 | 7.2%), Health Diagnosing & Treating (63 | 4.9%), and Health Technologists (53 | 4.1%).
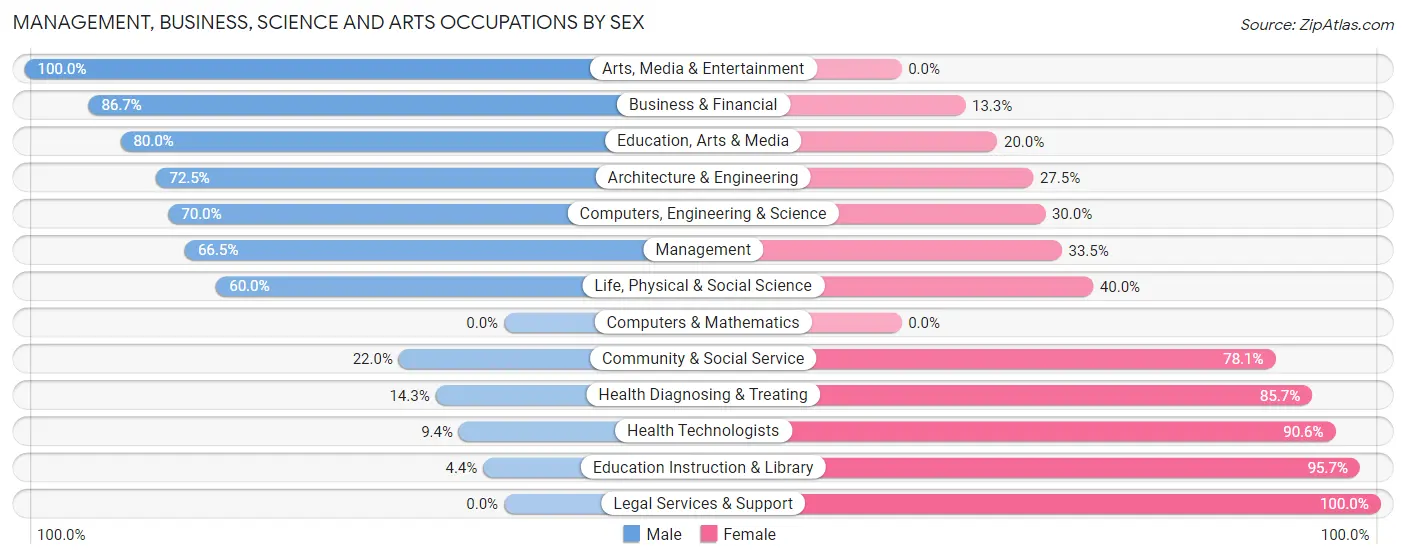
Management, Business, Science and Arts Occupations by Sex
Within the Management, Business, Science and Arts occupations in Cheyenne County, the most male-oriented occupations are Arts, Media & Entertainment (100.0%), Business & Financial (86.7%), and Education, Arts & Media (80.0%), while the most female-oriented occupations are Legal Services & Support (100.0%), Education Instruction & Library (95.7%), and Health Technologists (90.6%).
| Occupation | Male | Female |
| Management | 173 (66.5%) | 87 (33.5%) |
| Business & Financial | 13 (86.7%) | 2 (13.3%) |
| Computers, Engineering & Science | 35 (70.0%) | 15 (30.0%) |
| Computers & Mathematics | 0 (0.0%) | 0 (0.0%) |
| Architecture & Engineering | 29 (72.5%) | 11 (27.5%) |
| Life, Physical & Social Science | 6 (60.0%) | 4 (40.0%) |
| Community & Social Service | 27 (22.0%) | 96 (78.0%) |
| Education, Arts & Media | 8 (80.0%) | 2 (20.0%) |
| Legal Services & Support | 0 (0.0%) | 6 (100.0%) |
| Education Instruction & Library | 4 (4.3%) | 88 (95.7%) |
| Arts, Media & Entertainment | 15 (100.0%) | 0 (0.0%) |
| Health Diagnosing & Treating | 9 (14.3%) | 54 (85.7%) |
| Health Technologists | 5 (9.4%) | 48 (90.6%) |
| Total (Category) | 257 (50.3%) | 254 (49.7%) |
| Total (Overall) | 708 (55.1%) | 576 (44.9%) |
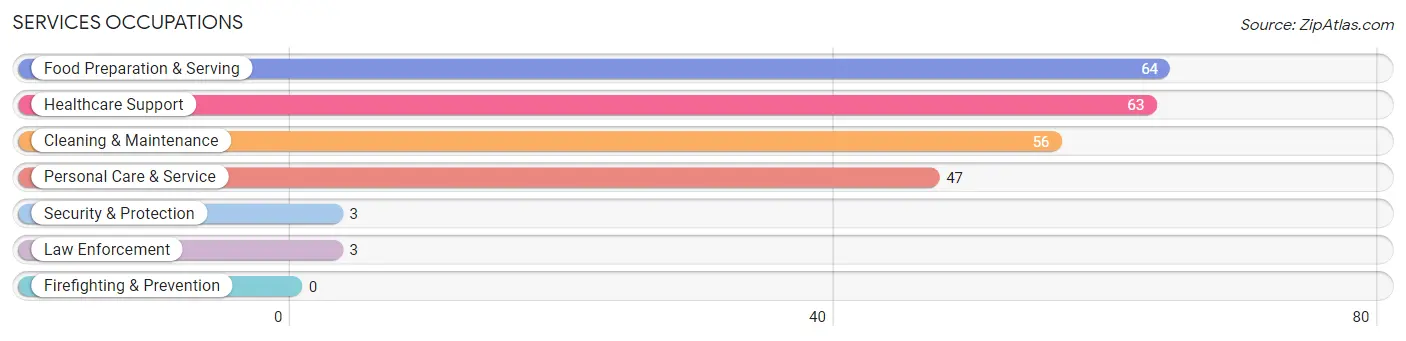
Services Occupations
The most common Services occupations in Cheyenne County are Food Preparation & Serving (64 | 5.0%), Healthcare Support (63 | 4.9%), Cleaning & Maintenance (56 | 4.4%), Personal Care & Service (47 | 3.7%), and Security & Protection (3 | 0.2%).
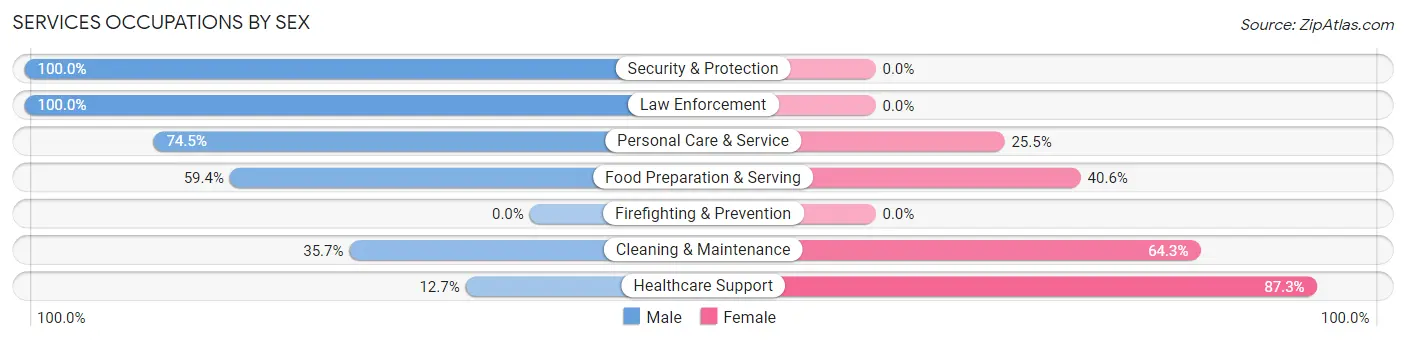
Services Occupations by Sex
Within the Services occupations in Cheyenne County, the most male-oriented occupations are Security & Protection (100.0%), Law Enforcement (100.0%), and Personal Care & Service (74.5%), while the most female-oriented occupations are Healthcare Support (87.3%), Cleaning & Maintenance (64.3%), and Food Preparation & Serving (40.6%).
| Occupation | Male | Female |
| Healthcare Support | 8 (12.7%) | 55 (87.3%) |
| Security & Protection | 3 (100.0%) | 0 (0.0%) |
| Firefighting & Prevention | 0 (0.0%) | 0 (0.0%) |
| Law Enforcement | 3 (100.0%) | 0 (0.0%) |
| Food Preparation & Serving | 38 (59.4%) | 26 (40.6%) |
| Cleaning & Maintenance | 20 (35.7%) | 36 (64.3%) |
| Personal Care & Service | 35 (74.5%) | 12 (25.5%) |
| Total (Category) | 104 (44.6%) | 129 (55.4%) |
| Total (Overall) | 708 (55.1%) | 576 (44.9%) |
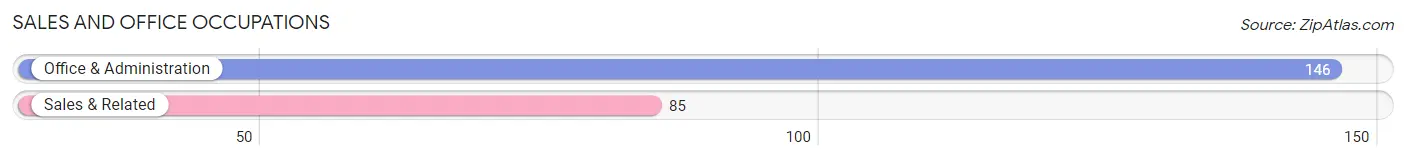
Sales and Office Occupations
The most common Sales and Office occupations in Cheyenne County are Office & Administration (146 | 11.4%), and Sales & Related (85 | 6.6%).
Sales and Office Occupations by Sex
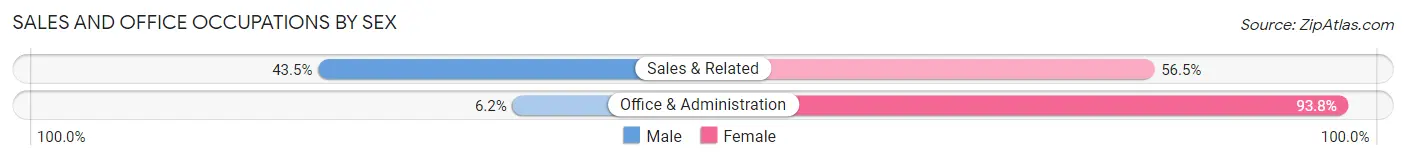
| Occupation | Male | Female |
| Sales & Related | 37 (43.5%) | 48 (56.5%) |
| Office & Administration | 9 (6.2%) | 137 (93.8%) |
| Total (Category) | 46 (19.9%) | 185 (80.1%) |
| Total (Overall) | 708 (55.1%) | 576 (44.9%) |
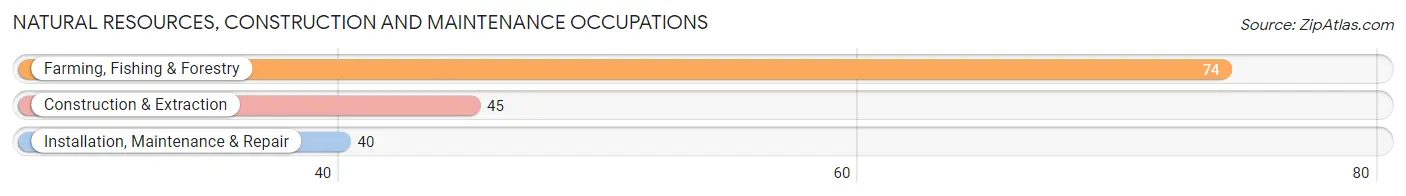
Natural Resources, Construction and Maintenance Occupations
The most common Natural Resources, Construction and Maintenance occupations in Cheyenne County are Farming, Fishing & Forestry (74 | 5.8%), Construction & Extraction (45 | 3.5%), and Installation, Maintenance & Repair (40 | 3.1%).
Natural Resources, Construction and Maintenance Occupations by Sex
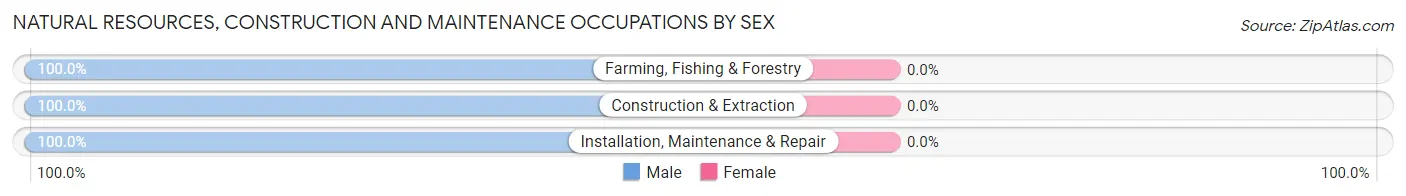
| Occupation | Male | Female |
| Farming, Fishing & Forestry | 74 (100.0%) | 0 (0.0%) |
| Construction & Extraction | 45 (100.0%) | 0 (0.0%) |
| Installation, Maintenance & Repair | 40 (100.0%) | 0 (0.0%) |
| Total (Category) | 159 (100.0%) | 0 (0.0%) |
| Total (Overall) | 708 (55.1%) | 576 (44.9%) |
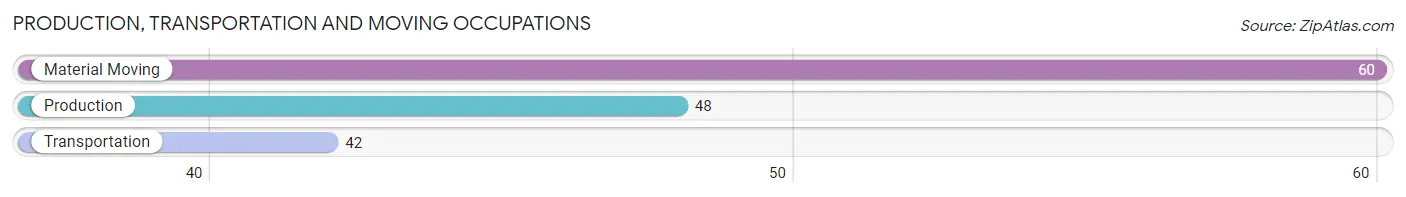
Production, Transportation and Moving Occupations
The most common Production, Transportation and Moving occupations in Cheyenne County are Material Moving (60 | 4.7%), Production (48 | 3.7%), and Transportation (42 | 3.3%).
Production, Transportation and Moving Occupations by Sex
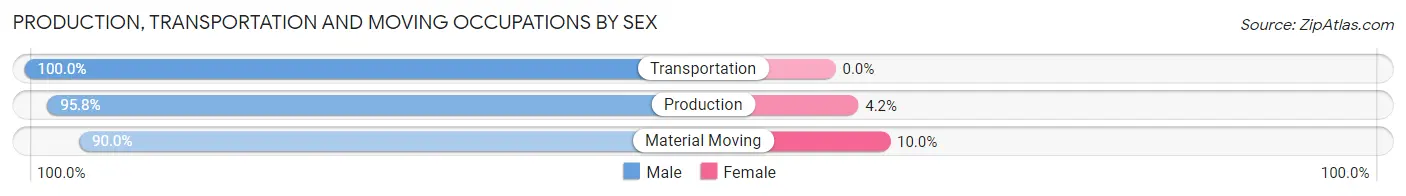
| Occupation | Male | Female |
| Production | 46 (95.8%) | 2 (4.2%) |
| Transportation | 42 (100.0%) | 0 (0.0%) |
| Material Moving | 54 (90.0%) | 6 (10.0%) |
| Total (Category) | 142 (94.7%) | 8 (5.3%) |
| Total (Overall) | 708 (55.1%) | 576 (44.9%) |
Employment Industries by Sex in Cheyenne County
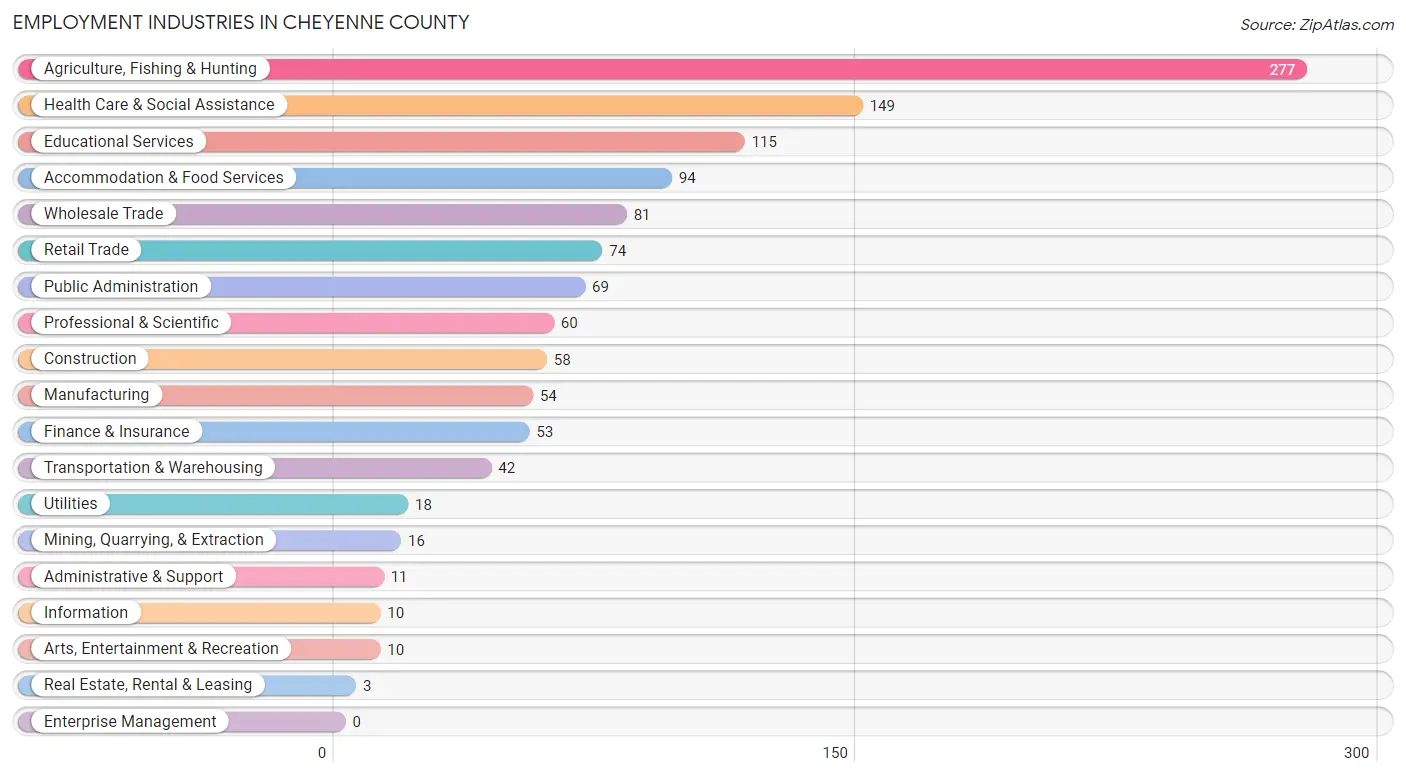
Employment Industries in Cheyenne County
The major employment industries in Cheyenne County include Agriculture, Fishing & Hunting (277 | 21.6%), Health Care & Social Assistance (149 | 11.6%), Educational Services (115 | 9.0%), Accommodation & Food Services (94 | 7.3%), and Wholesale Trade (81 | 6.3%).
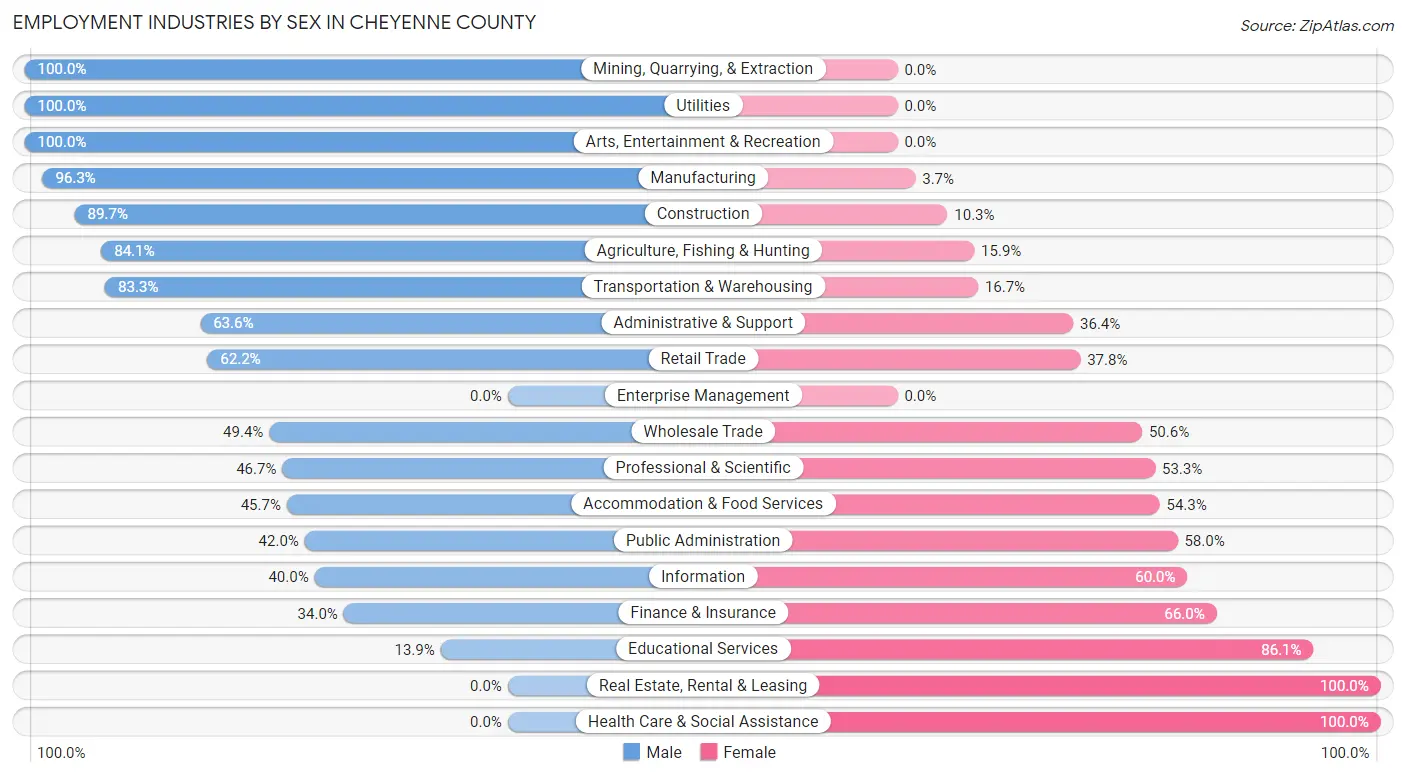
Employment Industries by Sex in Cheyenne County
The Cheyenne County industries that see more men than women are Mining, Quarrying, & Extraction (100.0%), Utilities (100.0%), and Arts, Entertainment & Recreation (100.0%), whereas the industries that tend to have a higher number of women are Real Estate, Rental & Leasing (100.0%), Health Care & Social Assistance (100.0%), and Educational Services (86.1%).
| Industry | Male | Female |
| Agriculture, Fishing & Hunting | 233 (84.1%) | 44 (15.9%) |
| Mining, Quarrying, & Extraction | 16 (100.0%) | 0 (0.0%) |
| Construction | 52 (89.7%) | 6 (10.3%) |
| Manufacturing | 52 (96.3%) | 2 (3.7%) |
| Wholesale Trade | 40 (49.4%) | 41 (50.6%) |
| Retail Trade | 46 (62.2%) | 28 (37.8%) |
| Transportation & Warehousing | 35 (83.3%) | 7 (16.7%) |
| Utilities | 18 (100.0%) | 0 (0.0%) |
| Information | 4 (40.0%) | 6 (60.0%) |
| Finance & Insurance | 18 (34.0%) | 35 (66.0%) |
| Real Estate, Rental & Leasing | 0 (0.0%) | 3 (100.0%) |
| Professional & Scientific | 28 (46.7%) | 32 (53.3%) |
| Enterprise Management | 0 (0.0%) | 0 (0.0%) |
| Administrative & Support | 7 (63.6%) | 4 (36.4%) |
| Educational Services | 16 (13.9%) | 99 (86.1%) |
| Health Care & Social Assistance | 0 (0.0%) | 149 (100.0%) |
| Arts, Entertainment & Recreation | 10 (100.0%) | 0 (0.0%) |
| Accommodation & Food Services | 43 (45.7%) | 51 (54.3%) |
| Public Administration | 29 (42.0%) | 40 (58.0%) |
| Total | 708 (55.1%) | 576 (44.9%) |
Education in Cheyenne County
School Enrollment in Cheyenne County
The most common levels of schooling among the 585 students in Cheyenne County are high school (151 | 25.8%), elementary school (141 | 24.1%), and middle school (130 | 22.2%).
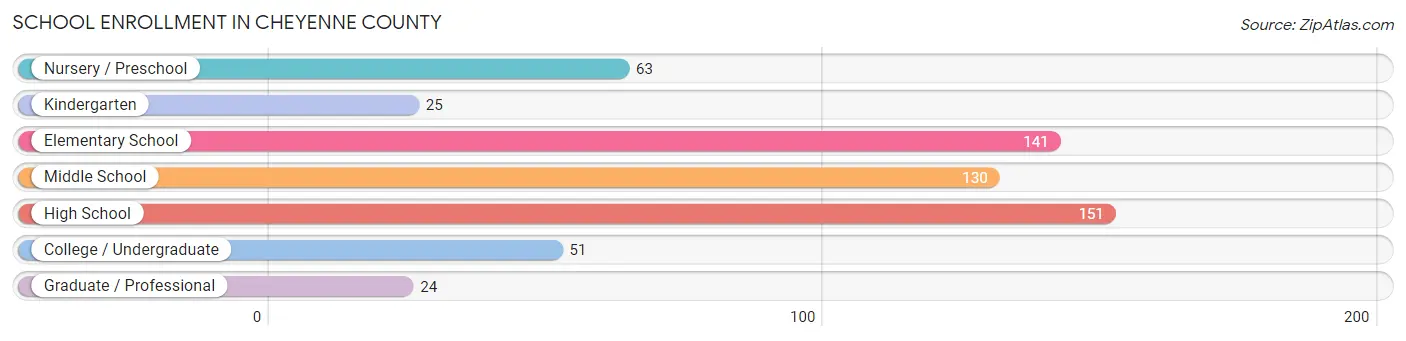
| School Level | # Students | % Students |
| Nursery / Preschool | 63 | 10.8% |
| Kindergarten | 25 | 4.3% |
| Elementary School | 141 | 24.1% |
| Middle School | 130 | 22.2% |
| High School | 151 | 25.8% |
| College / Undergraduate | 51 | 8.7% |
| Graduate / Professional | 24 | 4.1% |
| Total | 585 | 100.0% |
School Enrollment by Age by Funding Source in Cheyenne County
Out of a total of 585 students who are enrolled in schools in Cheyenne County, 30 (5.1%) attend a private institution, while the remaining 555 (94.9%) are enrolled in public schools. The age group of 25 to 34 year olds has the highest likelihood of being enrolled in private schools, with 4 (50.0% in the age bracket) enrolled. Conversely, the age group of 3 to 4 year olds has the lowest likelihood of being enrolled in a private school, with 43 (100.0% in the age bracket) attending a public institution.
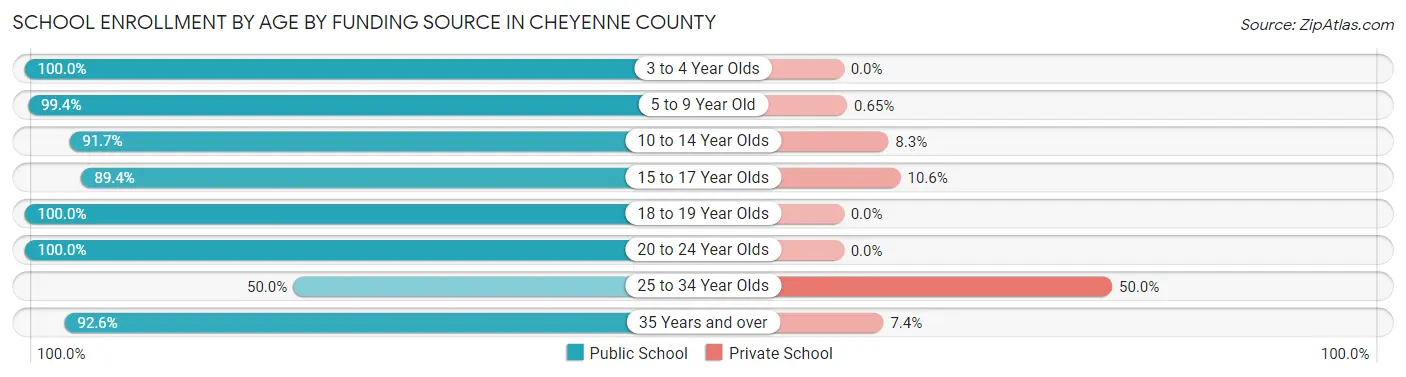
| Age Bracket | Public School | Private School |
| 3 to 4 Year Olds | 43 (100.0%) | 0 (0.0%) |
| 5 to 9 Year Old | 153 (99.4%) | 1 (0.6%) |
| 10 to 14 Year Olds | 154 (91.7%) | 14 (8.3%) |
| 15 to 17 Year Olds | 76 (89.4%) | 9 (10.6%) |
| 18 to 19 Year Olds | 90 (100.0%) | 0 (0.0%) |
| 20 to 24 Year Olds | 10 (100.0%) | 0 (0.0%) |
| 25 to 34 Year Olds | 4 (50.0%) | 4 (50.0%) |
| 35 Years and over | 25 (92.6%) | 2 (7.4%) |
| Total | 555 (94.9%) | 30 (5.1%) |
Educational Attainment by Field of Study in Cheyenne County
Education (100 | 21.7%), bio, nature & agricultural (85 | 18.4%), business (74 | 16.1%), arts & humanities (61 | 13.2%), and science & technology (54 | 11.7%) are the most common fields of study among 461 individuals in Cheyenne County who have obtained a bachelor's degree or higher.
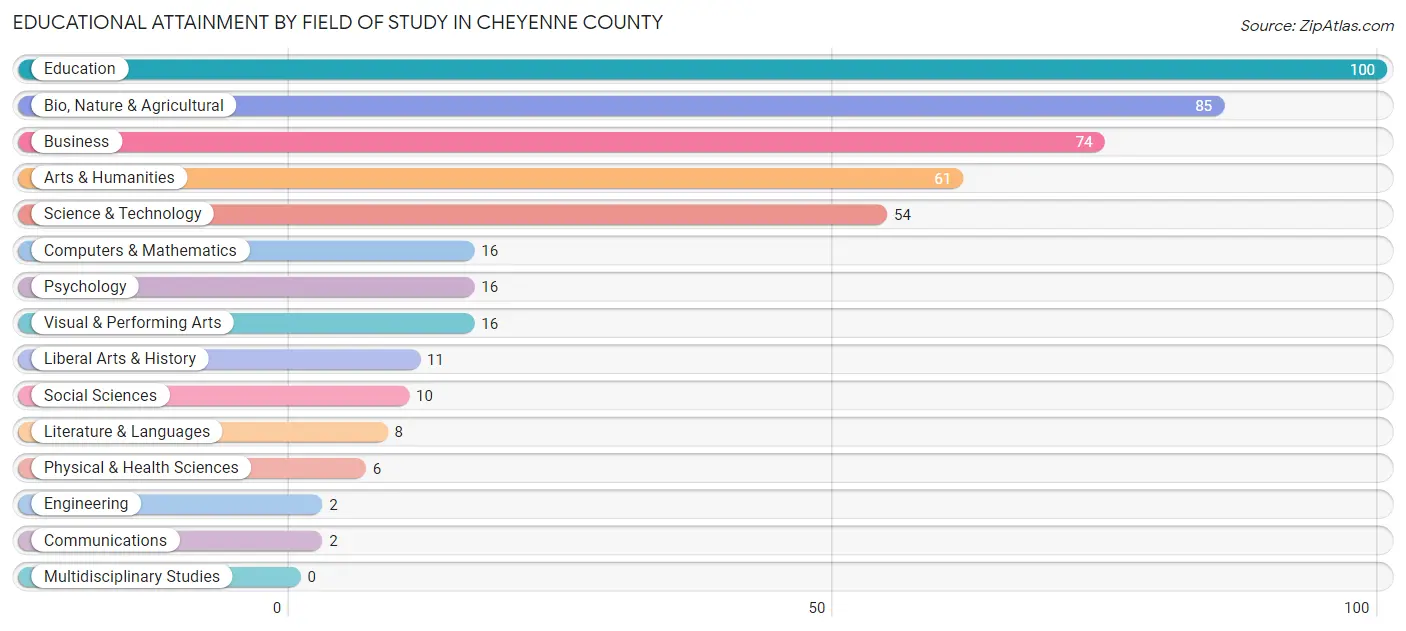
| Field of Study | # Graduates | % Graduates |
| Computers & Mathematics | 16 | 3.5% |
| Bio, Nature & Agricultural | 85 | 18.4% |
| Physical & Health Sciences | 6 | 1.3% |
| Psychology | 16 | 3.5% |
| Social Sciences | 10 | 2.2% |
| Engineering | 2 | 0.4% |
| Multidisciplinary Studies | 0 | 0.0% |
| Science & Technology | 54 | 11.7% |
| Business | 74 | 16.1% |
| Education | 100 | 21.7% |
| Literature & Languages | 8 | 1.7% |
| Liberal Arts & History | 11 | 2.4% |
| Visual & Performing Arts | 16 | 3.5% |
| Communications | 2 | 0.4% |
| Arts & Humanities | 61 | 13.2% |
| Total | 461 | 100.0% |
Transportation & Commute in Cheyenne County
Vehicle Availability by Sex in Cheyenne County
The most prevalent vehicle ownership categories in Cheyenne County are males with 2 vehicles (269, accounting for 38.5%) and females with 2 vehicles (211, making up 47.9%).
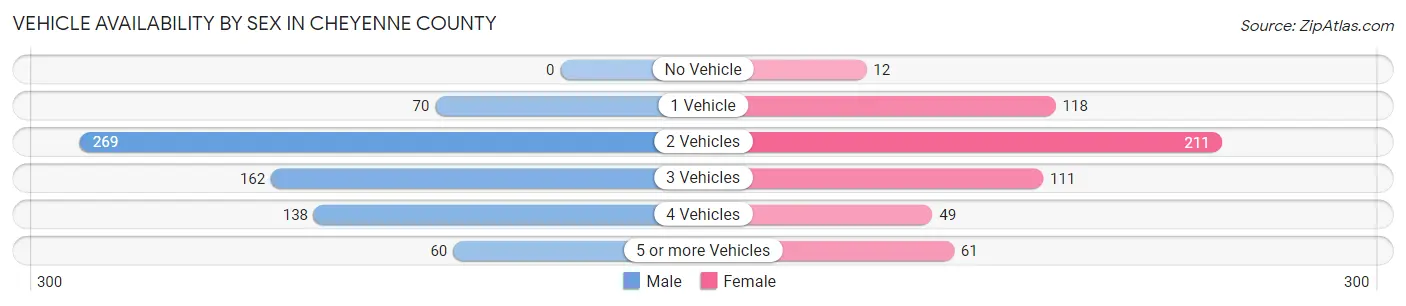
| Vehicles Available | Male | Female |
| No Vehicle | 0 (0.0%) | 12 (2.1%) |
| 1 Vehicle | 70 (10.0%) | 118 (21.0%) |
| 2 Vehicles | 269 (38.5%) | 211 (37.5%) |
| 3 Vehicles | 162 (23.2%) | 111 (19.8%) |
| 4 Vehicles | 138 (19.7%) | 49 (8.7%) |
| 5 or more Vehicles | 60 (8.6%) | 61 (10.8%) |
| Total | 699 (100.0%) | 562 (100.0%) |
Commute Time in Cheyenne County
The most frequently occuring commute durations in Cheyenne County are less than 5 minutes (389 commuters, 36.0%), 5 to 9 minutes (228 commuters, 21.1%), and 15 to 19 minutes (120 commuters, 11.1%).
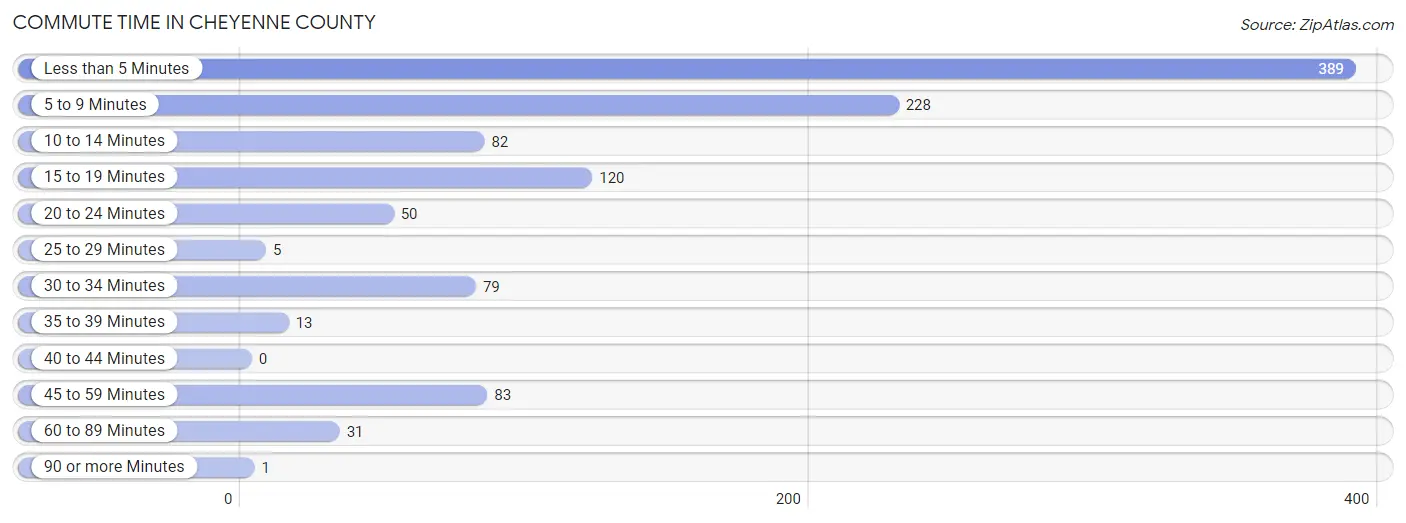
| Commute Time | # Commuters | % Commuters |
| Less than 5 Minutes | 389 | 36.0% |
| 5 to 9 Minutes | 228 | 21.1% |
| 10 to 14 Minutes | 82 | 7.6% |
| 15 to 19 Minutes | 120 | 11.1% |
| 20 to 24 Minutes | 50 | 4.6% |
| 25 to 29 Minutes | 5 | 0.5% |
| 30 to 34 Minutes | 79 | 7.3% |
| 35 to 39 Minutes | 13 | 1.2% |
| 40 to 44 Minutes | 0 | 0.0% |
| 45 to 59 Minutes | 83 | 7.7% |
| 60 to 89 Minutes | 31 | 2.9% |
| 90 or more Minutes | 1 | 0.1% |
Commute Time by Sex in Cheyenne County
The most common commute times in Cheyenne County are less than 5 minutes (177 commuters, 31.8%) for males and less than 5 minutes (212 commuters, 40.4%) for females.
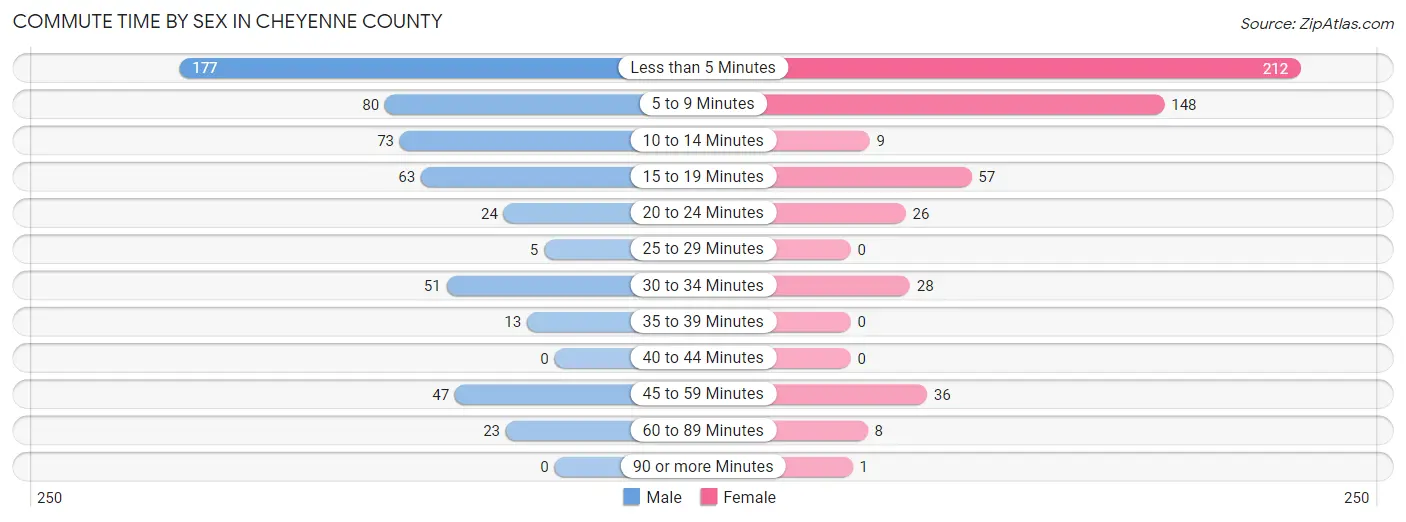
| Commute Time | Male | Female |
| Less than 5 Minutes | 177 (31.8%) | 212 (40.4%) |
| 5 to 9 Minutes | 80 (14.4%) | 148 (28.2%) |
| 10 to 14 Minutes | 73 (13.1%) | 9 (1.7%) |
| 15 to 19 Minutes | 63 (11.3%) | 57 (10.9%) |
| 20 to 24 Minutes | 24 (4.3%) | 26 (5.0%) |
| 25 to 29 Minutes | 5 (0.9%) | 0 (0.0%) |
| 30 to 34 Minutes | 51 (9.2%) | 28 (5.3%) |
| 35 to 39 Minutes | 13 (2.3%) | 0 (0.0%) |
| 40 to 44 Minutes | 0 (0.0%) | 0 (0.0%) |
| 45 to 59 Minutes | 47 (8.5%) | 36 (6.9%) |
| 60 to 89 Minutes | 23 (4.1%) | 8 (1.5%) |
| 90 or more Minutes | 0 (0.0%) | 1 (0.2%) |
Time of Departure to Work by Sex in Cheyenne County
The most frequent times of departure to work in Cheyenne County are 7:30 AM to 7:59 AM (168, 30.2%) for males and 7:30 AM to 7:59 AM (149, 28.4%) for females.
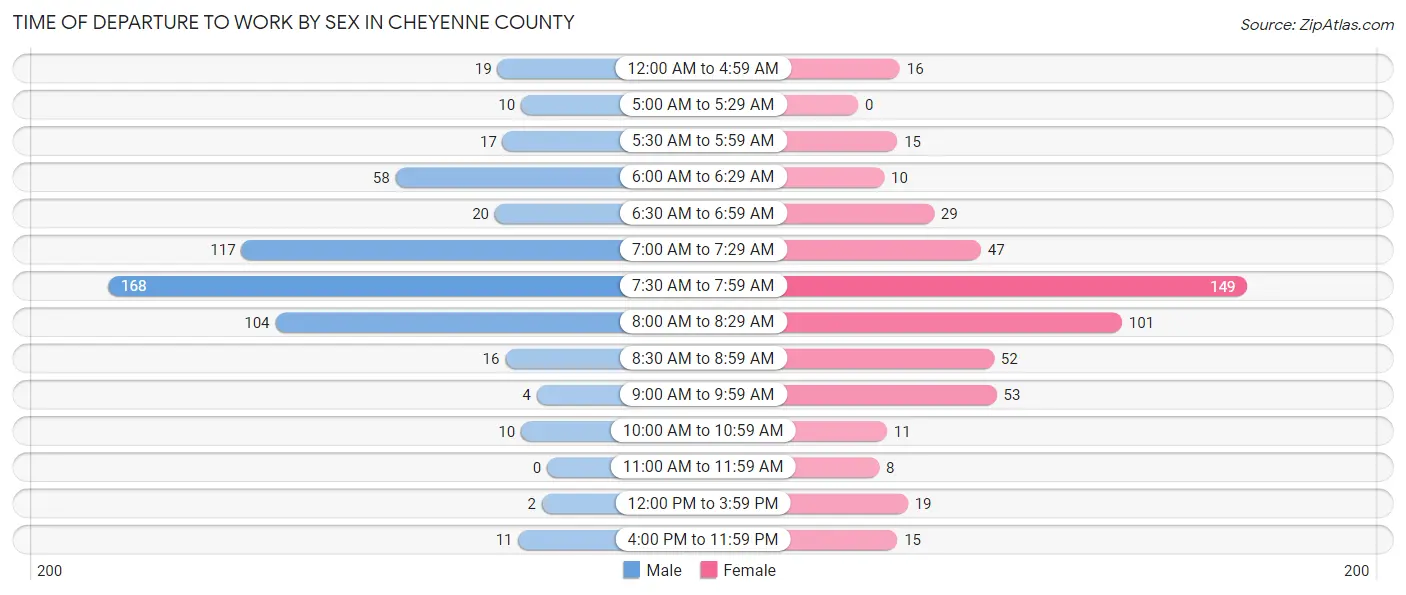
| Time of Departure | Male | Female |
| 12:00 AM to 4:59 AM | 19 (3.4%) | 16 (3.0%) |
| 5:00 AM to 5:29 AM | 10 (1.8%) | 0 (0.0%) |
| 5:30 AM to 5:59 AM | 17 (3.1%) | 15 (2.9%) |
| 6:00 AM to 6:29 AM | 58 (10.4%) | 10 (1.9%) |
| 6:30 AM to 6:59 AM | 20 (3.6%) | 29 (5.5%) |
| 7:00 AM to 7:29 AM | 117 (21.0%) | 47 (8.9%) |
| 7:30 AM to 7:59 AM | 168 (30.2%) | 149 (28.4%) |
| 8:00 AM to 8:29 AM | 104 (18.7%) | 101 (19.2%) |
| 8:30 AM to 8:59 AM | 16 (2.9%) | 52 (9.9%) |
| 9:00 AM to 9:59 AM | 4 (0.7%) | 53 (10.1%) |
| 10:00 AM to 10:59 AM | 10 (1.8%) | 11 (2.1%) |
| 11:00 AM to 11:59 AM | 0 (0.0%) | 8 (1.5%) |
| 12:00 PM to 3:59 PM | 2 (0.4%) | 19 (3.6%) |
| 4:00 PM to 11:59 PM | 11 (2.0%) | 15 (2.9%) |
| Total | 556 (100.0%) | 525 (100.0%) |
Housing Occupancy in Cheyenne County
Occupancy by Ownership in Cheyenne County
Of the total 1,207 dwellings in Cheyenne County, owner-occupied units account for 955 (79.1%), while renter-occupied units make up 252 (20.9%).
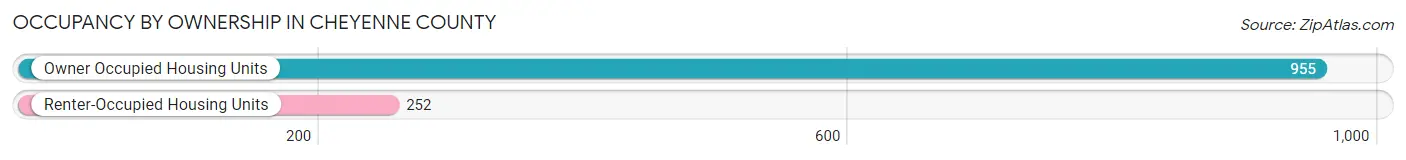
| Occupancy | # Housing Units | % Housing Units |
| Owner Occupied Housing Units | 955 | 79.1% |
| Renter-Occupied Housing Units | 252 | 20.9% |
| Total Occupied Housing Units | 1,207 | 100.0% |
Occupancy by Household Size in Cheyenne County
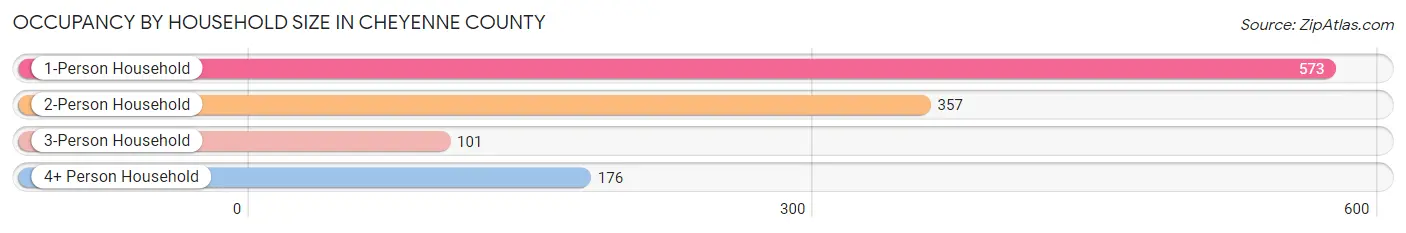
| Household Size | # Housing Units | % Housing Units |
| 1-Person Household | 573 | 47.5% |
| 2-Person Household | 357 | 29.6% |
| 3-Person Household | 101 | 8.4% |
| 4+ Person Household | 176 | 14.6% |
| Total Housing Units | 1,207 | 100.0% |
Occupancy by Ownership by Household Size in Cheyenne County
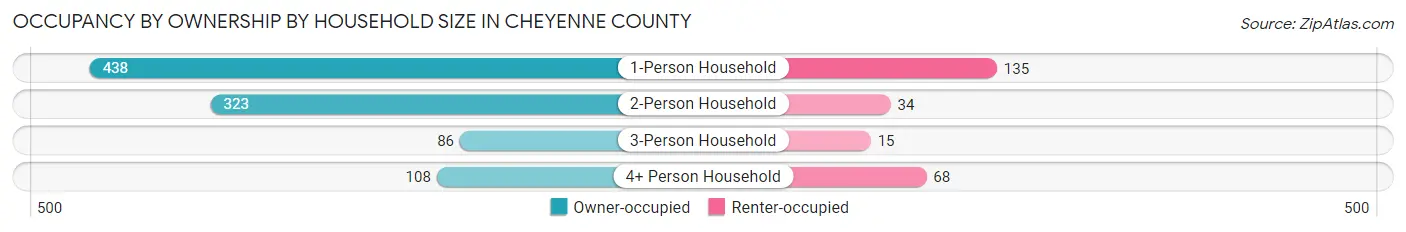
| Household Size | Owner-occupied | Renter-occupied |
| 1-Person Household | 438 (76.4%) | 135 (23.6%) |
| 2-Person Household | 323 (90.5%) | 34 (9.5%) |
| 3-Person Household | 86 (85.2%) | 15 (14.8%) |
| 4+ Person Household | 108 (61.4%) | 68 (38.6%) |
| Total Housing Units | 955 (79.1%) | 252 (20.9%) |
Occupancy by Educational Attainment in Cheyenne County
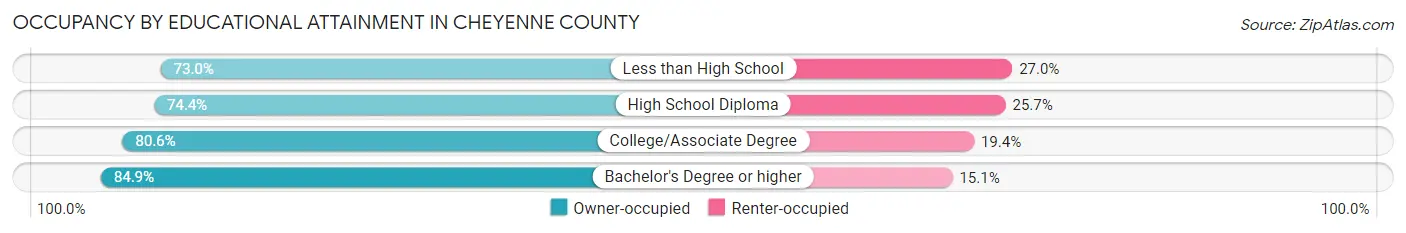
| Household Size | Owner-occupied | Renter-occupied |
| Less than High School | 65 (73.0%) | 24 (27.0%) |
| High School Diploma | 287 (74.4%) | 99 (25.7%) |
| College/Associate Degree | 345 (80.6%) | 83 (19.4%) |
| Bachelor's Degree or higher | 258 (84.9%) | 46 (15.1%) |
Occupancy by Age of Householder in Cheyenne County
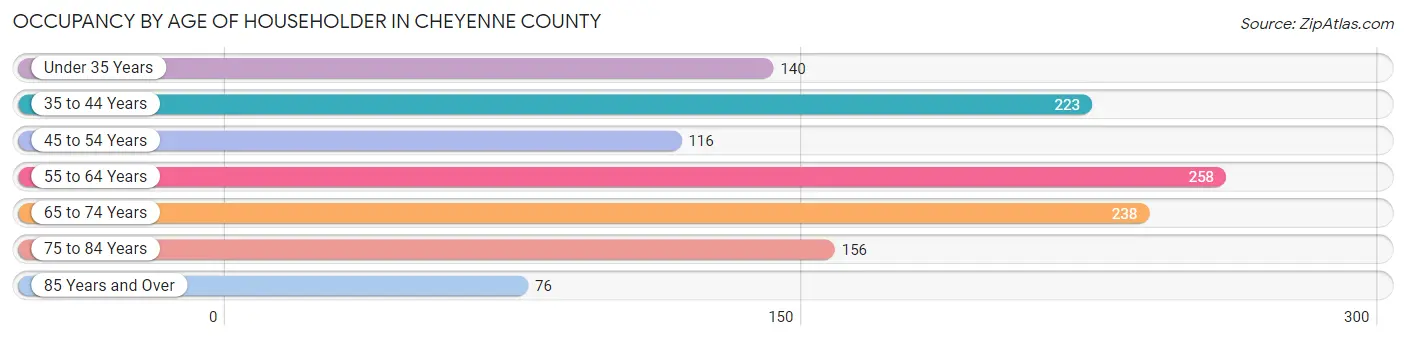
| Age Bracket | # Households | % Households |
| Under 35 Years | 140 | 11.6% |
| 35 to 44 Years | 223 | 18.5% |
| 45 to 54 Years | 116 | 9.6% |
| 55 to 64 Years | 258 | 21.4% |
| 65 to 74 Years | 238 | 19.7% |
| 75 to 84 Years | 156 | 12.9% |
| 85 Years and Over | 76 | 6.3% |
| Total | 1,207 | 100.0% |
Housing Finances in Cheyenne County
Median Income by Occupancy in Cheyenne County
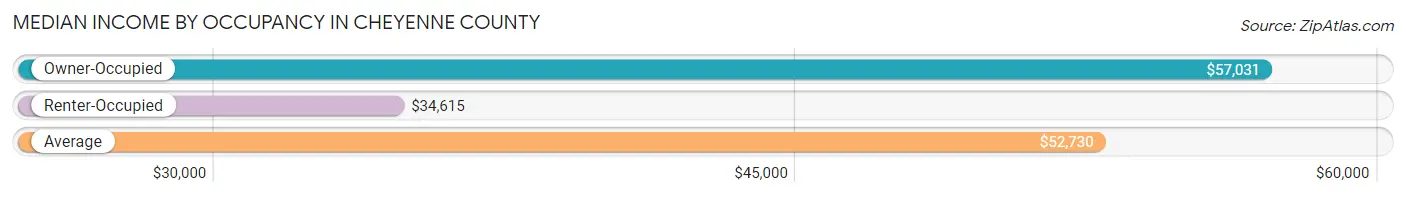
| Occupancy Type | # Households | Median Income |
| Owner-Occupied | 955 (79.1%) | $57,031 |
| Renter-Occupied | 252 (20.9%) | $34,615 |
| Average | 1,207 (100.0%) | $52,730 |
Occupancy by Householder Income Bracket in Cheyenne County
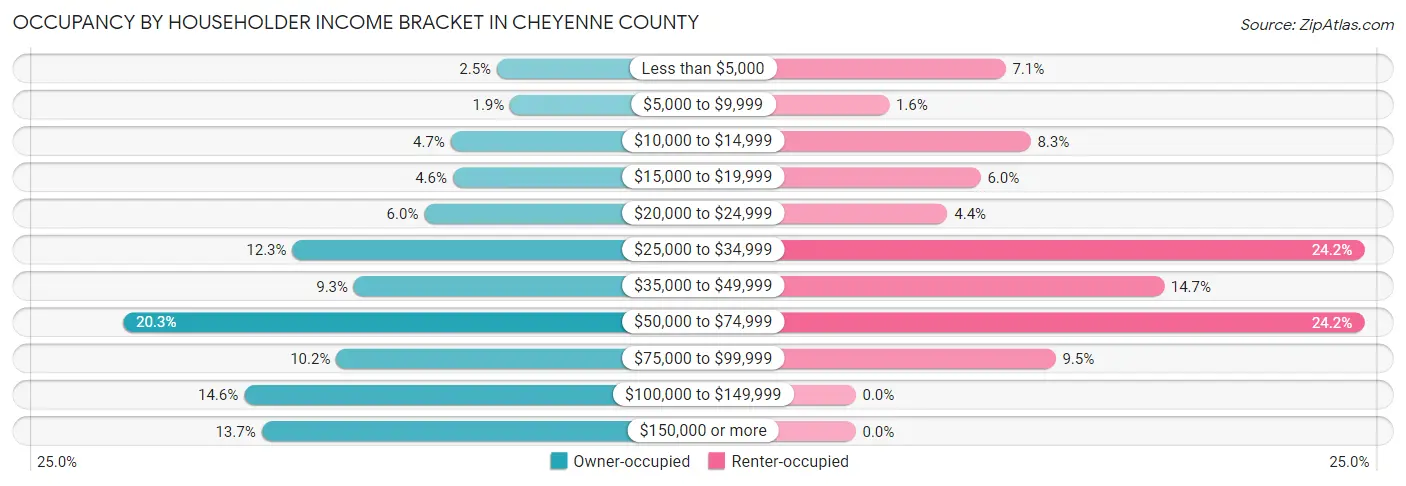
| Income Bracket | Owner-occupied | Renter-occupied |
| Less than $5,000 | 24 (2.5%) | 18 (7.1%) |
| $5,000 to $9,999 | 18 (1.9%) | 4 (1.6%) |
| $10,000 to $14,999 | 45 (4.7%) | 21 (8.3%) |
| $15,000 to $19,999 | 44 (4.6%) | 15 (5.9%) |
| $20,000 to $24,999 | 57 (6.0%) | 11 (4.4%) |
| $25,000 to $34,999 | 117 (12.2%) | 61 (24.2%) |
| $35,000 to $49,999 | 89 (9.3%) | 37 (14.7%) |
| $50,000 to $74,999 | 194 (20.3%) | 61 (24.2%) |
| $75,000 to $99,999 | 97 (10.2%) | 24 (9.5%) |
| $100,000 to $149,999 | 139 (14.5%) | 0 (0.0%) |
| $150,000 or more | 131 (13.7%) | 0 (0.0%) |
| Total | 955 (100.0%) | 252 (100.0%) |
Monthly Housing Cost Tiers in Cheyenne County
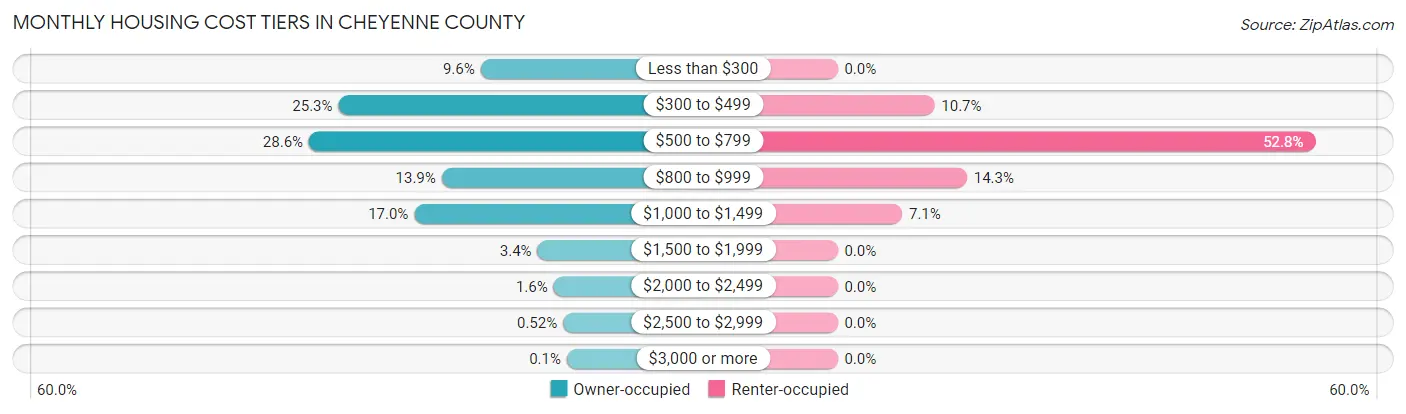
| Monthly Cost | Owner-occupied | Renter-occupied |
| Less than $300 | 92 (9.6%) | 0 (0.0%) |
| $300 to $499 | 242 (25.3%) | 27 (10.7%) |
| $500 to $799 | 273 (28.6%) | 133 (52.8%) |
| $800 to $999 | 133 (13.9%) | 36 (14.3%) |
| $1,000 to $1,499 | 162 (17.0%) | 18 (7.1%) |
| $1,500 to $1,999 | 32 (3.4%) | 0 (0.0%) |
| $2,000 to $2,499 | 15 (1.6%) | 0 (0.0%) |
| $2,500 to $2,999 | 5 (0.5%) | 0 (0.0%) |
| $3,000 or more | 1 (0.1%) | 0 (0.0%) |
| Total | 955 (100.0%) | 252 (100.0%) |
Physical Housing Characteristics in Cheyenne County
Housing Structures in Cheyenne County
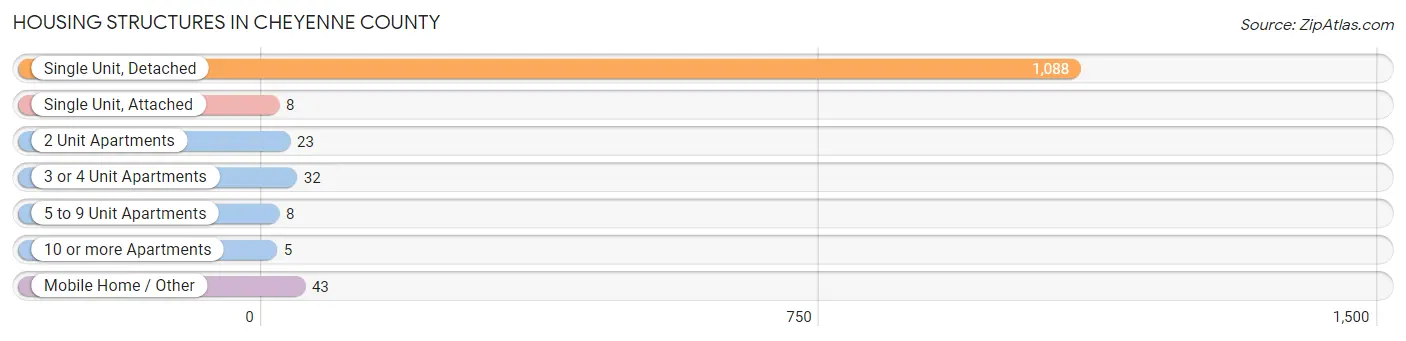
| Structure Type | # Housing Units | % Housing Units |
| Single Unit, Detached | 1,088 | 90.1% |
| Single Unit, Attached | 8 | 0.7% |
| 2 Unit Apartments | 23 | 1.9% |
| 3 or 4 Unit Apartments | 32 | 2.6% |
| 5 to 9 Unit Apartments | 8 | 0.7% |
| 10 or more Apartments | 5 | 0.4% |
| Mobile Home / Other | 43 | 3.6% |
| Total | 1,207 | 100.0% |
Housing Structures by Occupancy in Cheyenne County
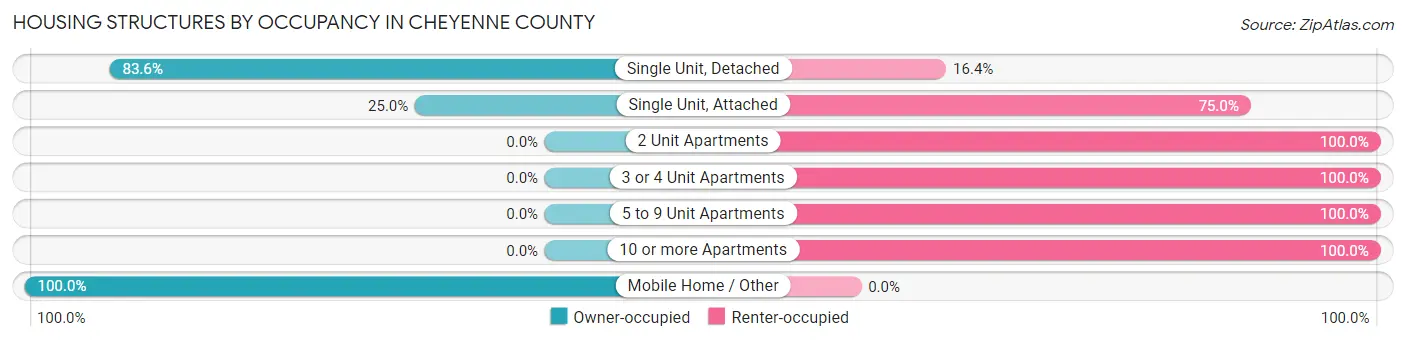
| Structure Type | Owner-occupied | Renter-occupied |
| Single Unit, Detached | 910 (83.6%) | 178 (16.4%) |
| Single Unit, Attached | 2 (25.0%) | 6 (75.0%) |
| 2 Unit Apartments | 0 (0.0%) | 23 (100.0%) |
| 3 or 4 Unit Apartments | 0 (0.0%) | 32 (100.0%) |
| 5 to 9 Unit Apartments | 0 (0.0%) | 8 (100.0%) |
| 10 or more Apartments | 0 (0.0%) | 5 (100.0%) |
| Mobile Home / Other | 43 (100.0%) | 0 (0.0%) |
| Total | 955 (79.1%) | 252 (20.9%) |
Housing Structures by Number of Rooms in Cheyenne County
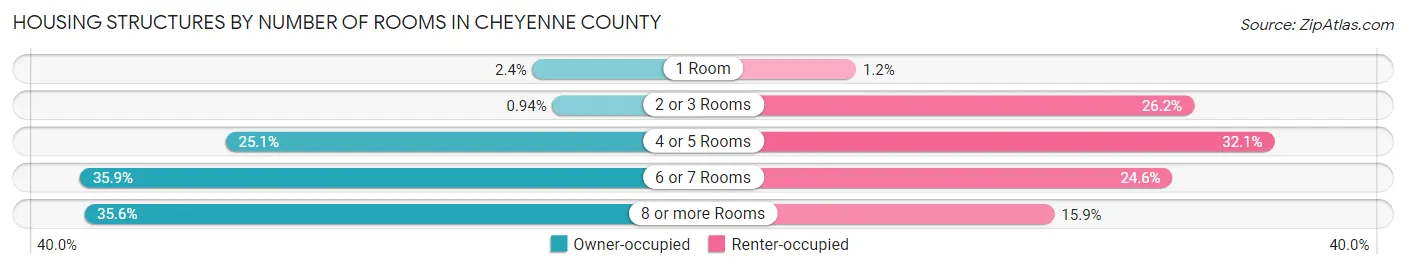
| Number of Rooms | Owner-occupied | Renter-occupied |
| 1 Room | 23 (2.4%) | 3 (1.2%) |
| 2 or 3 Rooms | 9 (0.9%) | 66 (26.2%) |
| 4 or 5 Rooms | 240 (25.1%) | 81 (32.1%) |
| 6 or 7 Rooms | 343 (35.9%) | 62 (24.6%) |
| 8 or more Rooms | 340 (35.6%) | 40 (15.9%) |
| Total | 955 (100.0%) | 252 (100.0%) |
Housing Structure by Heating Type in Cheyenne County
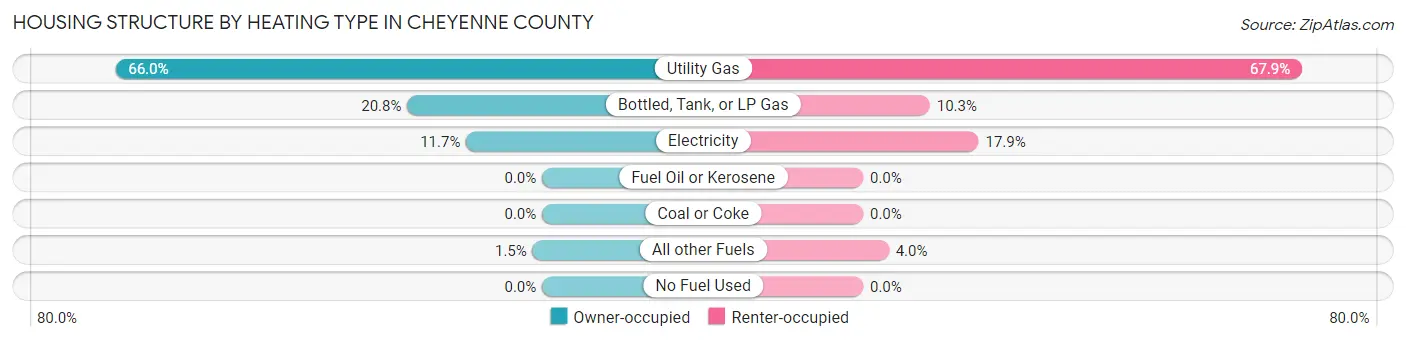
| Heating Type | Owner-occupied | Renter-occupied |
| Utility Gas | 630 (66.0%) | 171 (67.9%) |
| Bottled, Tank, or LP Gas | 199 (20.8%) | 26 (10.3%) |
| Electricity | 112 (11.7%) | 45 (17.9%) |
| Fuel Oil or Kerosene | 0 (0.0%) | 0 (0.0%) |
| Coal or Coke | 0 (0.0%) | 0 (0.0%) |
| All other Fuels | 14 (1.5%) | 10 (4.0%) |
| No Fuel Used | 0 (0.0%) | 0 (0.0%) |
| Total | 955 (100.0%) | 252 (100.0%) |
Household Vehicle Usage in Cheyenne County
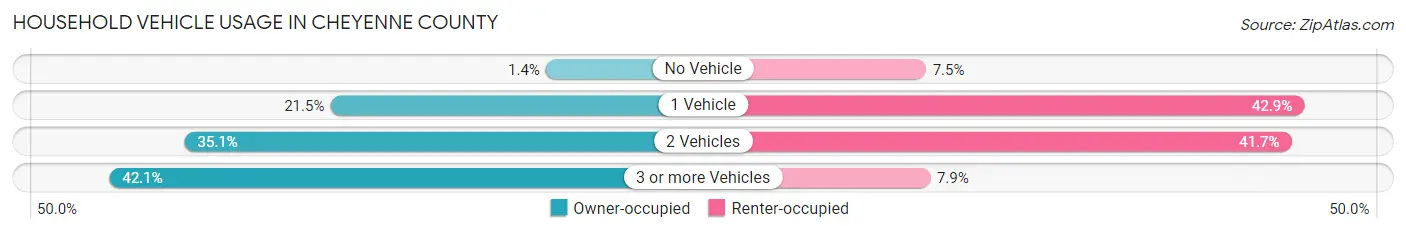
| Vehicles per Household | Owner-occupied | Renter-occupied |
| No Vehicle | 13 (1.4%) | 19 (7.5%) |
| 1 Vehicle | 205 (21.5%) | 108 (42.9%) |
| 2 Vehicles | 335 (35.1%) | 105 (41.7%) |
| 3 or more Vehicles | 402 (42.1%) | 20 (7.9%) |
| Total | 955 (100.0%) | 252 (100.0%) |
Real Estate & Mortgages in Cheyenne County
Real Estate and Mortgage Overview in Cheyenne County
| Characteristic | Without Mortgage | With Mortgage |
| Housing Units | 610 | 345 |
| Median Property Value | $103,900 | $139,100 |
| Median Household Income | $48,542 | $31 |
| Monthly Housing Costs | $483 | $1 |
| Real Estate Taxes | $1,382 | $0 |
Property Value by Mortgage Status in Cheyenne County
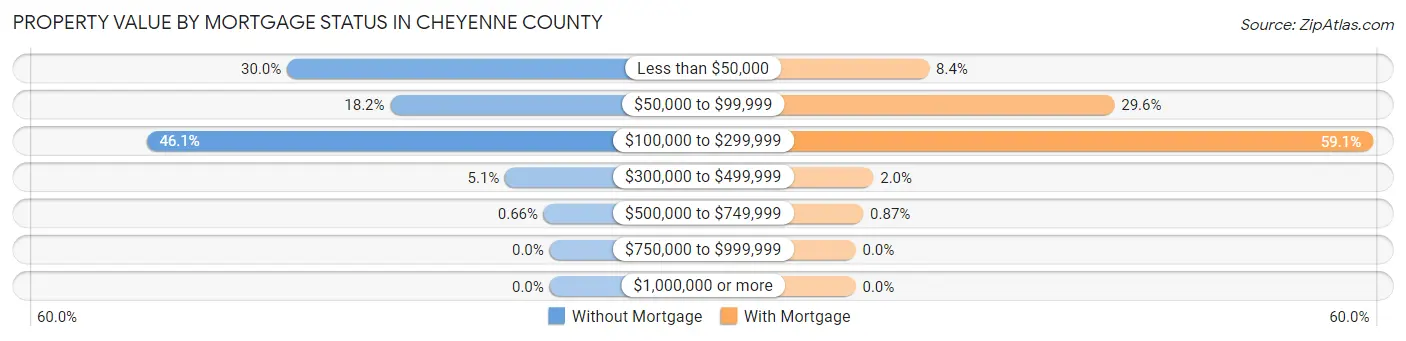
| Property Value | Without Mortgage | With Mortgage |
| Less than $50,000 | 183 (30.0%) | 29 (8.4%) |
| $50,000 to $99,999 | 111 (18.2%) | 102 (29.6%) |
| $100,000 to $299,999 | 281 (46.1%) | 204 (59.1%) |
| $300,000 to $499,999 | 31 (5.1%) | 7 (2.0%) |
| $500,000 to $749,999 | 4 (0.7%) | 3 (0.9%) |
| $750,000 to $999,999 | 0 (0.0%) | 0 (0.0%) |
| $1,000,000 or more | 0 (0.0%) | 0 (0.0%) |
| Total | 610 (100.0%) | 345 (100.0%) |
Household Income by Mortgage Status in Cheyenne County
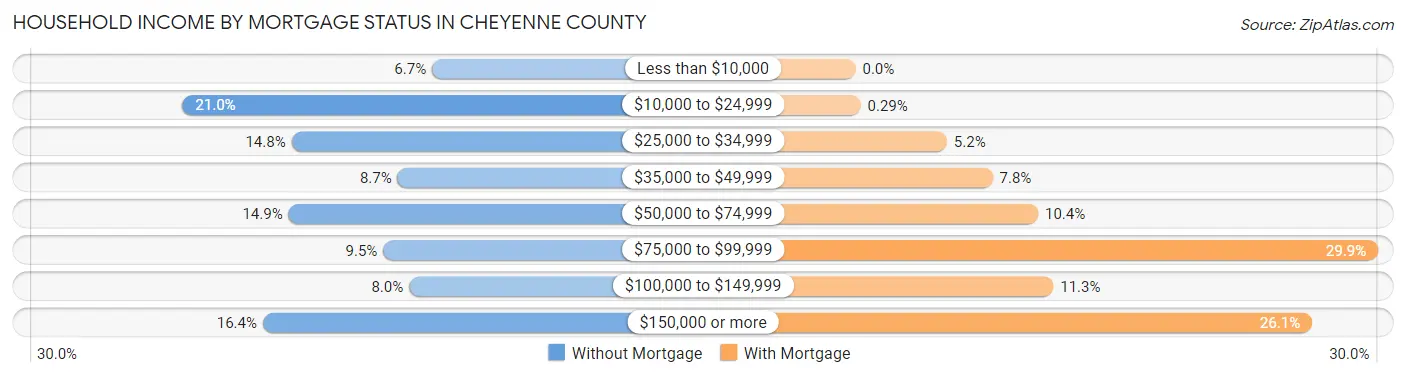
| Household Income | Without Mortgage | With Mortgage |
| Less than $10,000 | 41 (6.7%) | 0 (0.0%) |
| $10,000 to $24,999 | 128 (21.0%) | 1 (0.3%) |
| $25,000 to $34,999 | 90 (14.7%) | 18 (5.2%) |
| $35,000 to $49,999 | 53 (8.7%) | 27 (7.8%) |
| $50,000 to $74,999 | 91 (14.9%) | 36 (10.4%) |
| $75,000 to $99,999 | 58 (9.5%) | 103 (29.9%) |
| $100,000 to $149,999 | 49 (8.0%) | 39 (11.3%) |
| $150,000 or more | 100 (16.4%) | 90 (26.1%) |
| Total | 610 (100.0%) | 345 (100.0%) |
Property Value to Household Income Ratio in Cheyenne County
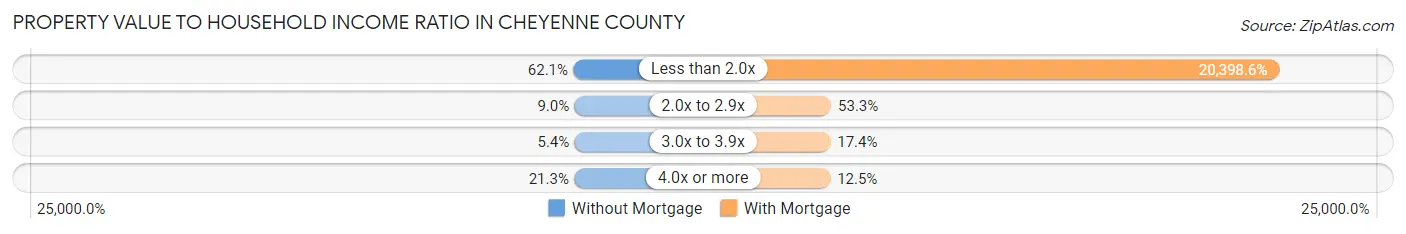
| Value-to-Income Ratio | Without Mortgage | With Mortgage |
| Less than 2.0x | 379 (62.1%) | 70,375 (20,398.6%) |
| 2.0x to 2.9x | 55 (9.0%) | 184 (53.3%) |
| 3.0x to 3.9x | 33 (5.4%) | 60 (17.4%) |
| 4.0x or more | 130 (21.3%) | 43 (12.5%) |
| Total | 610 (100.0%) | 345 (100.0%) |
Real Estate Taxes by Mortgage Status in Cheyenne County
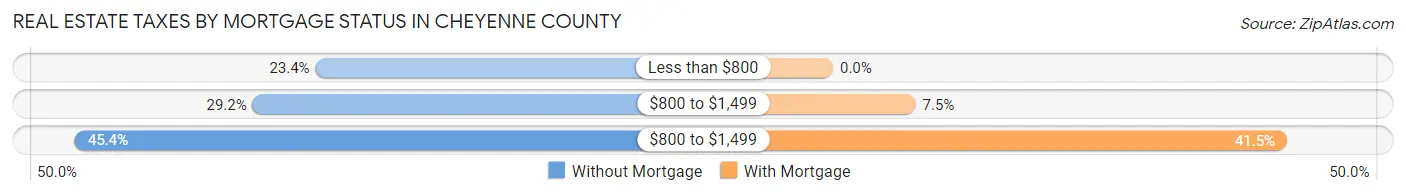
| Property Taxes | Without Mortgage | With Mortgage |
| Less than $800 | 143 (23.4%) | 0 (0.0%) |
| $800 to $1,499 | 178 (29.2%) | 26 (7.5%) |
| $800 to $1,499 | 277 (45.4%) | 143 (41.4%) |
| Total | 610 (100.0%) | 345 (100.0%) |
Health & Disability in Cheyenne County
Health Insurance Coverage by Age in Cheyenne County
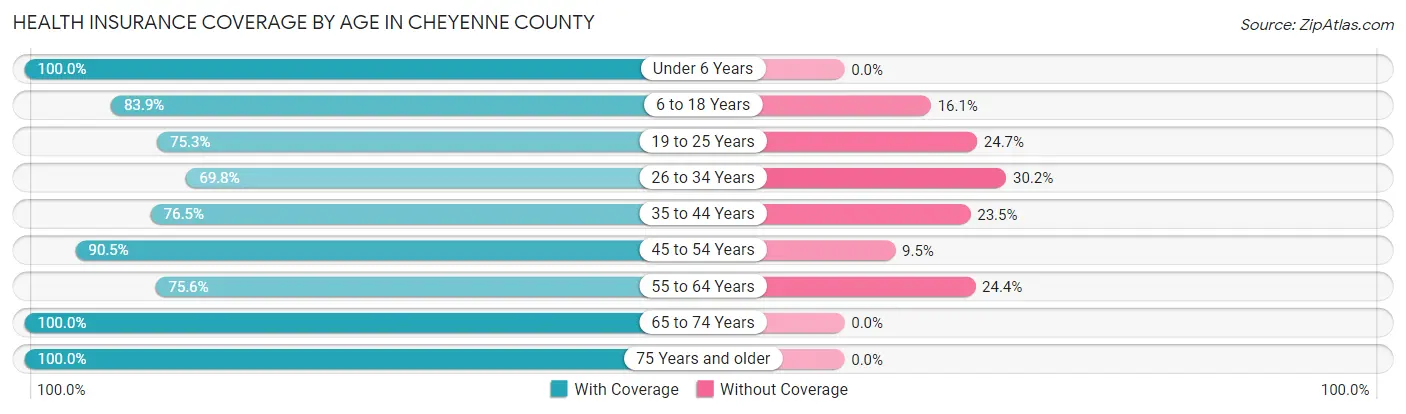
| Age Bracket | With Coverage | Without Coverage |
| Under 6 Years | 197 (100.0%) | 0 (0.0%) |
| 6 to 18 Years | 354 (83.9%) | 68 (16.1%) |
| 19 to 25 Years | 134 (75.3%) | 44 (24.7%) |
| 26 to 34 Years | 125 (69.8%) | 54 (30.2%) |
| 35 to 44 Years | 293 (76.5%) | 90 (23.5%) |
| 45 to 54 Years | 153 (90.5%) | 16 (9.5%) |
| 55 to 64 Years | 310 (75.6%) | 100 (24.4%) |
| 65 to 74 Years | 357 (100.0%) | 0 (0.0%) |
| 75 Years and older | 282 (100.0%) | 0 (0.0%) |
| Total | 2,205 (85.6%) | 372 (14.4%) |
Health Insurance Coverage by Citizenship Status in Cheyenne County
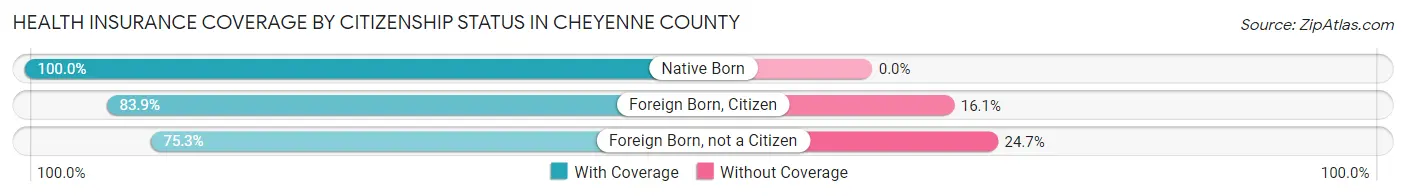
| Citizenship Status | With Coverage | Without Coverage |
| Native Born | 197 (100.0%) | 0 (0.0%) |
| Foreign Born, Citizen | 354 (83.9%) | 68 (16.1%) |
| Foreign Born, not a Citizen | 134 (75.3%) | 44 (24.7%) |
Health Insurance Coverage by Household Income in Cheyenne County
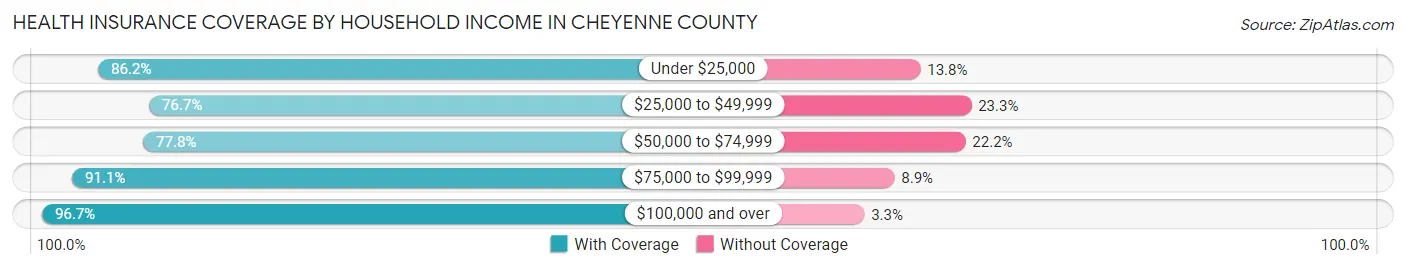
| Household Income | With Coverage | Without Coverage |
| Under $25,000 | 332 (86.2%) | 53 (13.8%) |
| $25,000 to $49,999 | 408 (76.7%) | 124 (23.3%) |
| $50,000 to $74,999 | 518 (77.8%) | 148 (22.2%) |
| $75,000 to $99,999 | 235 (91.1%) | 23 (8.9%) |
| $100,000 and over | 712 (96.7%) | 24 (3.3%) |
Public vs Private Health Insurance Coverage by Age in Cheyenne County
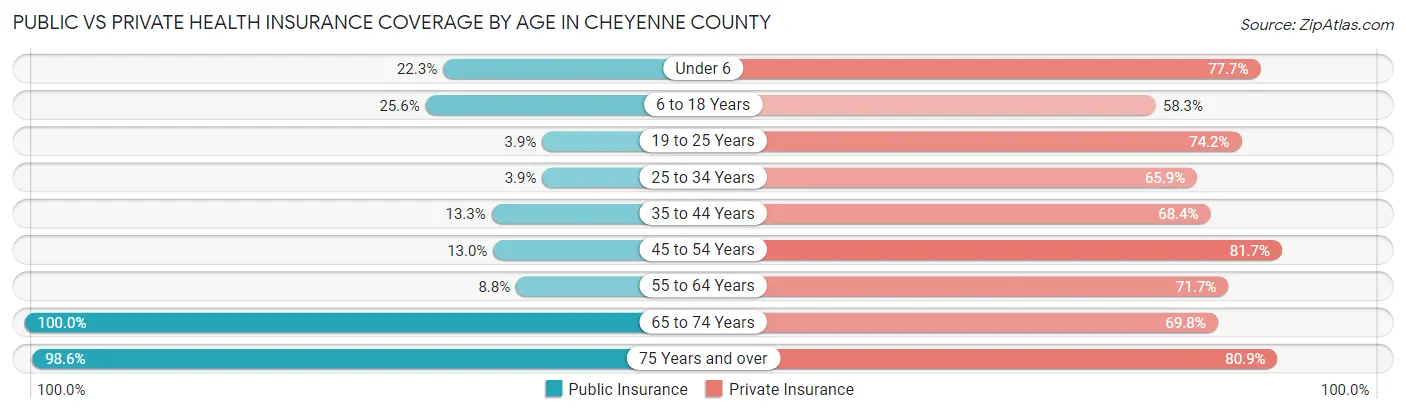
| Age Bracket | Public Insurance | Private Insurance |
| Under 6 | 44 (22.3%) | 153 (77.7%) |
| 6 to 18 Years | 108 (25.6%) | 246 (58.3%) |
| 19 to 25 Years | 7 (3.9%) | 132 (74.2%) |
| 25 to 34 Years | 7 (3.9%) | 118 (65.9%) |
| 35 to 44 Years | 51 (13.3%) | 262 (68.4%) |
| 45 to 54 Years | 22 (13.0%) | 138 (81.7%) |
| 55 to 64 Years | 36 (8.8%) | 294 (71.7%) |
| 65 to 74 Years | 357 (100.0%) | 249 (69.8%) |
| 75 Years and over | 278 (98.6%) | 228 (80.8%) |
| Total | 910 (35.3%) | 1,820 (70.6%) |
Disability Status by Sex by Age in Cheyenne County
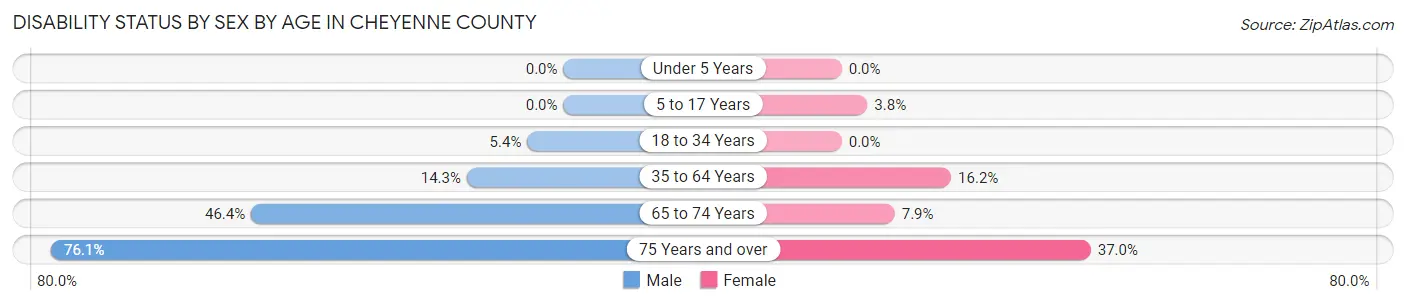
| Age Bracket | Male | Female |
| Under 5 Years | 0 (0.0%) | 0 (0.0%) |
| 5 to 17 Years | 0 (0.0%) | 6 (3.8%) |
| 18 to 34 Years | 12 (5.4%) | 0 (0.0%) |
| 35 to 64 Years | 70 (14.3%) | 77 (16.2%) |
| 65 to 74 Years | 83 (46.4%) | 14 (7.9%) |
| 75 Years and over | 89 (76.1%) | 61 (37.0%) |
Disability Class by Sex by Age in Cheyenne County
Disability Class: Hearing Difficulty
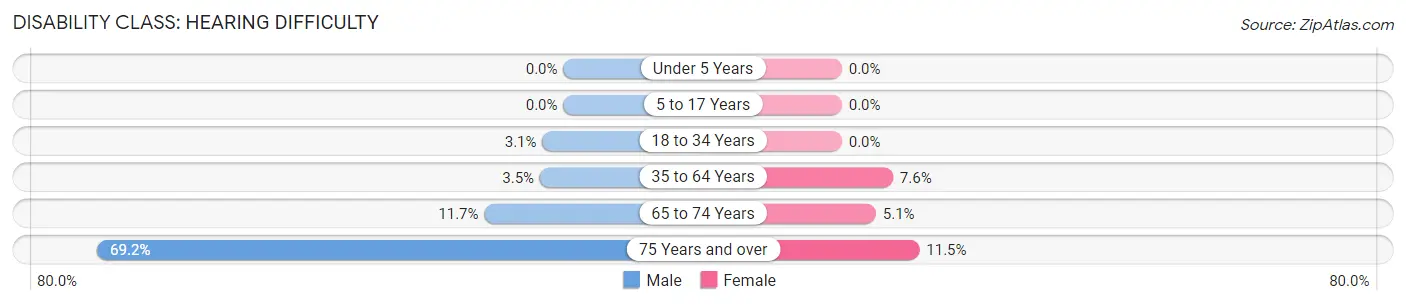
| Age Bracket | Male | Female |
| Under 5 Years | 0 (0.0%) | 0 (0.0%) |
| 5 to 17 Years | 0 (0.0%) | 0 (0.0%) |
| 18 to 34 Years | 7 (3.1%) | 0 (0.0%) |
| 35 to 64 Years | 17 (3.5%) | 36 (7.6%) |
| 65 to 74 Years | 21 (11.7%) | 9 (5.1%) |
| 75 Years and over | 81 (69.2%) | 19 (11.5%) |
Disability Class: Vision Difficulty
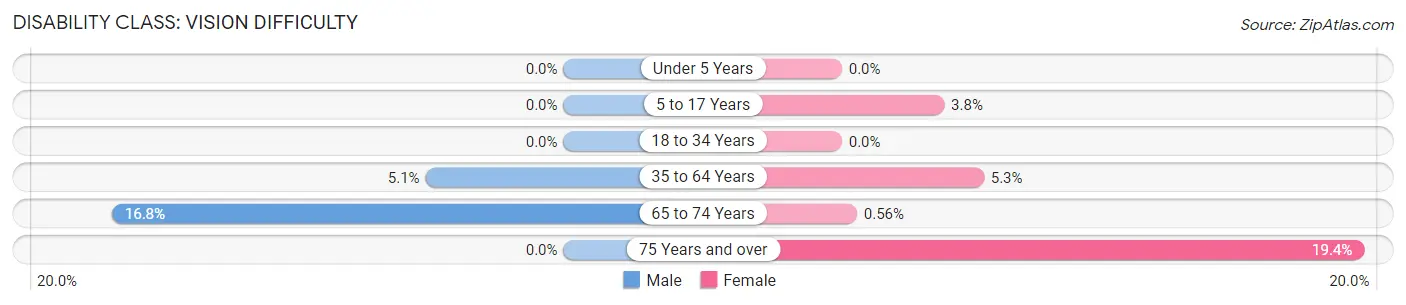
| Age Bracket | Male | Female |
| Under 5 Years | 0 (0.0%) | 0 (0.0%) |
| 5 to 17 Years | 0 (0.0%) | 6 (3.8%) |
| 18 to 34 Years | 0 (0.0%) | 0 (0.0%) |
| 35 to 64 Years | 25 (5.1%) | 25 (5.3%) |
| 65 to 74 Years | 30 (16.8%) | 1 (0.6%) |
| 75 Years and over | 0 (0.0%) | 32 (19.4%) |
Disability Class: Cognitive Difficulty
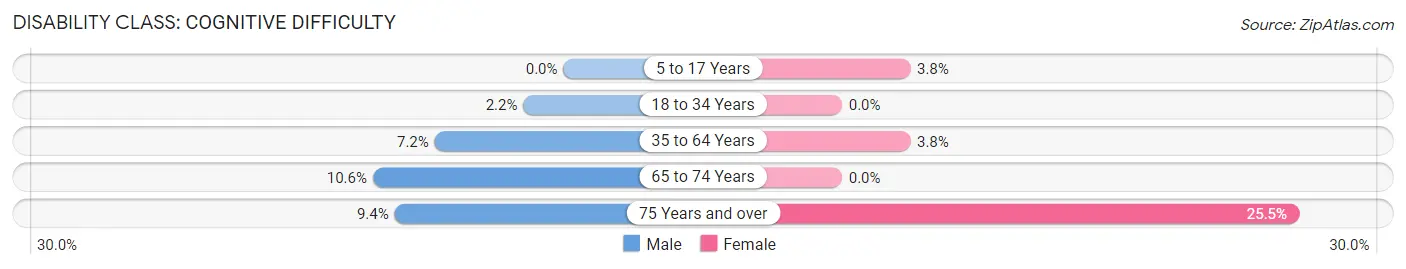
| Age Bracket | Male | Female |
| 5 to 17 Years | 0 (0.0%) | 6 (3.8%) |
| 18 to 34 Years | 5 (2.2%) | 0 (0.0%) |
| 35 to 64 Years | 35 (7.2%) | 18 (3.8%) |
| 65 to 74 Years | 19 (10.6%) | 0 (0.0%) |
| 75 Years and over | 11 (9.4%) | 42 (25.5%) |
Disability Class: Ambulatory Difficulty
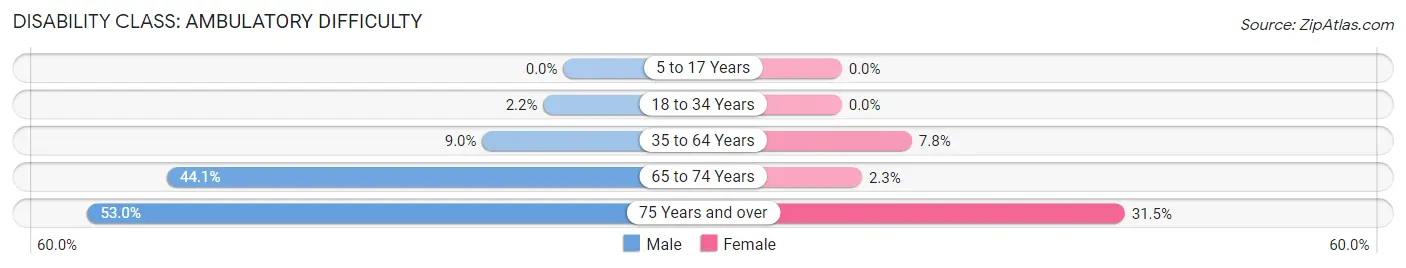
| Age Bracket | Male | Female |
| 5 to 17 Years | 0 (0.0%) | 0 (0.0%) |
| 18 to 34 Years | 5 (2.2%) | 0 (0.0%) |
| 35 to 64 Years | 44 (9.0%) | 37 (7.8%) |
| 65 to 74 Years | 79 (44.1%) | 4 (2.2%) |
| 75 Years and over | 62 (53.0%) | 52 (31.5%) |
Disability Class: Self-Care Difficulty
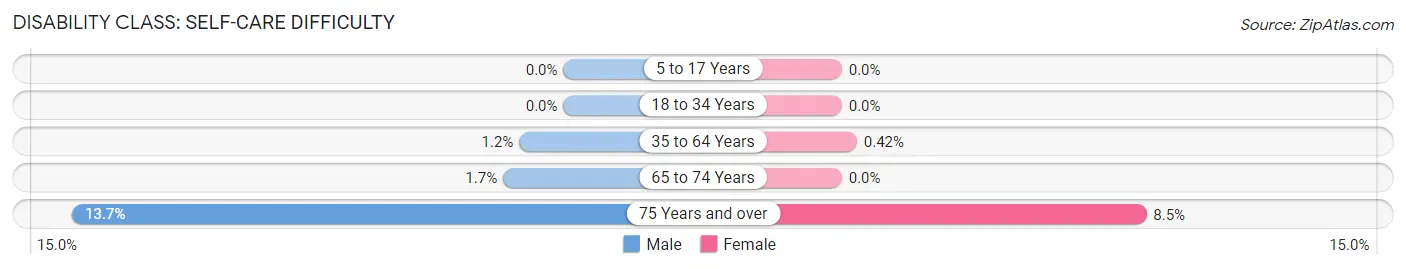
| Age Bracket | Male | Female |
| 5 to 17 Years | 0 (0.0%) | 0 (0.0%) |
| 18 to 34 Years | 0 (0.0%) | 0 (0.0%) |
| 35 to 64 Years | 6 (1.2%) | 2 (0.4%) |
| 65 to 74 Years | 3 (1.7%) | 0 (0.0%) |
| 75 Years and over | 16 (13.7%) | 14 (8.5%) |
Technology Access in Cheyenne County
Computing Device Access in Cheyenne County
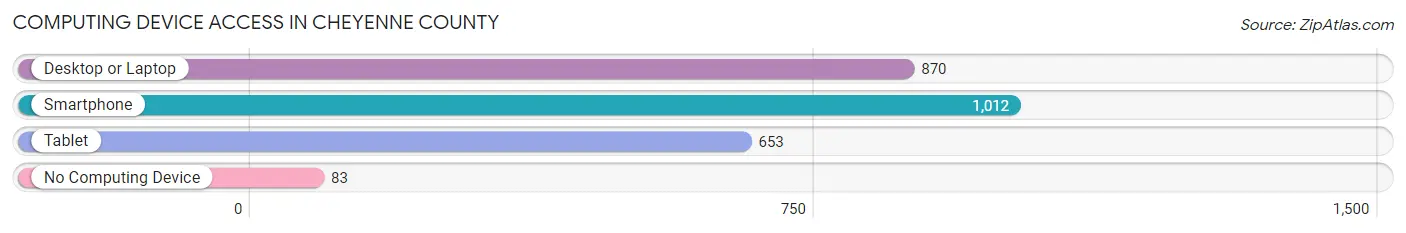
| Device Type | # Households | % Households |
| Desktop or Laptop | 870 | 72.1% |
| Smartphone | 1,012 | 83.8% |
| Tablet | 653 | 54.1% |
| No Computing Device | 83 | 6.9% |
| Total | 1,207 | 100.0% |
Internet Access in Cheyenne County
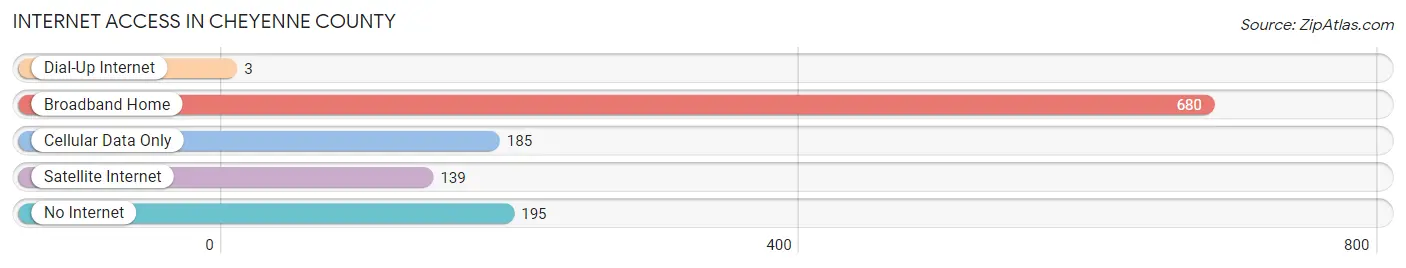
| Internet Type | # Households | % Households |
| Dial-Up Internet | 3 | 0.3% |
| Broadband Home | 680 | 56.3% |
| Cellular Data Only | 185 | 15.3% |
| Satellite Internet | 139 | 11.5% |
| No Internet | 195 | 16.2% |
| Total | 1,207 | 100.0% |
Cheyenne County Summary
Cheyenne County is located in the northwest corner of Kansas, and is bordered by Nebraska to the north, Colorado to the west, and Sherman, Thomas, and Rawlins counties to the south and east. The county seat is St. Francis, and the county was named after the Cheyenne Native American tribe. The county has a total area of 1,039 square miles, of which 1,033 square miles is land and 6 square miles is water.
Geography
Cheyenne County is located in the High Plains region of the Great Plains, and is characterized by flat to rolling terrain. The county is drained by the Republican River, which flows through the county from north to south. The county is also home to several small lakes, including Lake McConaughy, which is located in the northern part of the county. The county is also home to several small streams, including the Beaver Creek, which flows through the county from east to west.
The county has a semi-arid climate, with hot summers and cold winters. The average annual precipitation is about 18 inches, and the average annual temperature is about 54 degrees Fahrenheit.
Economy
The economy of Cheyenne County is largely based on agriculture. The county is home to several large farms, which produce a variety of crops, including wheat, corn, sorghum, and soybeans. The county is also home to several large cattle ranches, which produce beef and dairy products.
In addition to agriculture, the county is also home to several small businesses, including retail stores, restaurants, and service providers. The county is also home to several manufacturing companies, which produce a variety of products, including furniture, clothing, and electronics.
Demographics
As of the 2010 census, the population of Cheyenne County was 2,735, and the population density was 2.6 people per square mile. The racial makeup of the county was 95.3% White, 0.3% African American, 0.7% Native American, 0.2% Asian, 0.1% Pacific Islander, 1.7% from other races, and 1.9% from two or more races. Hispanic or Latino of any race were 4.2% of the population.
The median income for a household in the county was $37,917, and the median income for a family was $45,000. The per capita income for the county was $17,917. About 11.2% of families and 14.2% of the population were below the poverty line, including 17.2% of those under age 18 and 8.2% of those age 65 or over.
Cheyenne County is served by several public school districts, including St. Francis USD 297, Cheyenne County USD 103, and Cheyenne County Community College. The county is also home to several private schools, including St. Francis Catholic School and Cheyenne County Christian Academy.
Common Questions
What is Per Capita Income in Cheyenne County?
Per Capita income in Cheyenne County is $34,829.
What is the Median Family Income in Cheyenne County?
Median Family Income in Cheyenne County is $70,938.
What is the Median Household income in Cheyenne County?
Median Household Income in Cheyenne County is $52,730.
What is Income or Wage Gap in Cheyenne County?
Income or Wage Gap in Cheyenne County is 28.1%.
Women in Cheyenne County earn 71.9 cents for every dollar earned by a man.
What is Inequality or Gini Index in Cheyenne County?
Inequality or Gini Index in Cheyenne County is 0.45.
What is the Total Population of Cheyenne County?
Total Population of Cheyenne County is 2,619.
What is the Total Male Population of Cheyenne County?
Total Male Population of Cheyenne County is 1,373.
What is the Total Female Population of Cheyenne County?
Total Female Population of Cheyenne County is 1,246.
What is the Ratio of Males per 100 Females in Cheyenne County?
There are 110.19 Males per 100 Females in Cheyenne County.
What is the Ratio of Females per 100 Males in Cheyenne County?
There are 90.75 Females per 100 Males in Cheyenne County.
What is the Median Population Age in Cheyenne County?
Median Population Age in Cheyenne County is 43.0 Years.
What is the Average Family Size in Cheyenne County
Average Family Size in Cheyenne County is 3.1 People.
What is the Average Household Size in Cheyenne County
Average Household Size in Cheyenne County is 2.1 People.
How Large is the Labor Force in Cheyenne County?
There are 1,310 People in the Labor Forcein in Cheyenne County.
What is the Percentage of People in the Labor Force in Cheyenne County?
62.0% of People are in the Labor Force in Cheyenne County.
What is the Unemployment Rate in Cheyenne County?
Unemployment Rate in Cheyenne County is 1.8%.