Bourbon County, KS Map & Demographics
Bourbon County Map
Bourbon County Overview
$29,328
PER CAPITA INCOME
$73,896
AVG FAMILY INCOME
$55,826
AVG HOUSEHOLD INCOME
36.8%
WAGE / INCOME GAP [ % ]
63.2¢/ $1
WAGE / INCOME GAP [ $ ]
$11,635
FAMILY INCOME DEFICIT
0.42
INEQUALITY / GINI INDEX
14,405
TOTAL POPULATION
7,015
MALE POPULATION
7,390
FEMALE POPULATION
94.93
MALES / 100 FEMALES
105.35
FEMALES / 100 MALES
38.1
MEDIAN AGE
3.0
AVG FAMILY SIZE
2.4
AVG HOUSEHOLD SIZE
6,766
LABOR FORCE [ PEOPLE ]
61.0%
PERCENT IN LABOR FORCE
3.8%
UNEMPLOYMENT RATE
Income in Bourbon County
Income Overview in Bourbon County
Per Capita Income in Bourbon County is $29,328, while median incomes of families and households are $73,896 and $55,826 respectively.
| Characteristic | Number | Measure |
| Per Capita Income | 14,405 | $29,328 |
| Median Family Income | 3,787 | $73,896 |
| Mean Family Income | 3,787 | $85,265 |
| Median Household Income | 5,875 | $55,826 |
| Mean Household Income | 5,875 | $72,191 |
| Income Deficit | 3,787 | $11,635 |
| Wage / Income Gap (%) | 14,405 | 36.82% |
| Wage / Income Gap ($) | 14,405 | 63.18¢ per $1 |
| Gini / Inequality Index | 14,405 | 0.42 |
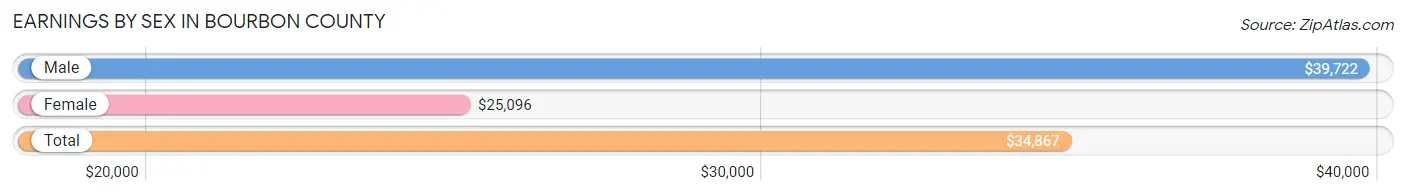
Earnings by Sex in Bourbon County
Average Earnings in Bourbon County are $34,867, $39,722 for men and $25,096 for women, a difference of 36.8%.
| Sex | Number | Average Earnings |
| Male | 3,878 (53.2%) | $39,722 |
| Female | 3,417 (46.8%) | $25,096 |
| Total | 7,295 (100.0%) | $34,867 |
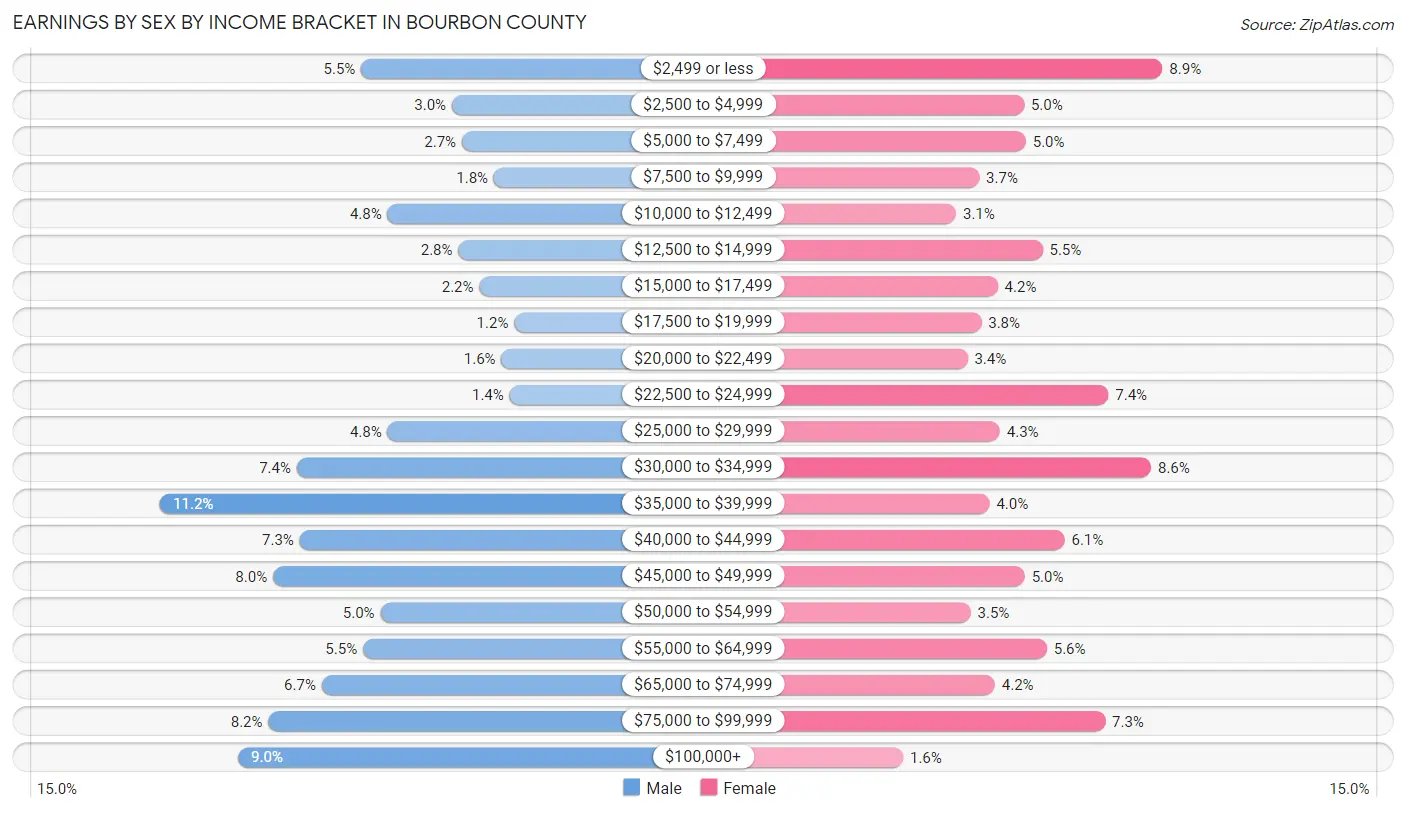
Earnings by Sex by Income Bracket in Bourbon County
The most common earnings brackets in Bourbon County are $35,000 to $39,999 for men (434 | 11.2%) and $2,499 or less for women (303 | 8.9%).
| Income | Male | Female |
| $2,499 or less | 215 (5.5%) | 303 (8.9%) |
| $2,500 to $4,999 | 116 (3.0%) | 170 (5.0%) |
| $5,000 to $7,499 | 105 (2.7%) | 172 (5.0%) |
| $7,500 to $9,999 | 70 (1.8%) | 127 (3.7%) |
| $10,000 to $12,499 | 186 (4.8%) | 105 (3.1%) |
| $12,500 to $14,999 | 109 (2.8%) | 188 (5.5%) |
| $15,000 to $17,499 | 86 (2.2%) | 145 (4.2%) |
| $17,500 to $19,999 | 48 (1.2%) | 129 (3.8%) |
| $20,000 to $22,499 | 62 (1.6%) | 116 (3.4%) |
| $22,500 to $24,999 | 53 (1.4%) | 251 (7.3%) |
| $25,000 to $29,999 | 186 (4.8%) | 147 (4.3%) |
| $30,000 to $34,999 | 285 (7.3%) | 292 (8.6%) |
| $35,000 to $39,999 | 434 (11.2%) | 137 (4.0%) |
| $40,000 to $44,999 | 282 (7.3%) | 209 (6.1%) |
| $45,000 to $49,999 | 311 (8.0%) | 171 (5.0%) |
| $50,000 to $54,999 | 194 (5.0%) | 119 (3.5%) |
| $55,000 to $64,999 | 213 (5.5%) | 192 (5.6%) |
| $65,000 to $74,999 | 258 (6.7%) | 142 (4.2%) |
| $75,000 to $99,999 | 316 (8.2%) | 248 (7.3%) |
| $100,000+ | 349 (9.0%) | 54 (1.6%) |
| Total | 3,878 (100.0%) | 3,417 (100.0%) |
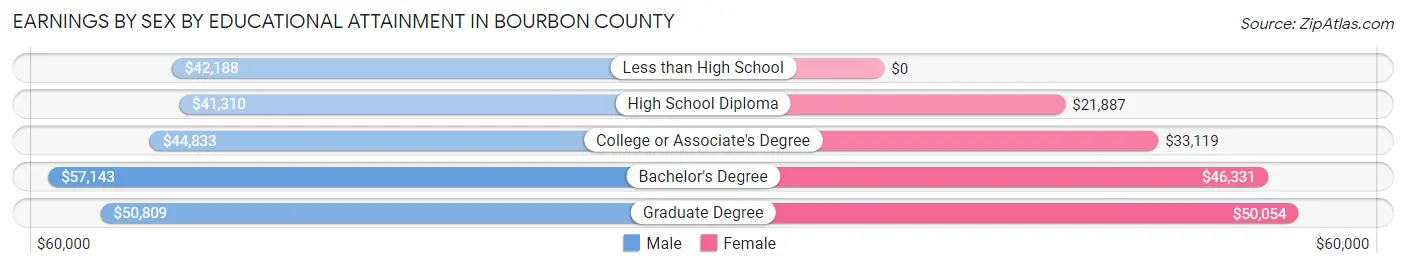
Earnings by Sex by Educational Attainment in Bourbon County
Average earnings in Bourbon County are $45,044 for men and $31,491 for women, a difference of 30.1%. Men with an educational attainment of bachelor's degree enjoy the highest average annual earnings of $57,143, while those with high school diploma education earn the least with $41,310. Women with an educational attainment of graduate degree earn the most with the average annual earnings of $50,054, while those with high school diploma education have the smallest earnings of $21,887.
| Educational Attainment | Male Income | Female Income |
| Less than High School | $42,188 | $0 |
| High School Diploma | $41,310 | $21,887 |
| College or Associate's Degree | $44,833 | $33,119 |
| Bachelor's Degree | $57,143 | $46,331 |
| Graduate Degree | $50,809 | $50,054 |
| Total | $45,044 | $31,491 |
Family Income in Bourbon County
Family Income Brackets in Bourbon County
According to the Bourbon County family income data, there are 791 families falling into the $50,000 to $74,999 income range, which is the most common income bracket and makes up 20.9% of all families. Conversely, the $10,000 to $14,999 income bracket is the least frequent group with only 64 families (1.7%) belonging to this category.
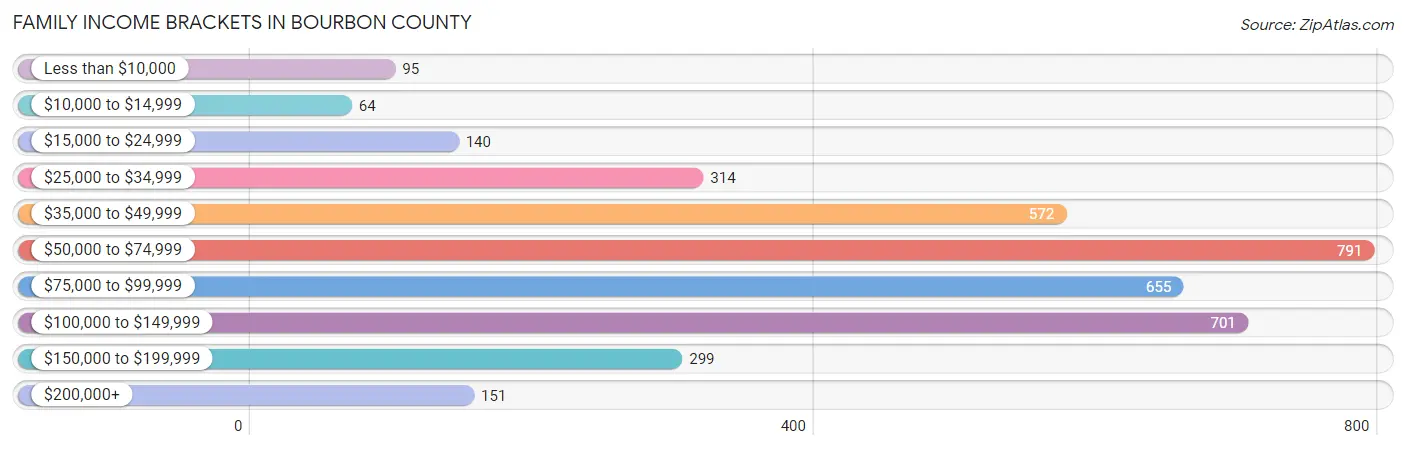
| Income Bracket | # Families | % Families |
| Less than $10,000 | 95 | 2.5% |
| $10,000 to $14,999 | 64 | 1.7% |
| $15,000 to $24,999 | 140 | 3.7% |
| $25,000 to $34,999 | 314 | 8.3% |
| $35,000 to $49,999 | 572 | 15.1% |
| $50,000 to $74,999 | 791 | 20.9% |
| $75,000 to $99,999 | 655 | 17.3% |
| $100,000 to $149,999 | 701 | 18.5% |
| $150,000 to $199,999 | 299 | 7.9% |
| $200,000+ | 151 | 4.0% |
Family Income by Famaliy Size in Bourbon County
4-person families (510 | 13.5%) account for the highest median family income in Bourbon County with $91,574 per family, while 2-person families (2,148 | 56.7%) have the highest median income of $36,550 per family member.
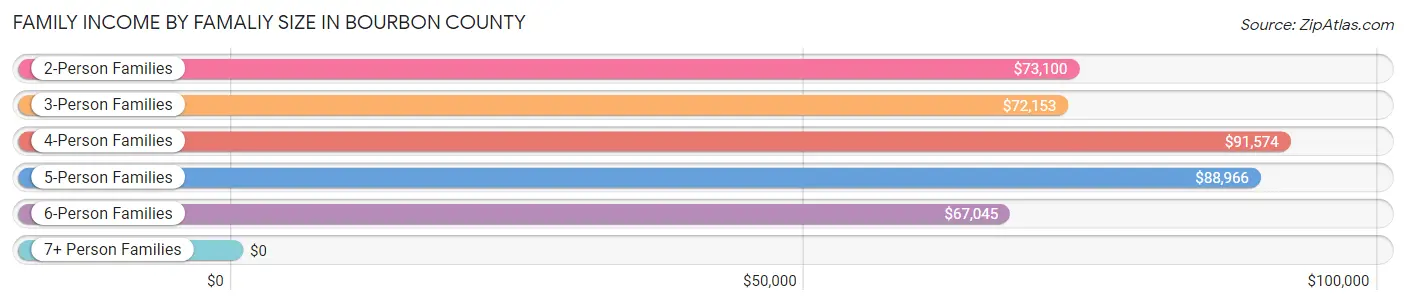
| Income Bracket | # Families | Median Income |
| 2-Person Families | 2,148 (56.7%) | $73,100 |
| 3-Person Families | 584 (15.4%) | $72,153 |
| 4-Person Families | 510 (13.5%) | $91,574 |
| 5-Person Families | 308 (8.1%) | $88,966 |
| 6-Person Families | 162 (4.3%) | $67,045 |
| 7+ Person Families | 75 (2.0%) | $0 |
| Total | 3,787 (100.0%) | $73,896 |
Family Income by Number of Earners in Bourbon County
The median family income in Bourbon County is $73,896, with families comprising 3+ earners (427) having the highest median family income of $98,375, while families with 1 earner (1,162) have the lowest median family income of $49,247, accounting for 11.3% and 30.7% of families, respectively.
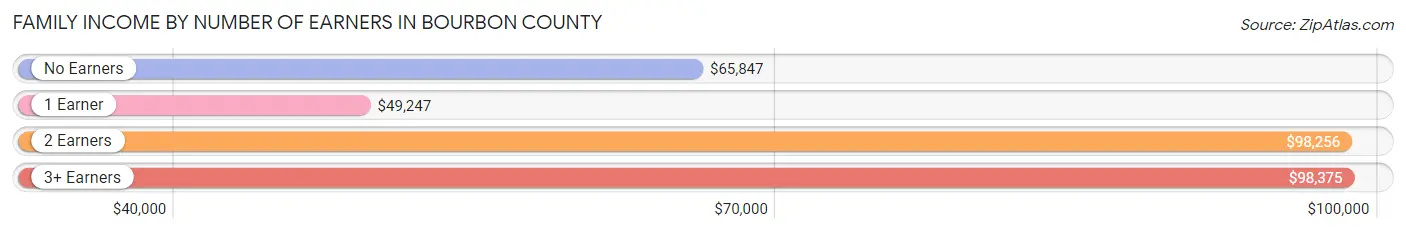
| Number of Earners | # Families | Median Income |
| No Earners | 647 (17.1%) | $65,847 |
| 1 Earner | 1,162 (30.7%) | $49,247 |
| 2 Earners | 1,551 (41.0%) | $98,256 |
| 3+ Earners | 427 (11.3%) | $98,375 |
| Total | 3,787 (100.0%) | $73,896 |
Household Income in Bourbon County
Household Income Brackets in Bourbon County
With 993 households falling in the category, the $50,000 to $74,999 income range is the most frequent in Bourbon County, accounting for 16.9% of all households. In contrast, only 176 households (3.0%) fall into the $200,000+ income bracket, making it the least populous group.
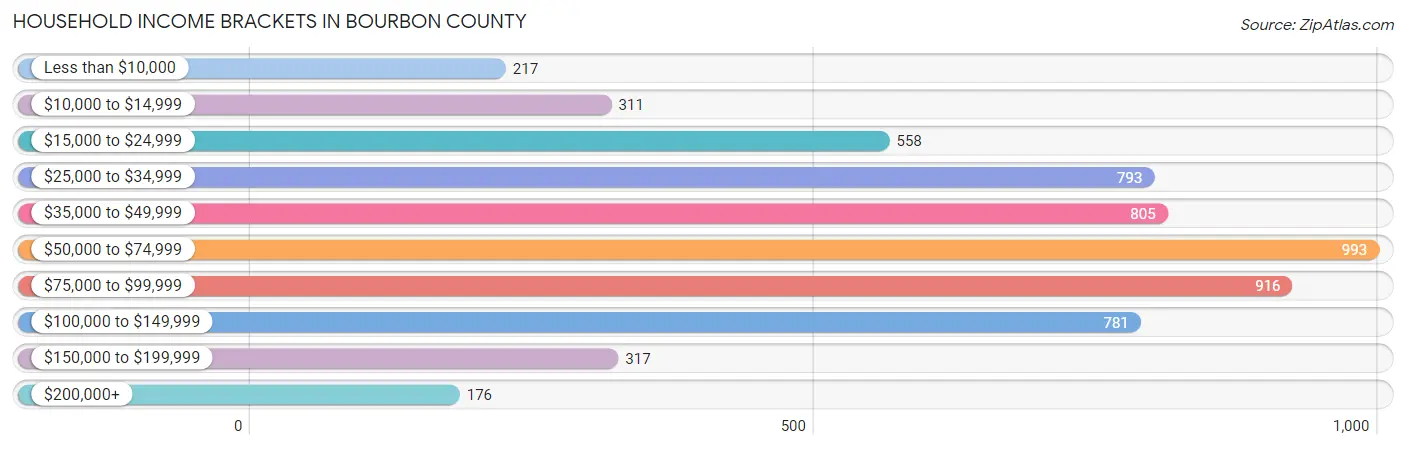
| Income Bracket | # Households | % Households |
| Less than $10,000 | 217 | 3.7% |
| $10,000 to $14,999 | 311 | 5.3% |
| $15,000 to $24,999 | 558 | 9.5% |
| $25,000 to $34,999 | 793 | 13.5% |
| $35,000 to $49,999 | 805 | 13.7% |
| $50,000 to $74,999 | 993 | 16.9% |
| $75,000 to $99,999 | 916 | 15.6% |
| $100,000 to $149,999 | 781 | 13.3% |
| $150,000 to $199,999 | 317 | 5.4% |
| $200,000+ | 176 | 3.0% |
Household Income by Householder Age in Bourbon County
The median household income in Bourbon County is $55,826, with the highest median household income of $87,381 found in the 45 to 64 years age bracket for the primary householder. A total of 1,836 households (31.2%) fall into this category. Meanwhile, the 15 to 24 years age bracket for the primary householder has the lowest median household income of $32,900, with 426 households (7.2%) in this group.
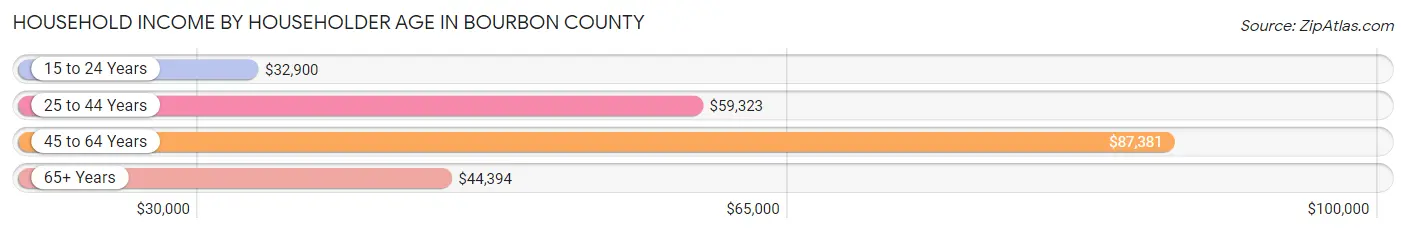
| Income Bracket | # Households | Median Income |
| 15 to 24 Years | 426 (7.2%) | $32,900 |
| 25 to 44 Years | 1,627 (27.7%) | $59,323 |
| 45 to 64 Years | 1,836 (31.2%) | $87,381 |
| 65+ Years | 1,986 (33.8%) | $44,394 |
| Total | 5,875 (100.0%) | $55,826 |
Poverty in Bourbon County
Income Below Poverty by Sex and Age in Bourbon County
With 11.4% poverty level for males and 14.1% for females among the residents of Bourbon County, 18 to 24 year old males and 6 to 11 year old females are the most vulnerable to poverty, with 200 males (36.4%) and 224 females (31.3%) in their respective age groups living below the poverty level.
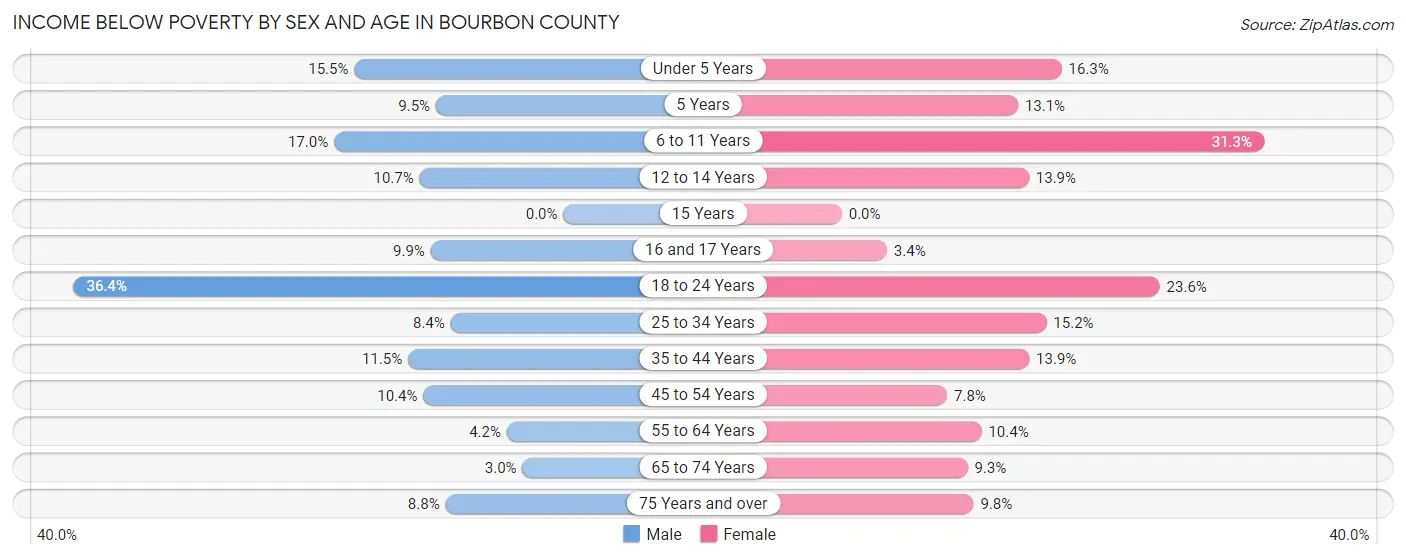
| Age Bracket | Male | Female |
| Under 5 Years | 70 (15.5%) | 70 (16.3%) |
| 5 Years | 14 (9.5%) | 17 (13.1%) |
| 6 to 11 Years | 102 (17.0%) | 224 (31.3%) |
| 12 to 14 Years | 30 (10.7%) | 45 (13.9%) |
| 15 Years | 0 (0.0%) | 0 (0.0%) |
| 16 and 17 Years | 20 (9.9%) | 7 (3.4%) |
| 18 to 24 Years | 200 (36.4%) | 118 (23.6%) |
| 25 to 34 Years | 68 (8.4%) | 118 (15.2%) |
| 35 to 44 Years | 99 (11.5%) | 112 (13.9%) |
| 45 to 54 Years | 71 (10.4%) | 56 (7.8%) |
| 55 to 64 Years | 39 (4.2%) | 103 (10.4%) |
| 65 to 74 Years | 22 (3.0%) | 77 (9.3%) |
| 75 Years and over | 40 (8.7%) | 63 (9.8%) |
| Total | 775 (11.4%) | 1,010 (14.1%) |
Income Above Poverty by Sex and Age in Bourbon County
According to the poverty statistics in Bourbon County, males aged 15 years and females aged 15 years are the age groups that are most secure financially, with 100.0% of males and 100.0% of females in these age groups living above the poverty line.
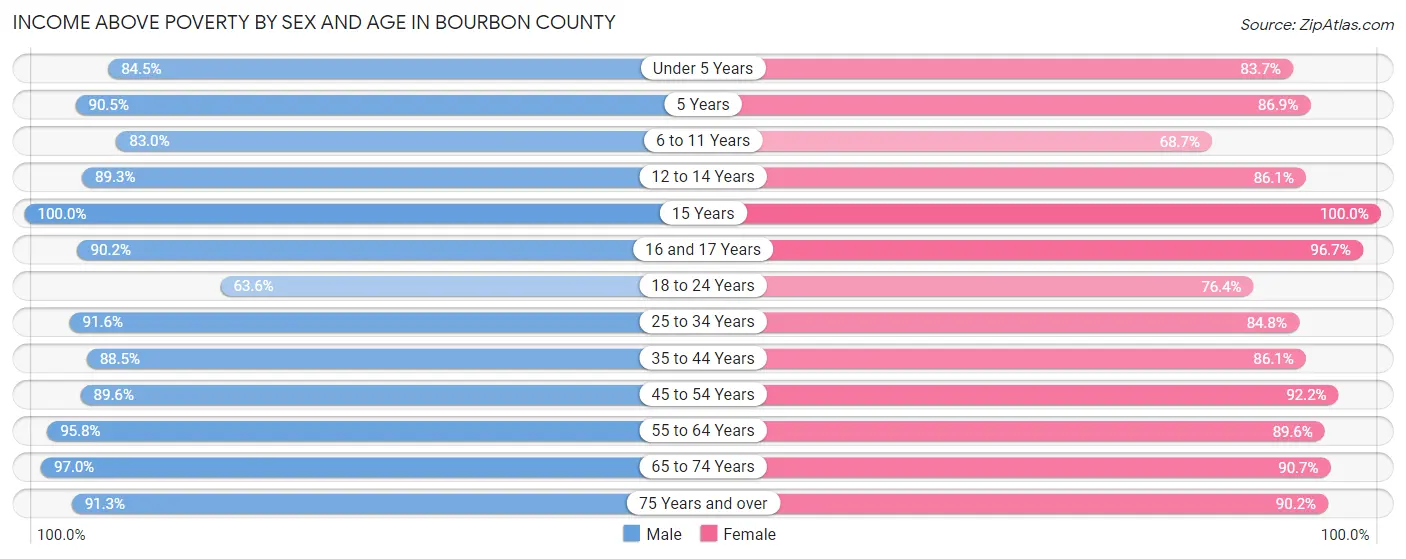
| Age Bracket | Male | Female |
| Under 5 Years | 381 (84.5%) | 359 (83.7%) |
| 5 Years | 134 (90.5%) | 113 (86.9%) |
| 6 to 11 Years | 497 (83.0%) | 491 (68.7%) |
| 12 to 14 Years | 251 (89.3%) | 279 (86.1%) |
| 15 Years | 107 (100.0%) | 85 (100.0%) |
| 16 and 17 Years | 183 (90.1%) | 202 (96.7%) |
| 18 to 24 Years | 350 (63.6%) | 382 (76.4%) |
| 25 to 34 Years | 744 (91.6%) | 659 (84.8%) |
| 35 to 44 Years | 760 (88.5%) | 693 (86.1%) |
| 45 to 54 Years | 612 (89.6%) | 660 (92.2%) |
| 55 to 64 Years | 890 (95.8%) | 890 (89.6%) |
| 65 to 74 Years | 702 (97.0%) | 748 (90.7%) |
| 75 Years and over | 417 (91.2%) | 581 (90.2%) |
| Total | 6,028 (88.6%) | 6,142 (85.9%) |
Income Below Poverty Among Married-Couple Families in Bourbon County
The poverty statistics for married-couple families in Bourbon County show that 3.5% or 103 of the total 2,951 families live below the poverty line. Families with 5 or more children have the highest poverty rate of 30.9%, comprising of 13 families. On the other hand, families with no children have the lowest poverty rate of 1.3%, which includes 24 families.
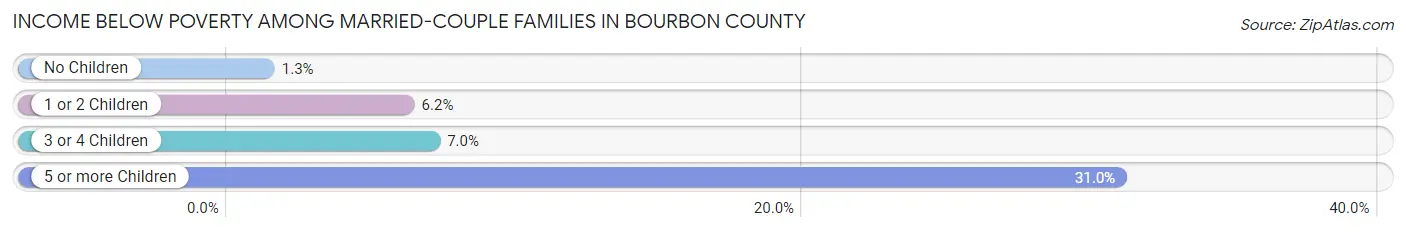
| Children | Above Poverty | Below Poverty |
| No Children | 1,851 (98.7%) | 24 (1.3%) |
| 1 or 2 Children | 717 (93.9%) | 47 (6.1%) |
| 3 or 4 Children | 251 (93.0%) | 19 (7.0%) |
| 5 or more Children | 29 (69.1%) | 13 (30.9%) |
| Total | 2,848 (96.5%) | 103 (3.5%) |
Income Below Poverty Among Single-Parent Households in Bourbon County
According to the poverty data in Bourbon County, 34.6% or 84 single-father households and 18.9% or 112 single-mother households are living below the poverty line. Among single-father households, those with 3 or 4 children have the highest poverty rate, with 21 households (72.4%) experiencing poverty. Likewise, among single-mother households, those with 5 or more children have the highest poverty rate, with 35 households (100.0%) falling below the poverty line.
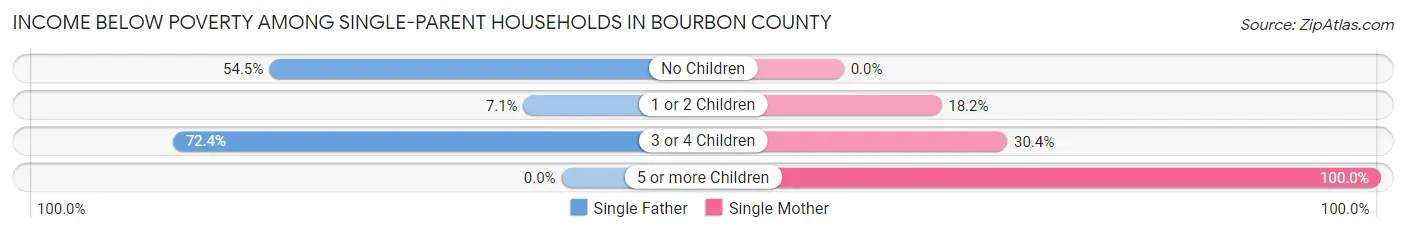
| Children | Single Father | Single Mother |
| No Children | 55 (54.5%) | 0 (0.0%) |
| 1 or 2 Children | 8 (7.1%) | 56 (18.2%) |
| 3 or 4 Children | 21 (72.4%) | 21 (30.4%) |
| 5 or more Children | 0 (0.0%) | 35 (100.0%) |
| Total | 84 (34.6%) | 112 (18.9%) |
Income Below Poverty Among Married-Couple vs Single-Parent Households in Bourbon County
The poverty data for Bourbon County shows that 103 of the married-couple family households (3.5%) and 196 of the single-parent households (23.4%) are living below the poverty level. Within the married-couple family households, those with 5 or more children have the highest poverty rate, with 13 households (30.9%) falling below the poverty line. Among the single-parent households, those with 5 or more children have the highest poverty rate, with 35 household (100.0%) living below poverty.
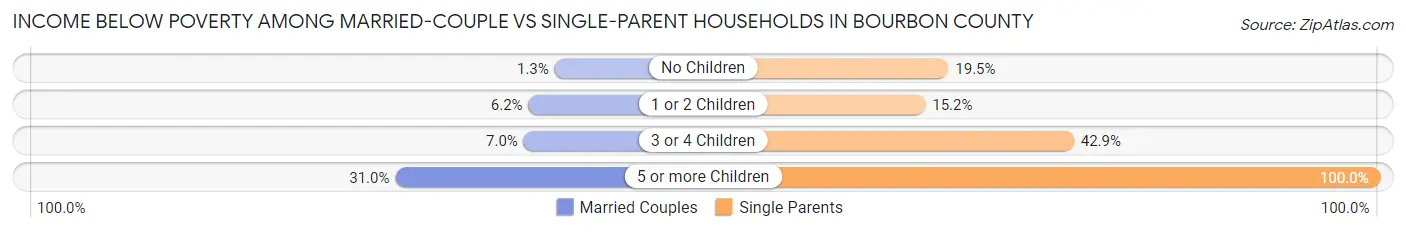
| Children | Married-Couple Families | Single-Parent Households |
| No Children | 24 (1.3%) | 55 (19.5%) |
| 1 or 2 Children | 47 (6.1%) | 64 (15.2%) |
| 3 or 4 Children | 19 (7.0%) | 42 (42.9%) |
| 5 or more Children | 13 (30.9%) | 35 (100.0%) |
| Total | 103 (3.5%) | 196 (23.4%) |
Race in Bourbon County
The most populous races in Bourbon County are White / Caucasian (13,024 | 90.4%), Two or more Races (738 | 5.1%), and Hispanic or Latino (452 | 3.1%).
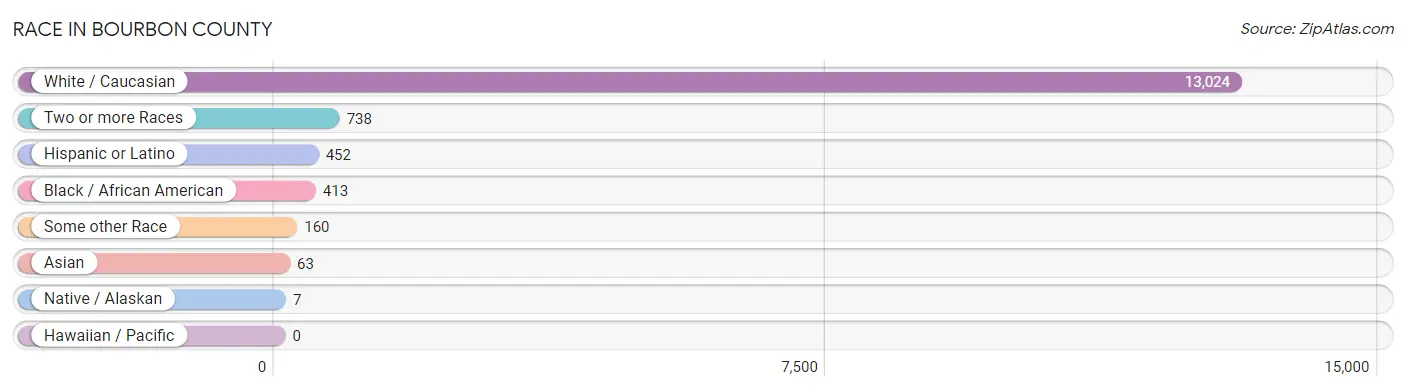
| Race | # Population | % Population |
| Asian | 63 | 0.4% |
| Black / African American | 413 | 2.9% |
| Hawaiian / Pacific | 0 | 0.0% |
| Hispanic or Latino | 452 | 3.1% |
| Native / Alaskan | 7 | 0.1% |
| White / Caucasian | 13,024 | 90.4% |
| Two or more Races | 738 | 5.1% |
| Some other Race | 160 | 1.1% |
| Total | 14,405 | 100.0% |
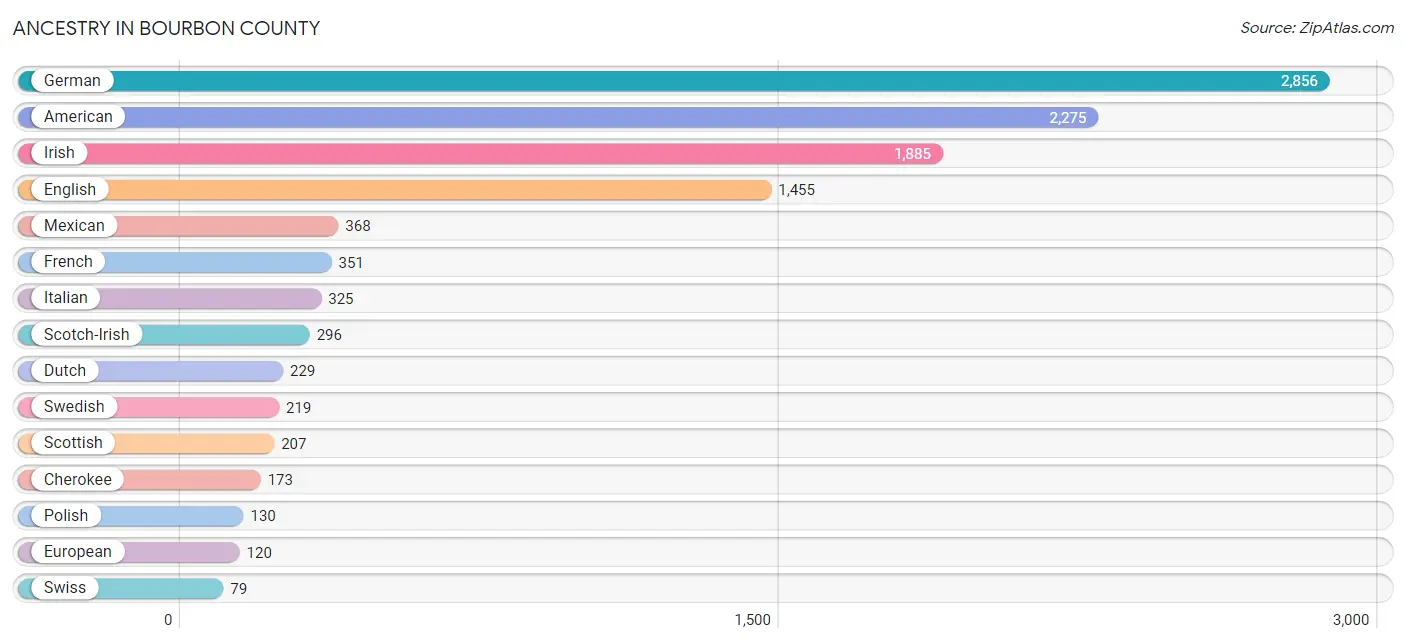
Ancestry in Bourbon County
The most populous ancestries reported in Bourbon County are German (2,856 | 19.8%), American (2,275 | 15.8%), Irish (1,885 | 13.1%), English (1,455 | 10.1%), and Mexican (368 | 2.5%), together accounting for 61.4% of all Bourbon County residents.
| Ancestry | # Population | % Population |
| African | 61 | 0.4% |
| American | 2,275 | 15.8% |
| Australian | 6 | 0.0% |
| Austrian | 24 | 0.2% |
| Bangladeshi | 16 | 0.1% |
| Bhutanese | 23 | 0.2% |
| Blackfeet | 2 | 0.0% |
| British | 44 | 0.3% |
| Central American | 35 | 0.2% |
| Cherokee | 173 | 1.2% |
| Chippewa | 2 | 0.0% |
| Choctaw | 1 | 0.0% |
| Comanche | 7 | 0.1% |
| Czech | 34 | 0.2% |
| Czechoslovakian | 1 | 0.0% |
| Danish | 27 | 0.2% |
| Dutch | 229 | 1.6% |
| Eastern European | 10 | 0.1% |
| English | 1,455 | 10.1% |
| European | 120 | 0.8% |
| French | 351 | 2.4% |
| French American Indian | 18 | 0.1% |
| German | 2,856 | 19.8% |
| Greek | 5 | 0.0% |
| Guamanian / Chamorro | 52 | 0.4% |
| Honduran | 35 | 0.2% |
| Irish | 1,885 | 13.1% |
| Italian | 325 | 2.3% |
| Japanese | 13 | 0.1% |
| Korean | 54 | 0.4% |
| Malaysian | 9 | 0.1% |
| Mexican | 368 | 2.5% |
| Navajo | 3 | 0.0% |
| Norwegian | 71 | 0.5% |
| Osage | 8 | 0.1% |
| Polish | 130 | 0.9% |
| Portuguese | 8 | 0.1% |
| Potawatomi | 5 | 0.0% |
| Puerto Rican | 15 | 0.1% |
| Russian | 8 | 0.1% |
| Scandinavian | 28 | 0.2% |
| Scotch-Irish | 296 | 2.1% |
| Scottish | 207 | 1.4% |
| Slovak | 47 | 0.3% |
| Slovene | 6 | 0.0% |
| South African | 2 | 0.0% |
| Spaniard | 26 | 0.2% |
| Sri Lankan | 36 | 0.3% |
| Subsaharan African | 63 | 0.4% |
| Swedish | 219 | 1.5% |
| Swiss | 79 | 0.5% |
| Thai | 47 | 0.3% |
| Turkish | 15 | 0.1% |
| Welsh | 53 | 0.4% |
| Yaqui | 4 | 0.0% | View All 55 Rows |
Immigrants in Bourbon County
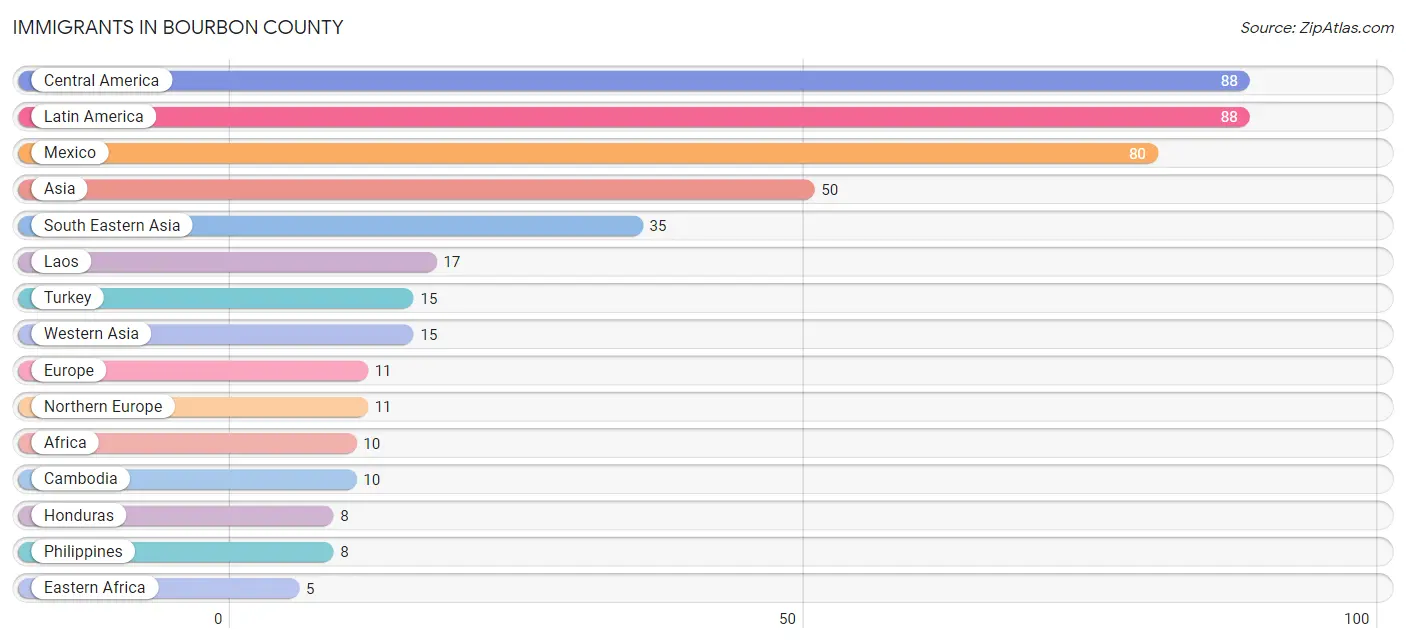
The most numerous immigrant groups reported in Bourbon County came from Central America (88 | 0.6%), Latin America (88 | 0.6%), Mexico (80 | 0.6%), Asia (50 | 0.4%), and South Eastern Asia (35 | 0.2%), together accounting for 2.4% of all Bourbon County residents.
| Immigration Origin | # Population | % Population |
| Africa | 10 | 0.1% |
| Asia | 50 | 0.4% |
| Cambodia | 10 | 0.1% |
| Central America | 88 | 0.6% |
| Eastern Africa | 5 | 0.0% |
| Europe | 11 | 0.1% |
| Honduras | 8 | 0.1% |
| Kenya | 5 | 0.0% |
| Laos | 17 | 0.1% |
| Latin America | 88 | 0.6% |
| Mexico | 80 | 0.6% |
| Nigeria | 5 | 0.0% |
| Northern Europe | 11 | 0.1% |
| Philippines | 8 | 0.1% |
| South Eastern Asia | 35 | 0.2% |
| Turkey | 15 | 0.1% |
| Western Africa | 5 | 0.0% |
| Western Asia | 15 | 0.1% | View All 18 Rows |
Sex and Age in Bourbon County
Sex and Age in Bourbon County
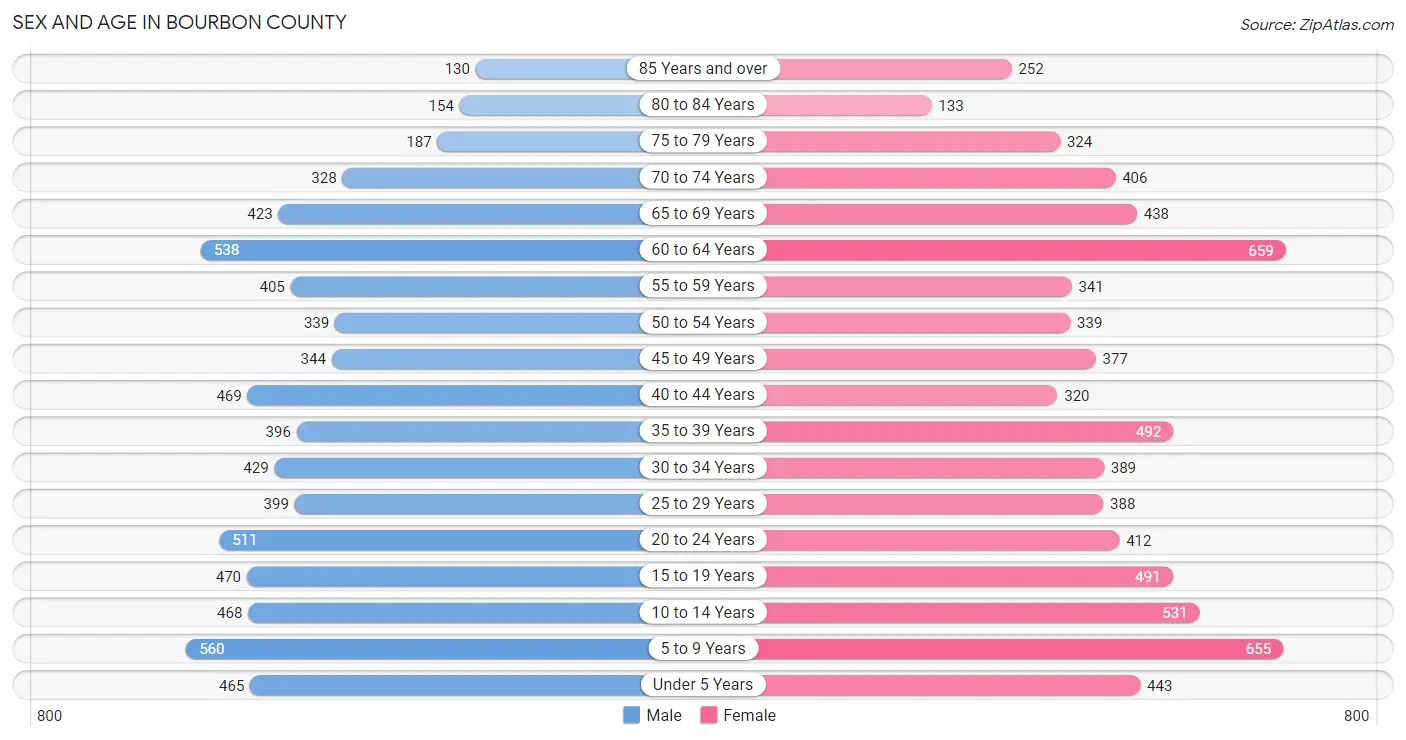
The most populous age groups in Bourbon County are 5 to 9 Years (560 | 8.0%) for men and 60 to 64 Years (659 | 8.9%) for women.
| Age Bracket | Male | Female |
| Under 5 Years | 465 (6.6%) | 443 (6.0%) |
| 5 to 9 Years | 560 (8.0%) | 655 (8.9%) |
| 10 to 14 Years | 468 (6.7%) | 531 (7.2%) |
| 15 to 19 Years | 470 (6.7%) | 491 (6.6%) |
| 20 to 24 Years | 511 (7.3%) | 412 (5.6%) |
| 25 to 29 Years | 399 (5.7%) | 388 (5.2%) |
| 30 to 34 Years | 429 (6.1%) | 389 (5.3%) |
| 35 to 39 Years | 396 (5.7%) | 492 (6.7%) |
| 40 to 44 Years | 469 (6.7%) | 320 (4.3%) |
| 45 to 49 Years | 344 (4.9%) | 377 (5.1%) |
| 50 to 54 Years | 339 (4.8%) | 339 (4.6%) |
| 55 to 59 Years | 405 (5.8%) | 341 (4.6%) |
| 60 to 64 Years | 538 (7.7%) | 659 (8.9%) |
| 65 to 69 Years | 423 (6.0%) | 438 (5.9%) |
| 70 to 74 Years | 328 (4.7%) | 406 (5.5%) |
| 75 to 79 Years | 187 (2.7%) | 324 (4.4%) |
| 80 to 84 Years | 154 (2.2%) | 133 (1.8%) |
| 85 Years and over | 130 (1.8%) | 252 (3.4%) |
| Total | 7,015 (100.0%) | 7,390 (100.0%) |
Families and Households in Bourbon County
Median Family Size in Bourbon County
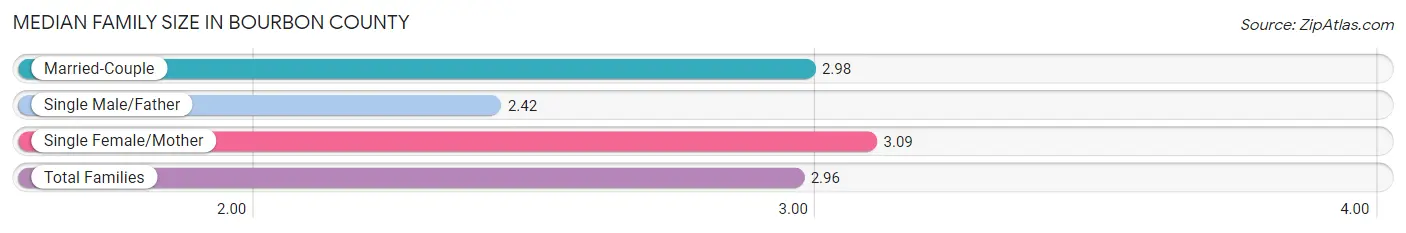
The median family size in Bourbon County is 2.96 persons per family, with single female/mother families (593 | 15.7%) accounting for the largest median family size of 3.09 persons per family. On the other hand, single male/father families (243 | 6.4%) represent the smallest median family size with 2.42 persons per family.
| Family Type | # Families | Family Size |
| Married-Couple | 2,951 (77.9%) | 2.98 |
| Single Male/Father | 243 (6.4%) | 2.42 |
| Single Female/Mother | 593 (15.7%) | 3.09 |
| Total Families | 3,787 (100.0%) | 2.96 |
Median Household Size in Bourbon County
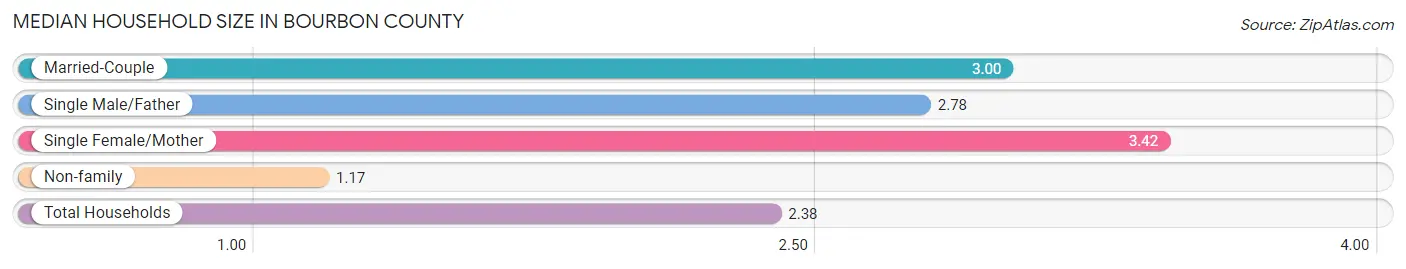
The median household size in Bourbon County is 2.38 persons per household, with single female/mother households (593 | 10.1%) accounting for the largest median household size of 3.42 persons per household. non-family households (2,088 | 35.5%) represent the smallest median household size with 1.17 persons per household.
| Household Type | # Households | Household Size |
| Married-Couple | 2,951 (50.2%) | 3.00 |
| Single Male/Father | 243 (4.1%) | 2.78 |
| Single Female/Mother | 593 (10.1%) | 3.42 |
| Non-family | 2,088 (35.5%) | 1.17 |
| Total Households | 5,875 (100.0%) | 2.38 |
Household Size by Marriage Status in Bourbon County
Out of a total of 5,875 households in Bourbon County, 3,787 (64.5%) are family households, while 2,088 (35.5%) are nonfamily households. The most numerous type of family households are 2-person households, comprising 2,066, and the most common type of nonfamily households are 1-person households, comprising 1,726.
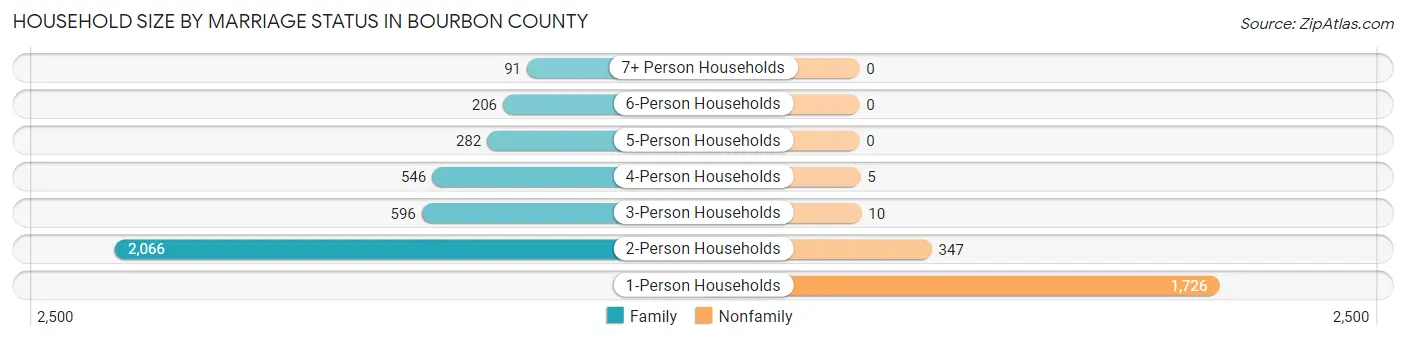
| Household Size | Family Households | Nonfamily Households |
| 1-Person Households | - | 1,726 (29.4%) |
| 2-Person Households | 2,066 (35.2%) | 347 (5.9%) |
| 3-Person Households | 596 (10.1%) | 10 (0.2%) |
| 4-Person Households | 546 (9.3%) | 5 (0.1%) |
| 5-Person Households | 282 (4.8%) | 0 (0.0%) |
| 6-Person Households | 206 (3.5%) | 0 (0.0%) |
| 7+ Person Households | 91 (1.5%) | 0 (0.0%) |
| Total | 3,787 (64.5%) | 2,088 (35.5%) |
Female Fertility in Bourbon County
Fertility by Age in Bourbon County
Average fertility rate in Bourbon County is 68.0 births per 1,000 women. Women in the age bracket of 20 to 34 years have the highest fertility rate with 125.0 births per 1,000 women. Women in the age bracket of 20 to 34 years acount for 74.5% of all women with births.
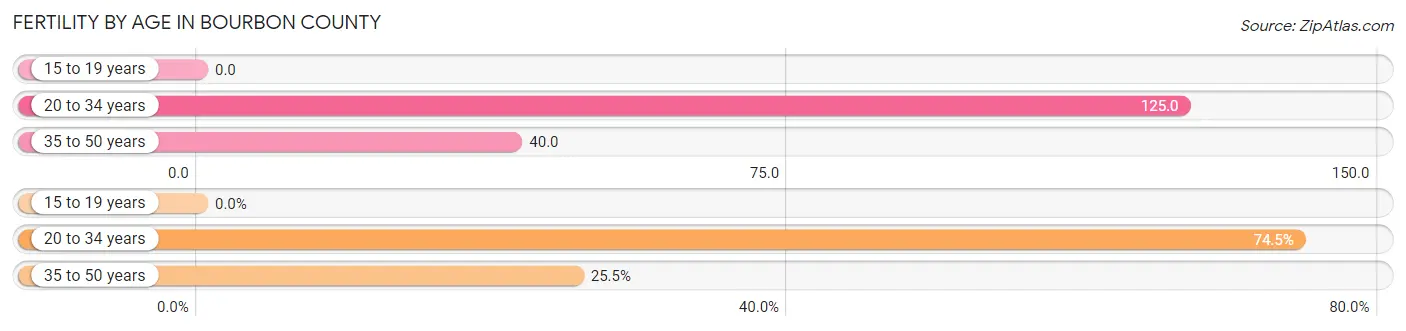
| Age Bracket | Women with Births | Births / 1,000 Women |
| 15 to 19 years | 0 (0.0%) | 0.0 |
| 20 to 34 years | 149 (74.5%) | 125.0 |
| 35 to 50 years | 51 (25.5%) | 40.0 |
| Total | 200 (100.0%) | 68.0 |
Fertility by Age by Marriage Status in Bourbon County
57.5% of women with births (200) in Bourbon County are married. The highest percentage of unmarried women with births falls into 20 to 34 years age bracket with 54.4% of them unmarried at the time of birth, while the lowest percentage of unmarried women with births belong to 35 to 50 years age bracket with 7.8% of them unmarried.
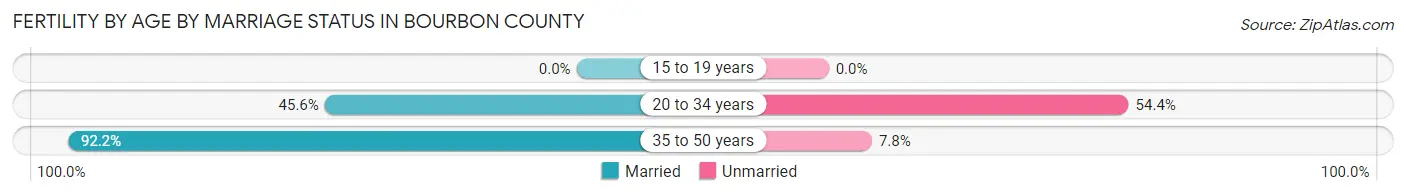
| Age Bracket | Married | Unmarried |
| 15 to 19 years | 0 (0.0%) | 0 (0.0%) |
| 20 to 34 years | 68 (45.6%) | 81 (54.4%) |
| 35 to 50 years | 47 (92.2%) | 4 (7.8%) |
| Total | 115 (57.5%) | 85 (42.5%) |
Fertility by Education in Bourbon County
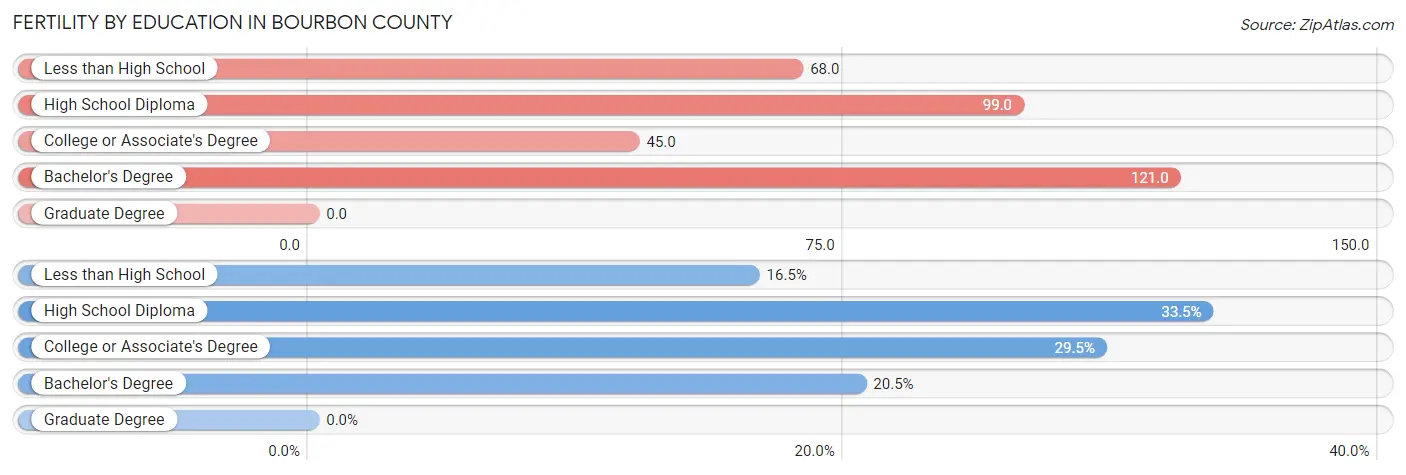
| Educational Attainment | Women with Births | Births / 1,000 Women |
| Less than High School | 33 (16.5%) | 68.0 |
| High School Diploma | 67 (33.5%) | 99.0 |
| College or Associate's Degree | 59 (29.5%) | 45.0 |
| Bachelor's Degree | 41 (20.5%) | 121.0 |
| Graduate Degree | 0 (0.0%) | 0.0 |
| Total | 200 (100.0%) | 68.0 |
Fertility by Education by Marriage Status in Bourbon County
42.5% of women with births in Bourbon County are unmarried. Women with the educational attainment of bachelor's degree are most likely to be married with 100.0% of them married at childbirth, while women with the educational attainment of less than high school are least likely to be married with 100.0% of them unmarried at childbirth.
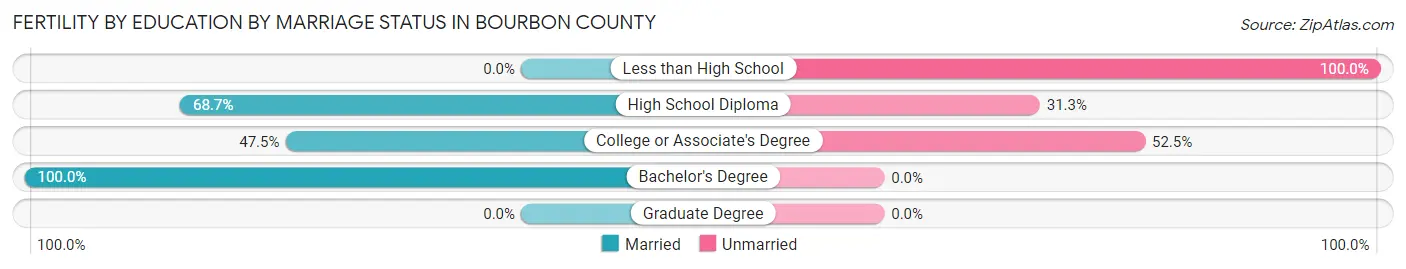
| Educational Attainment | Married | Unmarried |
| Less than High School | 0 (0.0%) | 33 (100.0%) |
| High School Diploma | 46 (68.7%) | 21 (31.3%) |
| College or Associate's Degree | 28 (47.5%) | 31 (52.5%) |
| Bachelor's Degree | 41 (100.0%) | 0 (0.0%) |
| Graduate Degree | 0 (0.0%) | 0 (0.0%) |
| Total | 115 (57.5%) | 85 (42.5%) |
Employment Characteristics in Bourbon County
Employment by Class of Employer in Bourbon County
Among the 6,404 employed individuals in Bourbon County, private company employees (4,371 | 68.2%), not-for-profit organizations (633 | 9.9%), and local government employees (450 | 7.0%) make up the most common classes of employment.
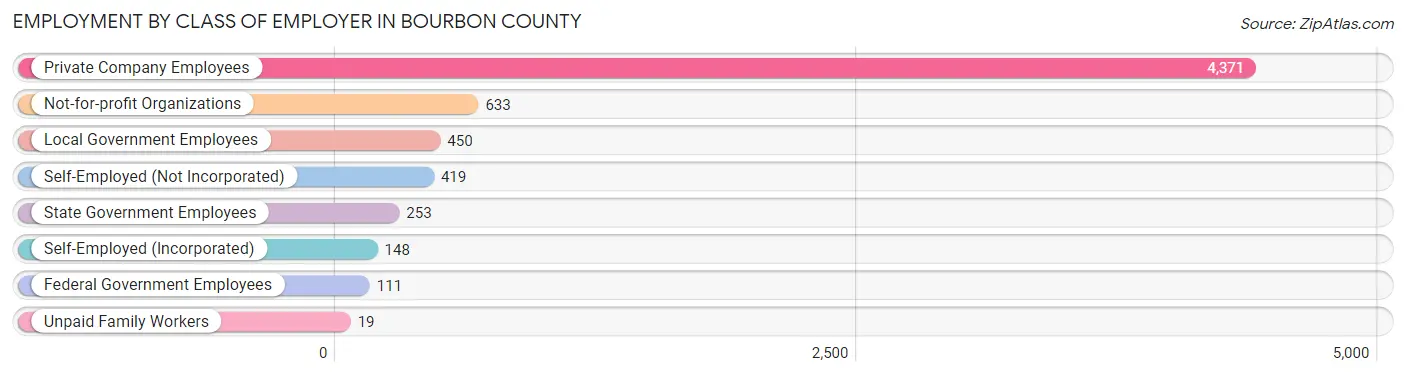
| Employer Class | # Employees | % Employees |
| Private Company Employees | 4,371 | 68.2% |
| Self-Employed (Incorporated) | 148 | 2.3% |
| Self-Employed (Not Incorporated) | 419 | 6.5% |
| Not-for-profit Organizations | 633 | 9.9% |
| Local Government Employees | 450 | 7.0% |
| State Government Employees | 253 | 4.0% |
| Federal Government Employees | 111 | 1.7% |
| Unpaid Family Workers | 19 | 0.3% |
| Total | 6,404 | 100.0% |
Employment Status by Age in Bourbon County
According to the labor force statistics for Bourbon County, out of the total population over 16 years of age (11,091), 61.0% or 6,766 individuals are in the labor force, with 3.8% or 257 of them unemployed. The age group with the highest labor force participation rate is 25 to 29 years, with 85.3% or 671 individuals in the labor force. Within the labor force, the 20 to 24 years age range has the highest percentage of unemployed individuals, with 11.7% or 89 of them being unemployed.
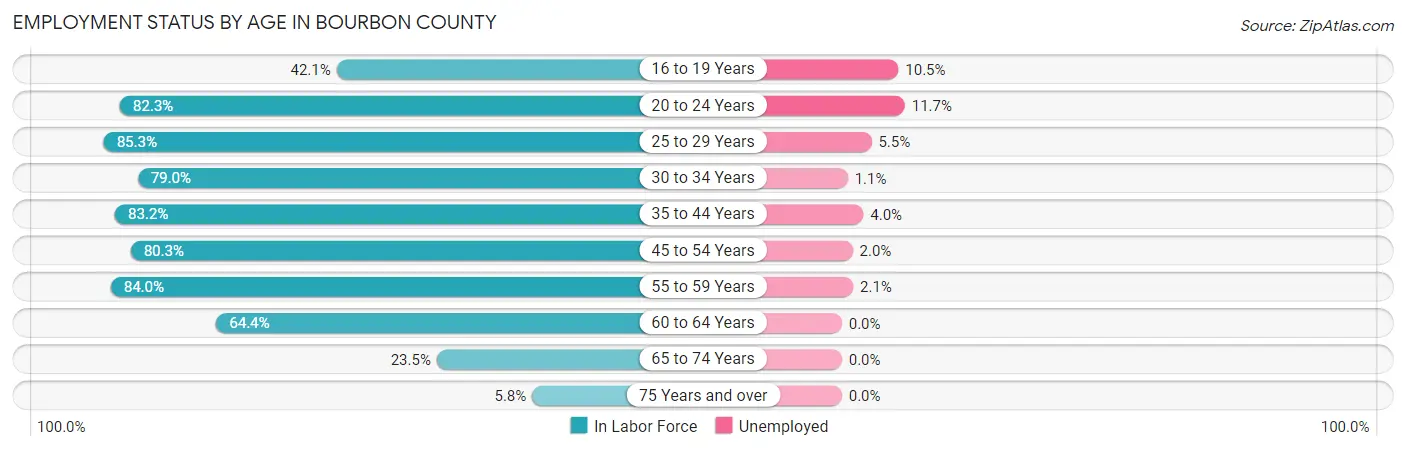
| Age Bracket | In Labor Force | Unemployed |
| 16 to 19 Years | 324 (42.1%) | 34 (10.5%) |
| 20 to 24 Years | 760 (82.3%) | 89 (11.7%) |
| 25 to 29 Years | 671 (85.3%) | 37 (5.5%) |
| 30 to 34 Years | 646 (79.0%) | 7 (1.1%) |
| 35 to 44 Years | 1,395 (83.2%) | 56 (4.0%) |
| 45 to 54 Years | 1,123 (80.3%) | 22 (2.0%) |
| 55 to 59 Years | 627 (84.0%) | 13 (2.1%) |
| 60 to 64 Years | 771 (64.4%) | 0 (0.0%) |
| 65 to 74 Years | 375 (23.5%) | 0 (0.0%) |
| 75 Years and over | 68 (5.8%) | 0 (0.0%) |
| Total | 6,766 (61.0%) | 257 (3.8%) |
Employment Status by Educational Attainment in Bourbon County
According to labor force statistics for Bourbon County, 79.0% of individuals (5,233) out of the total population between 25 and 64 years of age (6,624) are in the labor force, with 2.6% or 136 of them being unemployed. The group with the highest labor force participation rate are those with the educational attainment of college / associate degree, with 86.2% or 2,211 individuals in the labor force. Within the labor force, individuals with less than high school education have the highest percentage of unemployment, with 4.7% or 18 of them being unemployed.
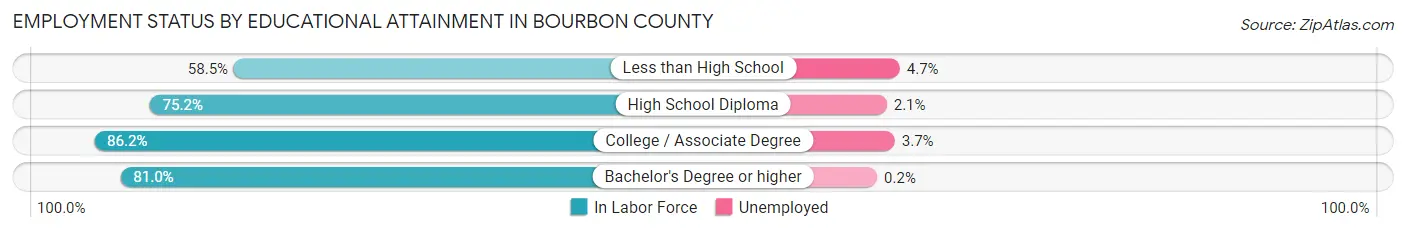
| Educational Attainment | In Labor Force | Unemployed |
| Less than High School | 387 (58.5%) | 31 (4.7%) |
| High School Diploma | 1,511 (75.2%) | 42 (2.1%) |
| College / Associate Degree | 2,211 (86.2%) | 95 (3.7%) |
| Bachelor's Degree or higher | 1,125 (81.0%) | 3 (0.2%) |
| Total | 5,233 (79.0%) | 172 (2.6%) |
Employment Occupations by Sex in Bourbon County
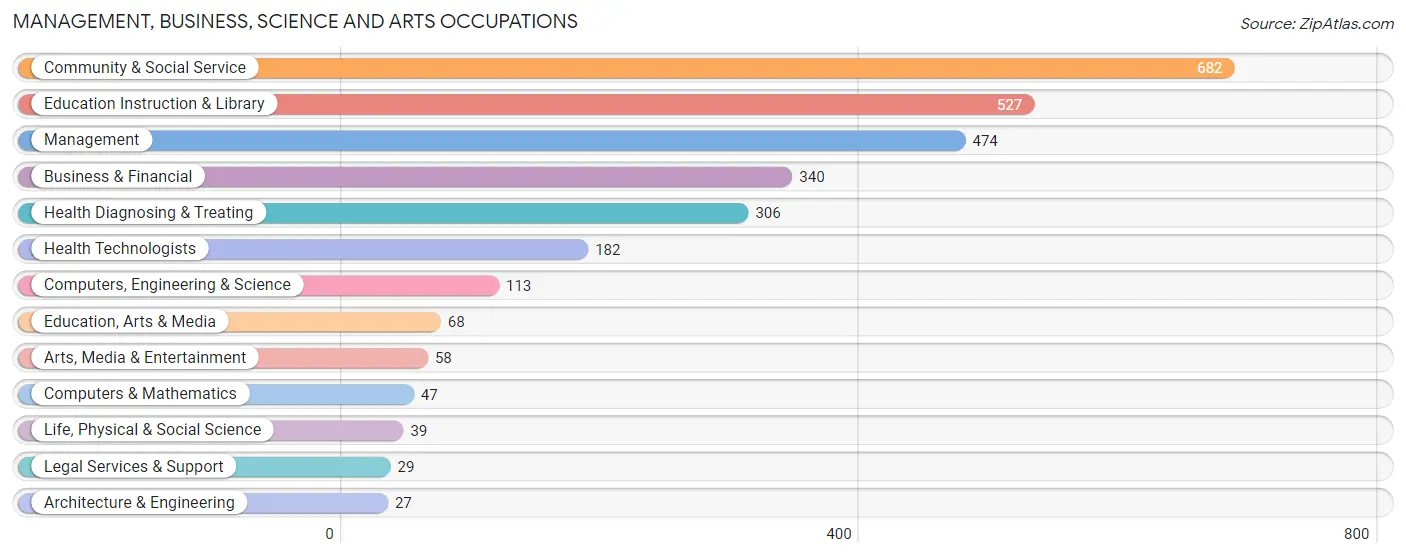
Management, Business, Science and Arts Occupations
The most common Management, Business, Science and Arts occupations in Bourbon County are Community & Social Service (682 | 10.5%), Education Instruction & Library (527 | 8.1%), Management (474 | 7.3%), Business & Financial (340 | 5.2%), and Health Diagnosing & Treating (306 | 4.7%).
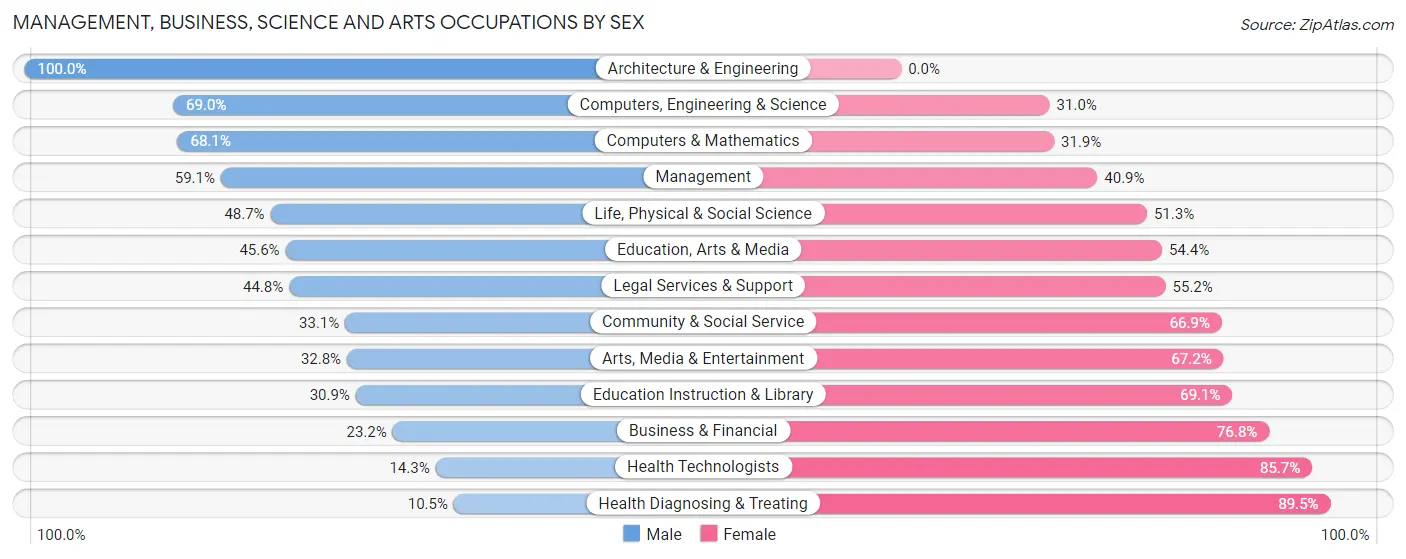
Management, Business, Science and Arts Occupations by Sex
Within the Management, Business, Science and Arts occupations in Bourbon County, the most male-oriented occupations are Architecture & Engineering (100.0%), Computers, Engineering & Science (69.0%), and Computers & Mathematics (68.1%), while the most female-oriented occupations are Health Diagnosing & Treating (89.5%), Health Technologists (85.7%), and Business & Financial (76.8%).
| Occupation | Male | Female |
| Management | 280 (59.1%) | 194 (40.9%) |
| Business & Financial | 79 (23.2%) | 261 (76.8%) |
| Computers, Engineering & Science | 78 (69.0%) | 35 (31.0%) |
| Computers & Mathematics | 32 (68.1%) | 15 (31.9%) |
| Architecture & Engineering | 27 (100.0%) | 0 (0.0%) |
| Life, Physical & Social Science | 19 (48.7%) | 20 (51.3%) |
| Community & Social Service | 226 (33.1%) | 456 (66.9%) |
| Education, Arts & Media | 31 (45.6%) | 37 (54.4%) |
| Legal Services & Support | 13 (44.8%) | 16 (55.2%) |
| Education Instruction & Library | 163 (30.9%) | 364 (69.1%) |
| Arts, Media & Entertainment | 19 (32.8%) | 39 (67.2%) |
| Health Diagnosing & Treating | 32 (10.5%) | 274 (89.5%) |
| Health Technologists | 26 (14.3%) | 156 (85.7%) |
| Total (Category) | 695 (36.3%) | 1,220 (63.7%) |
| Total (Overall) | 3,485 (53.6%) | 3,015 (46.4%) |
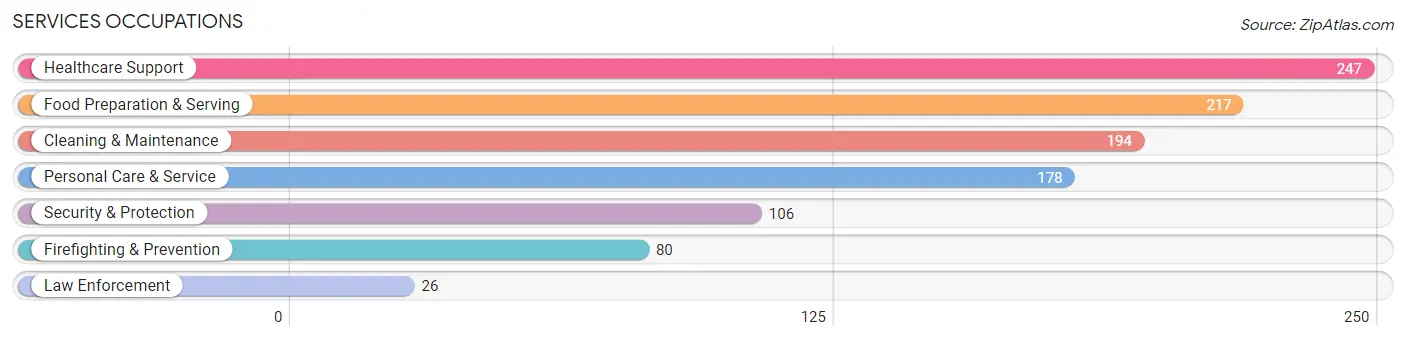
Services Occupations
The most common Services occupations in Bourbon County are Healthcare Support (247 | 3.8%), Food Preparation & Serving (217 | 3.3%), Cleaning & Maintenance (194 | 3.0%), Personal Care & Service (178 | 2.7%), and Security & Protection (106 | 1.6%).
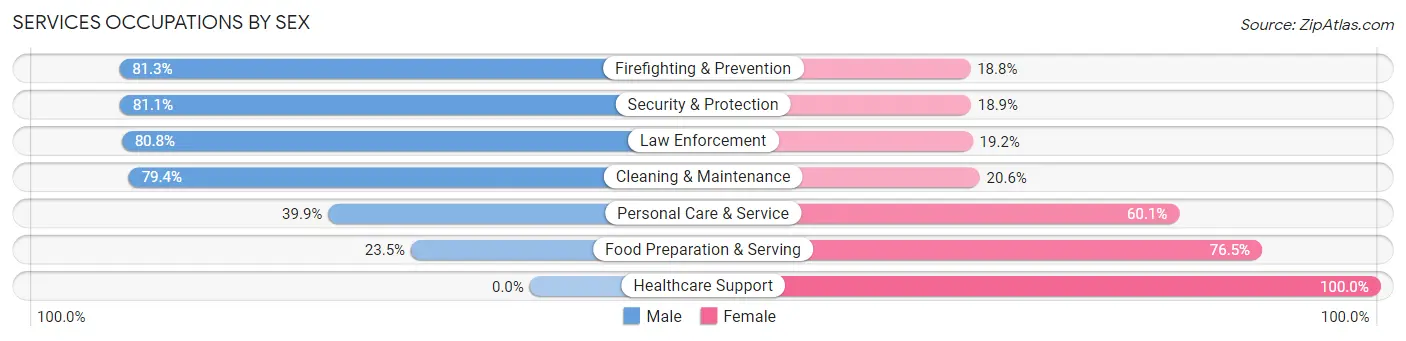
Services Occupations by Sex
Within the Services occupations in Bourbon County, the most male-oriented occupations are Firefighting & Prevention (81.2%), Security & Protection (81.1%), and Law Enforcement (80.8%), while the most female-oriented occupations are Healthcare Support (100.0%), Food Preparation & Serving (76.5%), and Personal Care & Service (60.1%).
| Occupation | Male | Female |
| Healthcare Support | 0 (0.0%) | 247 (100.0%) |
| Security & Protection | 86 (81.1%) | 20 (18.9%) |
| Firefighting & Prevention | 65 (81.2%) | 15 (18.8%) |
| Law Enforcement | 21 (80.8%) | 5 (19.2%) |
| Food Preparation & Serving | 51 (23.5%) | 166 (76.5%) |
| Cleaning & Maintenance | 154 (79.4%) | 40 (20.6%) |
| Personal Care & Service | 71 (39.9%) | 107 (60.1%) |
| Total (Category) | 362 (38.4%) | 580 (61.6%) |
| Total (Overall) | 3,485 (53.6%) | 3,015 (46.4%) |
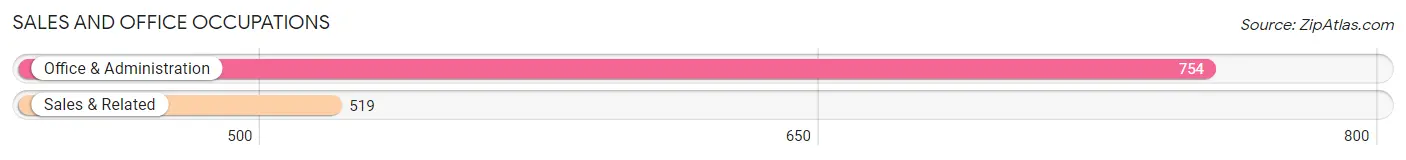
Sales and Office Occupations
The most common Sales and Office occupations in Bourbon County are Office & Administration (754 | 11.6%), and Sales & Related (519 | 8.0%).
Sales and Office Occupations by Sex
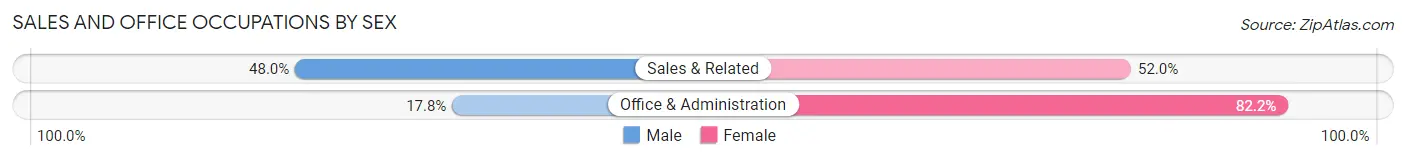
| Occupation | Male | Female |
| Sales & Related | 249 (48.0%) | 270 (52.0%) |
| Office & Administration | 134 (17.8%) | 620 (82.2%) |
| Total (Category) | 383 (30.1%) | 890 (69.9%) |
| Total (Overall) | 3,485 (53.6%) | 3,015 (46.4%) |
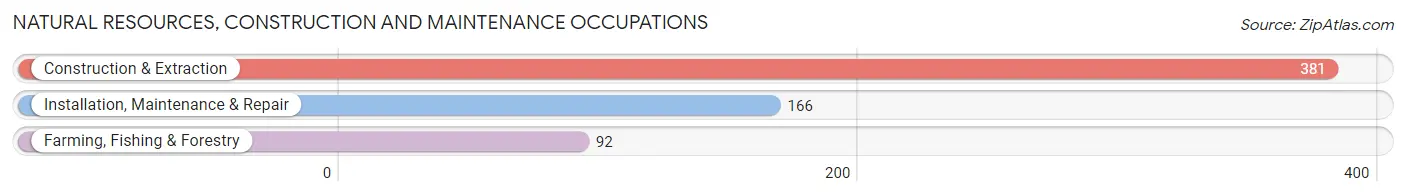
Natural Resources, Construction and Maintenance Occupations
The most common Natural Resources, Construction and Maintenance occupations in Bourbon County are Construction & Extraction (381 | 5.9%), Installation, Maintenance & Repair (166 | 2.5%), and Farming, Fishing & Forestry (92 | 1.4%).
Natural Resources, Construction and Maintenance Occupations by Sex
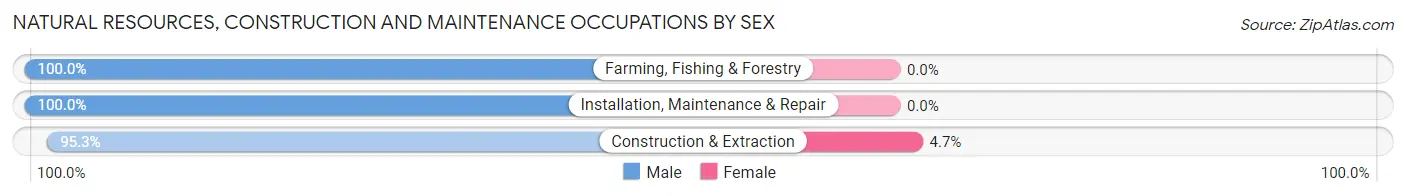
| Occupation | Male | Female |
| Farming, Fishing & Forestry | 92 (100.0%) | 0 (0.0%) |
| Construction & Extraction | 363 (95.3%) | 18 (4.7%) |
| Installation, Maintenance & Repair | 166 (100.0%) | 0 (0.0%) |
| Total (Category) | 621 (97.2%) | 18 (2.8%) |
| Total (Overall) | 3,485 (53.6%) | 3,015 (46.4%) |
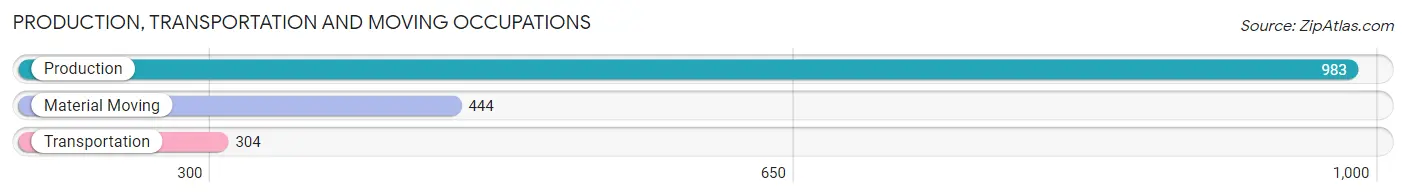
Production, Transportation and Moving Occupations
The most common Production, Transportation and Moving occupations in Bourbon County are Production (983 | 15.1%), Material Moving (444 | 6.8%), and Transportation (304 | 4.7%).
Production, Transportation and Moving Occupations by Sex
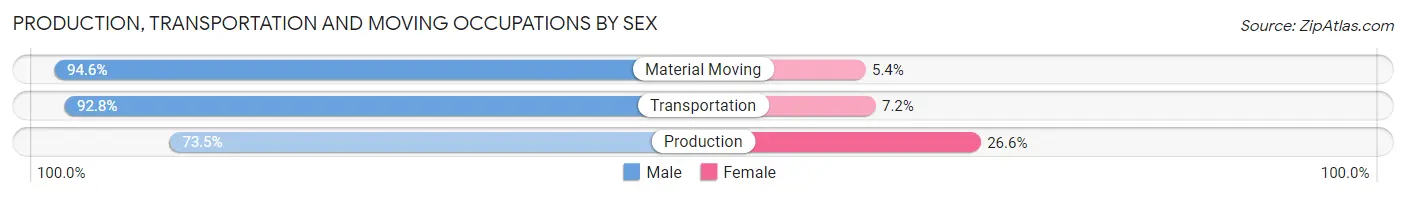
| Occupation | Male | Female |
| Production | 722 (73.5%) | 261 (26.6%) |
| Transportation | 282 (92.8%) | 22 (7.2%) |
| Material Moving | 420 (94.6%) | 24 (5.4%) |
| Total (Category) | 1,424 (82.3%) | 307 (17.7%) |
| Total (Overall) | 3,485 (53.6%) | 3,015 (46.4%) |
Employment Industries by Sex in Bourbon County
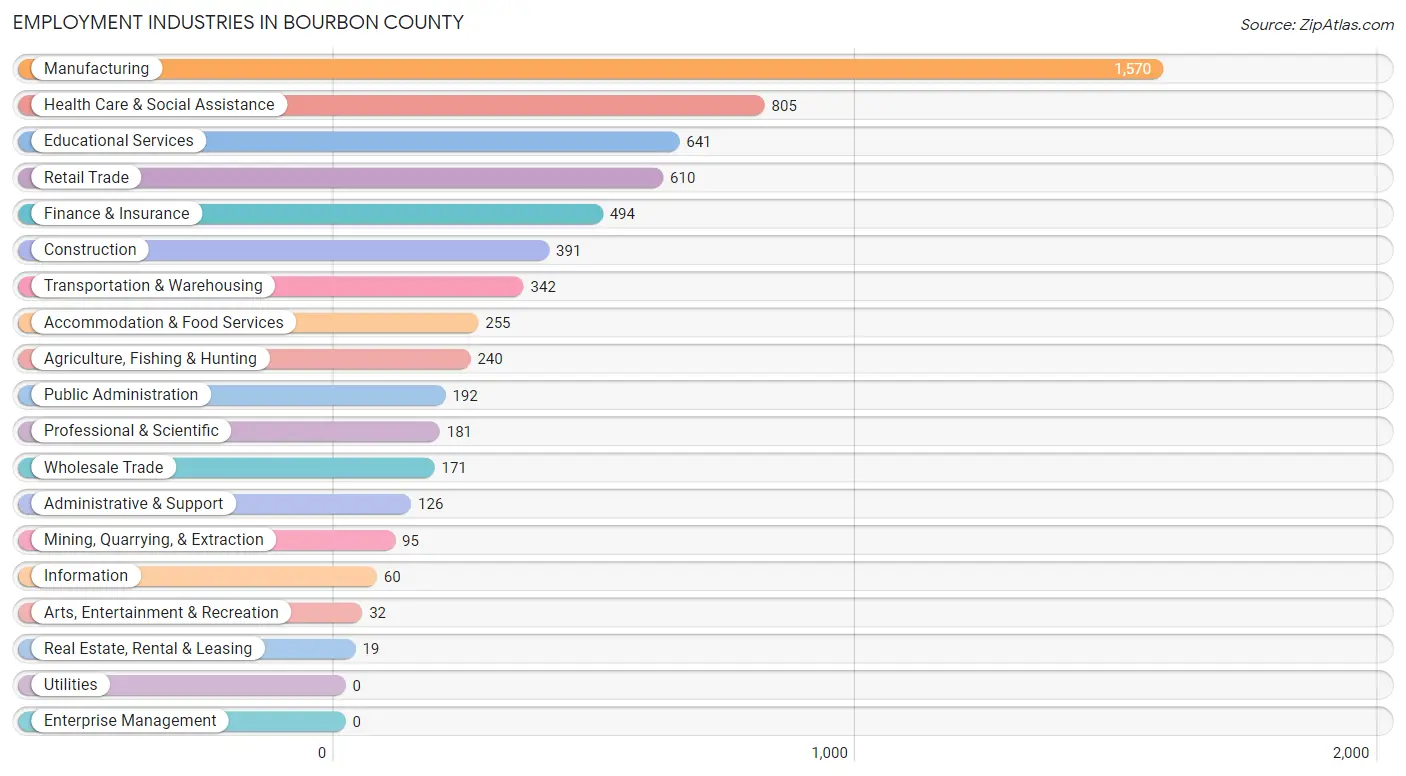
Employment Industries in Bourbon County
The major employment industries in Bourbon County include Manufacturing (1,570 | 24.1%), Health Care & Social Assistance (805 | 12.4%), Educational Services (641 | 9.9%), Retail Trade (610 | 9.4%), and Finance & Insurance (494 | 7.6%).
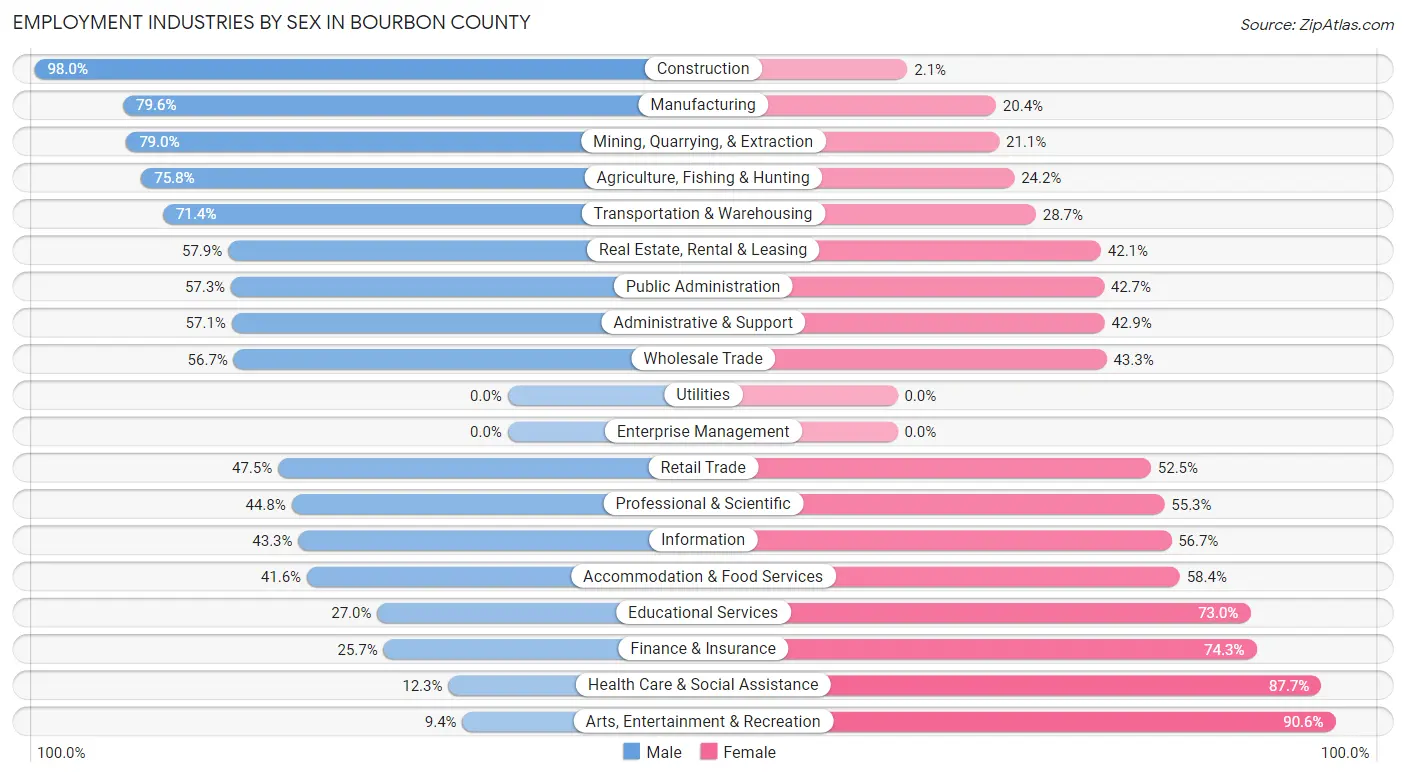
Employment Industries by Sex in Bourbon County
The Bourbon County industries that see more men than women are Construction (98.0%), Manufacturing (79.6%), and Mining, Quarrying, & Extraction (78.9%), whereas the industries that tend to have a higher number of women are Arts, Entertainment & Recreation (90.6%), Health Care & Social Assistance (87.7%), and Finance & Insurance (74.3%).
| Industry | Male | Female |
| Agriculture, Fishing & Hunting | 182 (75.8%) | 58 (24.2%) |
| Mining, Quarrying, & Extraction | 75 (78.9%) | 20 (21.0%) |
| Construction | 383 (98.0%) | 8 (2.1%) |
| Manufacturing | 1,250 (79.6%) | 320 (20.4%) |
| Wholesale Trade | 97 (56.7%) | 74 (43.3%) |
| Retail Trade | 290 (47.5%) | 320 (52.5%) |
| Transportation & Warehousing | 244 (71.4%) | 98 (28.6%) |
| Utilities | 0 (0.0%) | 0 (0.0%) |
| Information | 26 (43.3%) | 34 (56.7%) |
| Finance & Insurance | 127 (25.7%) | 367 (74.3%) |
| Real Estate, Rental & Leasing | 11 (57.9%) | 8 (42.1%) |
| Professional & Scientific | 81 (44.8%) | 100 (55.2%) |
| Enterprise Management | 0 (0.0%) | 0 (0.0%) |
| Administrative & Support | 72 (57.1%) | 54 (42.9%) |
| Educational Services | 173 (27.0%) | 468 (73.0%) |
| Health Care & Social Assistance | 99 (12.3%) | 706 (87.7%) |
| Arts, Entertainment & Recreation | 3 (9.4%) | 29 (90.6%) |
| Accommodation & Food Services | 106 (41.6%) | 149 (58.4%) |
| Public Administration | 110 (57.3%) | 82 (42.7%) |
| Total | 3,485 (53.6%) | 3,015 (46.4%) |
Education in Bourbon County
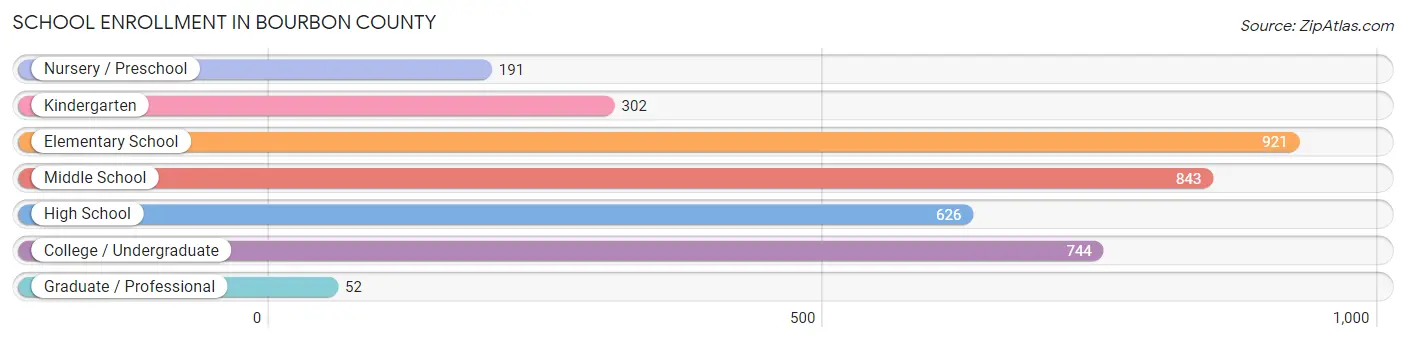
School Enrollment in Bourbon County
The most common levels of schooling among the 3,679 students in Bourbon County are elementary school (921 | 25.0%), middle school (843 | 22.9%), and college / undergraduate (744 | 20.2%).
| School Level | # Students | % Students |
| Nursery / Preschool | 191 | 5.2% |
| Kindergarten | 302 | 8.2% |
| Elementary School | 921 | 25.0% |
| Middle School | 843 | 22.9% |
| High School | 626 | 17.0% |
| College / Undergraduate | 744 | 20.2% |
| Graduate / Professional | 52 | 1.4% |
| Total | 3,679 | 100.0% |
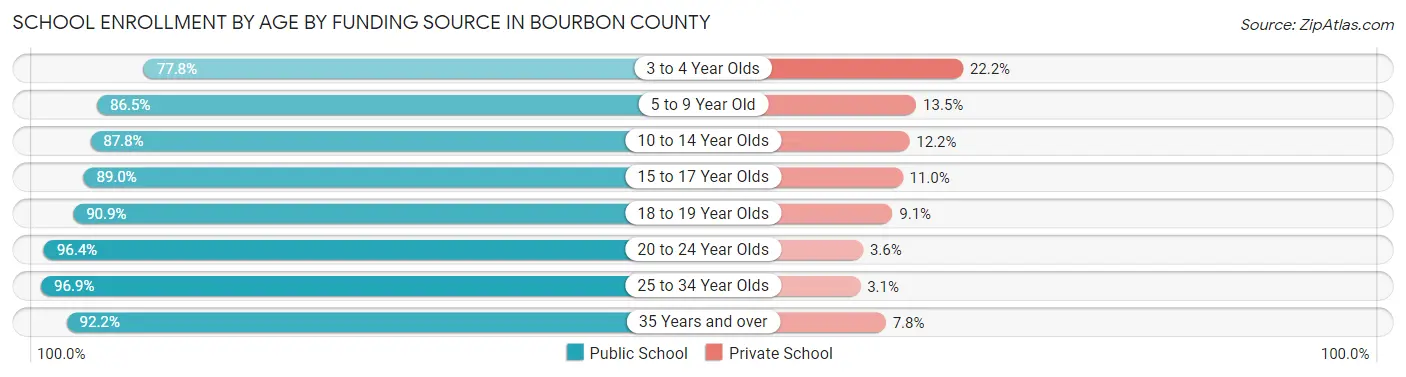
School Enrollment by Age by Funding Source in Bourbon County
Out of a total of 3,679 students who are enrolled in schools in Bourbon County, 419 (11.4%) attend a private institution, while the remaining 3,260 (88.6%) are enrolled in public schools. The age group of 3 to 4 year olds has the highest likelihood of being enrolled in private schools, with 30 (22.2% in the age bracket) enrolled. Conversely, the age group of 25 to 34 year olds has the lowest likelihood of being enrolled in a private school, with 63 (96.9% in the age bracket) attending a public institution.
| Age Bracket | Public School | Private School |
| 3 to 4 Year Olds | 105 (77.8%) | 30 (22.2%) |
| 5 to 9 Year Old | 1,051 (86.5%) | 164 (13.5%) |
| 10 to 14 Year Olds | 832 (87.8%) | 116 (12.2%) |
| 15 to 17 Year Olds | 487 (89.0%) | 60 (11.0%) |
| 18 to 19 Year Olds | 241 (90.9%) | 24 (9.1%) |
| 20 to 24 Year Olds | 375 (96.4%) | 14 (3.6%) |
| 25 to 34 Year Olds | 63 (96.9%) | 2 (3.1%) |
| 35 Years and over | 106 (92.2%) | 9 (7.8%) |
| Total | 3,260 (88.6%) | 419 (11.4%) |
Educational Attainment by Field of Study in Bourbon County
Education (658 | 28.1%), business (454 | 19.4%), science & technology (338 | 14.4%), arts & humanities (167 | 7.1%), and bio, nature & agricultural (131 | 5.6%) are the most common fields of study among 2,344 individuals in Bourbon County who have obtained a bachelor's degree or higher.
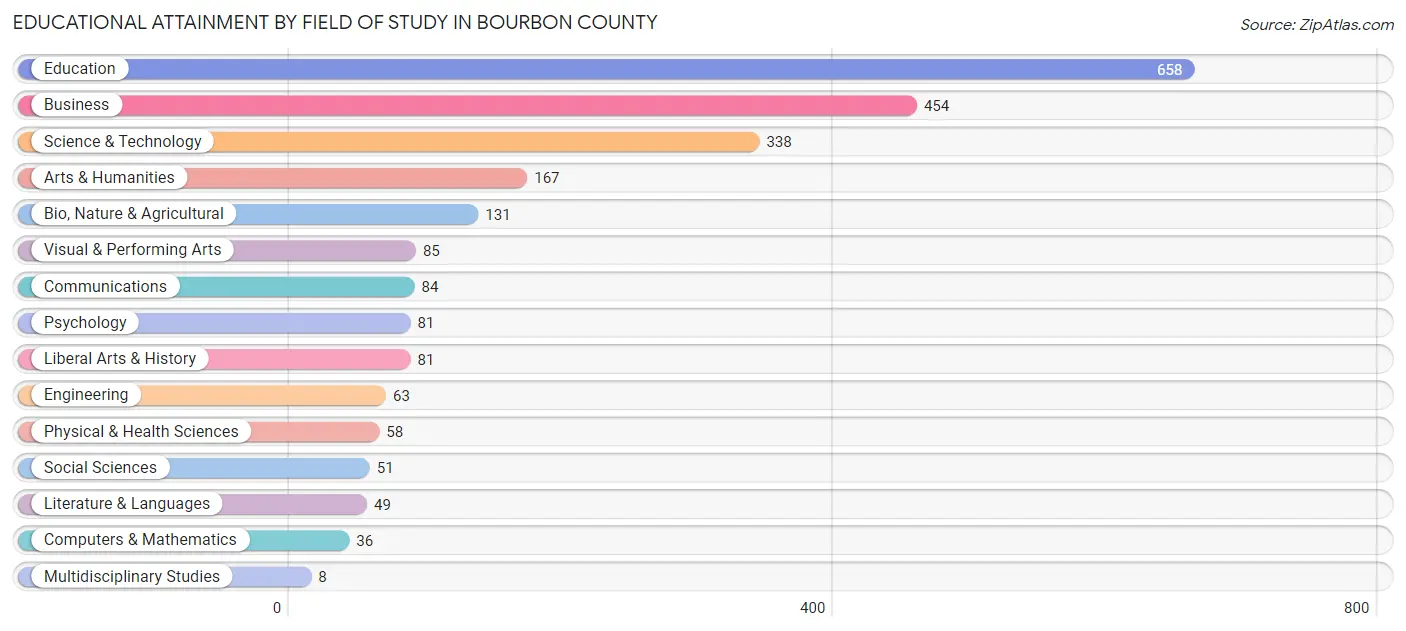
| Field of Study | # Graduates | % Graduates |
| Computers & Mathematics | 36 | 1.5% |
| Bio, Nature & Agricultural | 131 | 5.6% |
| Physical & Health Sciences | 58 | 2.5% |
| Psychology | 81 | 3.5% |
| Social Sciences | 51 | 2.2% |
| Engineering | 63 | 2.7% |
| Multidisciplinary Studies | 8 | 0.3% |
| Science & Technology | 338 | 14.4% |
| Business | 454 | 19.4% |
| Education | 658 | 28.1% |
| Literature & Languages | 49 | 2.1% |
| Liberal Arts & History | 81 | 3.5% |
| Visual & Performing Arts | 85 | 3.6% |
| Communications | 84 | 3.6% |
| Arts & Humanities | 167 | 7.1% |
| Total | 2,344 | 100.0% |
Transportation & Commute in Bourbon County
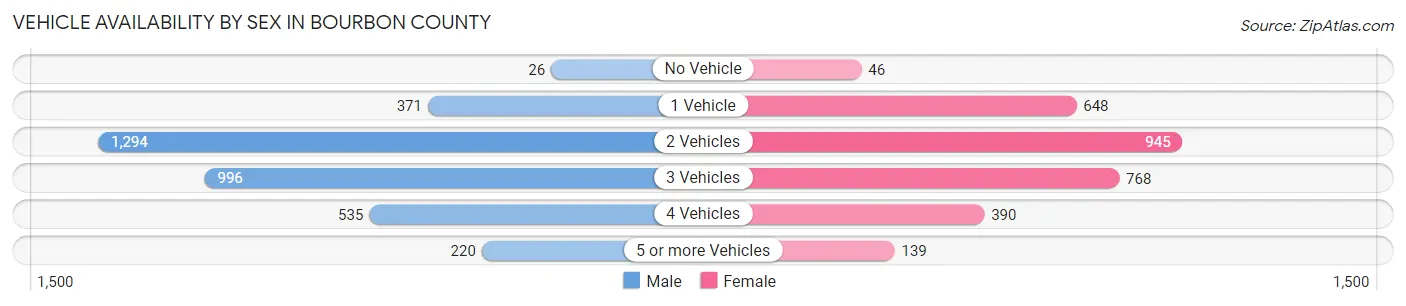
Vehicle Availability by Sex in Bourbon County
The most prevalent vehicle ownership categories in Bourbon County are males with 2 vehicles (1,294, accounting for 37.6%) and females with 2 vehicles (945, making up 44.1%).
| Vehicles Available | Male | Female |
| No Vehicle | 26 (0.8%) | 46 (1.6%) |
| 1 Vehicle | 371 (10.8%) | 648 (22.1%) |
| 2 Vehicles | 1,294 (37.6%) | 945 (32.2%) |
| 3 Vehicles | 996 (28.9%) | 768 (26.2%) |
| 4 Vehicles | 535 (15.5%) | 390 (13.3%) |
| 5 or more Vehicles | 220 (6.4%) | 139 (4.7%) |
| Total | 3,442 (100.0%) | 2,936 (100.0%) |
Commute Time in Bourbon County
The most frequently occuring commute durations in Bourbon County are 5 to 9 minutes (1,300 commuters, 22.5%), 10 to 14 minutes (1,107 commuters, 19.2%), and 15 to 19 minutes (706 commuters, 12.2%).
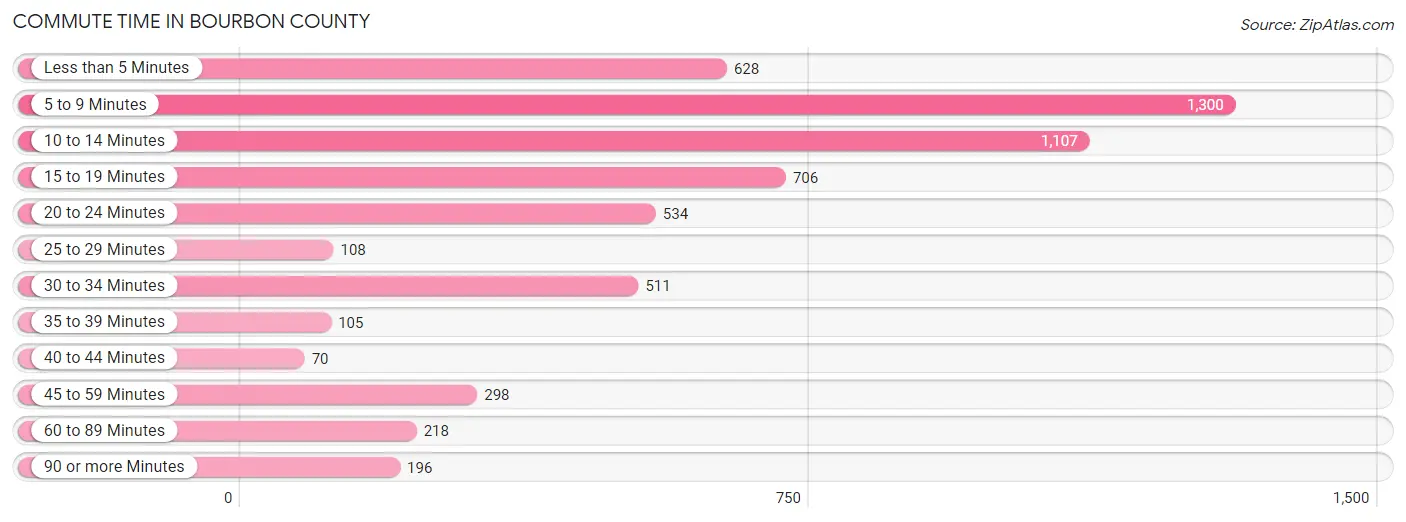
| Commute Time | # Commuters | % Commuters |
| Less than 5 Minutes | 628 | 10.9% |
| 5 to 9 Minutes | 1,300 | 22.5% |
| 10 to 14 Minutes | 1,107 | 19.2% |
| 15 to 19 Minutes | 706 | 12.2% |
| 20 to 24 Minutes | 534 | 9.2% |
| 25 to 29 Minutes | 108 | 1.9% |
| 30 to 34 Minutes | 511 | 8.8% |
| 35 to 39 Minutes | 105 | 1.8% |
| 40 to 44 Minutes | 70 | 1.2% |
| 45 to 59 Minutes | 298 | 5.1% |
| 60 to 89 Minutes | 218 | 3.8% |
| 90 or more Minutes | 196 | 3.4% |
Commute Time by Sex in Bourbon County
The most common commute times in Bourbon County are 5 to 9 minutes (736 commuters, 22.7%) for males and 10 to 14 minutes (577 commuters, 22.7%) for females.
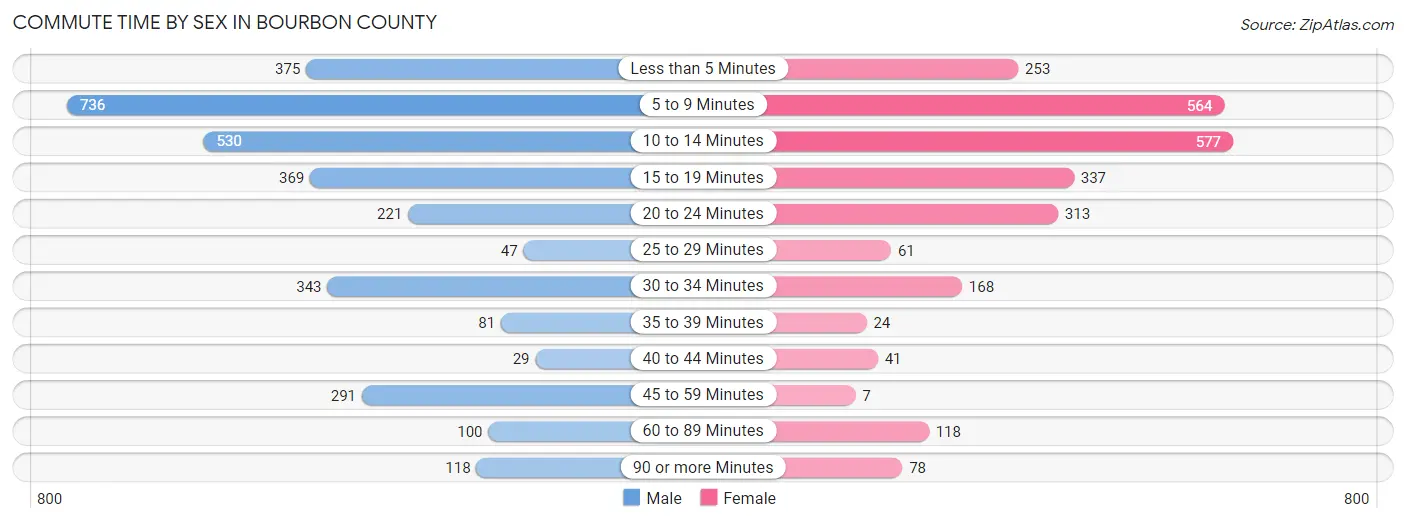
| Commute Time | Male | Female |
| Less than 5 Minutes | 375 (11.6%) | 253 (10.0%) |
| 5 to 9 Minutes | 736 (22.7%) | 564 (22.2%) |
| 10 to 14 Minutes | 530 (16.4%) | 577 (22.7%) |
| 15 to 19 Minutes | 369 (11.4%) | 337 (13.3%) |
| 20 to 24 Minutes | 221 (6.8%) | 313 (12.3%) |
| 25 to 29 Minutes | 47 (1.5%) | 61 (2.4%) |
| 30 to 34 Minutes | 343 (10.6%) | 168 (6.6%) |
| 35 to 39 Minutes | 81 (2.5%) | 24 (0.9%) |
| 40 to 44 Minutes | 29 (0.9%) | 41 (1.6%) |
| 45 to 59 Minutes | 291 (9.0%) | 7 (0.3%) |
| 60 to 89 Minutes | 100 (3.1%) | 118 (4.6%) |
| 90 or more Minutes | 118 (3.6%) | 78 (3.1%) |
Time of Departure to Work by Sex in Bourbon County
The most frequent times of departure to work in Bourbon County are 6:30 AM to 6:59 AM (543, 16.8%) for males and 7:00 AM to 7:29 AM (437, 17.2%) for females.
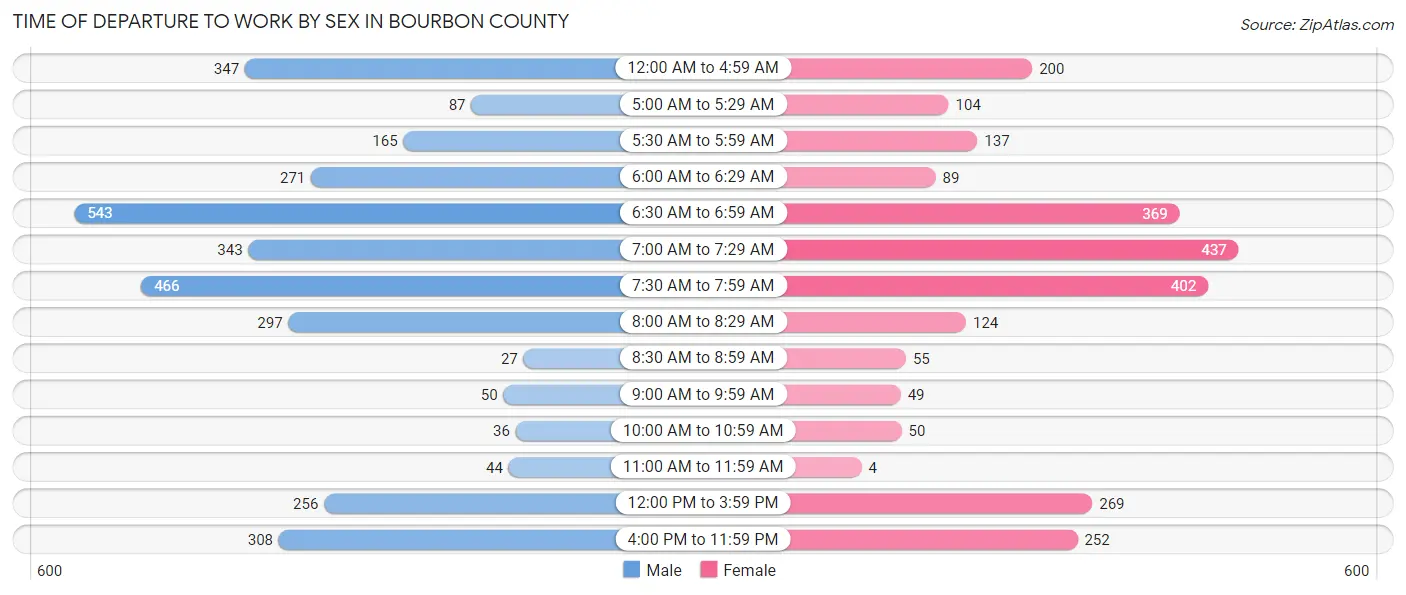
| Time of Departure | Male | Female |
| 12:00 AM to 4:59 AM | 347 (10.7%) | 200 (7.9%) |
| 5:00 AM to 5:29 AM | 87 (2.7%) | 104 (4.1%) |
| 5:30 AM to 5:59 AM | 165 (5.1%) | 137 (5.4%) |
| 6:00 AM to 6:29 AM | 271 (8.4%) | 89 (3.5%) |
| 6:30 AM to 6:59 AM | 543 (16.8%) | 369 (14.5%) |
| 7:00 AM to 7:29 AM | 343 (10.6%) | 437 (17.2%) |
| 7:30 AM to 7:59 AM | 466 (14.4%) | 402 (15.8%) |
| 8:00 AM to 8:29 AM | 297 (9.2%) | 124 (4.9%) |
| 8:30 AM to 8:59 AM | 27 (0.8%) | 55 (2.2%) |
| 9:00 AM to 9:59 AM | 50 (1.5%) | 49 (1.9%) |
| 10:00 AM to 10:59 AM | 36 (1.1%) | 50 (2.0%) |
| 11:00 AM to 11:59 AM | 44 (1.4%) | 4 (0.2%) |
| 12:00 PM to 3:59 PM | 256 (7.9%) | 269 (10.6%) |
| 4:00 PM to 11:59 PM | 308 (9.5%) | 252 (9.9%) |
| Total | 3,240 (100.0%) | 2,541 (100.0%) |
Housing Occupancy in Bourbon County
Occupancy by Ownership in Bourbon County
Of the total 5,875 dwellings in Bourbon County, owner-occupied units account for 4,174 (71.1%), while renter-occupied units make up 1,701 (28.9%).
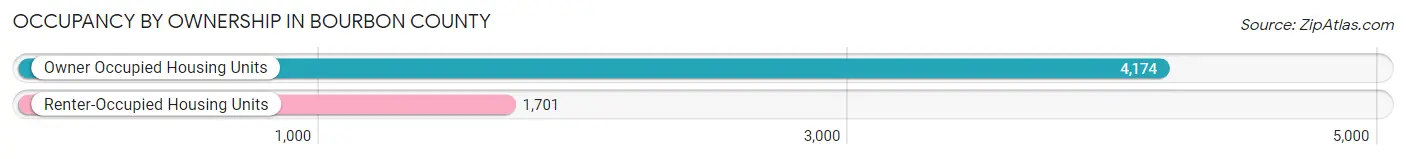
| Occupancy | # Housing Units | % Housing Units |
| Owner Occupied Housing Units | 4,174 | 71.1% |
| Renter-Occupied Housing Units | 1,701 | 28.9% |
| Total Occupied Housing Units | 5,875 | 100.0% |
Occupancy by Household Size in Bourbon County
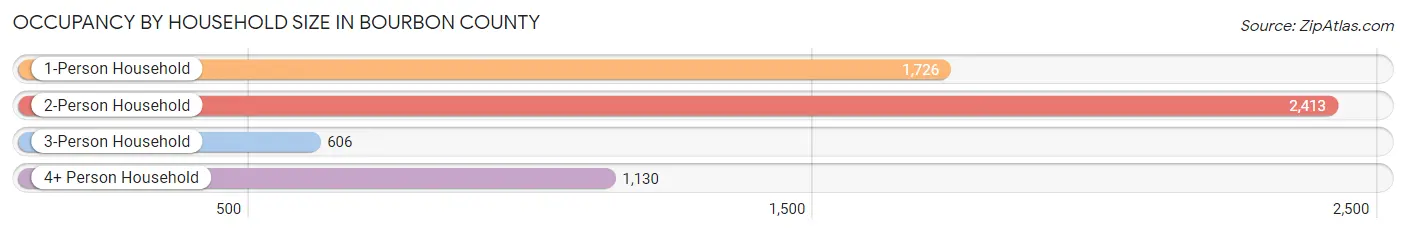
| Household Size | # Housing Units | % Housing Units |
| 1-Person Household | 1,726 | 29.4% |
| 2-Person Household | 2,413 | 41.1% |
| 3-Person Household | 606 | 10.3% |
| 4+ Person Household | 1,130 | 19.2% |
| Total Housing Units | 5,875 | 100.0% |
Occupancy by Ownership by Household Size in Bourbon County
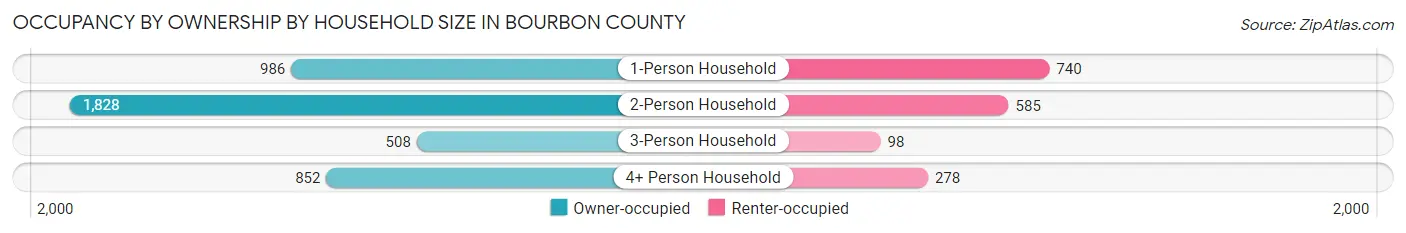
| Household Size | Owner-occupied | Renter-occupied |
| 1-Person Household | 986 (57.1%) | 740 (42.9%) |
| 2-Person Household | 1,828 (75.8%) | 585 (24.2%) |
| 3-Person Household | 508 (83.8%) | 98 (16.2%) |
| 4+ Person Household | 852 (75.4%) | 278 (24.6%) |
| Total Housing Units | 4,174 (71.1%) | 1,701 (28.9%) |
Occupancy by Educational Attainment in Bourbon County
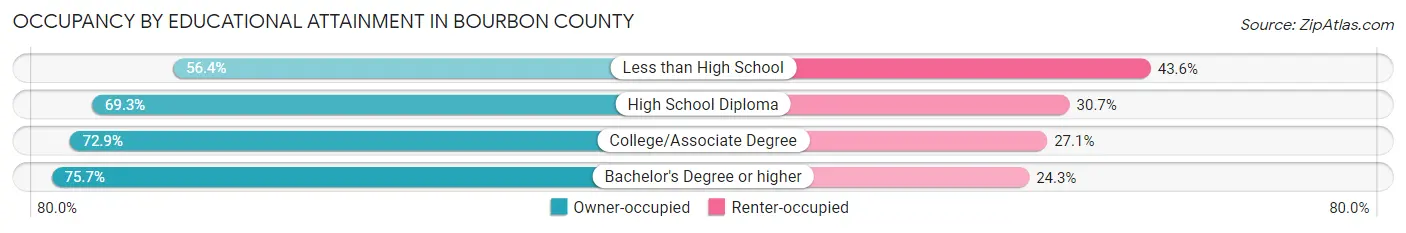
| Household Size | Owner-occupied | Renter-occupied |
| Less than High School | 333 (56.4%) | 257 (43.6%) |
| High School Diploma | 985 (69.3%) | 436 (30.7%) |
| College/Associate Degree | 1,789 (72.9%) | 666 (27.1%) |
| Bachelor's Degree or higher | 1,067 (75.7%) | 342 (24.3%) |
Occupancy by Age of Householder in Bourbon County
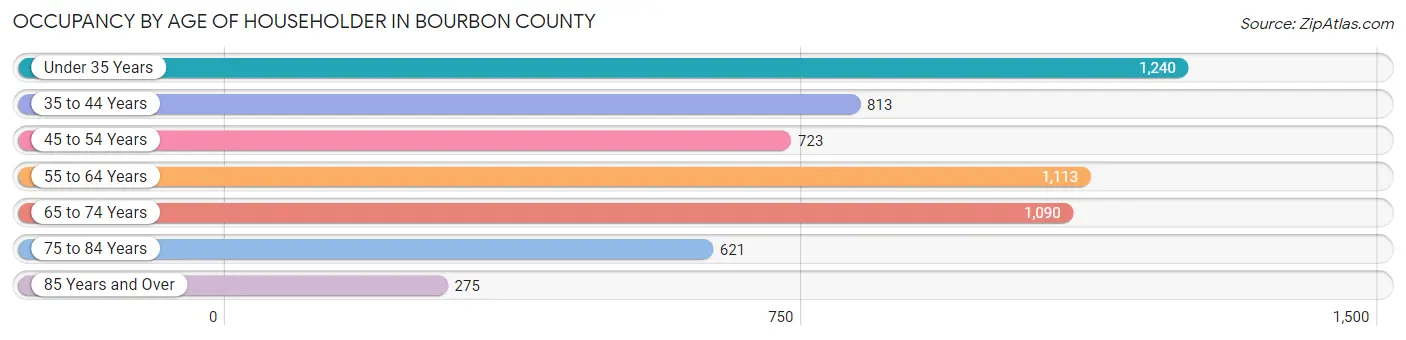
| Age Bracket | # Households | % Households |
| Under 35 Years | 1,240 | 21.1% |
| 35 to 44 Years | 813 | 13.8% |
| 45 to 54 Years | 723 | 12.3% |
| 55 to 64 Years | 1,113 | 18.9% |
| 65 to 74 Years | 1,090 | 18.5% |
| 75 to 84 Years | 621 | 10.6% |
| 85 Years and Over | 275 | 4.7% |
| Total | 5,875 | 100.0% |
Housing Finances in Bourbon County
Median Income by Occupancy in Bourbon County
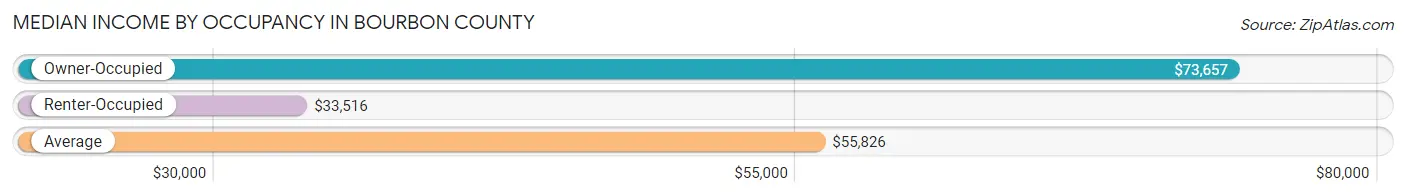
| Occupancy Type | # Households | Median Income |
| Owner-Occupied | 4,174 (71.1%) | $73,657 |
| Renter-Occupied | 1,701 (28.9%) | $33,516 |
| Average | 5,875 (100.0%) | $55,826 |
Occupancy by Householder Income Bracket in Bourbon County
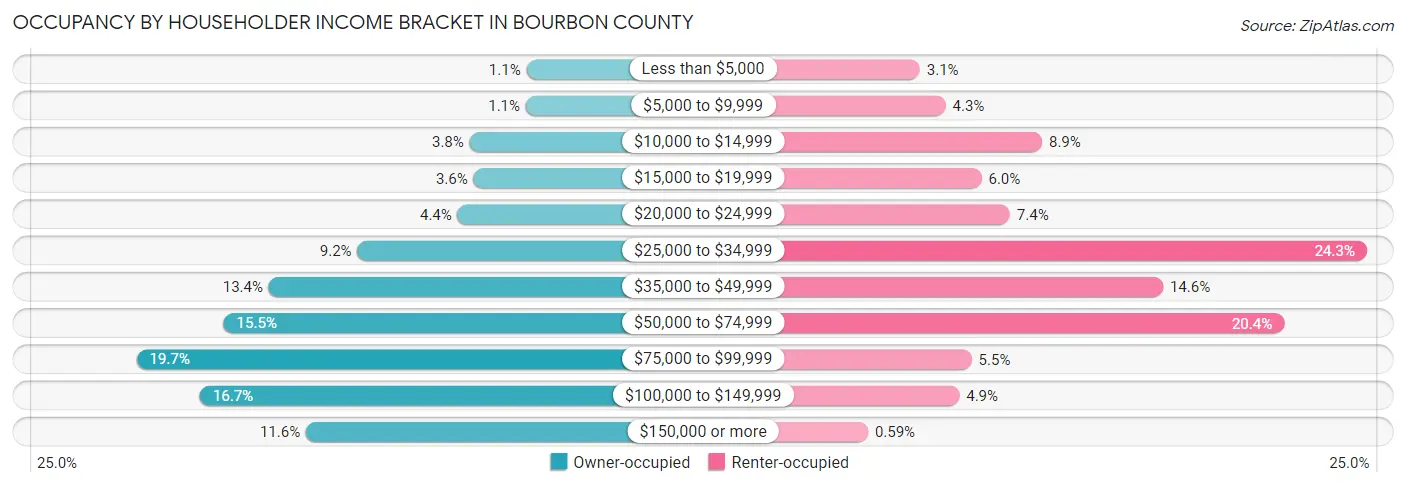
| Income Bracket | Owner-occupied | Renter-occupied |
| Less than $5,000 | 46 (1.1%) | 52 (3.1%) |
| $5,000 to $9,999 | 47 (1.1%) | 73 (4.3%) |
| $10,000 to $14,999 | 159 (3.8%) | 151 (8.9%) |
| $15,000 to $19,999 | 151 (3.6%) | 102 (6.0%) |
| $20,000 to $24,999 | 183 (4.4%) | 125 (7.3%) |
| $25,000 to $34,999 | 382 (9.1%) | 414 (24.3%) |
| $35,000 to $49,999 | 558 (13.4%) | 249 (14.6%) |
| $50,000 to $74,999 | 648 (15.5%) | 347 (20.4%) |
| $75,000 to $99,999 | 821 (19.7%) | 94 (5.5%) |
| $100,000 to $149,999 | 695 (16.7%) | 84 (4.9%) |
| $150,000 or more | 484 (11.6%) | 10 (0.6%) |
| Total | 4,174 (100.0%) | 1,701 (100.0%) |
Monthly Housing Cost Tiers in Bourbon County
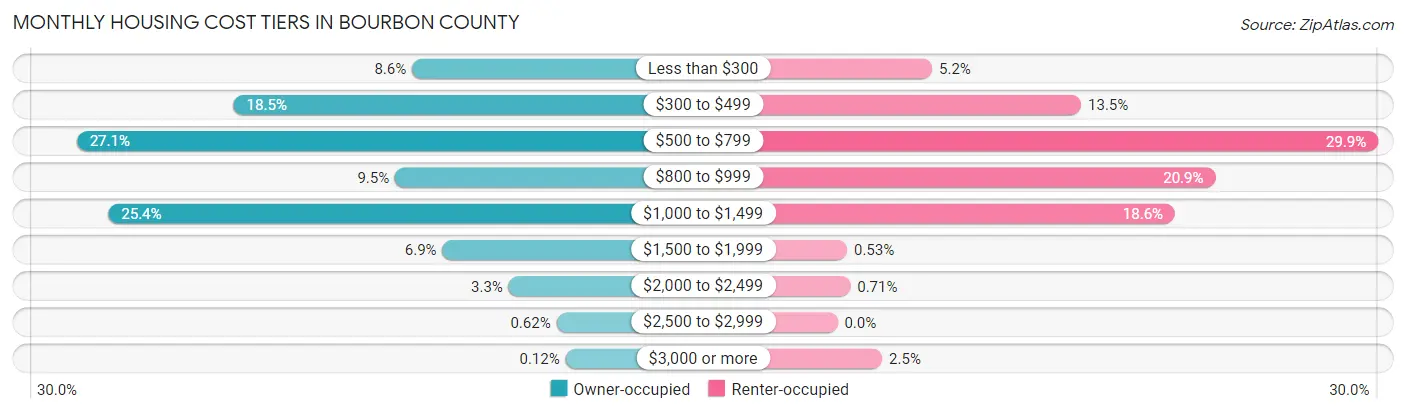
| Monthly Cost | Owner-occupied | Renter-occupied |
| Less than $300 | 359 (8.6%) | 89 (5.2%) |
| $300 to $499 | 770 (18.4%) | 229 (13.5%) |
| $500 to $799 | 1,132 (27.1%) | 508 (29.9%) |
| $800 to $999 | 398 (9.5%) | 355 (20.9%) |
| $1,000 to $1,499 | 1,059 (25.4%) | 317 (18.6%) |
| $1,500 to $1,999 | 289 (6.9%) | 9 (0.5%) |
| $2,000 to $2,499 | 136 (3.3%) | 12 (0.7%) |
| $2,500 to $2,999 | 26 (0.6%) | 0 (0.0%) |
| $3,000 or more | 5 (0.1%) | 42 (2.5%) |
| Total | 4,174 (100.0%) | 1,701 (100.0%) |
Physical Housing Characteristics in Bourbon County
Housing Structures in Bourbon County

| Structure Type | # Housing Units | % Housing Units |
| Single Unit, Detached | 4,741 | 80.7% |
| Single Unit, Attached | 1 | 0.0% |
| 2 Unit Apartments | 118 | 2.0% |
| 3 or 4 Unit Apartments | 149 | 2.5% |
| 5 to 9 Unit Apartments | 97 | 1.7% |
| 10 or more Apartments | 254 | 4.3% |
| Mobile Home / Other | 515 | 8.8% |
| Total | 5,875 | 100.0% |
Housing Structures by Occupancy in Bourbon County
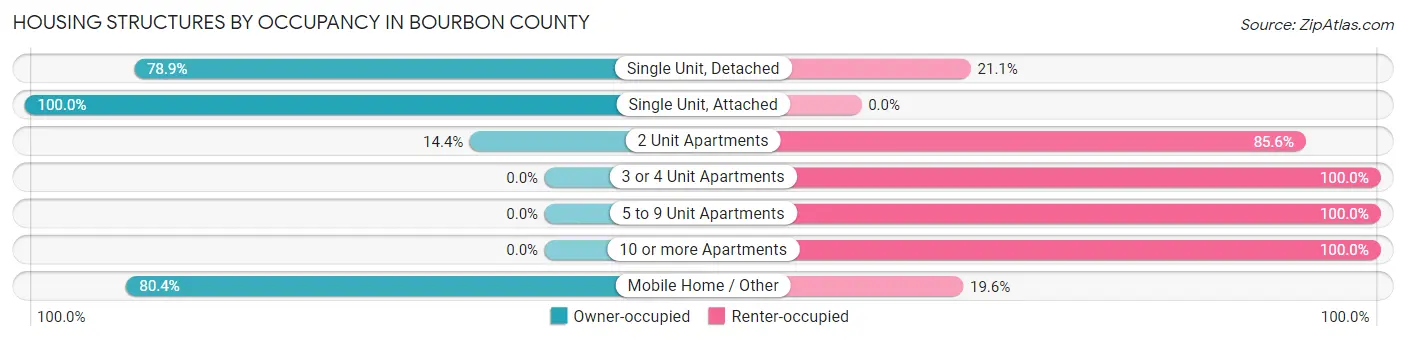
| Structure Type | Owner-occupied | Renter-occupied |
| Single Unit, Detached | 3,742 (78.9%) | 999 (21.1%) |
| Single Unit, Attached | 1 (100.0%) | 0 (0.0%) |
| 2 Unit Apartments | 17 (14.4%) | 101 (85.6%) |
| 3 or 4 Unit Apartments | 0 (0.0%) | 149 (100.0%) |
| 5 to 9 Unit Apartments | 0 (0.0%) | 97 (100.0%) |
| 10 or more Apartments | 0 (0.0%) | 254 (100.0%) |
| Mobile Home / Other | 414 (80.4%) | 101 (19.6%) |
| Total | 4,174 (71.1%) | 1,701 (28.9%) |
Housing Structures by Number of Rooms in Bourbon County
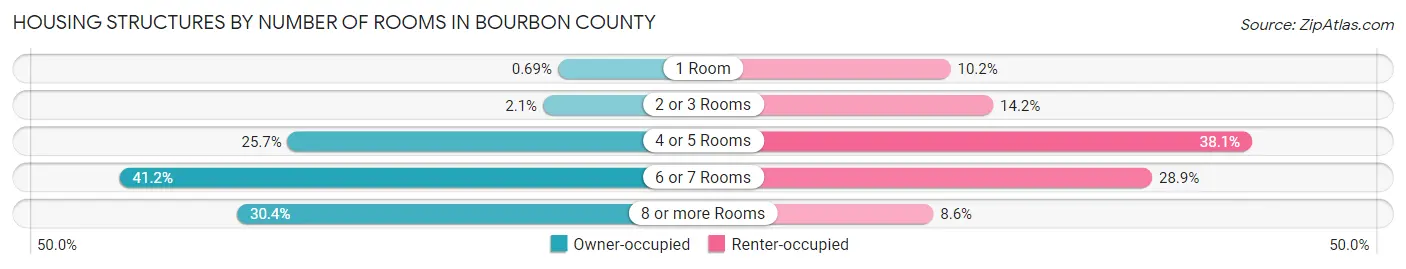
| Number of Rooms | Owner-occupied | Renter-occupied |
| 1 Room | 29 (0.7%) | 174 (10.2%) |
| 2 or 3 Rooms | 86 (2.1%) | 241 (14.2%) |
| 4 or 5 Rooms | 1,072 (25.7%) | 648 (38.1%) |
| 6 or 7 Rooms | 1,720 (41.2%) | 491 (28.9%) |
| 8 or more Rooms | 1,267 (30.3%) | 147 (8.6%) |
| Total | 4,174 (100.0%) | 1,701 (100.0%) |
Housing Structure by Heating Type in Bourbon County
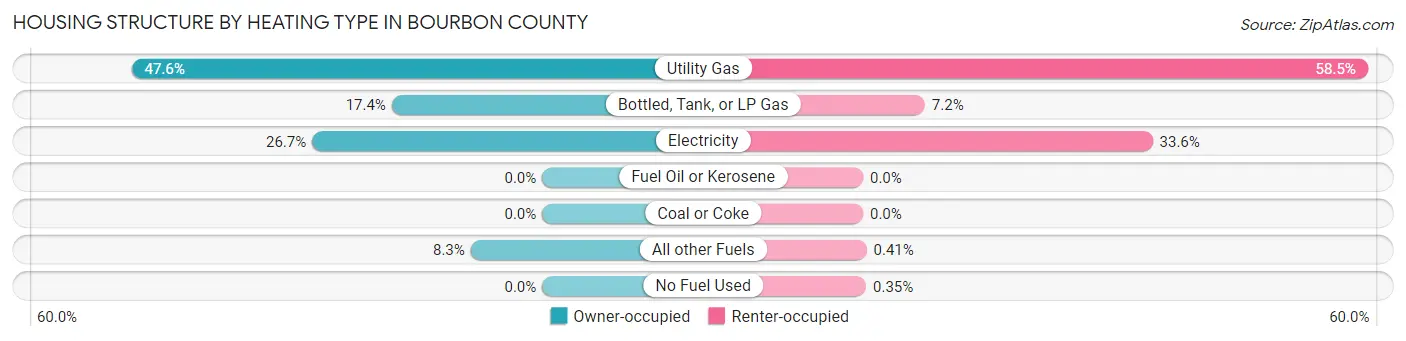
| Heating Type | Owner-occupied | Renter-occupied |
| Utility Gas | 1,987 (47.6%) | 995 (58.5%) |
| Bottled, Tank, or LP Gas | 728 (17.4%) | 122 (7.2%) |
| Electricity | 1,113 (26.7%) | 571 (33.6%) |
| Fuel Oil or Kerosene | 0 (0.0%) | 0 (0.0%) |
| Coal or Coke | 0 (0.0%) | 0 (0.0%) |
| All other Fuels | 346 (8.3%) | 7 (0.4%) |
| No Fuel Used | 0 (0.0%) | 6 (0.4%) |
| Total | 4,174 (100.0%) | 1,701 (100.0%) |
Household Vehicle Usage in Bourbon County
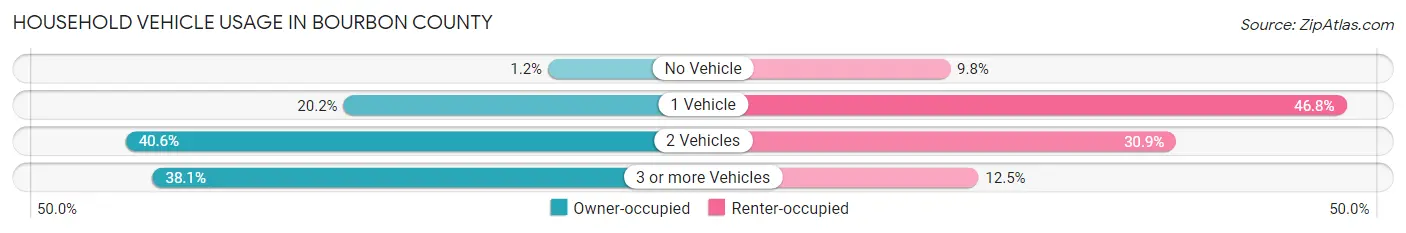
| Vehicles per Household | Owner-occupied | Renter-occupied |
| No Vehicle | 48 (1.1%) | 167 (9.8%) |
| 1 Vehicle | 845 (20.2%) | 796 (46.8%) |
| 2 Vehicles | 1,693 (40.6%) | 526 (30.9%) |
| 3 or more Vehicles | 1,588 (38.1%) | 212 (12.5%) |
| Total | 4,174 (100.0%) | 1,701 (100.0%) |
Real Estate & Mortgages in Bourbon County
Real Estate and Mortgage Overview in Bourbon County
| Characteristic | Without Mortgage | With Mortgage |
| Housing Units | 2,345 | 1,829 |
| Median Property Value | $90,900 | $107,500 |
| Median Household Income | $65,365 | $190 |
| Monthly Housing Costs | $519 | $5 |
| Real Estate Taxes | $1,592 | $115 |
Property Value by Mortgage Status in Bourbon County
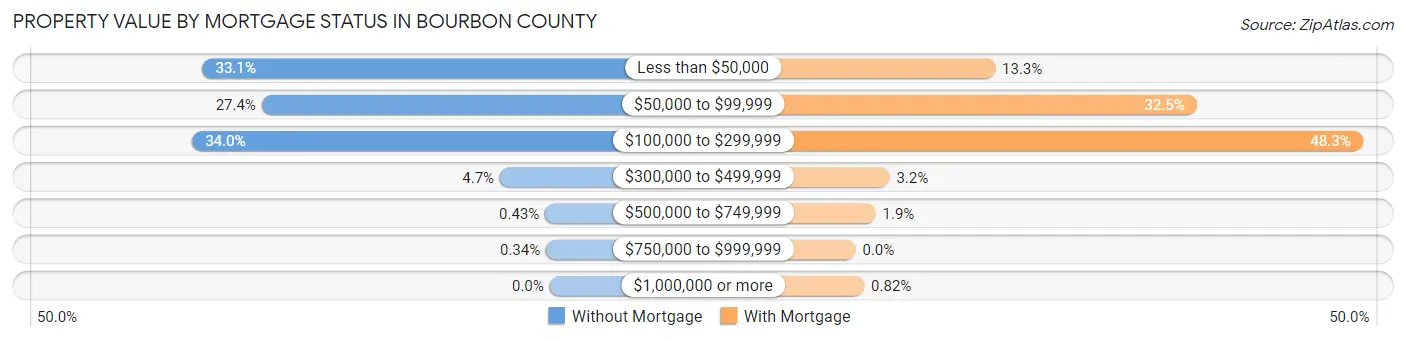
| Property Value | Without Mortgage | With Mortgage |
| Less than $50,000 | 775 (33.1%) | 243 (13.3%) |
| $50,000 to $99,999 | 643 (27.4%) | 594 (32.5%) |
| $100,000 to $299,999 | 798 (34.0%) | 883 (48.3%) |
| $300,000 to $499,999 | 111 (4.7%) | 59 (3.2%) |
| $500,000 to $749,999 | 10 (0.4%) | 35 (1.9%) |
| $750,000 to $999,999 | 8 (0.3%) | 0 (0.0%) |
| $1,000,000 or more | 0 (0.0%) | 15 (0.8%) |
| Total | 2,345 (100.0%) | 1,829 (100.0%) |
Household Income by Mortgage Status in Bourbon County
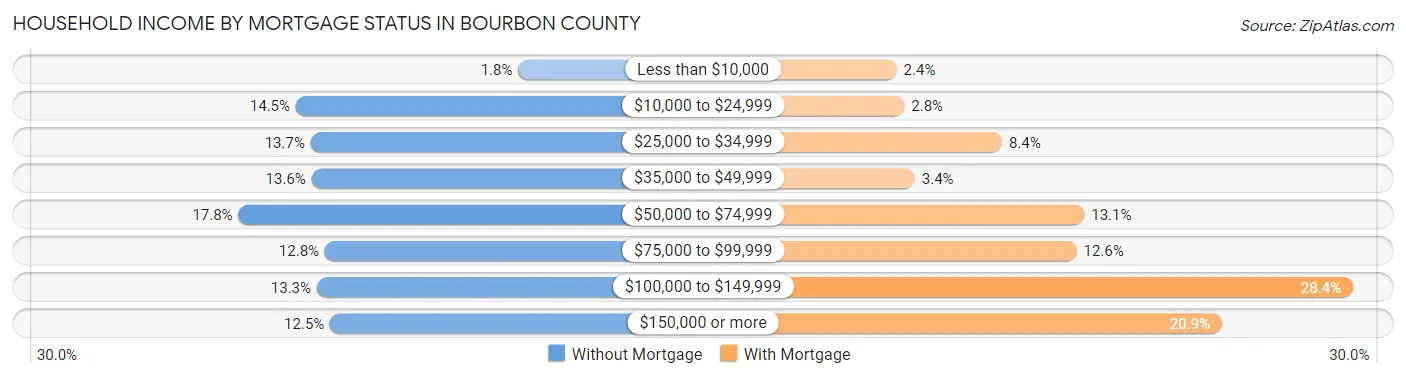
| Household Income | Without Mortgage | With Mortgage |
| Less than $10,000 | 42 (1.8%) | 43 (2.4%) |
| $10,000 to $24,999 | 340 (14.5%) | 51 (2.8%) |
| $25,000 to $34,999 | 320 (13.7%) | 153 (8.4%) |
| $35,000 to $49,999 | 319 (13.6%) | 62 (3.4%) |
| $50,000 to $74,999 | 417 (17.8%) | 239 (13.1%) |
| $75,000 to $99,999 | 301 (12.8%) | 231 (12.6%) |
| $100,000 to $149,999 | 312 (13.3%) | 520 (28.4%) |
| $150,000 or more | 294 (12.5%) | 383 (20.9%) |
| Total | 2,345 (100.0%) | 1,829 (100.0%) |
Property Value to Household Income Ratio in Bourbon County
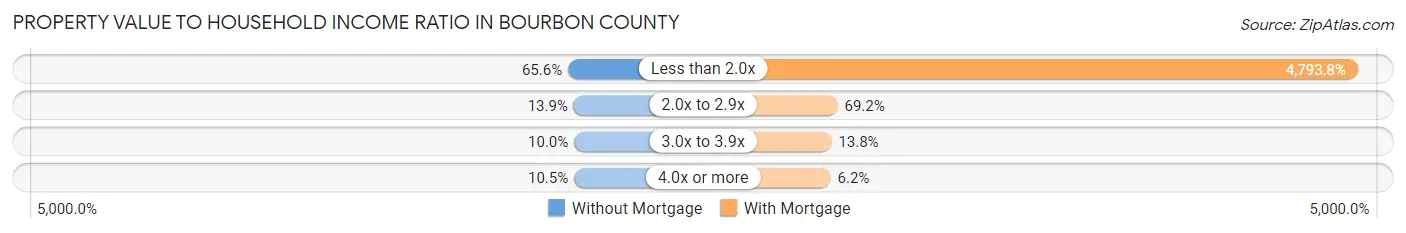
| Value-to-Income Ratio | Without Mortgage | With Mortgage |
| Less than 2.0x | 1,539 (65.6%) | 87,679 (4,793.8%) |
| 2.0x to 2.9x | 326 (13.9%) | 1,266 (69.2%) |
| 3.0x to 3.9x | 235 (10.0%) | 252 (13.8%) |
| 4.0x or more | 245 (10.4%) | 113 (6.2%) |
| Total | 2,345 (100.0%) | 1,829 (100.0%) |
Real Estate Taxes by Mortgage Status in Bourbon County
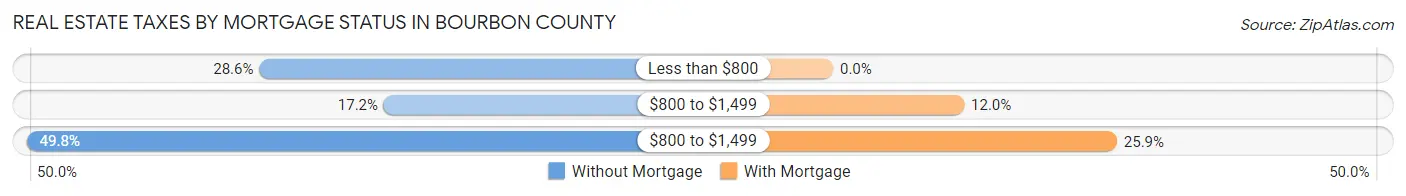
| Property Taxes | Without Mortgage | With Mortgage |
| Less than $800 | 670 (28.6%) | 0 (0.0%) |
| $800 to $1,499 | 403 (17.2%) | 219 (12.0%) |
| $800 to $1,499 | 1,168 (49.8%) | 474 (25.9%) |
| Total | 2,345 (100.0%) | 1,829 (100.0%) |
Health & Disability in Bourbon County
Health Insurance Coverage by Age in Bourbon County
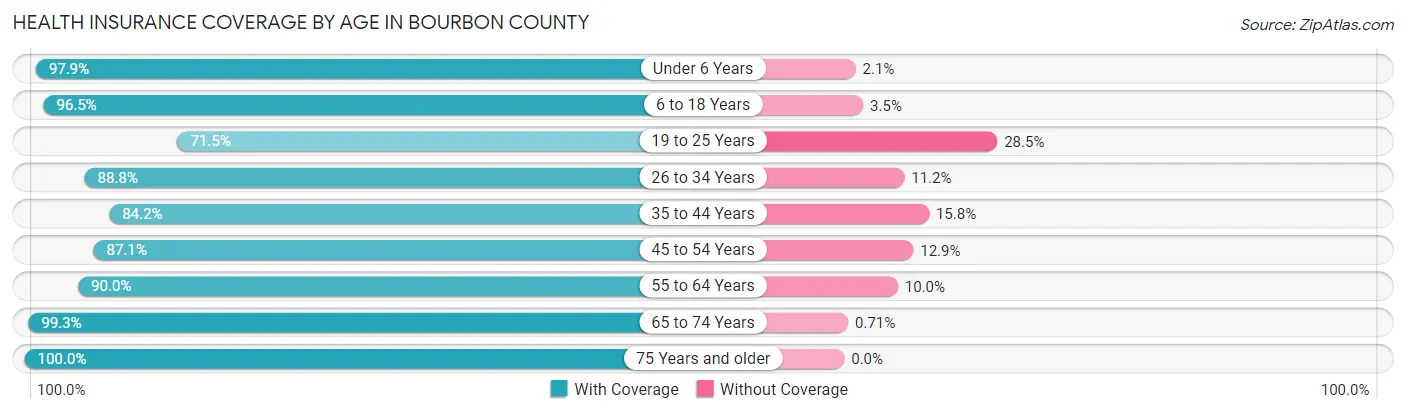
| Age Bracket | With Coverage | Without Coverage |
| Under 6 Years | 1,161 (97.9%) | 25 (2.1%) |
| 6 to 18 Years | 2,660 (96.5%) | 97 (3.5%) |
| 19 to 25 Years | 837 (71.5%) | 334 (28.5%) |
| 26 to 34 Years | 1,302 (88.8%) | 164 (11.2%) |
| 35 to 44 Years | 1,397 (84.2%) | 262 (15.8%) |
| 45 to 54 Years | 1,219 (87.1%) | 180 (12.9%) |
| 55 to 64 Years | 1,730 (90.0%) | 192 (10.0%) |
| 65 to 74 Years | 1,538 (99.3%) | 11 (0.7%) |
| 75 Years and older | 1,101 (100.0%) | 0 (0.0%) |
| Total | 12,945 (91.1%) | 1,265 (8.9%) |
Health Insurance Coverage by Citizenship Status in Bourbon County
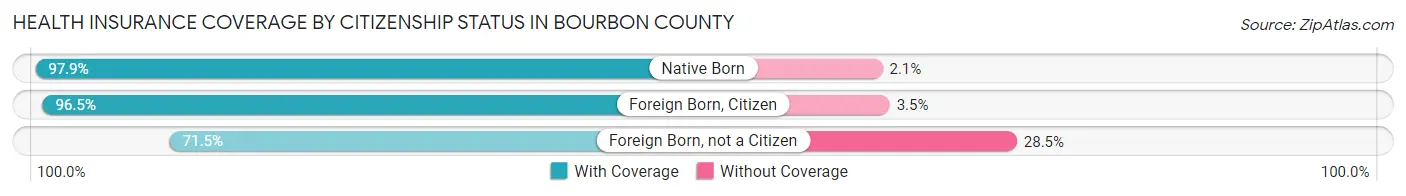
| Citizenship Status | With Coverage | Without Coverage |
| Native Born | 1,161 (97.9%) | 25 (2.1%) |
| Foreign Born, Citizen | 2,660 (96.5%) | 97 (3.5%) |
| Foreign Born, not a Citizen | 837 (71.5%) | 334 (28.5%) |
Health Insurance Coverage by Household Income in Bourbon County
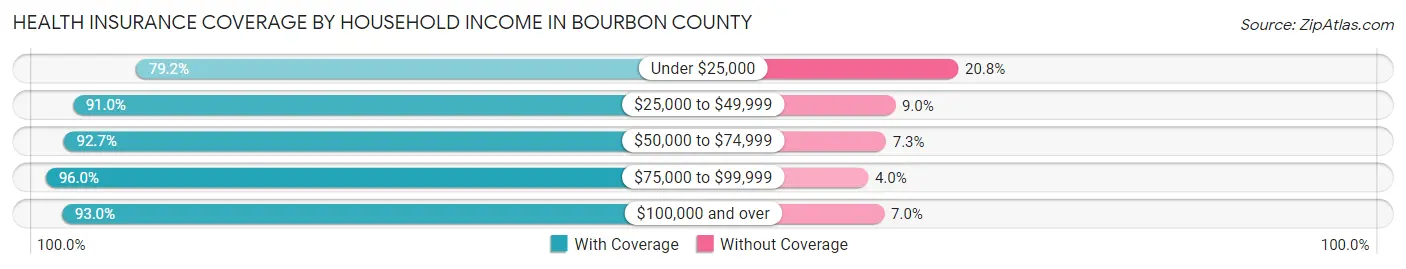
| Household Income | With Coverage | Without Coverage |
| Under $25,000 | 1,345 (79.2%) | 354 (20.8%) |
| $25,000 to $49,999 | 3,097 (91.0%) | 307 (9.0%) |
| $50,000 to $74,999 | 2,485 (92.7%) | 196 (7.3%) |
| $75,000 to $99,999 | 2,616 (96.0%) | 108 (4.0%) |
| $100,000 and over | 3,231 (93.0%) | 243 (7.0%) |
Public vs Private Health Insurance Coverage by Age in Bourbon County
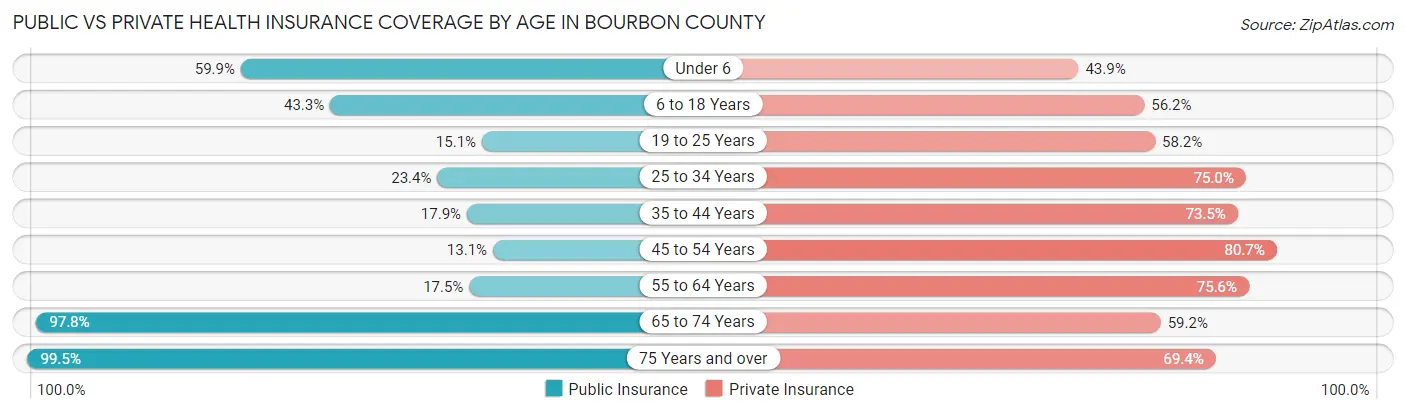
| Age Bracket | Public Insurance | Private Insurance |
| Under 6 | 710 (59.9%) | 521 (43.9%) |
| 6 to 18 Years | 1,194 (43.3%) | 1,548 (56.1%) |
| 19 to 25 Years | 177 (15.1%) | 681 (58.2%) |
| 25 to 34 Years | 343 (23.4%) | 1,099 (75.0%) |
| 35 to 44 Years | 297 (17.9%) | 1,219 (73.5%) |
| 45 to 54 Years | 183 (13.1%) | 1,129 (80.7%) |
| 55 to 64 Years | 336 (17.5%) | 1,452 (75.5%) |
| 65 to 74 Years | 1,515 (97.8%) | 917 (59.2%) |
| 75 Years and over | 1,095 (99.5%) | 764 (69.4%) |
| Total | 5,850 (41.2%) | 9,330 (65.7%) |
Disability Status by Sex by Age in Bourbon County
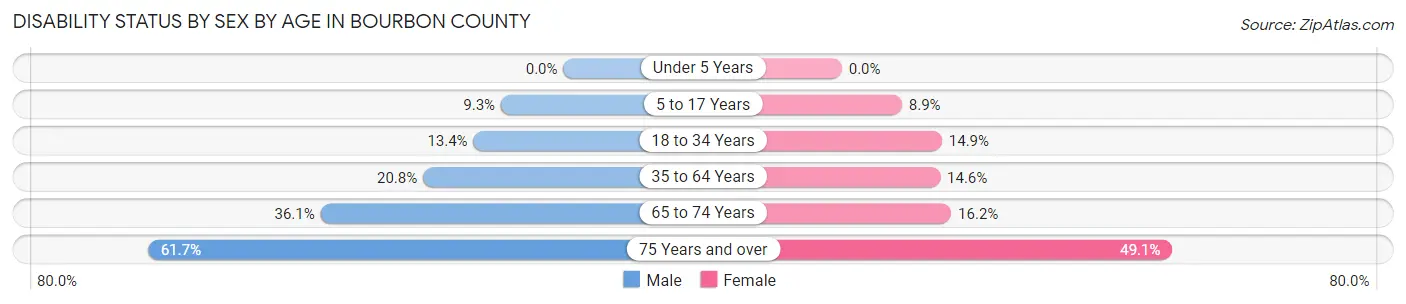
| Age Bracket | Male | Female |
| Under 5 Years | 0 (0.0%) | 0 (0.0%) |
| 5 to 17 Years | 124 (9.3%) | 132 (8.9%) |
| 18 to 34 Years | 196 (13.4%) | 206 (14.9%) |
| 35 to 64 Years | 514 (20.8%) | 367 (14.6%) |
| 65 to 74 Years | 261 (36.0%) | 134 (16.2%) |
| 75 Years and over | 282 (61.7%) | 316 (49.1%) |
Disability Class by Sex by Age in Bourbon County
Disability Class: Hearing Difficulty
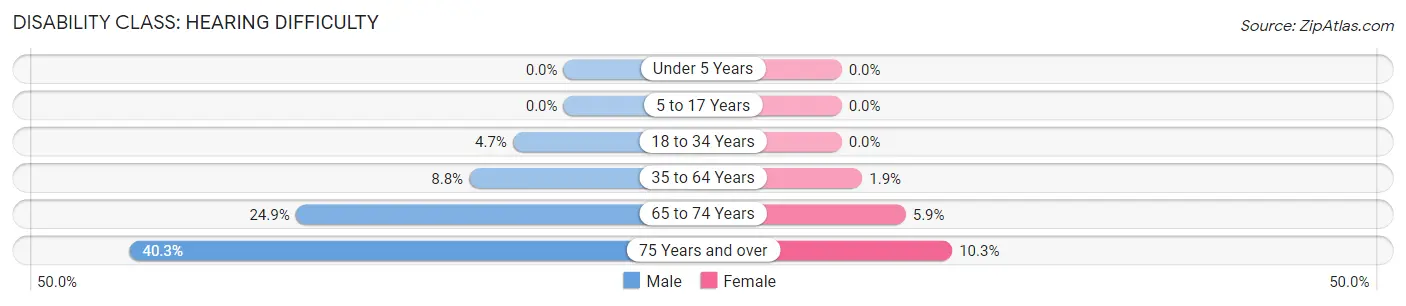
| Age Bracket | Male | Female |
| Under 5 Years | 0 (0.0%) | 0 (0.0%) |
| 5 to 17 Years | 0 (0.0%) | 0 (0.0%) |
| 18 to 34 Years | 69 (4.7%) | 0 (0.0%) |
| 35 to 64 Years | 216 (8.8%) | 48 (1.9%) |
| 65 to 74 Years | 180 (24.9%) | 49 (5.9%) |
| 75 Years and over | 184 (40.3%) | 66 (10.2%) |
Disability Class: Vision Difficulty
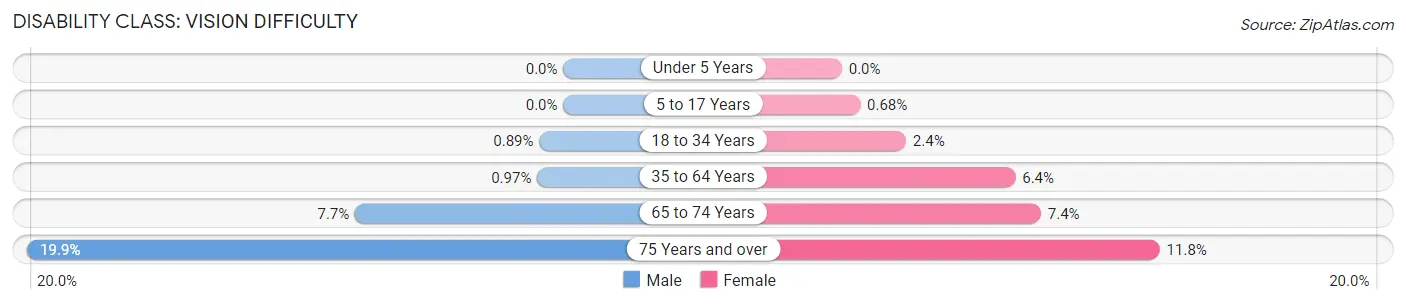
| Age Bracket | Male | Female |
| Under 5 Years | 0 (0.0%) | 0 (0.0%) |
| 5 to 17 Years | 0 (0.0%) | 10 (0.7%) |
| 18 to 34 Years | 13 (0.9%) | 33 (2.4%) |
| 35 to 64 Years | 24 (1.0%) | 162 (6.4%) |
| 65 to 74 Years | 56 (7.7%) | 61 (7.4%) |
| 75 Years and over | 91 (19.9%) | 76 (11.8%) |
Disability Class: Cognitive Difficulty
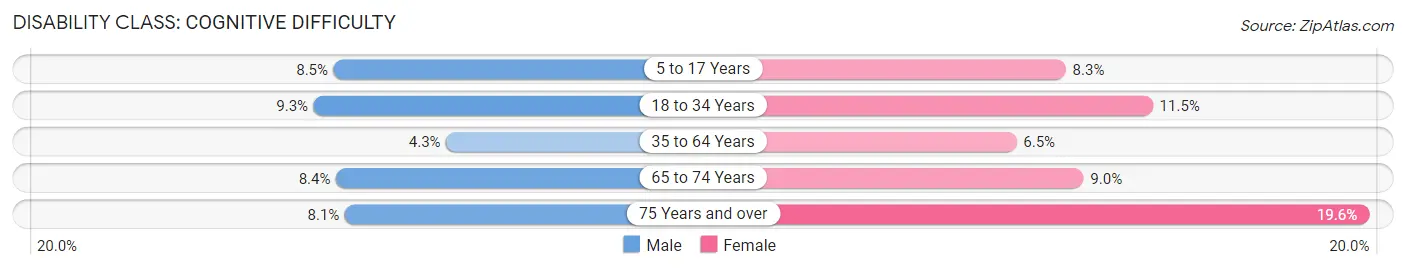
| Age Bracket | Male | Female |
| 5 to 17 Years | 114 (8.5%) | 123 (8.3%) |
| 18 to 34 Years | 136 (9.3%) | 160 (11.5%) |
| 35 to 64 Years | 107 (4.3%) | 163 (6.5%) |
| 65 to 74 Years | 61 (8.4%) | 74 (9.0%) |
| 75 Years and over | 37 (8.1%) | 126 (19.6%) |
Disability Class: Ambulatory Difficulty
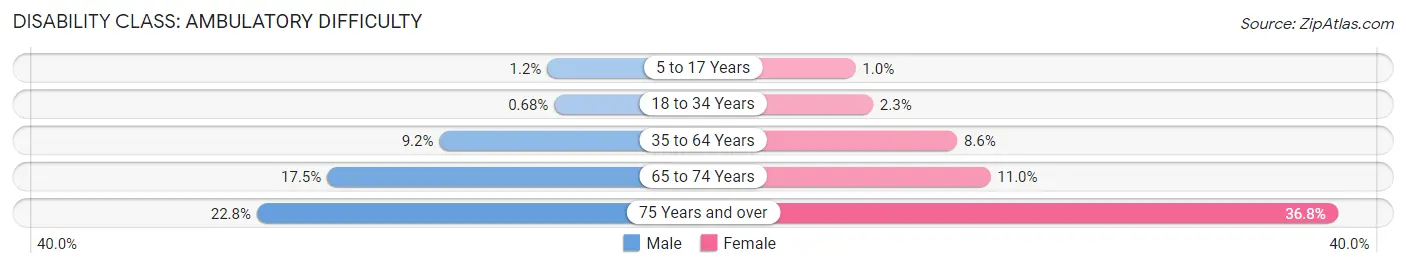
| Age Bracket | Male | Female |
| 5 to 17 Years | 16 (1.2%) | 15 (1.0%) |
| 18 to 34 Years | 10 (0.7%) | 32 (2.3%) |
| 35 to 64 Years | 227 (9.2%) | 215 (8.6%) |
| 65 to 74 Years | 127 (17.5%) | 91 (11.0%) |
| 75 Years and over | 104 (22.8%) | 237 (36.8%) |
Disability Class: Self-Care Difficulty
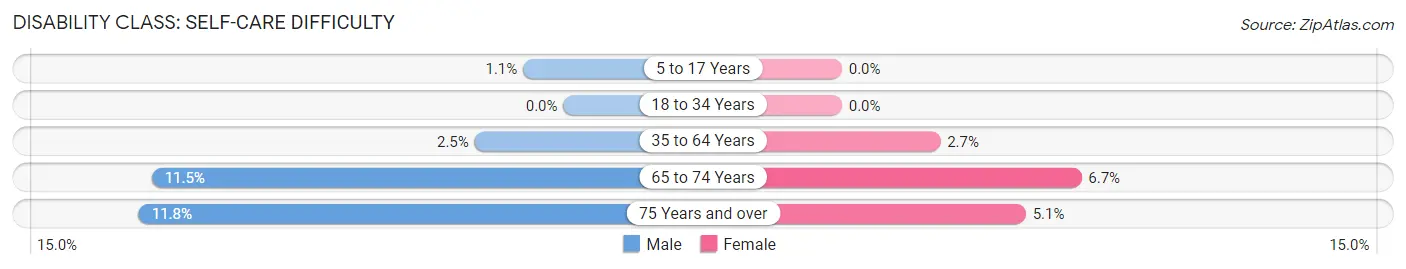
| Age Bracket | Male | Female |
| 5 to 17 Years | 15 (1.1%) | 0 (0.0%) |
| 18 to 34 Years | 0 (0.0%) | 0 (0.0%) |
| 35 to 64 Years | 61 (2.5%) | 69 (2.7%) |
| 65 to 74 Years | 83 (11.5%) | 55 (6.7%) |
| 75 Years and over | 54 (11.8%) | 33 (5.1%) |
Technology Access in Bourbon County
Computing Device Access in Bourbon County
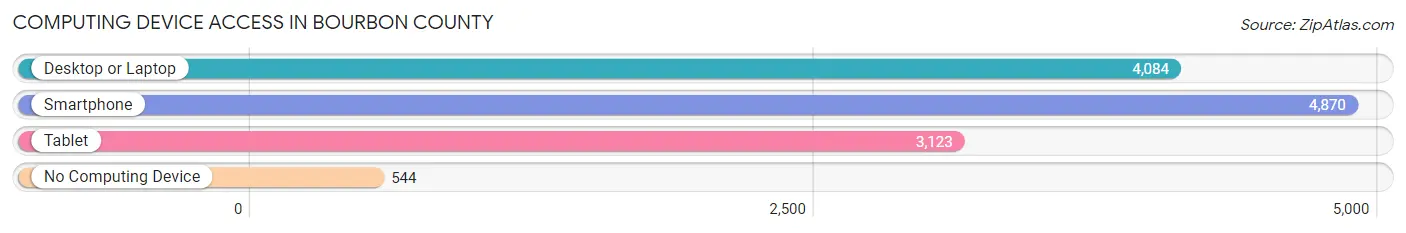
| Device Type | # Households | % Households |
| Desktop or Laptop | 4,084 | 69.5% |
| Smartphone | 4,870 | 82.9% |
| Tablet | 3,123 | 53.2% |
| No Computing Device | 544 | 9.3% |
| Total | 5,875 | 100.0% |
Internet Access in Bourbon County
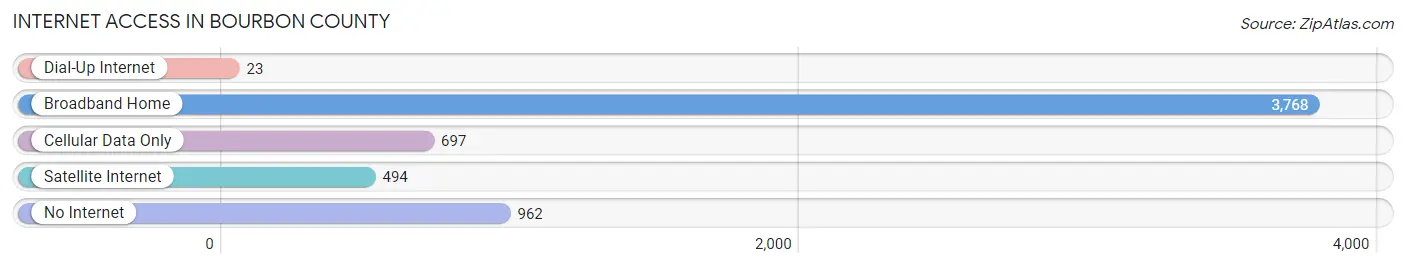
| Internet Type | # Households | % Households |
| Dial-Up Internet | 23 | 0.4% |
| Broadband Home | 3,768 | 64.1% |
| Cellular Data Only | 697 | 11.9% |
| Satellite Internet | 494 | 8.4% |
| No Internet | 962 | 16.4% |
| Total | 5,875 | 100.0% |
Bourbon County Summary
Bourbon County, Kansas is located in the southeastern corner of the state and is part of the Fort Scott Micropolitan Statistical Area. The county was named after Bourbon County, Kentucky, and was established in 1855. As of the 2010 census, the population was 15,173.
Geography
Bourbon County is located in the southeastern corner of Kansas, bordered by Missouri to the east and Oklahoma to the south. The county has a total area of 576 square miles, of which 575 square miles is land and 1.2 square miles (0.2%) is water. The county is drained by the Marmaton River, which flows through the county from north to south. The county is mostly flat, with some rolling hills in the northern part. The highest point in the county is located in the northwest corner, at an elevation of 1,068 feet.
The county is home to several state parks, including Fort Scott National Historic Site, which preserves the site of a former U.S. Army post. Other parks in the county include the Marmaton River State Park, which offers camping, fishing, and hiking, and the Bourbon County State Fishing Lake, which offers fishing and boating.
Economy
Bourbon County's economy is largely based on agriculture. The county is home to several large farms, including the largest cattle ranch in the state. The county is also home to several manufacturing companies, including a large paper mill and a large food processing plant.
The county is also home to several small businesses, including restaurants, retail stores, and service providers. The county is also home to several wineries, which produce a variety of wines.
Demographics
As of the 2010 census, there were 15,173 people, 5,945 households, and 4,093 families living in the county. The population density was 26.3 people per square mile. The racial makeup of the county was 94.3% White, 1.3% African American, 0.7% Native American, 0.3% Asian, 0.1% Pacific Islander, 1.3% from other races, and 2.2% from two or more races. Hispanic or Latino of any race were 3.3% of the population.
The median income for a household in the county was $41,945, and the median income for a family was $50,945. The per capita income for the county was $20,945. About 11.3% of families and 14.2% of the population were below the poverty line, including 19.2% of those under age 18 and 8.2% of those age 65 or over.
Conclusion
Bourbon County, Kansas is a rural county located in the southeastern corner of the state. The county is home to several state parks, and its economy is largely based on agriculture. The county has a population of 15,173, with a median household income of $41,945. The county is home to several small businesses, wineries, and manufacturing companies.
Common Questions
What is Per Capita Income in Bourbon County?
Per Capita income in Bourbon County is $29,328.
What is the Median Family Income in Bourbon County?
Median Family Income in Bourbon County is $73,896.
What is the Median Household income in Bourbon County?
Median Household Income in Bourbon County is $55,826.
What is Income or Wage Gap in Bourbon County?
Income or Wage Gap in Bourbon County is 36.8%.
Women in Bourbon County earn 63.2 cents for every dollar earned by a man.
What is Family Income Deficit in Bourbon County?
Family Income Deficit in Bourbon County is $11,635.
Families that are below poverty line in Bourbon County earn $11,635 less on average than the poverty threshold level.
What is Inequality or Gini Index in Bourbon County?
Inequality or Gini Index in Bourbon County is 0.42.
What is the Total Population of Bourbon County?
Total Population of Bourbon County is 14,405.
What is the Total Male Population of Bourbon County?
Total Male Population of Bourbon County is 7,015.
What is the Total Female Population of Bourbon County?
Total Female Population of Bourbon County is 7,390.
What is the Ratio of Males per 100 Females in Bourbon County?
There are 94.93 Males per 100 Females in Bourbon County.
What is the Ratio of Females per 100 Males in Bourbon County?
There are 105.35 Females per 100 Males in Bourbon County.
What is the Median Population Age in Bourbon County?
Median Population Age in Bourbon County is 38.1 Years.
What is the Average Family Size in Bourbon County
Average Family Size in Bourbon County is 3.0 People.
What is the Average Household Size in Bourbon County
Average Household Size in Bourbon County is 2.4 People.
How Large is the Labor Force in Bourbon County?
There are 6,766 People in the Labor Forcein in Bourbon County.
What is the Percentage of People in the Labor Force in Bourbon County?
61.0% of People are in the Labor Force in Bourbon County.
What is the Unemployment Rate in Bourbon County?
Unemployment Rate in Bourbon County is 3.8%.