Zip Codes with the Highest Percentage of Families with Income Below $10,000 in Greenwood, IN
RELATED REPORTS & OPTIONS
Family Income | $0-10k
Greenwood
Compare Zip Codes
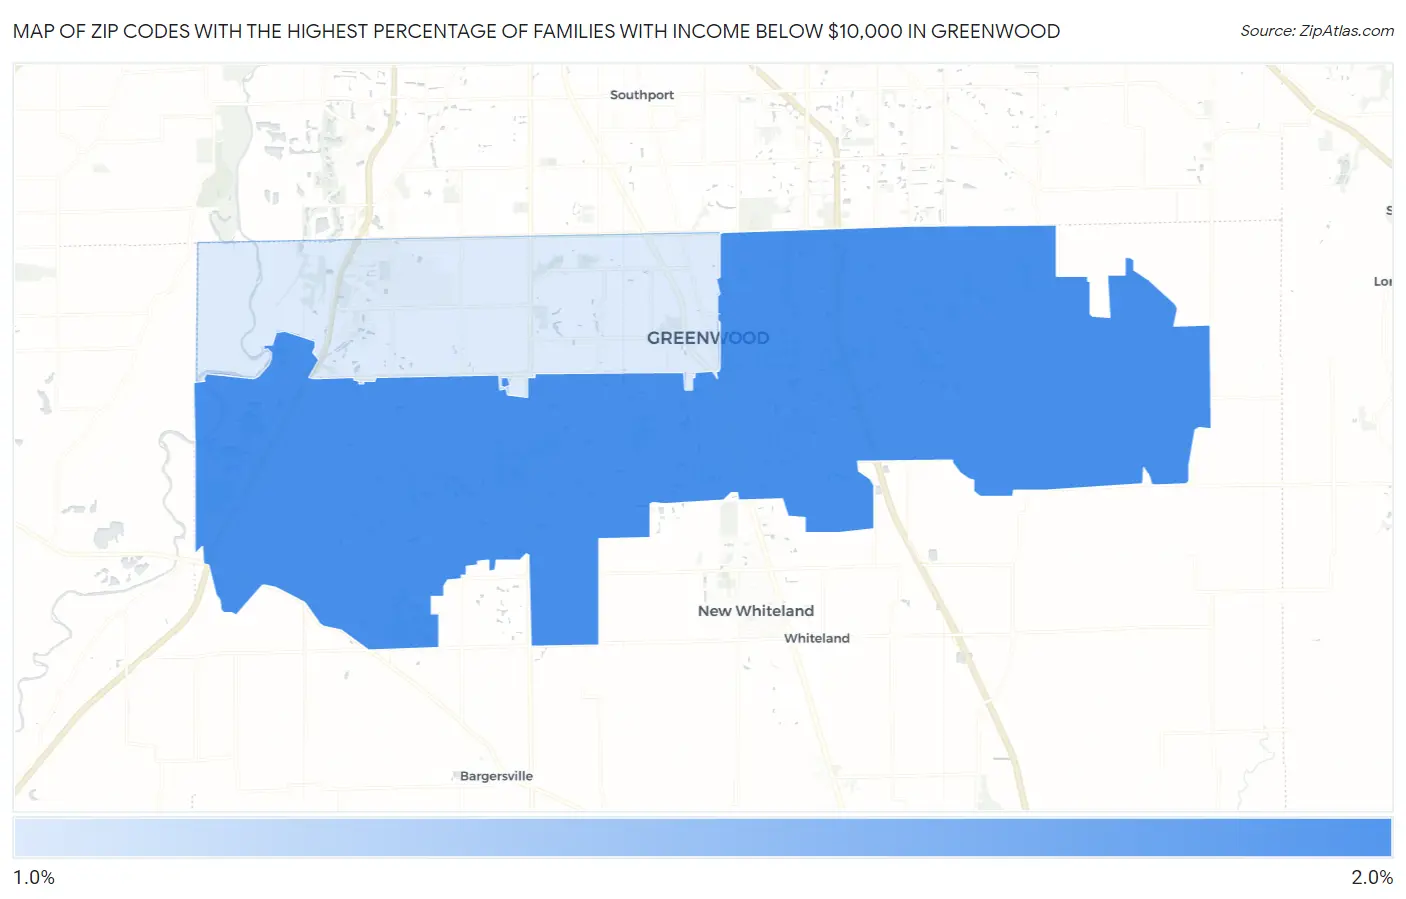
Map of Zip Codes with the Highest Percentage of Families with Income Below $10,000 in Greenwood
1.0%
1.8%
Zip Codes with the Highest Percentage of Families with Income Below $10,000 in Greenwood, IN
| Zip Code | Families with Income < $10k | vs State | vs National | |
| 1. | 46143 | 1.8% | 3.1%(-1.30)#384 | 3.1%(-1.30)#16,202 |
| 2. | 46142 | 1.0% | 3.1%(-2.10)#472 | 3.1%(-2.10)#20,238 |
1
Common Questions
What are the Top Zip Codes with the Highest Percentage of Families with Income Below $10,000 in Greenwood, IN?
Top Zip Codes with the Highest Percentage of Families with Income Below $10,000 in Greenwood, IN are:
What zip code has the Highest Percentage of Families with Income Below $10,000 in Greenwood, IN?
46143 has the Highest Percentage of Families with Income Below $10,000 in Greenwood, IN with 1.8%.
What is the Percentage of Families with Income Below $10,000 in Greenwood, IN?
Percentage of Families with Income Below $10,000 in Greenwood is 1.0%.
What is the Percentage of Families with Income Below $10,000 in Indiana?
Percentage of Families with Income Below $10,000 in Indiana is 3.1%.
What is the Percentage of Families with Income Below $10,000 in the United States?
Percentage of Families with Income Below $10,000 in the United States is 3.1%.