Zip Codes with the Highest Percentage of Population Employed in Agriculture, Fishing & Hunting in Evansville, IN
RELATED REPORTS & OPTIONS
Agriculture, Fishing & Hunting
Evansville
Compare Zip Codes
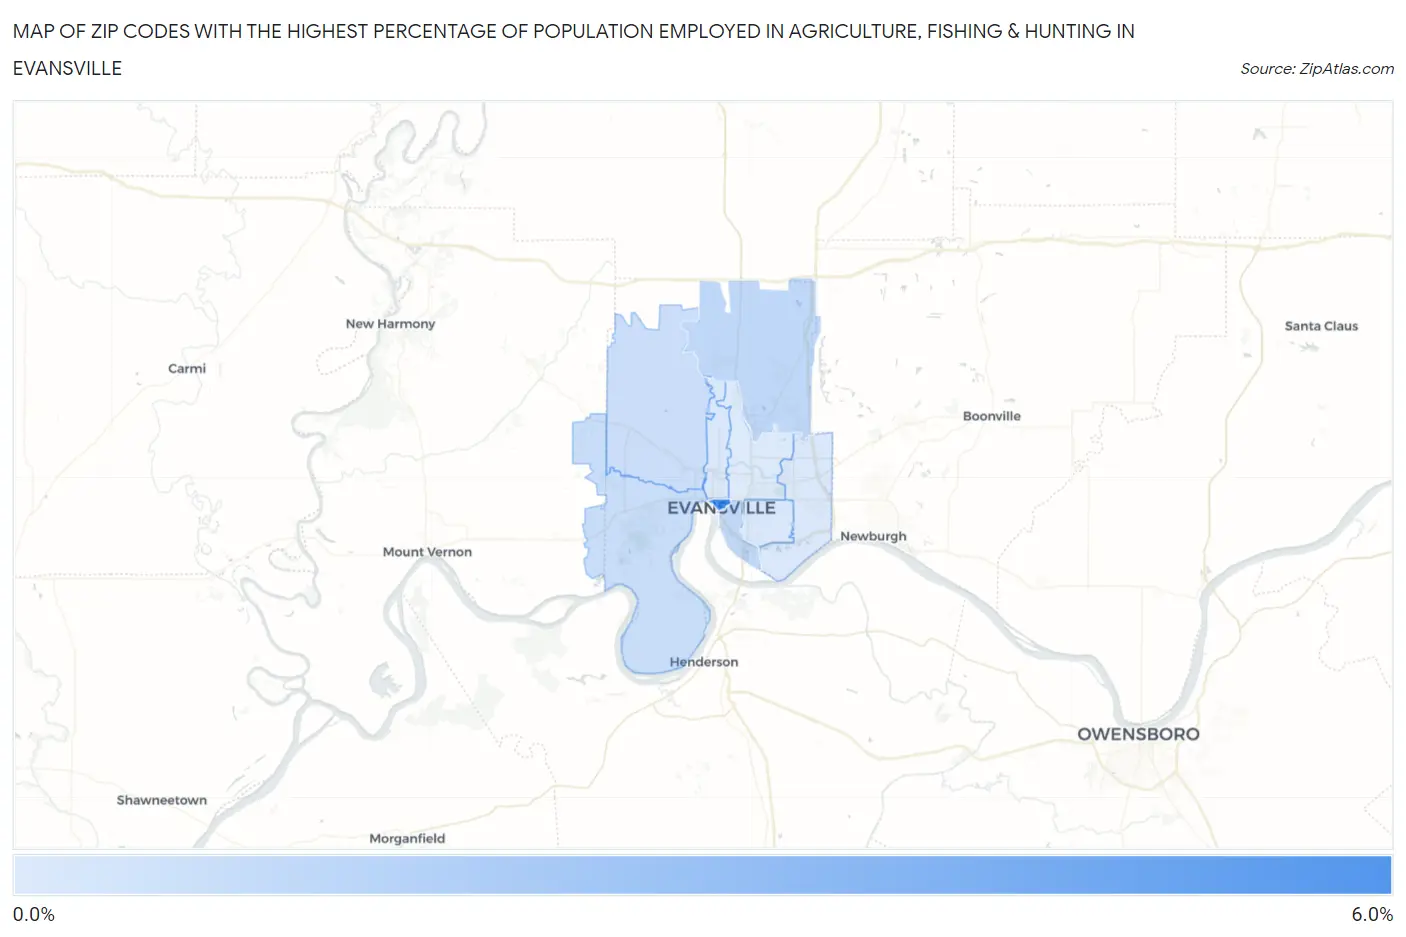
Map of Zip Codes with the Highest Percentage of Population Employed in Agriculture, Fishing & Hunting in Evansville
0.041%
5.1%
Zip Codes with the Highest Percentage of Population Employed in Agriculture, Fishing & Hunting in Evansville, IN
| Zip Code | % Employed | vs State | vs National | |
| 1. | 47708 | 5.1% | 1.1%(+4.05)#107 | 1.2%(+3.90)#7,719 |
| 2. | 47725 | 1.1% | 1.1%(+0.006)#377 | 1.2%(-0.137)#15,962 |
| 3. | 47713 | 0.99% | 1.1%(-0.063)#387 | 1.2%(-0.206)#16,257 |
| 4. | 47712 | 0.73% | 1.1%(-0.330)#424 | 1.2%(-0.473)#17,694 |
| 5. | 47720 | 0.66% | 1.1%(-0.396)#442 | 1.2%(-0.538)#18,071 |
| 6. | 47714 | 0.15% | 1.1%(-0.902)#561 | 1.2%(-1.04)#22,952 |
| 7. | 47710 | 0.13% | 1.1%(-0.926)#572 | 1.2%(-1.07)#23,266 |
| 8. | 47715 | 0.13% | 1.1%(-0.932)#577 | 1.2%(-1.07)#23,335 |
| 9. | 47711 | 0.041% | 1.1%(-1.02)#592 | 1.2%(-1.16)#24,437 |
1
Common Questions
What are the Top 5 Zip Codes with the Highest Percentage of Population Employed in Agriculture, Fishing & Hunting in Evansville, IN?
Top 5 Zip Codes with the Highest Percentage of Population Employed in Agriculture, Fishing & Hunting in Evansville, IN are:
What zip code has the Highest Percentage of Population Employed in Agriculture, Fishing & Hunting in Evansville, IN?
47708 has the Highest Percentage of Population Employed in Agriculture, Fishing & Hunting in Evansville, IN with 5.1%.
What is the Percentage of Population Employed in Agriculture, Fishing & Hunting in Evansville, IN?
Percentage of Population Employed in Agriculture, Fishing & Hunting in Evansville is 0.20%.
What is the Percentage of Population Employed in Agriculture, Fishing & Hunting in Indiana?
Percentage of Population Employed in Agriculture, Fishing & Hunting in Indiana is 1.1%.
What is the Percentage of Population Employed in Agriculture, Fishing & Hunting in the United States?
Percentage of Population Employed in Agriculture, Fishing & Hunting in the United States is 1.2%.