Zip Codes with the Highest Percentage of Immigrants from Latin America in Evansville, IN
RELATED REPORTS & OPTIONS
Latin America
Evansville
Compare Zip Codes
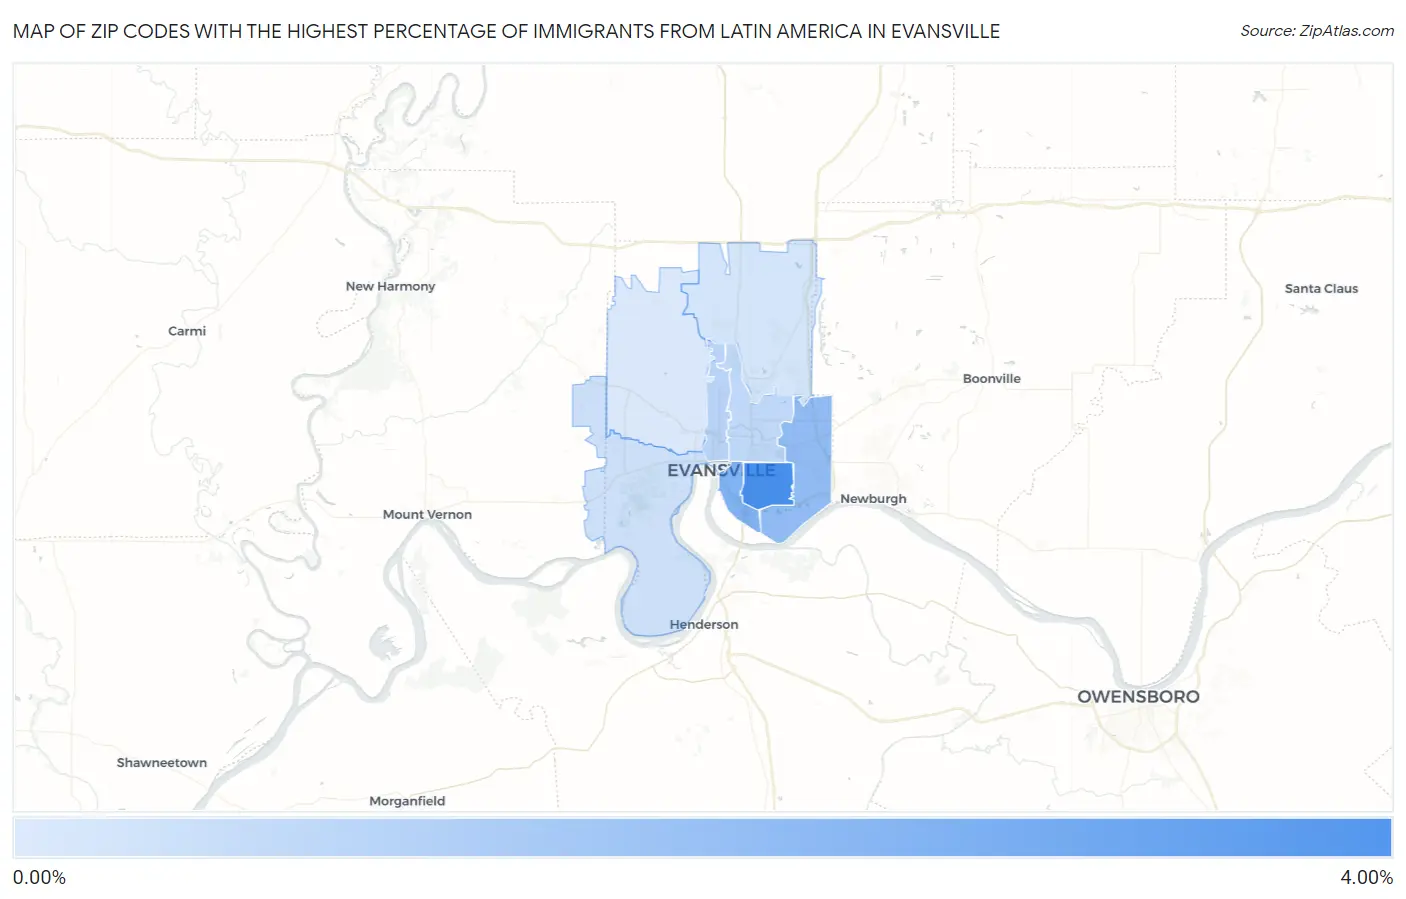
Map of Zip Codes with the Highest Percentage of Immigrants from Latin America in Evansville
0.064%
3.26%
Zip Codes with the Highest Percentage of Immigrants from Latin America in Evansville, IN
| Zip Code | Latin America | vs State | vs National | |
| 1. | 47714 | 3.26% | 2.32%(+0.943)#7 | 6.84%(-3.58)#962 |
| 2. | 47713 | 2.00% | 2.32%(-0.320)#8 | 6.84%(-4.84)#963 |
| 3. | 47715 | 1.66% | 2.32%(-0.663)#9 | 6.84%(-5.18)#1,325 |
| 4. | 47710 | 0.80% | 2.32%(-1.52)#10 | 6.84%(-6.04)#1,326 |
| 5. | 47711 | 0.62% | 2.32%(-1.70)#11 | 6.84%(-6.22)#1,327 |
| 6. | 47712 | 0.35% | 2.32%(-1.97)#12 | 6.84%(-6.49)#1,328 |
| 7. | 47725 | 0.21% | 2.32%(-2.11)#13 | 6.84%(-6.63)#1,329 |
| 8. | 47720 | 0.064% | 2.32%(-2.26)#14 | 6.84%(-6.78)#1,330 |
1
Common Questions
What are the Top 5 Zip Codes with the Highest Percentage of Immigrants from Latin America in Evansville, IN?
Top 5 Zip Codes with the Highest Percentage of Immigrants from Latin America in Evansville, IN are:
What zip code has the Highest Percentage of Immigrants from Latin America in Evansville, IN?
47714 has the Highest Percentage of Immigrants from Latin America in Evansville, IN with 3.26%.
What is the Percentage of Immigrants from Latin America in Evansville, IN?
Percentage of Immigrants from Latin America in Evansville is 1.81%.
What is the Percentage of Immigrants from Latin America in Indiana?
Percentage of Immigrants from Latin America in Indiana is 2.32%.
What is the Percentage of Immigrants from Latin America in the United States?
Percentage of Immigrants from Latin America in the United States is 6.84%.