Zip Codes with the Highest Percentage of Population Taking Taxi / Cab to Work in Evansville, IN
RELATED REPORTS & OPTIONS
Taxi / Cab
Evansville
Compare Zip Codes
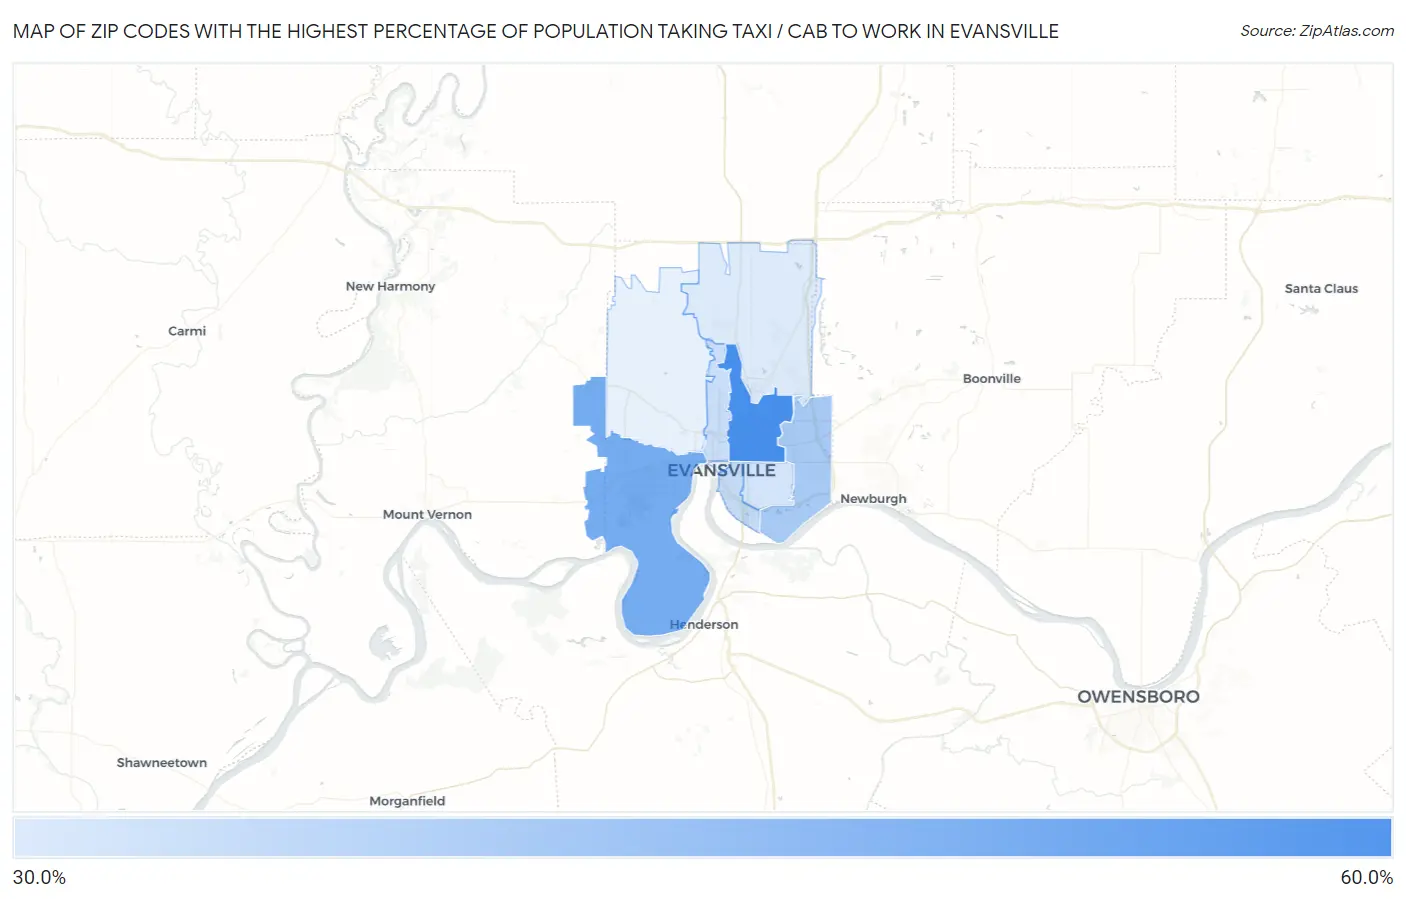
Map of Zip Codes with the Highest Percentage of Population Taking Taxi / Cab to Work in Evansville
31.4%
56.3%
Zip Codes with the Highest Percentage of Population Taking Taxi / Cab to Work in Evansville, IN
| Zip Code | % Take Taxi / Cab | vs State | vs National | |
| 1. | 47711 | 56.3% | 37.0%(+19.3)#30 | 38.2%(+18.1)#1,287 |
| 2. | 47712 | 48.3% | 37.0%(+11.3)#81 | 38.2%(+10.1)#3,501 |
| 3. | 47715 | 39.7% | 37.0%(+2.70)#143 | 38.2%(+1.50)#6,737 |
| 4. | 47713 | 34.9% | 37.0%(-2.10)#182 | 38.2%(-3.30)#8,943 |
| 5. | 47710 | 34.5% | 37.0%(-2.50)#188 | 38.2%(-3.70)#9,135 |
| 6. | 47714 | 32.9% | 37.0%(-4.10)#203 | 38.2%(-5.30)#9,789 |
| 7. | 47725 | 31.4% | 37.0%(-5.60)#212 | 38.2%(-6.80)#10,408 |
1
Common Questions
What are the Top 5 Zip Codes with the Highest Percentage of Population Taking Taxi / Cab to Work in Evansville, IN?
Top 5 Zip Codes with the Highest Percentage of Population Taking Taxi / Cab to Work in Evansville, IN are:
What zip code has the Highest Percentage of Population Taking Taxi / Cab to Work in Evansville, IN?
47711 has the Highest Percentage of Population Taking Taxi / Cab to Work in Evansville, IN with 56.3%.
What is the Percentage of Population Taking Taxi / Cab to Work in Evansville, IN?
Percentage of Population Taking Taxi / Cab to Work in Evansville is 39.4%.
What is the Percentage of Population Taking Taxi / Cab to Work in Indiana?
Percentage of Population Taking Taxi / Cab to Work in Indiana is 37.0%.
What is the Percentage of Population Taking Taxi / Cab to Work in the United States?
Percentage of Population Taking Taxi / Cab to Work in the United States is 38.2%.