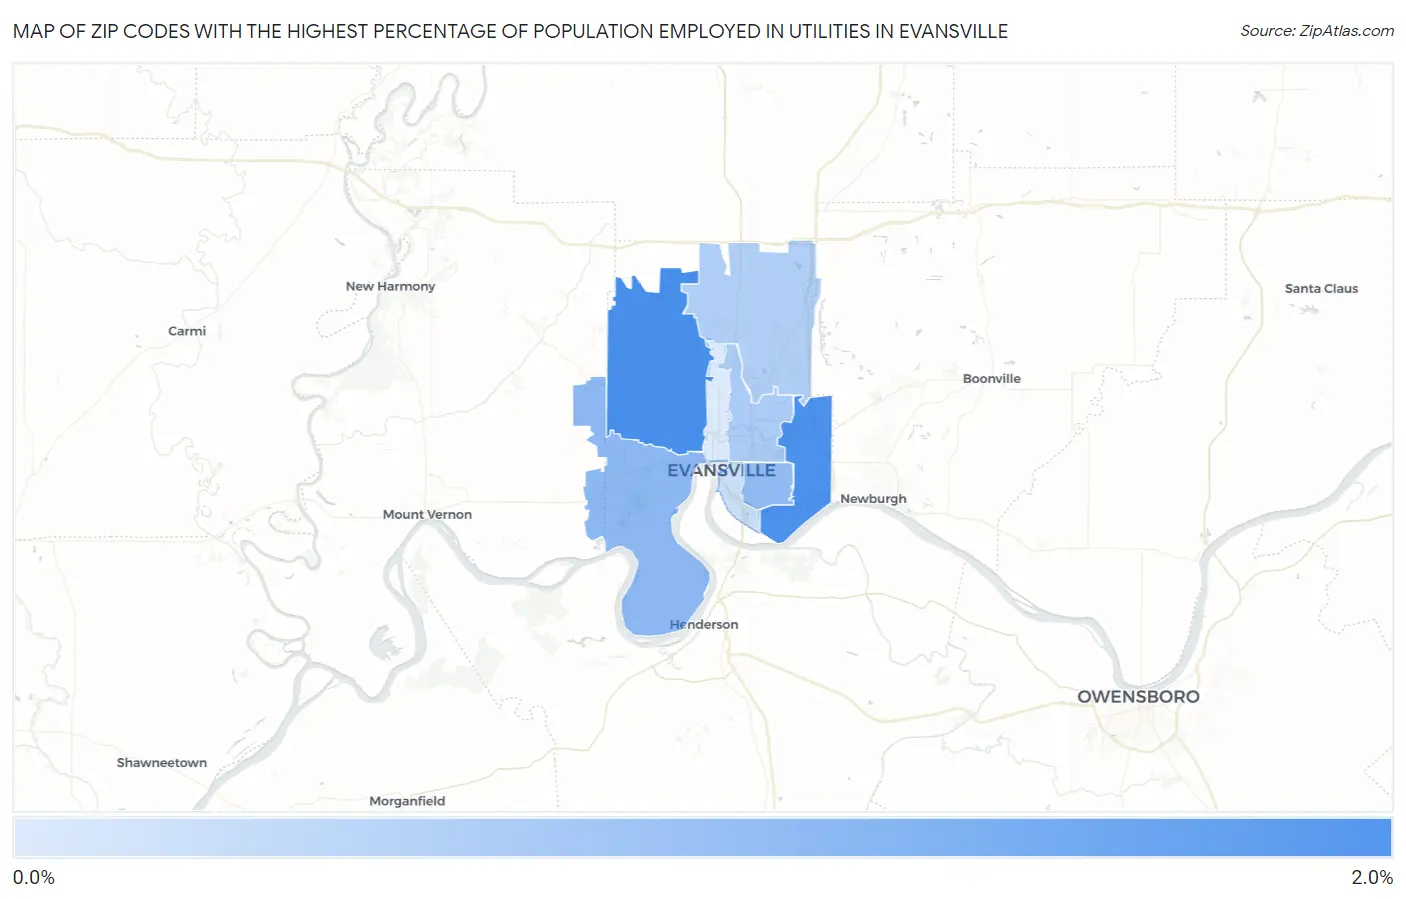
Zip Codes with the Highest Percentage of Population Employed in Utilities in Evansville, IN
RELATED REPORTS & OPTIONS
Utilities
Evansville
Compare Zip Codes
Map of Zip Codes with the Highest Percentage of Population Employed in Utilities in Evansville
0.31%
1.7%

Zip Codes with the Highest Percentage of Population Employed in Utilities in Evansville, IN
| Zip Code | % Employed | vs State | vs National | |
| 1. | 47720 | 1.7% | 0.79%(+0.869)#113 | 0.84%(+0.822)#6,082 |
| 2. | 47715 | 1.6% | 0.79%(+0.834)#118 | 0.84%(+0.787)#6,232 |
| 3. | 47712 | 1.0% | 0.79%(+0.238)#216 | 0.84%(+0.191)#10,081 |
| 4. | 47714 | 0.99% | 0.79%(+0.203)#229 | 0.84%(+0.156)#10,410 |
| 5. | 47711 | 0.76% | 0.79%(-0.027)#282 | 0.84%(-0.074)#12,778 |
| 6. | 47725 | 0.71% | 0.79%(-0.079)#295 | 0.84%(-0.126)#13,366 |
| 7. | 47713 | 0.45% | 0.79%(-0.343)#386 | 0.84%(-0.390)#16,888 |
| 8. | 47710 | 0.31% | 0.79%(-0.480)#437 | 0.84%(-0.527)#18,847 |
1
Common Questions
What are the Top 5 Zip Codes with the Highest Percentage of Population Employed in Utilities in Evansville, IN?
Top 5 Zip Codes with the Highest Percentage of Population Employed in Utilities in Evansville, IN are:
What zip code has the Highest Percentage of Population Employed in Utilities in Evansville, IN?
47720 has the Highest Percentage of Population Employed in Utilities in Evansville, IN with 1.7%.
What is the Percentage of Population Employed in Utilities in Evansville, IN?
Percentage of Population Employed in Utilities in Evansville is 0.91%.
What is the Percentage of Population Employed in Utilities in Indiana?
Percentage of Population Employed in Utilities in Indiana is 0.79%.
What is the Percentage of Population Employed in Utilities in the United States?
Percentage of Population Employed in Utilities in the United States is 0.84%.