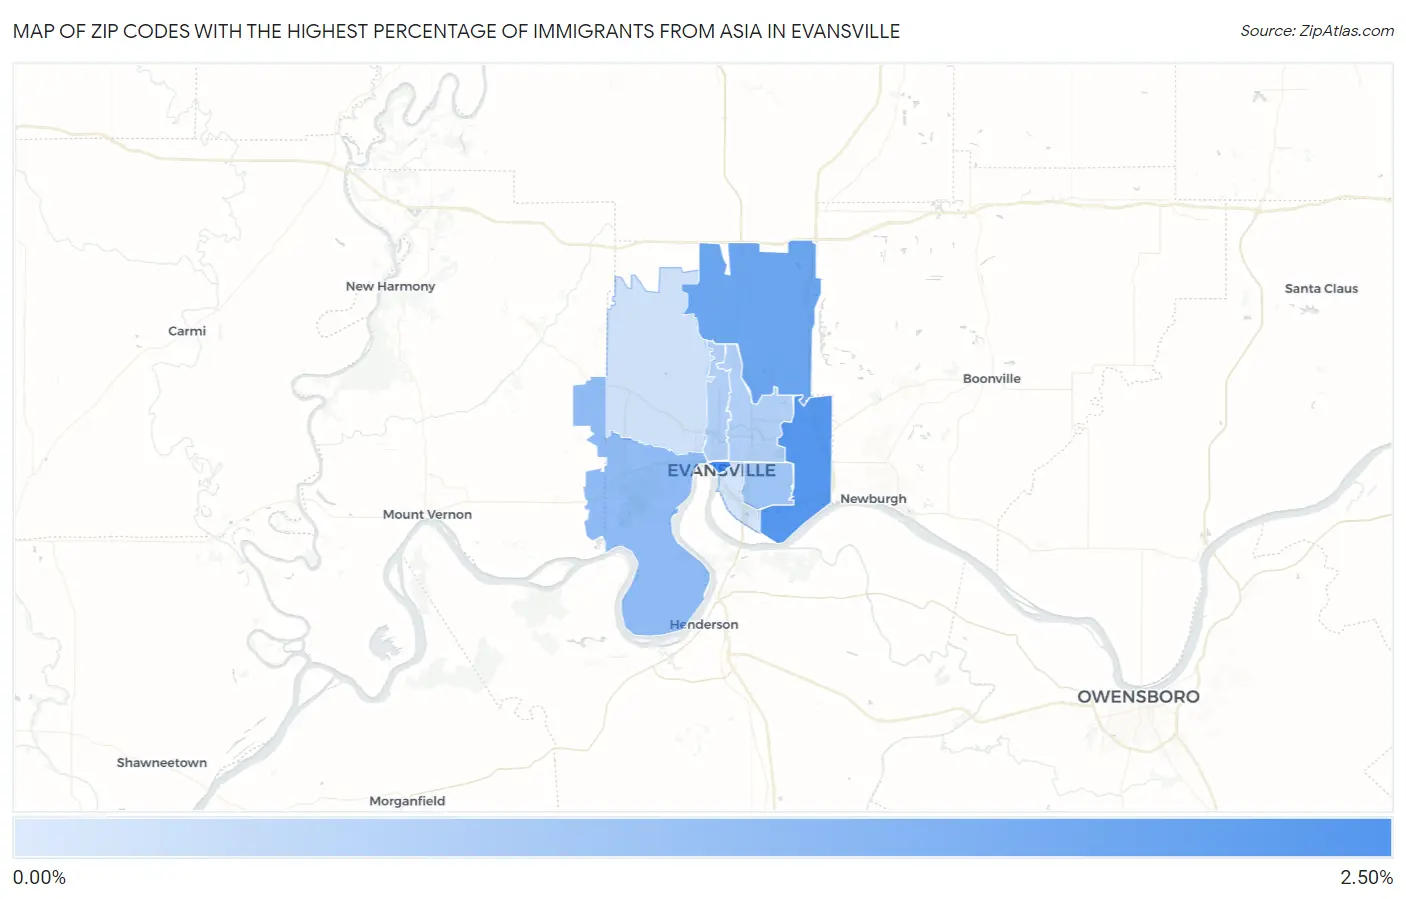
Zip Codes with the Highest Percentage of Immigrants from Asia in Evansville, IN
RELATED REPORTS & OPTIONS
Asia
Evansville
Compare Zip Codes
Map of Zip Codes with the Highest Percentage of Immigrants from Asia in Evansville
0.15%
2.35%

Zip Codes with the Highest Percentage of Immigrants from Asia in Evansville, IN
| Zip Code | Asia | vs State | vs National | |
| 1. | 47708 | 2.35% | 1.94%(+0.412)#73 | 4.26%(-1.91)#6,033 |
| 2. | 47715 | 2.13% | 1.94%(+0.192)#82 | 4.26%(-2.13)#6,491 |
| 3. | 47725 | 1.78% | 1.94%(-0.159)#96 | 4.26%(-2.48)#7,409 |
| 4. | 47712 | 1.23% | 1.94%(-0.712)#130 | 4.26%(-3.03)#9,271 |
| 5. | 47714 | 0.98% | 1.94%(-0.961)#159 | 4.26%(-3.28)#10,476 |
| 6. | 47711 | 0.68% | 1.94%(-1.26)#216 | 4.26%(-3.58)#12,319 |
| 7. | 47710 | 0.67% | 1.94%(-1.27)#218 | 4.26%(-3.59)#12,431 |
| 8. | 47720 | 0.20% | 1.94%(-1.73)#349 | 4.26%(-4.06)#17,023 |
| 9. | 47713 | 0.15% | 1.94%(-1.79)#368 | 4.26%(-4.11)#17,803 |
1
Common Questions
What are the Top 5 Zip Codes with the Highest Percentage of Immigrants from Asia in Evansville, IN?
Top 5 Zip Codes with the Highest Percentage of Immigrants from Asia in Evansville, IN are:
What zip code has the Highest Percentage of Immigrants from Asia in Evansville, IN?
47708 has the Highest Percentage of Immigrants from Asia in Evansville, IN with 2.35%.
What is the Percentage of Immigrants from Asia in Evansville, IN?
Percentage of Immigrants from Asia in Evansville is 1.06%.
What is the Percentage of Immigrants from Asia in Indiana?
Percentage of Immigrants from Asia in Indiana is 1.94%.
What is the Percentage of Immigrants from Asia in the United States?
Percentage of Immigrants from Asia in the United States is 4.26%.