Zip Codes with the Highest Percentage of Immigrants from Eastern Asia in Evansville, IN
RELATED REPORTS & OPTIONS
Eastern Asia
Evansville
Compare Zip Codes
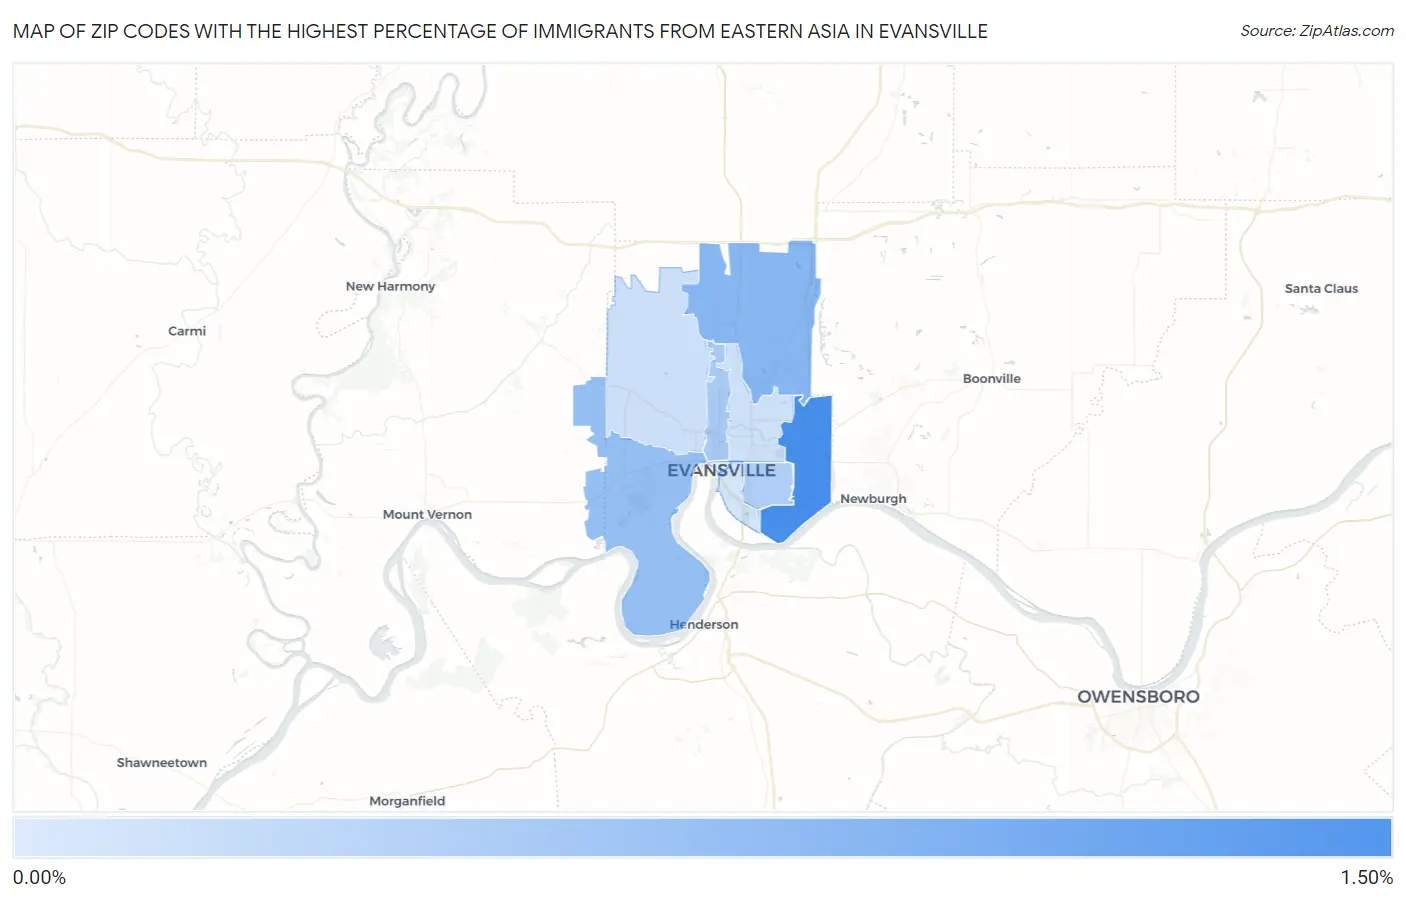
Map of Zip Codes with the Highest Percentage of Immigrants from Eastern Asia in Evansville
0.063%
1.24%
Zip Codes with the Highest Percentage of Immigrants from Eastern Asia in Evansville, IN
| Zip Code | Eastern Asia | vs State | vs National | |
| 1. | 47715 | 1.24% | 0.52%(+0.724)#35 | 1.28%(-0.033)#3,181 |
| 2. | 47725 | 0.71% | 0.52%(+0.196)#66 | 1.28%(-0.561)#5,150 |
| 3. | 47712 | 0.59% | 0.52%(+0.068)#85 | 1.28%(-0.689)#5,918 |
| 4. | 47710 | 0.45% | 0.52%(-0.073)#111 | 1.28%(-0.829)#7,087 |
| 5. | 47714 | 0.37% | 0.52%(-0.150)#135 | 1.28%(-0.906)#7,927 |
| 6. | 47720 | 0.13% | 0.52%(-0.391)#220 | 1.28%(-1.15)#11,602 |
| 7. | 47711 | 0.12% | 0.52%(-0.400)#228 | 1.28%(-1.16)#11,777 |
| 8. | 47713 | 0.063% | 0.52%(-0.456)#261 | 1.28%(-1.21)#12,982 |
1
Common Questions
What are the Top 5 Zip Codes with the Highest Percentage of Immigrants from Eastern Asia in Evansville, IN?
Top 5 Zip Codes with the Highest Percentage of Immigrants from Eastern Asia in Evansville, IN are:
What zip code has the Highest Percentage of Immigrants from Eastern Asia in Evansville, IN?
47715 has the Highest Percentage of Immigrants from Eastern Asia in Evansville, IN with 1.24%.
What is the Percentage of Immigrants from Eastern Asia in Evansville, IN?
Percentage of Immigrants from Eastern Asia in Evansville is 0.56%.
What is the Percentage of Immigrants from Eastern Asia in Indiana?
Percentage of Immigrants from Eastern Asia in Indiana is 0.52%.
What is the Percentage of Immigrants from Eastern Asia in the United States?
Percentage of Immigrants from Eastern Asia in the United States is 1.28%.