Zip Codes with the Highest Percentage of Population with a Degree in Visual and Performing Arts in Schaumburg, IL
RELATED REPORTS & OPTIONS
Visual and Performing Arts
Schaumburg
Compare Zip Codes
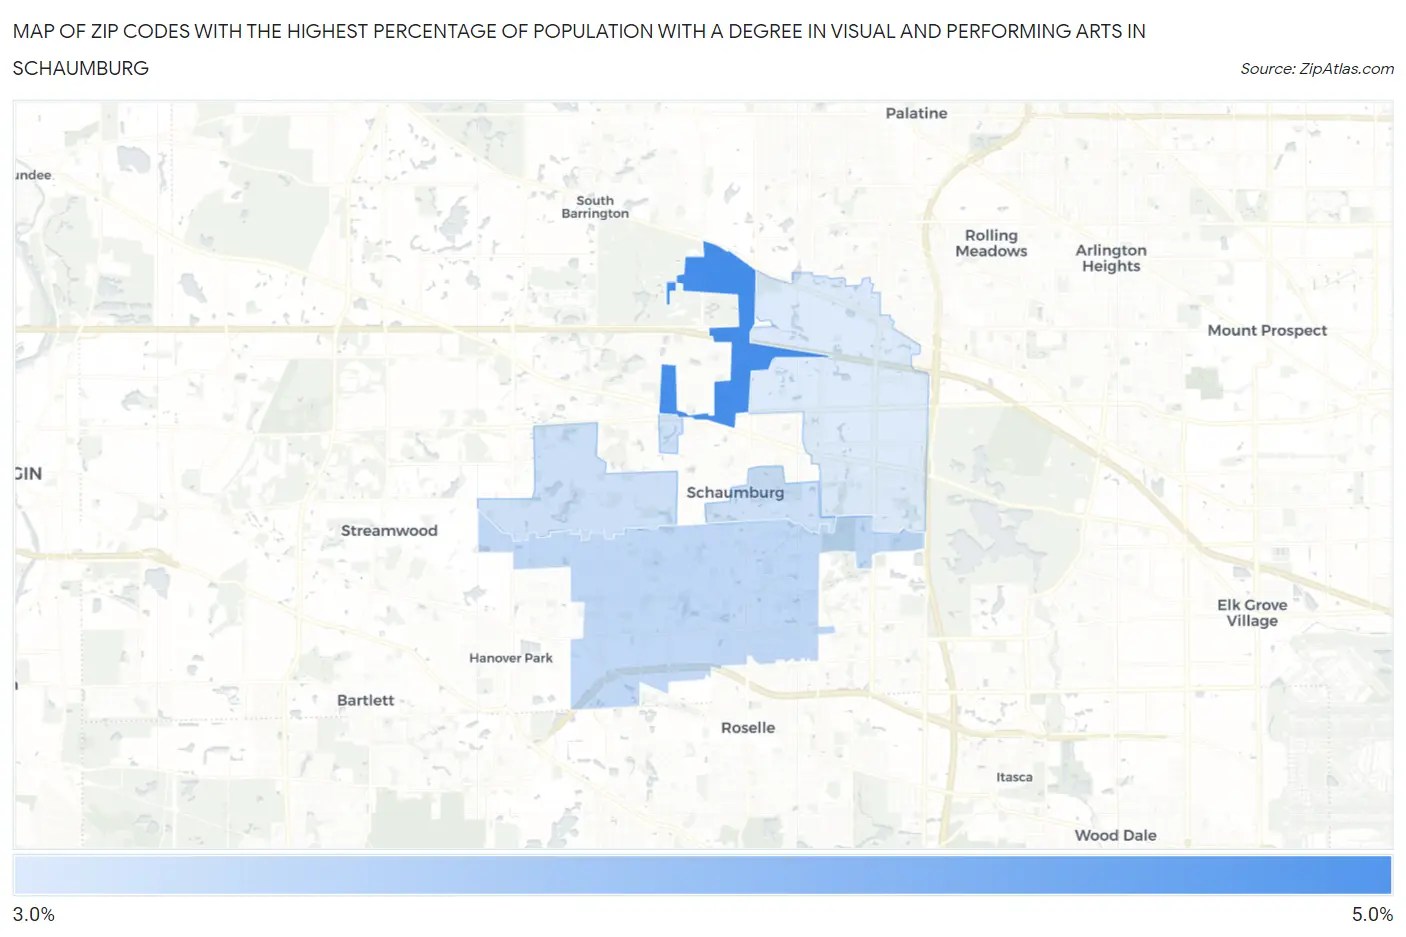
Map of Zip Codes with the Highest Percentage of Population with a Degree in Visual and Performing Arts in Schaumburg
3.1%
4.6%
Zip Codes with the Highest Percentage of Population with a Degree in Visual and Performing Arts in Schaumburg, IL
| Zip Code | % Graduates | vs State | vs National | |
| 1. | 60195 | 4.6% | 4.4%(+0.199)#286 | 4.3%(+0.396)#7,422 |
| 2. | 60193 | 3.4% | 4.4%(-1.04)#448 | 4.3%(-0.841)#11,212 |
| 3. | 60194 | 3.3% | 4.4%(-1.18)#473 | 4.3%(-0.982)#11,724 |
| 4. | 60173 | 3.1% | 4.4%(-1.33)#496 | 4.3%(-1.13)#12,263 |
1
Common Questions
What are the Top 3 Zip Codes with the Highest Percentage of Population with a Degree in Visual and Performing Arts in Schaumburg, IL?
Top 3 Zip Codes with the Highest Percentage of Population with a Degree in Visual and Performing Arts in Schaumburg, IL are:
What zip code has the Highest Percentage of Population with a Degree in Visual and Performing Arts in Schaumburg, IL?
60195 has the Highest Percentage of Population with a Degree in Visual and Performing Arts in Schaumburg, IL with 4.6%.
What is the Percentage of Population with a Degree in Visual and Performing Arts in Schaumburg, IL?
Percentage of Population with a Degree in Visual and Performing Arts in Schaumburg is 3.2%.
What is the Percentage of Population with a Degree in Visual and Performing Arts in Illinois?
Percentage of Population with a Degree in Visual and Performing Arts in Illinois is 4.4%.
What is the Percentage of Population with a Degree in Visual and Performing Arts in the United States?
Percentage of Population with a Degree in Visual and Performing Arts in the United States is 4.3%.