Zip Codes with the Highest Percentage of Immigrants from Eastern Asia in Schaumburg, IL
RELATED REPORTS & OPTIONS
Eastern Asia
Schaumburg
Compare Zip Codes
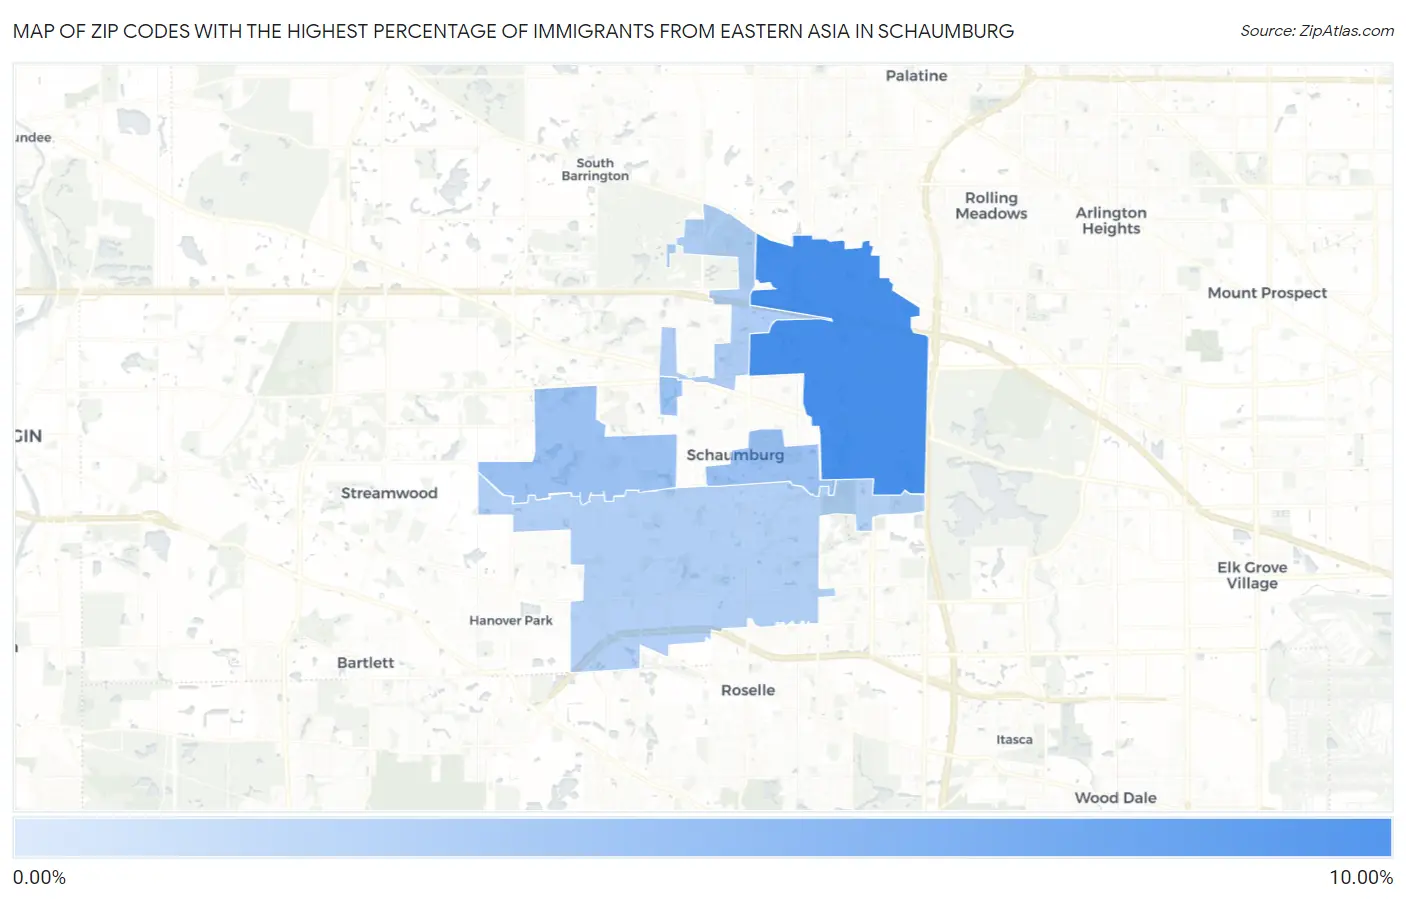
Map of Zip Codes with the Highest Percentage of Immigrants from Eastern Asia in Schaumburg
2.55%
9.57%
Zip Codes with the Highest Percentage of Immigrants from Eastern Asia in Schaumburg, IL
| Zip Code | Eastern Asia | vs State | vs National | |
| 1. | 60173 | 9.57% | 1.12% (+8.45)#5 | 1.28% (+8.29)#277 |
| 2. | 60194 | 4.01% | 1.12% (+2.88)#32 | 1.28% (+2.73)#962 |
| 3. | 60195 | 2.91% | 1.12% (+1.79)#53 | 1.28% (+1.63)#1,362 |
| 4. | 60193 | 2.55% | 1.12% (+1.43)#61 | 1.28% (+1.27)#1,566 |
1
Common Questions
What are the Top 3 Zip Codes with the Highest Percentage of Immigrants from Eastern Asia in Schaumburg, IL?
Top 3 Zip Codes with the Highest Percentage of Immigrants from Eastern Asia in Schaumburg, IL are:
What zip code has the Highest Percentage of Immigrants from Eastern Asia in Schaumburg, IL?
60173 has the Highest Percentage of Immigrants from Eastern Asia in Schaumburg, IL with 9.57%.
What is the Percentage of Immigrants from Eastern Asia in Schaumburg, IL?
Percentage of Immigrants from Eastern Asia in Schaumburg is 4.22%.
What is the Percentage of Immigrants from Eastern Asia in Illinois?
Percentage of Immigrants from Eastern Asia in Illinois is 1.12%.
What is the Percentage of Immigrants from Eastern Asia in the United States?
Percentage of Immigrants from Eastern Asia in the United States is 1.28%.